Embed Size (px)
Citation preview
Lutsel K’e Dene School
Where we are:1. The Successes – our student achievement data2. The Challenges –
attendance & participation3. Enrollment and the
School Retrofit
Leadership for Literacy Initiative
• Started 2006• 2009 Excellence in Education Award for our
Results• 2012 Governor-General of Canada mentions
Lutsel K’e and the excellent growth in literacy skills
• 2012: Aboriginal Success Initiative – GNWT sees the potential of the SSDEC L4L, the importance of pre-school and daycare in improving education
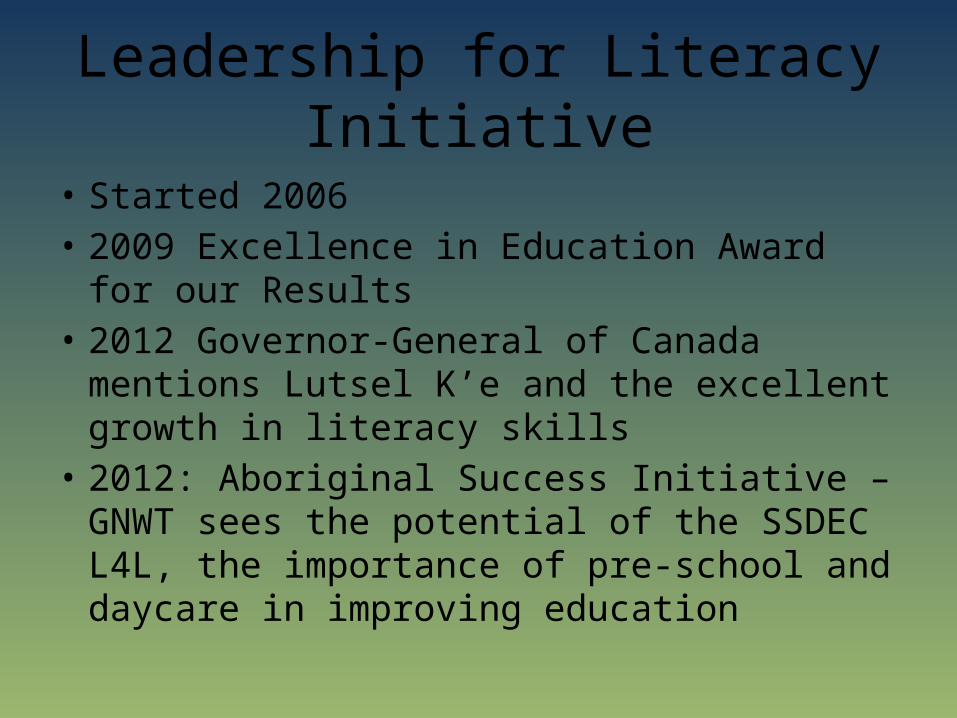
AAT Gr. 3
2004 2005 2006 2007 2008 2009 2010 2011 2012
0
10
20
30
40
50
60
70
80
90
100
Lutsel K'e - Grade 3 – 100% participation rate
Language Arts Math
Goal
Pe
rce
nta
ge
of
Stu
de
nts
at
Ac
ce
pta
ble
Sta
nd
ard
2003 2004 2005 2006 2007 2008 2009 2010 2011 2012 5 Year AverageWriting 62.5% 33.3% 100.0% 33.3% 50.0% 20.0% 40.0% 53.8% 100.0% 100.0% 62.8%Reading 0.0% 50.0% 40.0% 0.0% 0.0% 0.0% 40.0% 53.8% 100.0% 66.7% 52.1%Math 25.0% 33.3% 20.0% 0.0% 25.0% 0.0 20.0% 50.0% 0.0% 66.7% 27.3%
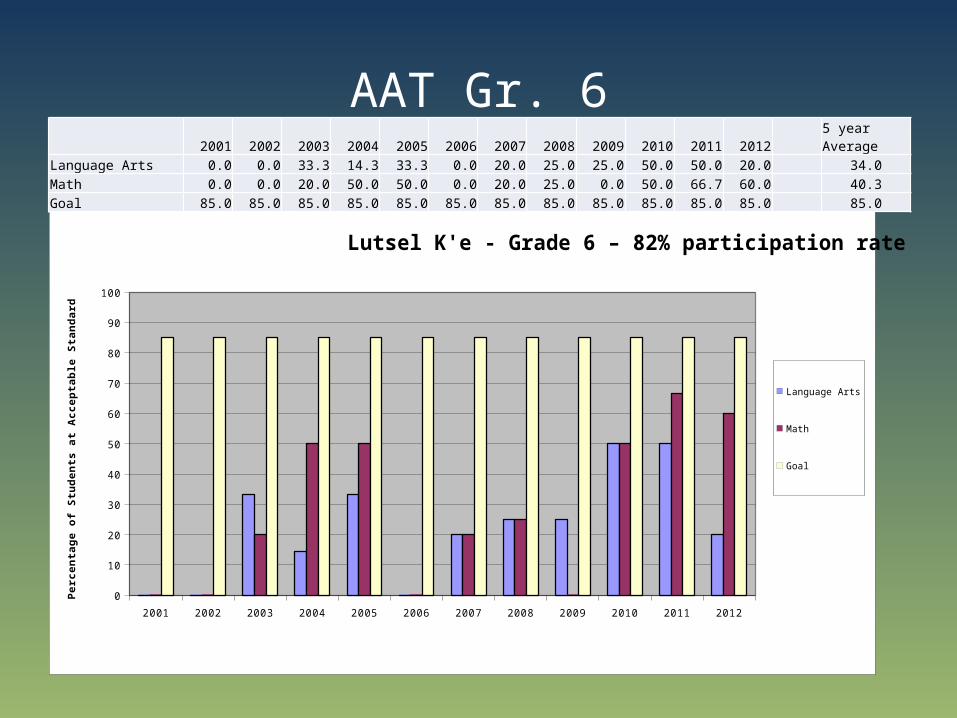
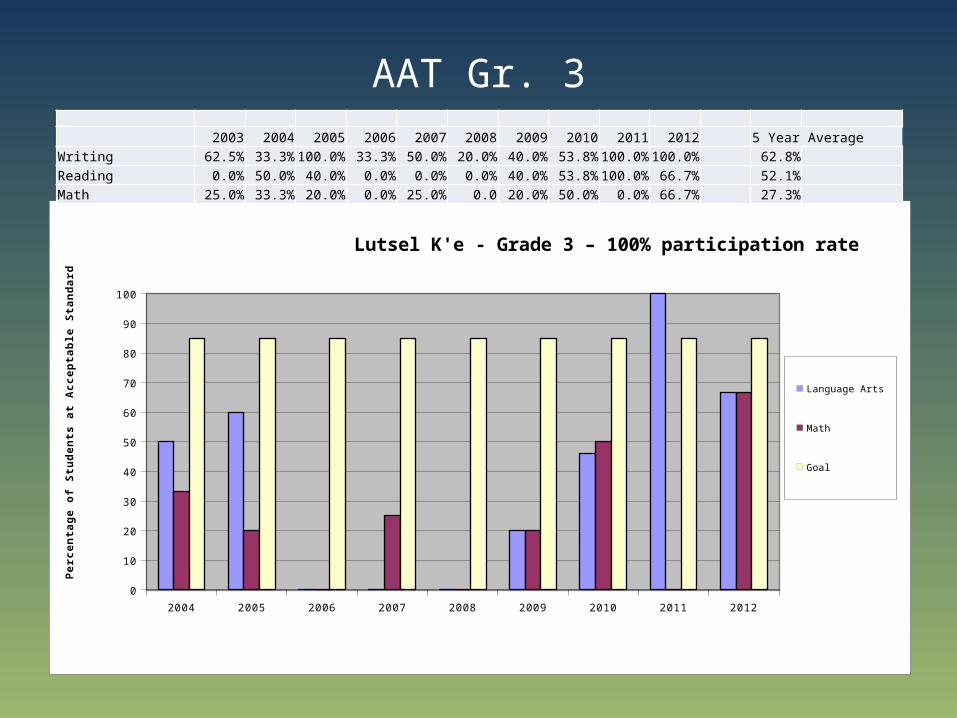
AAT Gr. 6
2001 2002 2003 2004 2005 2006 2007 2008 2009 2010 2011 2012
0
10
20
30
40
50
60
70
80
90
100
Lutsel K'e - Grade 6 – 82% participation rate
Language Arts
Math
Goal
Pe
rce
nta
ge
of
Stu
de
nts
at
Ac
ce
pta
ble
Sta
nd
ard
2001 2002 2003 2004 2005 2006 2007 2008 2009 2010 2011 2012 5 year AverageLanguage Arts 0.0 0.0 33.3 14.3 33.3 0.0 20.0 25.0 25.0 50.0 50.0 20.0 34.0Math 0.0 0.0 20.0 50.0 50.0 0.0 20.0 25.0 0.0 50.0 66.7 60.0 40.3Goal 85.0 85.0 85.0 85.0 85.0 85.0 85.0 85.0 85.0 85.0 85.0 85.0 85.0
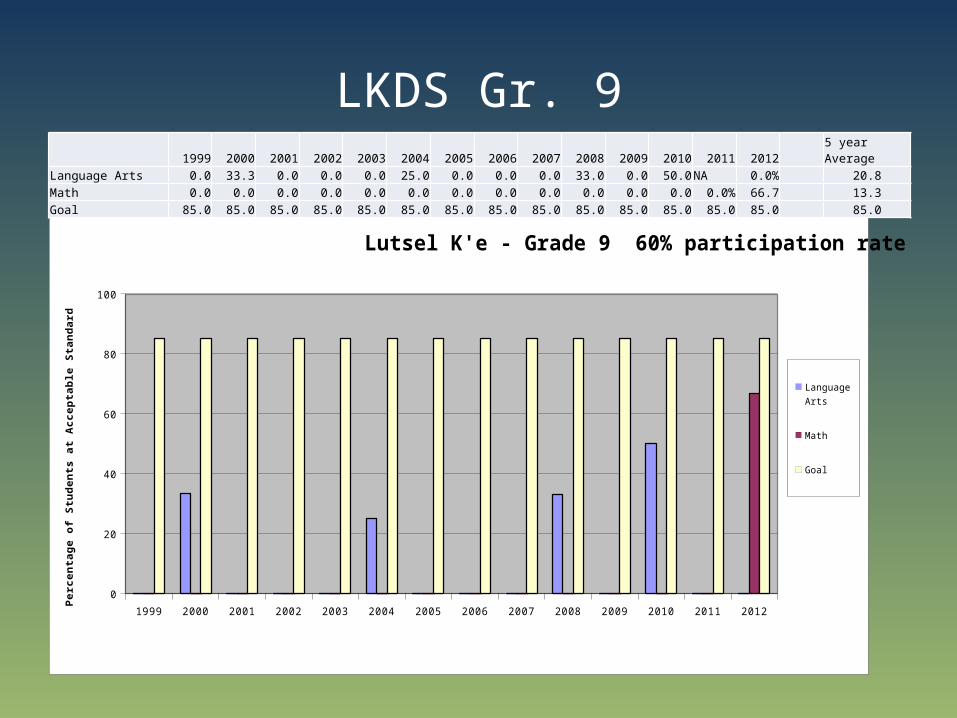
LKDS Gr. 9
1999 2000 2001 2002 2003 2004 2005 2006 2007 2008 2009 2010 2011 2012
0
20
40
60
80
100
Lutsel K'e - Grade 9 60% participation rate
Language Arts
Math
Goal
Pe
rce
nta
ge
of
Stu
de
nts
at
Ac
ce
pta
ble
Sta
nd
ard
1999 2000 2001 2002 2003 2004 2005 2006 2007 2008 2009 2010 2011 2012 5 year AverageLanguage Arts 0.0 33.3 0.0 0.0 0.0 25.0 0.0 0.0 0.0 33.0 0.0 50.0 NA 0.0% 20.8Math 0.0 0.0 0.0 0.0 0.0 0.0 0.0 0.0 0.0 0.0 0.0 0.0 0.0% 66.7 13.3Goal 85.0 85.0 85.0 85.0 85.0 85.0 85.0 85.0 85.0 85.0 85.0 85.0 85.0 85.0 85.0
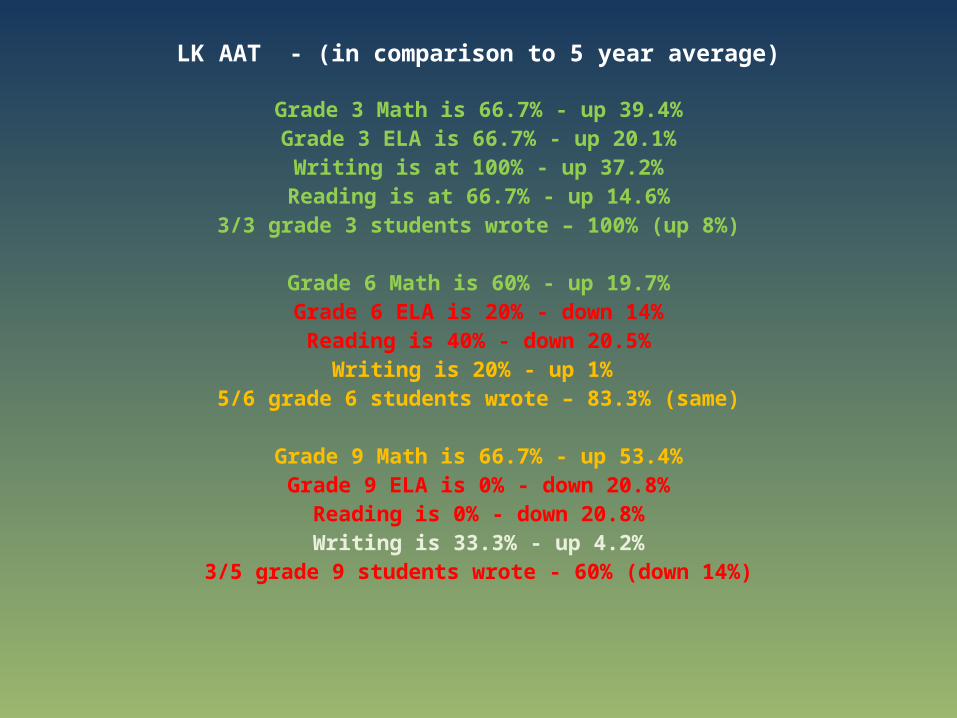
LK AAT - (in comparison to 5 year average)
Grade 3 Math is 66.7% - up 39.4%Grade 3 ELA is 66.7% - up 20.1%
Writing is at 100% - up 37.2%Reading is at 66.7% - up 14.6%
3/3 grade 3 students wrote – 100% (up 8%)
Grade 6 Math is 60% - up 19.7%Grade 6 ELA is 20% - down 14%Reading is 40% - down 20.5%
Writing is 20% - up 1% 5/6 grade 6 students wrote – 83.3% (same)
Grade 9 Math is 66.7% - up 53.4%
Grade 9 ELA is 0% - down 20.8%Reading is 0% - down 20.8%Writing is 33.3% - up 4.2%
3/5 grade 9 students wrote - 60% (down 14%)
very
poo
r - 1
poor
- 2
cons
idera
bly b
elow a
vera
ge -
3
low a
vera
ge -
4
aver
age
- 5
high
aver
age
- 6
cons
idera
bly a
bove
ave
rage
- 7
supe
rior -
8
very
sup
erior
- 9
0%
5%
10%
15%
20%
25%
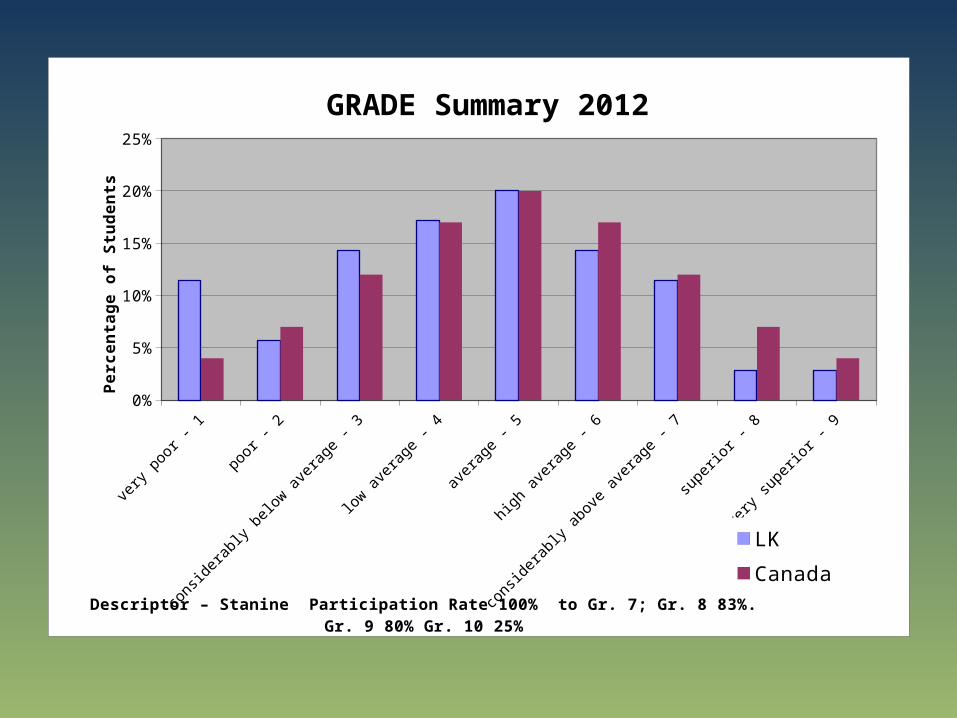
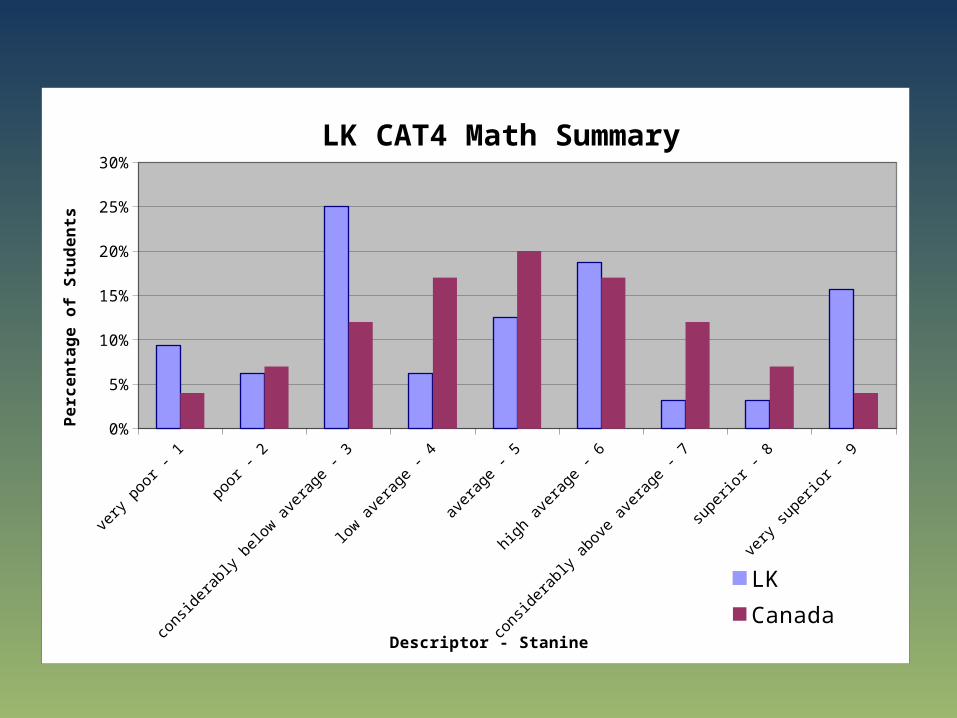
GRADE Summary 2012
LK
CanadaDescriptor – Stanine Participation Rate 100% to Gr. 7; Gr. 8 83%. Gr. 9 80% Gr. 10 25%
Pe
rce
nta
ge
of
Stu
de
nts

Canada
2007
2008
2009
2010
2011
2012
2013
0% 10% 20% 30% 40% 50% 60% 70% 80% 90% 100%
77%
19%
18%
30%
40%
57%
69%
0%
% of Lutsel K'e Students Achieving a Reading Score of Average or BetterStudents Who Wrote in Multiple Years
GRADE SummaryGRADE Summary GRADE 2012 Summary

Canada
2007
2008
2009
2010
2011
2012
2013
0.0% 10.0% 20.0% 30.0% 40.0% 50.0% 60.0% 70.0% 80.0% 90.0% 100.0%
23%
0%
0%
9%
5%
30%
17%
0%
% of Lutsel K'e Students Achieving a Reading Score Considerably Above Average or SuperiorStudents Who Wrote in Multiple Years
GRADE SummaryGRADE Summary GRADE Summary
very
poo
r - 1
poor
- 2
cons
idera
bly b
elow a
vera
ge -
3
low a
vera
ge -
4
aver
age
- 5
high
aver
age
- 6
cons
idera
bly a
bove
ave
rage
- 7
supe
rior -
8
very
sup
erior
- 9
0%
5%
10%
15%
20%
25%
30%
LK CAT4 Math Summary
LK
CanadaDescriptor - Stanine
Pe
rce
nta
ge
of
Stu
de
nts

Canada
2012
2013
2014
2015
2016
2017
2018
0% 10% 20% 30% 40% 50% 60% 70% 80% 90% 100%
77%
59%
0%
0%
0%
0%
0%
0%
% of Lutsel K'e Students Achieving a Math Score of Average or Better(Participation rate just under 50%)
GRADE SummaryGRADE Summary LK CAT4 Math Summary

Canada
2012
2013
2014
2015
2016
2017
2018
0% 10% 20% 30% 40% 50% 60% 70% 80% 90% 100%
23%
22%
0%
0%
0%
0%
0%
0%
% of Lutsel K'e Students Achieving a Math Score Considerably Above Av-erage or Superior – Participation rate 49% approx
GRADE SummaryGRADE Summary LK CAT4 Math Sum-mary
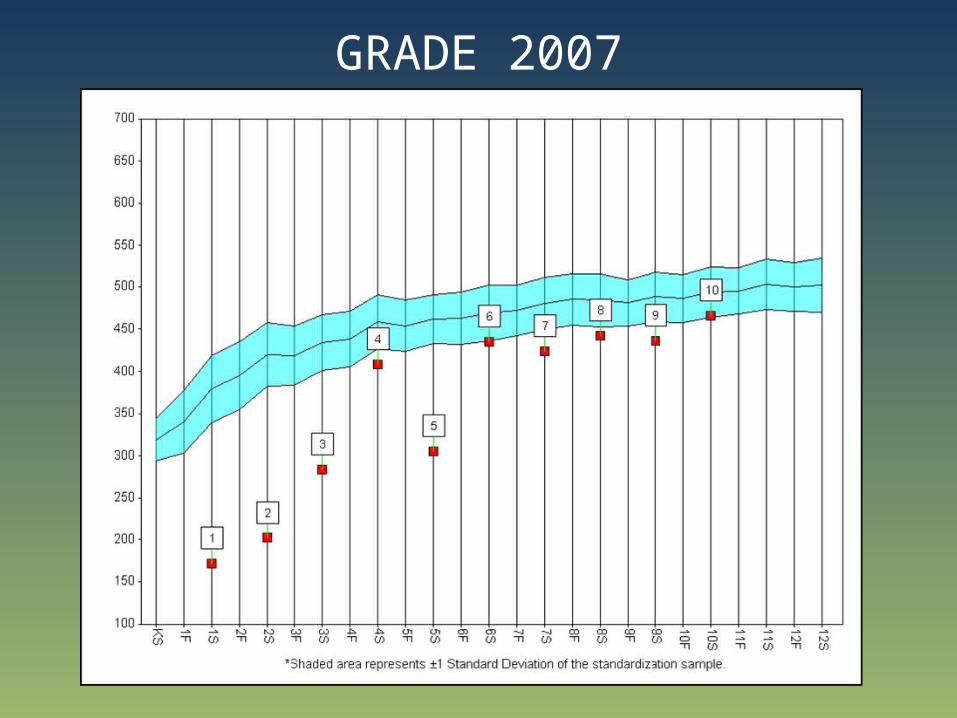
GRADE 2007
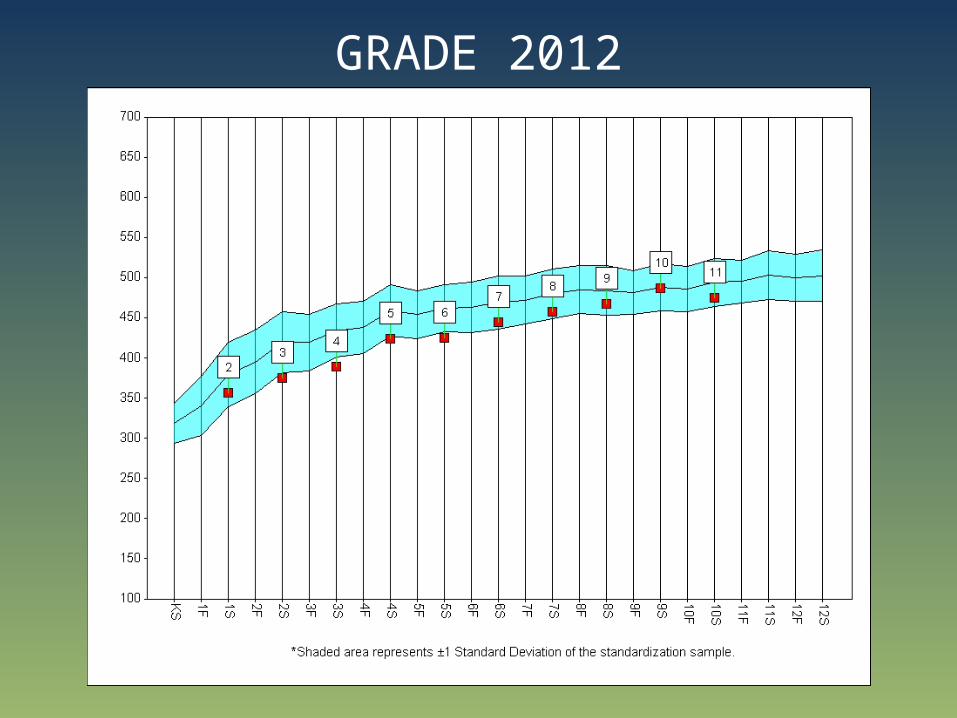
GRADE 2012
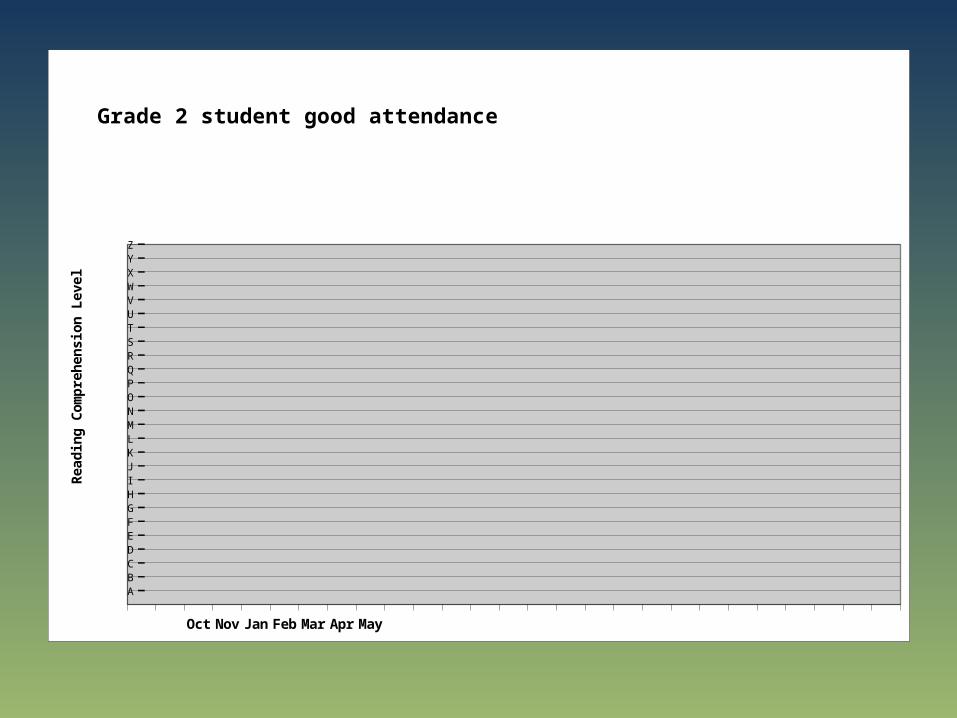
Attendance and Reading Levels
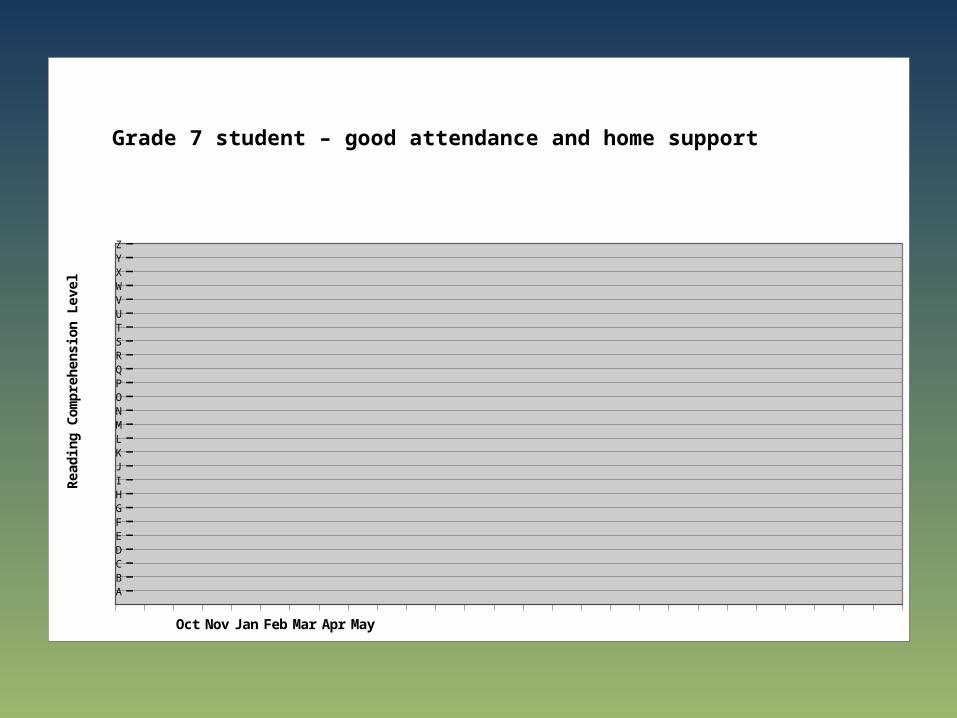
• Attendance = school success • Home reading and parent support is as
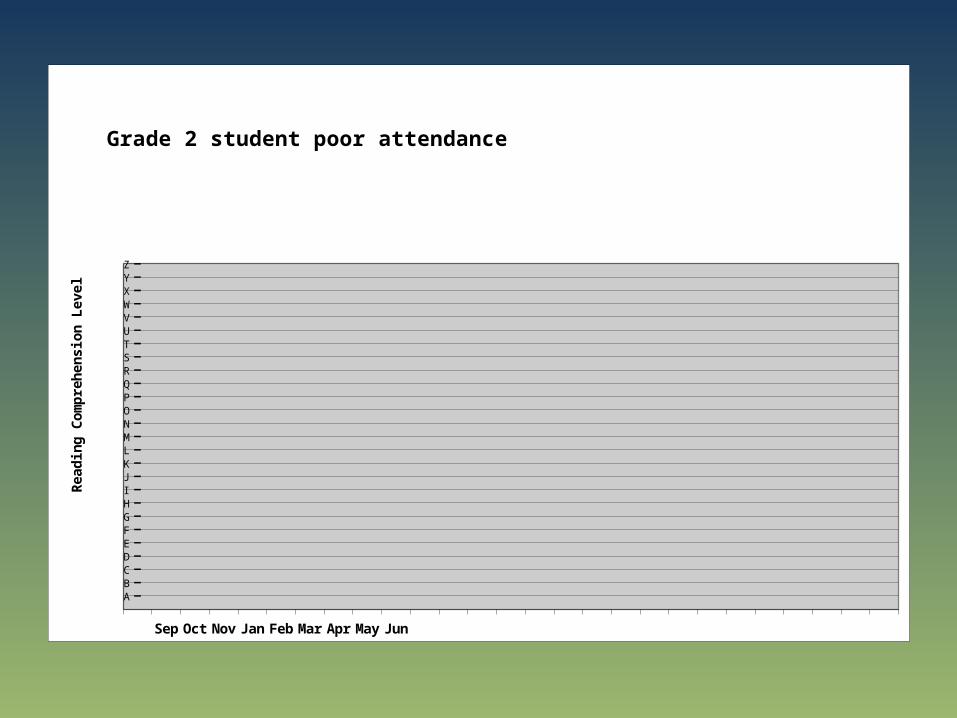
important as what students do in school• About 16 of our students have attended less
than ¼ of their morning classes this year (80% recommended)
• We have some students who have missed two and three years of school and are working two and three grade levels below where they should be… it becomes very hard for these students in Grade 9 & 10
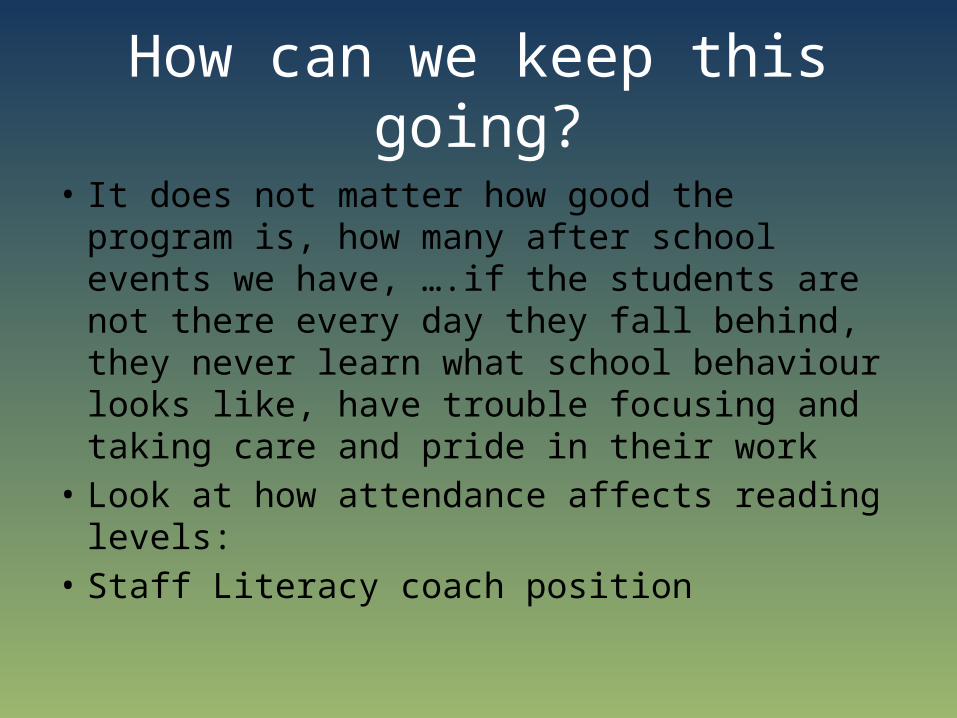
How can we keep this going?
• It does not matter how good the program is, how many after school events we have, ….if the students are not there every day they fall behind, they never learn what school behaviour looks like, have trouble focusing and taking care and pride in their work
• Look at how attendance affects reading levels:• Staff Literacy coach position
Sept
Oct Nov
Jan Feb
Mar
Apr
May
June
ABCDEFGHIJ
KLMNOPQRSTUVWXYZ
Grade 2 student good attendance
Read
ing
Co
mp
reh
en
sio
n L
evel
Sept
Oct Nov
Jan Feb
Mar
Apr
May
June
ABCDEFGHIJ
KLMNOPQRSTUVWXYZ
Grade 2 student poor attendance
Read
ing
Co
mp
reh
en
sio
n L
evel
Sept
Oct Nov
Jan Feb
Mar
Apr
May
June
ABCDEFGHIJ
KLMNOPQRSTUVWXYZ
Grade 7 student – good attendance and home support
Read
ing
Co
mp
reh
en
sio
n L
evel
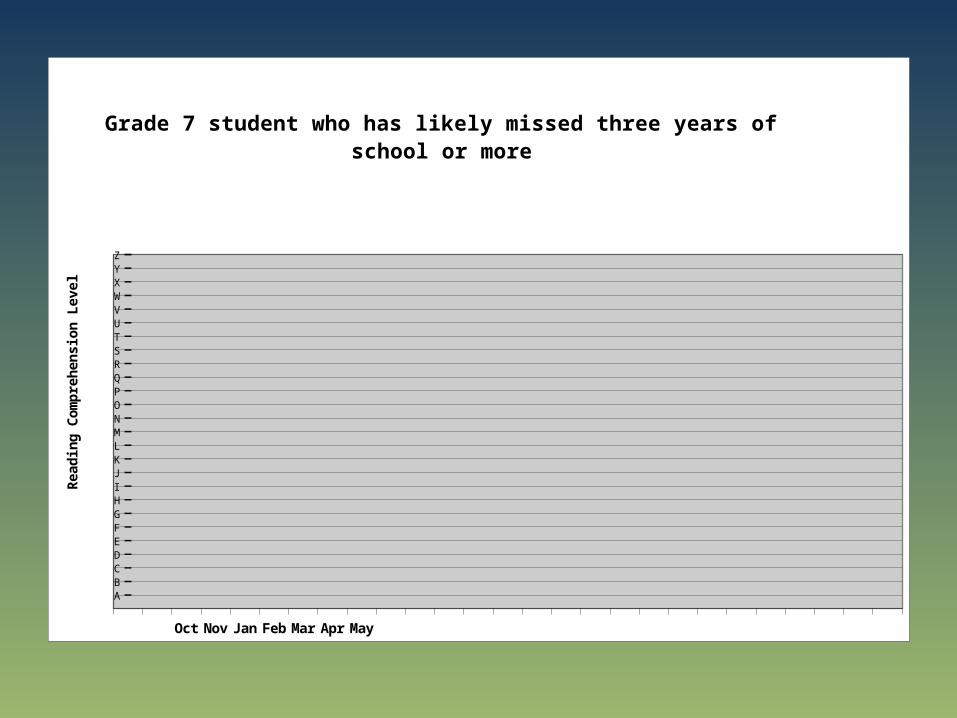
Sept
Oct Nov
Jan Feb
Mar
Apr
May
June
ABCDEFGHIJ
KLMNOPQRSTUVWXYZ
Grade 7 student who has likely missed three years of school or more
Read
ing
Co
mp
reh
en
sio
n L
evel
Enrollment, Attendance & the Retrofit
• This is an issue – our enrollment has dropped – especially last year – losing staff, ability to deliver quality programming, resources
• Other schools are having same issues of lower enrollment. But - Chief Sunrise has the same number of students that we do and had a major renovation years ago.
• What can we do? IDEAS?