Embed Size (px)
Citation preview

Rosa Sicari, Luna Gargani
Ins1tute of Clinical Physiology Na1onal Council of Research, Pisa, Italy
LUST trial
Echocardiography USER’S MANUAL
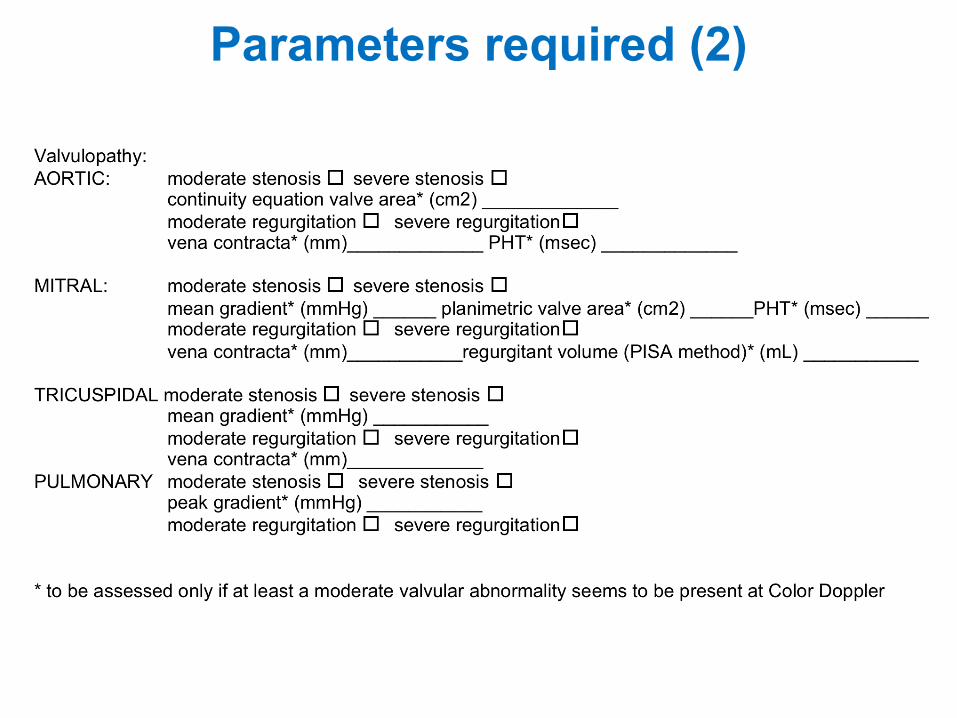
Parameters required (1)
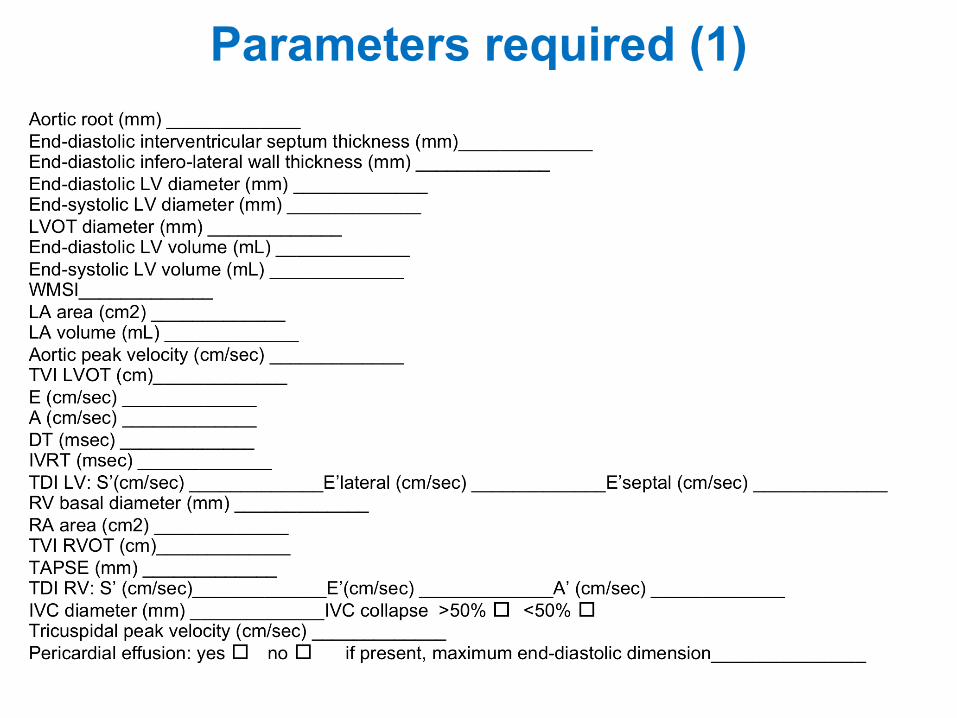
Aortic root
Measurement of aortic root diameter at sinuses of Valsava from 2-dimensional parasternal long-axis image. Inner edge-to-inner edge measurement in end-systole is advisable.
44 Bulwer and Rivero
Fig. 15. M-Mode: mitral valve leaflets. Normal ranges for thesedimensions are shown in the EF slope reflects the speed of anteriormitral leaflet (AML) closure. This pattern is significantly altered inmitral stenosis, becoming box-like. Posterior mitral leaflet (PML)movement essentially mirrors that of the anterior leaflet.
Fig. 17. Patient and transducer positioning: right ventricularinflow view.
Fig. 16. Left ventricular M-mode dimensions. M-mode delivers superior image resolution compared to 2D, but variations in cardiactopography and morphology frequently leads to off-axis measurements. Some newer instrument models are equipped with softwarefor postprocessing (measuring M-mode from selected 2D images) to overcome this frequent pitfall. However, it is logistically sim-pler to obtain 2D measurements—“leading edge to leading edge”—during image acquisition as shown.
03_Bulwer 9/27/06 11:40 AM Page 44
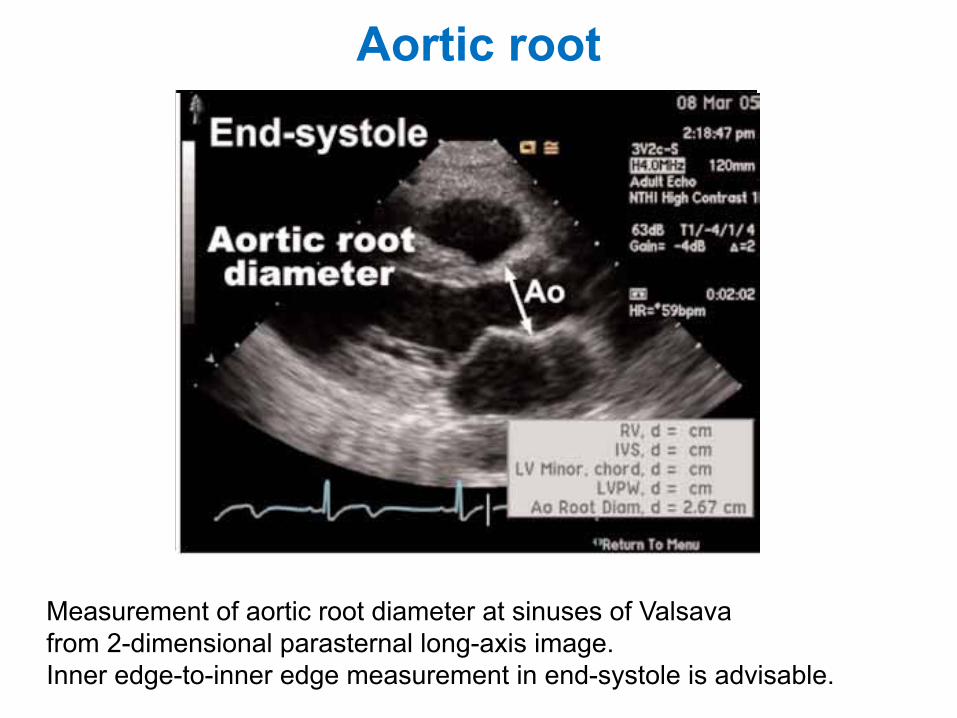
Left ventricular dimensions
It is recommended that LV internal dimensions (LVIDd and LVIDs, respectively) and wall thicknesses be measured at the level of the LV minor axis, approximately at the mitral valve leaflet tips. These linear measurements can be made directly from 2D images or using 2D-targeted M-mode echocardiography.
44 Bulwer and Rivero
Fig. 15. M-Mode: mitral valve leaflets. Normal ranges for thesedimensions are shown in the EF slope reflects the speed of anteriormitral leaflet (AML) closure. This pattern is significantly altered inmitral stenosis, becoming box-like. Posterior mitral leaflet (PML)movement essentially mirrors that of the anterior leaflet.
Fig. 17. Patient and transducer positioning: right ventricularinflow view.
Fig. 16. Left ventricular M-mode dimensions. M-mode delivers superior image resolution compared to 2D, but variations in cardiactopography and morphology frequently leads to off-axis measurements. Some newer instrument models are equipped with softwarefor postprocessing (measuring M-mode from selected 2D images) to overcome this frequent pitfall. However, it is logistically sim-pler to obtain 2D measurements—“leading edge to leading edge”—during image acquisition as shown.
03_Bulwer 9/27/06 11:40 AM Page 44
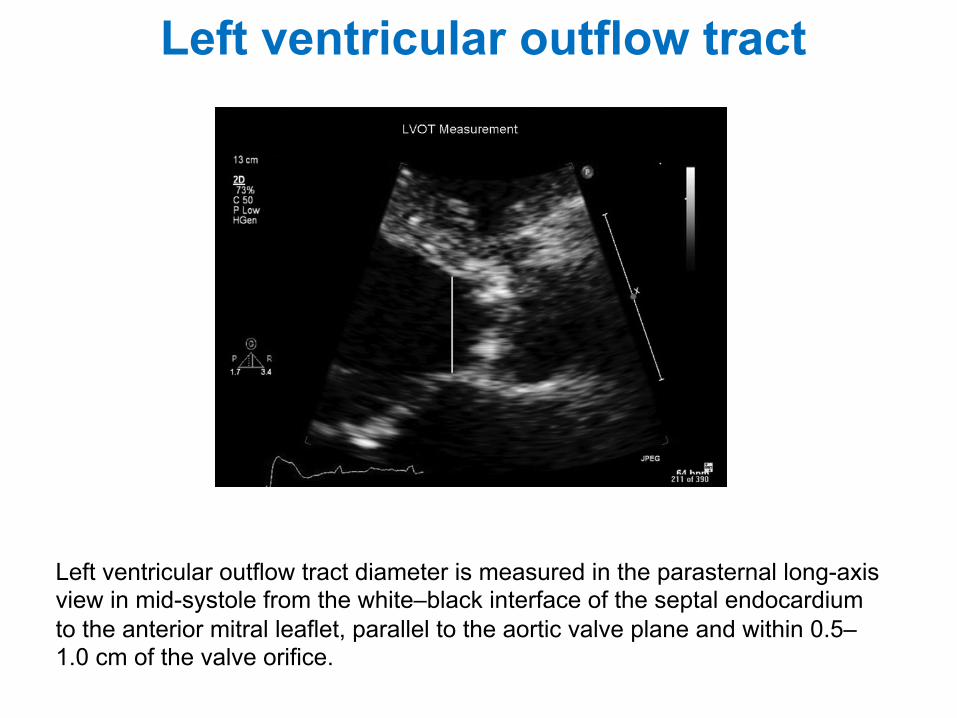
Left ventricular outflow tract
Left ventricular outflow tract diameter is measured in the parasternal long-axis view in mid-systole from the white–black interface of the septal endocardium to the anterior mitral leaflet, parallel to the aortic valve plane and within 0.5–1.0 cm of the valve orifice.
† AS jet velocity by CWD† LVOT diameter for calculation of a circular CSA† LVOT velocity recorded with pulsed Doppler.
AS jet velocity is recorded with CWD and the VTI is measuredas described above.
Left ventricular outflow tract stroke volumeAccurate SV calculations depend on precisely recording
the LVOT diameter and velocity. It is essential that bothmeasurements are made at the same distance from theaortic valve. When a smooth velocity curve can be obtainedat the annulus, this site is preferred (i.e. particularly in con-genital AS with doming valve). However, flow acceleration atthe annulus level and even more proximally occurs in manypatients, particularly those with calcific AS, so that thesample volume needs to be moved apically from 0.5 to1.0 cm to obtain a laminar flow curve without spectral dis-persion. In this case, the diameter measurement should bemade at this distance from the valve (Figure 5). However,it should be remembered that LVOT becomes progressivelymore elliptical (rather than circular) in many patients,which may result in underestimation of LVOT CSA and inconsequence underestimation of SV and eventually AVA.16
Diameter is measured from the inner edge to inner edge ofthe septal endocardium, and the anterior mitral leaflet inmid-systole. Diameter measurements are most accurateusing the zoom mode with careful angulation of the transdu-cer and with gain and processing adjusted to optimize theimages. Usually three or more beats are averaged in sinusrhythm, averaging of more beats is appropriate with irregu-lar rhythms (at least 5 consecutive beats). With carefulattention to the technical details, diameter can bemeasured in nearly all patients. Then, the CSA of the LVOTis calculated as the area of a circle with the limitationsmentioned above:
CSALVOT ! pD2
! "2
where D is diameter. LVOT velocity is recorded with pulsedDoppler from an apical approach, in either the anteriorlyangulated four-chamber view (or ‘five-chamber view’) orin the apical long-axis view. The pulsed-Doppler samplevolume is positioned just proximal to the aortic valve sothat the location of the velocity recording matches theLVOT diameter measurement. When the sample volume isoptimally positioned, the recording (Figure 6) shows asmooth velocity curve with a well-defined peak, narrowband of velocities throughout systole. As mentioned above,this may not be the case in many patients at the annulusdue to flow convergence resulting in spectral dispersion. Inthis case, the sample volume is then slowly moved towardsthe apex until a smooth velocity curve is obtained. TheVTI is measured by tracing the dense modal velocitythroughout systole.17
Limitations of continuity-equation valve areaThe clinical measurement variability for continuity-
equation valve area depends on the variability in each ofthe three measurements, including both the variability inacquiring the data and variability in measuring the recordeddata. AS jet and LVOT velocity measurements have a verylow intra- and interobserver variability (!3–4%) both fordata recording and measurement in an experienced labora-tory. However, the measurement variability for LVOT diam-eter ranges from 5% to 8%. When LVOT diameter is squaredfor calculation of CSA, it becomes the greatest potentialsource of error in the continuity equation. When transthor-acic images are not adequate for the measurement ofLVOT diameter, TEE measurement is recommended if thisinformation is needed for clinical decision-making.
Accuracy of SV measurements in the outflow tract alsoassumes laminar flow with a spatially flat profile of flow(e.g. velocity is the same in the centre and at the edge ofthe flow stream). When subaortic flow velocities are abnor-mal, for example, with dynamic subaortic obstruction or asubaortic membrane, SV calculations at this site are notaccurate. With combined stenosis and regurgitation, high
Figure 5 Left ventricular outflow tract diameter is measured in the parasternal long-axis view in mid-systole from the white–black interfaceof the septal endocardium to the anterior mitral leaflet, parallel to the aortic valve plane and within 0.5–1.0 cm of the valve orifice.
EAE/ASE stenosis recommendations 7
centric remodeling (normal LV mass with increasedRWT) (Figure 5).22
The most commonly used 2D methods for mea-suring LV mass are based on the area-length formulaand the truncated ellipsoid model, as described indetail in the 1989 ASE document on LV quantita-tion.2 Both methods were validated in the early1980s in animal models and by comparing premor-bid echocardiograms with measured LV weight atautopsy in human beings. Both methods rely onmeasurements of myocardial area at the midpapil-lary muscle level. The epicardium is traced to obtainthe total area (A1) and the endocardium is traced toobtain the cavity area (A2). Myocardial area (Am) iscomputed as the difference: Am ! A1 " A2. Assuminga circular area, the radius is computed: b ! #A2/$,and a mean wall thickness derived (Figure 6). LV masscan be calculated by one of the two formulas shownin Figure 6. In the presence of extensive regionalwall-motion abnormalities (eg, MI), the biplaneSimpson’s method may be used, although thismethod is dependent on adequate endocardial andepicardial definition of the LV, which often is chal-lenging from this window. Most laboratories obtainthe measurement at end diastole and exclude thepapillary muscles in tracing the myocardial area.
TEE evaluation of LV mass is also highly accurate,but has minor systematic differences in LV PWT. Inparticular, LV mass derived from TEE wall-thicknessmeasurements is higher by an average of 6 g/m2.8
LV Systolic Function: Linear and VolumetricMeasurement
Many echocardiography laboratories rely on M-modemeasurements or linear dimensions derived from the2D image for quantification. Linear measurementsfrom M-mode and 2D images have proven to bereproducible with low intraobserver and interobservervariability.20,23-26 Although linear measures of LVfunction are problematic when there is a markedregional difference in function, in patients withuncomplicated hypertension, obesity, or valvulardiseases, such regional differences are rare in theabsence of clinically recognized MI. Hence, FS andits relationship to end-systolic stress often provideuseful information in clinical studies.27 The previ-ously used Teichholz or Quinones methods of cal-culating LV EF from LV linear dimensions may resultin inaccuracies as a result of the geometric assump-tions required to convert a linear measurement to a3D volume.28,29 Accordingly, the use of linear mea-surements to calculate LV EF is not recommendedfor clinic practice.
Contraction of muscle fibers in the LV midwallmay better reflect intrinsic contractility than con-traction of fibers at the endocardium. Calculation ofmidwall rather than endocardial FS is particularlyuseful in revealing underlying systolic dysfunction inthe setting of concentric hypertrophy.30 Midwallfraction and shortening (MWFS) may be computedfrom linear measures of diastolic and systolic cavitysizes and wall thicknesses based on mathematicmodels,30,31 according to the following formulas:
Figure 6 Two methods for estimating LV mass based onarea-length (AL) formula and the truncated ellipsoid (TE)formula, from short-axis (left) and apical four-chamber(right) 2-D echo views. Where A1 ! total LV area; A2 !LV cavity area, Am ! myocardial area, a is the long orsemi-major axis from widest minor axis radius to apex, b isthe short-axis radius (back calculated from the short-axiscavity area) and d is the truncated semimajor axis fromwidest short-axis diameter to mitral anulus plane. Assuminga circular area, the radius (b) is computed and mean wallthickness (t) derived from the short-axis epicardial andcavity areas. See text for explanation.
Figure 7 Two-dimensional measurements for volume cal-culations using biplane method of disks (modified Simp-son’s rule) in apical 4-chamber (A4C) and apical 2-cham-ber (A2C) views at end diastole (LV EDD) and at endsystole (LV ESD). Papillary muscles should be excludedfrom the cavity in the tracing.
Journal of the American Society of Echocardiography1446 Lang et al December 2005
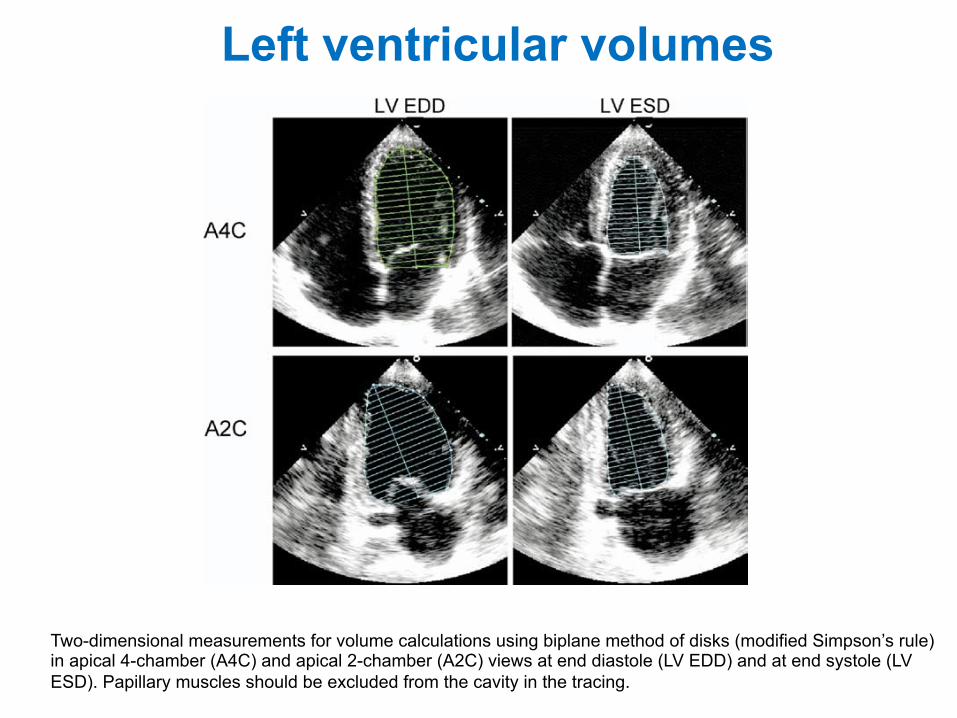
Two-dimensional measurements for volume calculations using biplane method of disks (modified Simpson’s rule) in apical 4-chamber (A4C) and apical 2-chamber (A2C) views at end diastole (LV EDD) and at end systole (LV ESD). Papillary muscles should be excluded from the cavity in the tracing.
Left ventricular volumes
known as real-time 3D echocardiography. After ac-quisition of the raw data, calculation of LV volumesand mass requires identification of endocardial bor-ders (and for mass epicardial border) using manualor semiautomated algorithms. These borders arethen processed to calculate the cavity or myocardialvolume by summation of disks54,56 or other meth-ods.46-48
Regardless of which acquisition or analysis methodis used, 3D echocardiography does not rely on geo-metric assumptions for volume/mass calculationsand is not subject to plane positioning errors,which can lead to chamber foreshortening. Stud-ies comparing 3D echocardiographic LV volumes
or mass with other gold standards (eg, MRI) haveconfirmed 3D echocardiography to be accurate.Compared with magnetic resonance data, LV andright ventricular (RV) volumes calculated from 3Dechocardiography showed significantly betteragreement (smaller bias), lower scatter, and lowerintraobserver and interobserver variability than 2Dechocardiography.46,54,57,60 The superiority of 3Dechocardiographic LV mass calculations over valuescalculated from M-mode or 2D echocardiographyhas been convincingly shown.55,57,59 RV volume andmass have also been measured by 3D echocardiogra-phy with good agreement with magnetic resonancedata.58,61 Current limitations include the require-
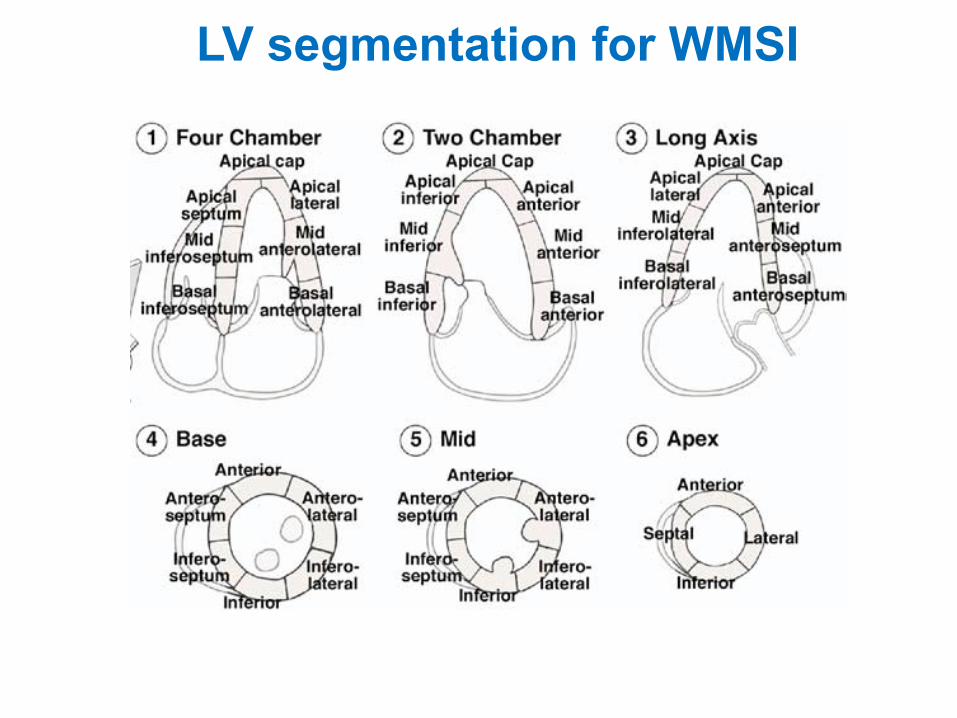
Figure 8 Segmental analysis of LV walls based on schematic views, in a parasternal short- and long-axisorientation, at 3 different levels. The “apex segments” are usually visualized from apical 4-chamber, apical2 and 3-chamber views. The apical cap can only be appreciated on some contrast studies. A 16-segmentmodel�can�be�used,�without�the�apical�cap,�as�described�in�an�ASE�1989�document.2�A�17-segment�model,including the apical cap, has been suggested by the American Heart Association Writing Group onMyocardial�Segmentation�and�Registration�for�Cardiac�Imaging.62
Figure 9 Typical distributions of the right coronary artery (RCA), the left anterior descending (LAD),and the circumflex (CX) coronary arteries. The arterial distribution varies between patients. Somesegments have variable coronary perfusion.
Journal of the American Society of EchocardiographyVolume 18 Number 12 Lang et al 1449
LV segmentation for WMSI
Left atrial volumes
M-mode or 2D anteroposterior (AP) linear dimen-sion obtained from the parasternal long-axis view,making this the standard for linear LA measurement(Figure 15).93,95,96,98,104,105 The convention for M-mode measurement is to measure from the leadingedge of the posterior aortic wall to the leading edgeof the posterior LA wall. However, to avoid thevariable extent of space between the LA and aorticroot, the trailing edge of the posterior aortic isrecommended.
Although these linear measurements have beenshown to correlate with angiographic measure-ments and have been widely used in clinical practiceand research, they inaccurately represent true LAsize.109,110 Evaluation of the LA in the AP dimensionassumes that a consistent relationship is maintainedbetween the AP dimension and all other LA dimen-sions as the atrium enlarges, which is often not thecase.111,112 Expansion of the LA in the AP dimensionmay be constrained by the thoracic cavity betweenthe sternum and the spine. Predominant enlarge-ment in the superior-inferior and medial-lateral di-mensions will alter LA geometry such that the APdimension may not be representative of LA size. Forthese reasons, AP linear dimensions of the LA as thesole measure of LA size may be misleading andshould be accompanied by LA volume determina-tion in both clinical practice and research.
LA Volume Measurements
When LA size is measured in clinical practice,volume determinations are preferred over lineardimensions because they allow accurate assessmentof the asymmetric remodeling of the LA chamber.111
In addition, the strength of the relationship betweencardiovascular disease is stronger for LA volumethan for LA linear dimensions.97,113 Echocardio-
graphic measures of LA volume have been com-pared with cinecomputed tomography, biplane con-trast ventriculography, and MRI.109,114-116 Thesestudies have shown either good agreement or atendency for echocardiographic measurements tounderestimate comparative LA volumes.
The simplest method for estimating LA volume isthe cube formula, which assumes that the LA volumeis that of a sphere with a diameter equal to the LA APdimension. However, this method has proven to beinferior to other volume techniques.109,111,117 LA vol-umes are best calculated using either an ellipsoidmodel or Simpson’s rule.88,89,97,101,102,109-111,115-117
The ellipsoid model assumes that the LA can beadequately represented as a prolate ellipse with avolume of 4!/3 (L/2) (D1/2) (D2/2), where L is thelong axis (ellipsoid) and D1 and D2 are orthogonalshort-axis dimensions. LA volume can be estimatedusing this biplane dimension-length formula by sub-stituting the LA AP diameter acquired from theparasternal long axis as D1, LA medial-lateral dimen-sion from the parasternal short-axis as D2, and the LAlong-axis from the apical 4-chamber for L.117-119
Simplified methods using nonorthogonal linear mea-surements for estimation of LA volume have beenproposed.113 Volume determined using linear di-mensions is very dependent on careful selection ofthe location and direction of the minor-axis dimen-sions and has been shown to significantly underes-timate LA volume.117
To estimate the LA minor-axis dimension of theellipsoid more reliably, the long-axis LA areas can betraced and a composite dimension derived. Thisdimension takes into account the entire LA border,rather than a single linear measurement. Whenlong-axis area is substituted for minor-axis dimen-sion, the biplane area-length formula is used: 8 (A1)(A2)/3! (L), where A1 and A2 represent the maximalplanimetered LA area acquired from the apical 4- and2-chamber views, respectively, and L is length. Thelength remains the LA long-axis length determinedas the distance of the perpendicular line measuredfrom the middle of the plane of the mitral annulus tothe superior aspect of the LA (Figure 16). In thearea-length formula the length is measured in boththe 4- and 2-chamber views and the shortest of these2 length measurements is used in the formula.
The area-length formula can be computed from asingle plane, typically the apical 4-chamber, byassuming A1 " A2, such that volume " 8 (A1)2/3!(L) (Figure 16).120 However, this method makesgeometric assumptions that may be inaccurate. Inolder individuals the diaphragm lifts the cardiacapex upward, which increases the angle betweenventricle and atrium. Thus, the apical 4-chamberview will commonly intersect the atria tangentiallyin older individuals and result in underestimation ofvolume using a single plane technique. Because the
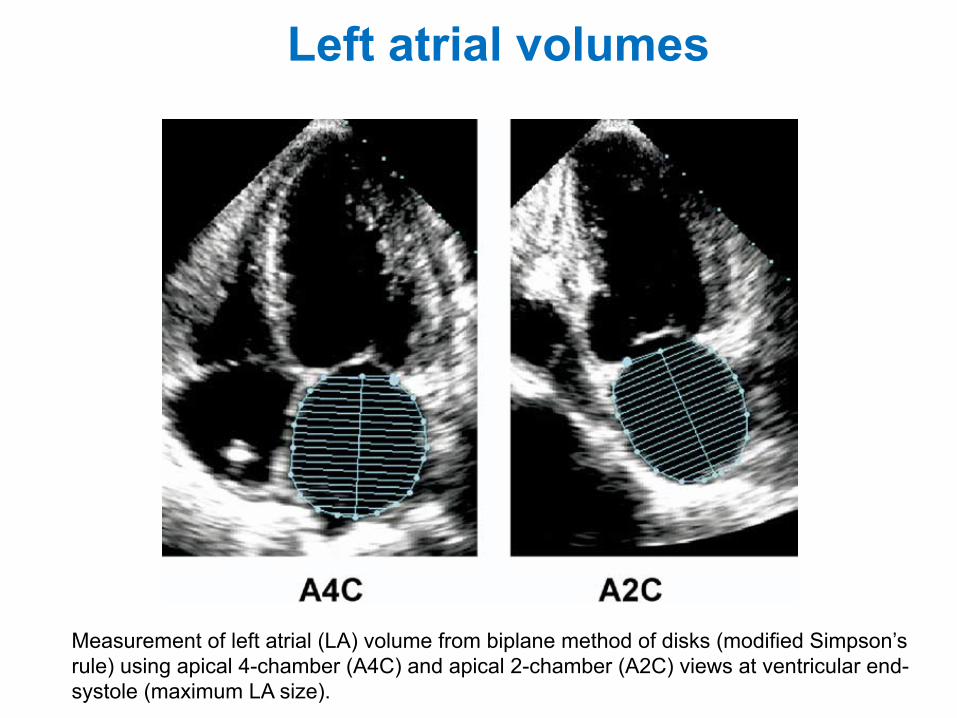
Figure 17 Measurement of left atrial (LA) volume frombiplane method of disks (modified Simpson’s rule) usingapical 4-chamber (A4C) and apical 2-chamber (A2C) viewsat ventricular end systole (maximum LA size).
Journal of the American Society of EchocardiographyVolume 18 Number 12 Lang et al 1455
Measurement of left atrial (LA) volume from biplane method of disks (modified Simpson’s rule) using apical 4-chamber (A4C) and apical 2-chamber (A2C) views at ventricular end-systole (maximum LA size).
Aortic Valve in the Apical Five-Chamber View70
M- M
ode
and
Dop
pler
Ech
ocar
diog
raph
y
Aortic outflow can be displayed in the apical three-chamber or five-chamber view.
The V-shaped flow profile is no different to the Doppler spectrum seen in the three-chamber view.
All rights reserved. Usage subject to terms and conditions of license.Boehmeke, Pocket Atlas of Echocardiography © 2006 Thieme
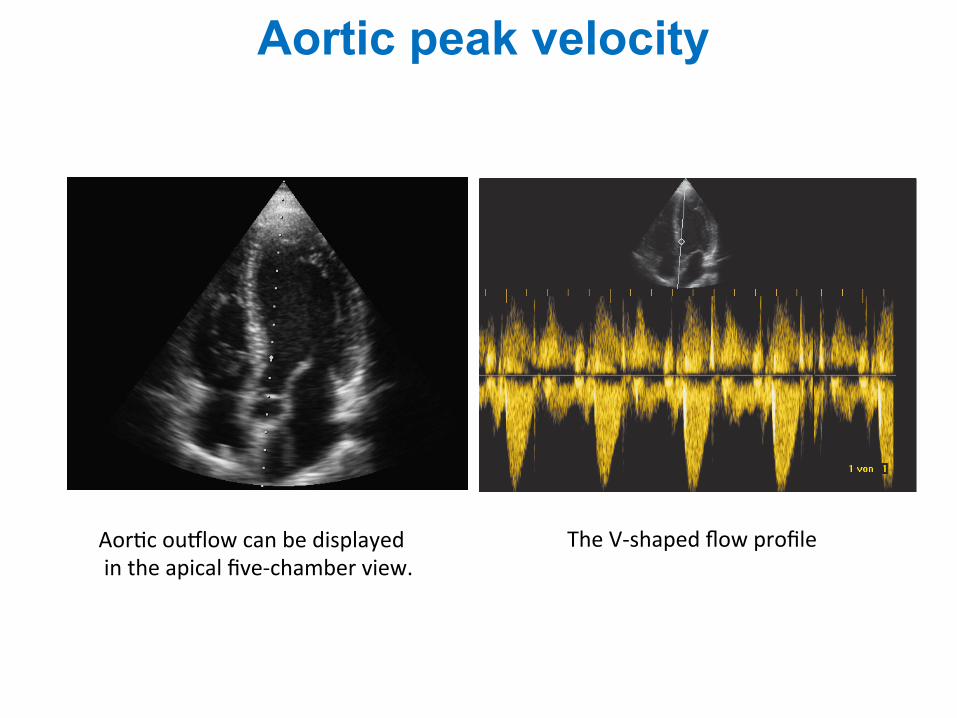
Aor1c ou<low can be displayed in the apical five-‐chamber view.
The V-‐shaped flow profile
Aortic peak velocity
ble level that allows visualization of the structure inquestion. When high-velocity blood flows are ana-lyzed,set the color scale at the maximum allowed forthat given depth. Color Doppler gain should be setjust below the threshold for noise.
RECOMMENDATIONS RELATING TO SPECIFICCLINICAL USES
Flow Measurements
PW Doppler technique. Flow is derived as theproduct of CSA and the average velocity of theblood cells passing through the blood vessel orvalve orifice during the flow period (Figure 3),whereas stroke volume (SV) represents the productof CSA and VTI. When PW Doppler is used, thevelocities recorded within the sample volume willbe affected by the flow profile.With current instru-mentation, assessing flow profile or measuring theaverage velocity of the blood cells is difficult.Consequently, volume-flow measurements are mostaccurate when flow is laminar (ie, all blood cells aremoving in the same direction) and the profile is flat.The most important technical factor to ensure accu-
Journal of the American Society of Echocardiography170 Quiñones et al February 2002
racy of measurements is to properly match the siteof velocity recording with the anatomic measure-ment of the CSA.1 For this reason, it is preferable touse sites where the CSA does not change signifi-cantly during the flow period and can be deter-mined accurately from the 2D image and where theflow profile is likely to be flat. When tracing thevelocity to derive a VTI, it is best to trace the outeredge of the most dense (or brightest) portion of thespectral tracing (ie, the modal velocity) and ignorethe dispersion that occurs near peak velocity. Forpatients in sinus rhythm, data from 3 to 5 cardiaccycles may be averaged. However, in patients withirregular rhythms such as atrial fibrillation, 5 to 10cycles may be required to ensure accuracy ofresults.
The preferred sites for determining SV and cardiacoutput (in descending order of preference) are as fol-lows:
1. The LVOT tract or aortic annulus2. The mitral annulus3. The pulmonic annulus
The LVOT is the most widely used site.2 SV is derivedas:
SV = CSA ! VTI (4)
The CSA of the aortic annulus is circular, with littlevariability during systole. Because the area of a circle= "r2, the area of the aortic annulus is derived fromthe annulus diameter (D) measured in the paraster-nal long-axis view as:
CSA = D2 ! "/4 = D2 ! 0.785 (5)
Image the LV outflow with the expanded or zoom
Figure 3 Diagrammatic illustration of flow through a ves-sel showing 2 different flow profiles. Flat profile with allcells traveling at same velocity and parabolic profile withcells at center traveling faster than those on the side. At anygiven time, flow through the vessel represents product ofaverage velocity of all cells multiplied by CSA of the vessel.
Figure 4 Method used in determining systolic flow vol-ume through left ventricular outflow.
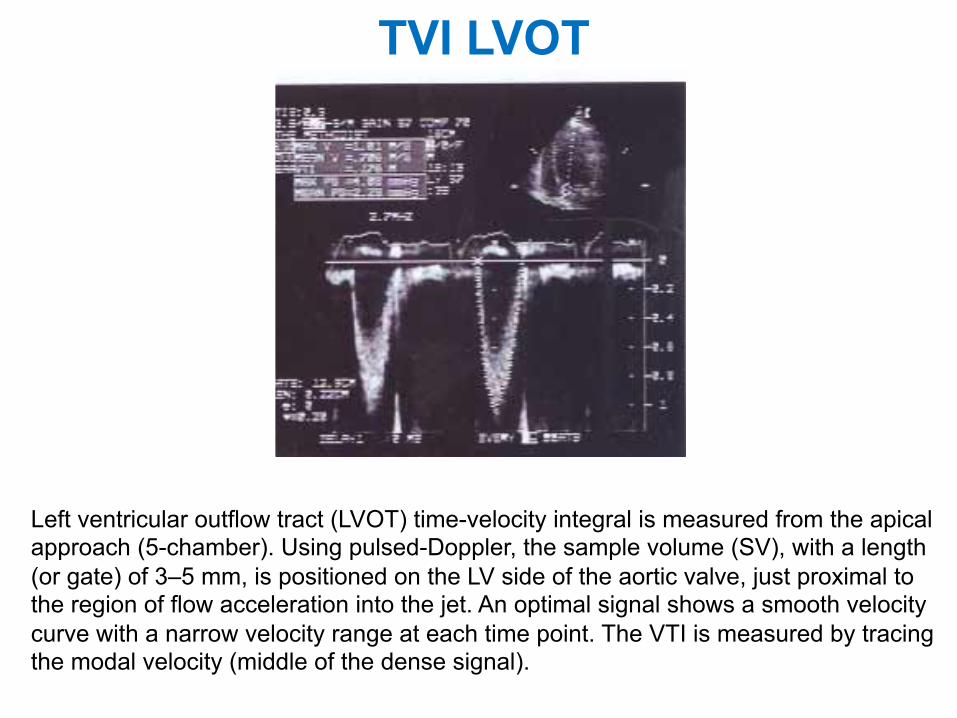
TVI LVOT
Left ventricular outflow tract (LVOT) time-velocity integral is measured from the apical approach (5-chamber). Using pulsed-Doppler, the sample volume (SV), with a length (or gate) of 3–5 mm, is positioned on the LV side of the aortic valve, just proximal to the region of flow acceleration into the jet. An optimal signal shows a smooth velocity curve with a narrow velocity range at each time point. The VTI is measured by tracing the modal velocity (middle of the dense signal).
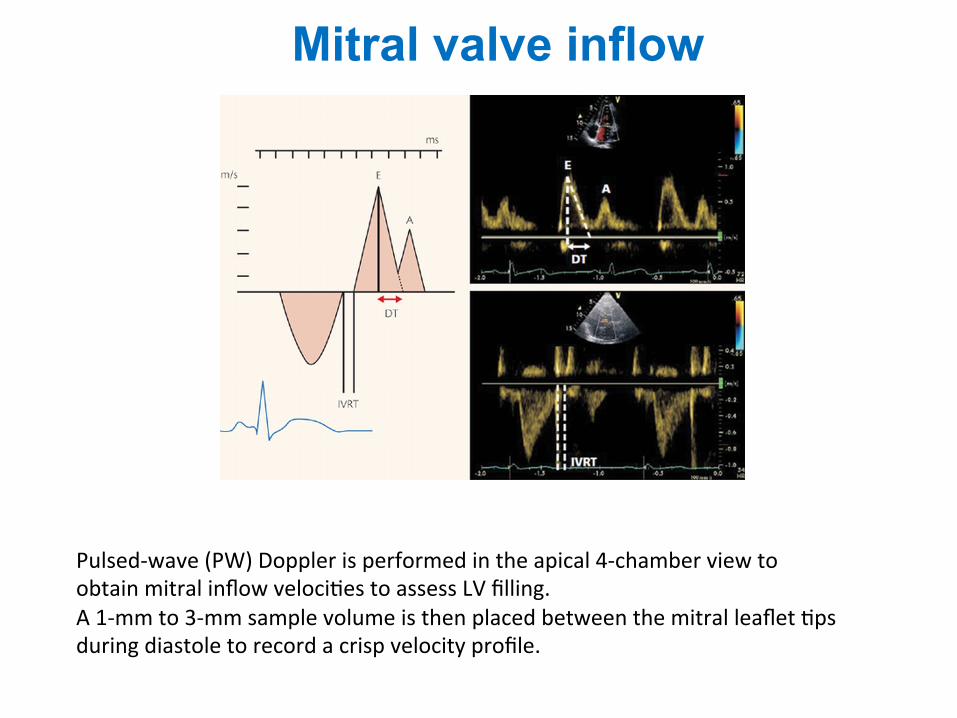
Mitral valve inflow
Pulsed-‐wave (PW) Doppler is performed in the apical 4-‐chamber view to obtain mitral inflow veloci1es to assess LV filling. A 1-‐mm to 3-‐mm sample volume is then placed between the mitral leaflet 1ps during diastole to record a crisp velocity profile.
Journal of the American Society of EchocardiographyVolume 15 Number 2 Quiñones et al 173
nals.With CW Doppler, IVRT is measured by aimingthe Doppler beam at an intermediate positionbetween inflow and outflow to record both veloci-ties (Figure 8). IVRT is measured as the intervalbetween the end of ejection and the onset of mitralinflow. As a rule, CW recordings provide a morereproducible measure of IVRT than PW. Three to 5cardiac cycles should be averaged when measuringtransmitral velocities and IVRT. One exception tothis rule is made in conditions in which these veloc-ities change with respiration, such as in pericardialconstriction or tamponade. In these cases, the veloc-ities should be recorded with a respiratory tracingand averaged separately.
Certain patterns have been associated withchanges in left atrial pressures in patients with LVdisease, particularly those with depressed systolicfunction (Figure 9). With normal pressures, thetransmitral velocity, as a rule, has a lower E than Avelocity with a prolonged IVRT and decelerationtime, reflecting the impaired relaxation of the leftventricle. On the other hand, with higher left atrialpressures, the E velocity increases whereas the IVRTand deceleration time shorten. This resembles thepattern seen in healthy young persons and thus it isreferred to as pseudonormal.
Pulmonary vein velocity. Analysis of the pul-monary vein velocities can provide insight into thediastolic properties of the LV and the function of theleft atrium. Certain patterns have been associatedwith increased left atrial pressures in patients with
LV disease, particularly those with depressed sys-tolic function, that complement the informationderived from the mitral inflow velocity (Figure9).16,17 With current technology, the velocity of flowwithin the pulmonary veins can be recorded fromthe transthoracic apical view in 80% of patients.Themost common vein accessible from this window isthe right upper pulmonary vein.The flow within thevein can be visualized with color Doppler using alower velocity scale (<40 cm/s) and the PW samplevolume can be placed inside the vein.Without atten-tion to proper sample volume location, 2 errorscommonly occur.The sample volume can be placednear the opening of the pulmonary vein but stillwithin the left atrium, or the low-velocity motion ofthe posterior atrial wall can be recorded. Whenrecording the pulmonary veins, keep the wall filtersat a low level.
The flow velocity measurements currently recom-mended in the pulmonary veins are the peak systolic(S), peak diastolic (D), and atrial reversal (A) veloci-ties, the S/D ratio, and the duration of the A velocity(Figures 7 and 9).
Myocardial and annular velocities. Longitudinalvelocities within the myocardium can be recordedwith tissue Doppler from the apical window withthe PW mode. A small (<5 mm) sample volume isplaced within a myocardial segment and a spectralrecording of velocities within the segment obtained(Figure 10). For optimal recording of tissue velocity,both gains and filter settings should be set low.
Figure 9 Diagrammatic illustration of 3 common patternsof mitral and pulmonary vein velocities: normal, delayedrelaxation, and pseudonormal.
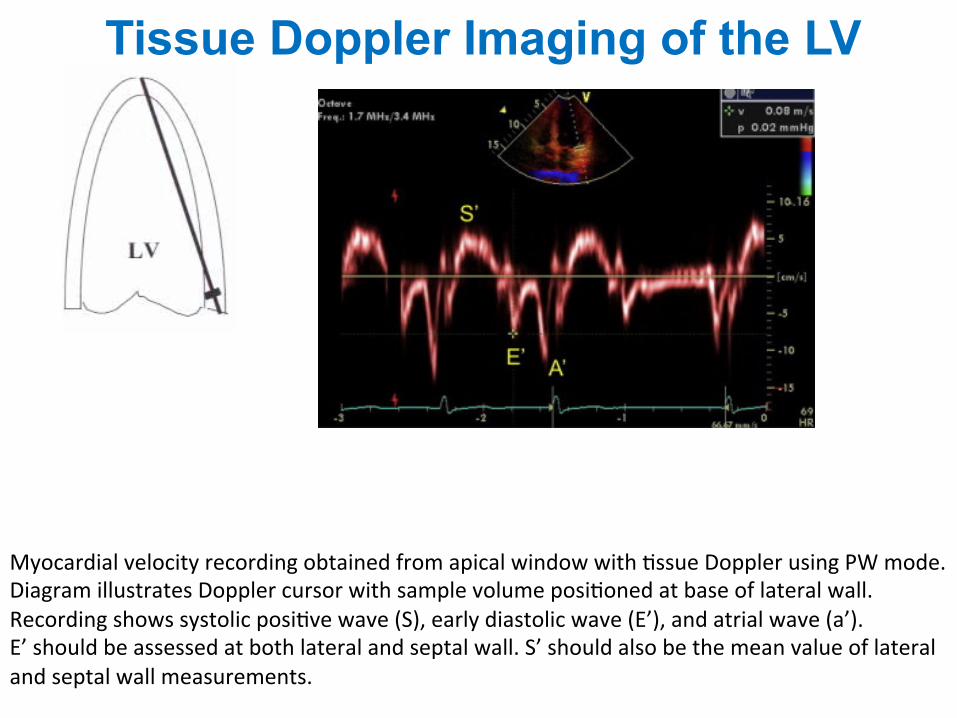
Figure 10 Myocardial velocity recording obtained fromapical window with tissue Doppler using PW mode.Diagram illustrates Doppler cursor with sample volumepositioned at base of lateral wall. Recording shows systolicpositive wave (S), early diastolic wave (Em), and atrial wave(Am).
Myocardial velocity recording obtained from apical window with 1ssue Doppler using PW mode. Diagram illustrates Doppler cursor with sample volume posi1oned at base of lateral wall. Recording shows systolic posi1ve wave (S), early diastolic wave (E’), and atrial wave (a’). E’ should be assessed at both lateral and septal wall. S’ should also be the mean value of lateral and septal wall measurements.
Tissue Doppler Imaging of the LV
tion.69-73 This physiologic hypertrophic remodelingof the athlete heart is reversible with cessation ofendurance training and is related to the total in-crease in lean body weight,70 and triggered byenhanced cardiac sympathetic activity.74 Remodel-ing may be compensatory in chronic pressure over-load because of systemic hypertension or aorticstenosis resulting in concentric hypertrophy (in-creased wall thickness, normal cavity volume, andpreserved EF) (Figure 5). Compensatory LV remod-eling also occurs in chronic volume overload asso-ciated with mitral or aortic regurgitation, whichinduces a ventricular architecture characterized byeccentric hypertrophy, LV chamber dilatation, andinitially normal contractile function. Pressure andvolume overload may remain compensated by ap-propriate hypertrophy, which normalizes wall stresssuch that hemodynamics and EF remain stable dur-ing the long term. However, in some patients,chronically increased afterload cannot be normal-ized indefinitely and the remodeling process be-comes pathologic.
Transition to pathologic remodeling is heraldedby progressive ventricular dilatation, distortion ofcavity shape, and disruption of the normal geometryof the mitral annulus and subvalvular apparatusresulting in mitral regurgitation. The additional vol-ume load from mitral regurgitation escalates thedeterioration in systolic function and developmentof heart failure. LV dilatation begets mitral regurgi-tation and mitral regurgitation begets further LVdilatation, progressive remodeling, and contractiledysfunction.
Changes in LV size and geometry caused by hyper-tension (Figure 5) reflect the dominant underlyinghemodynamic alterations associated with blood pres-sure elevation.22,75 The pressure overload pattern ofconcentric hypertrophy is uncommon in otherwisehealthy individuals with hypertension and is associ-ated with high systolic blood pressure and highperipheral resistance. In contrast, eccentric LV hy-pertrophy is associated with normal peripheral re-sistance but high cardiac index consistent withexcess circulating blood volume. Concentric remod-eling (normal LV mass with increased RWT) is charac-terized by high peripheral resistance, low cardiacindex, and increased arterial stiffness.76,77
A unique form of remodeling occurs after MI asa result of the abrupt loss of contracting myo-cytes.22,78 Early expansion of the infarct zone isassociated with early LV dilatation as the increasedregional wall stress is redistributed to preservestroke volume. The extent of early and late postin-farction remodeling is determined by a number offactors, including size and location of infarction,activation of the sympathetic nervous system, andup-regulation of the renin/angiotensin/aldosteronesystem and natriuretic peptides. Between a half and
a third of patients postinfarction experience pro-gressive dilatation79,80 with distortion of ventriculargeometry and secondary mitral regurgitation. Mitralregurgitation further increases the propensity for dete-rioration in LV function and development of conges-tive heart failure. Pathologic LV remodeling is the finalcommon pathway to heart failure, whether the initialstimulus is chronic pressure, chronic volume overload,genetically determined cardiomyopathy, or MI. Thecause of LV dysfunction in approximately two thirds ofthe 4.9 million patients with heart failure in the UnitedStates is coronary artery disease.81
Although LV remodeling in patients with chronicsystemic hypertension, chronic valvular regurgita-tion, and primary cardiomyopathies has been de-scribed, the transition to heart failure is less wellknown because the time course is so prolonged. Bycontrast, the time course from MI to heart failure isshorter and has been clearly documented.
The traditional quantitative echocardiographic mea-surements recommended for the evaluation of LVremodeling included estimates of LV volumes either
Figure 10 Methods of measuring right ventricular wallthickness (arrows) from M-mode (left) and subcostal trans-thoracic (right) echocardiograms.
Figure 11 Midright ventricular diameter measured in api-cal 4-chamber view at level of left ventricular papillarymuscles.
Journal�of�the�American�Society�of�EchocardiographyVolume 18 Number 12 Lang et al 1451
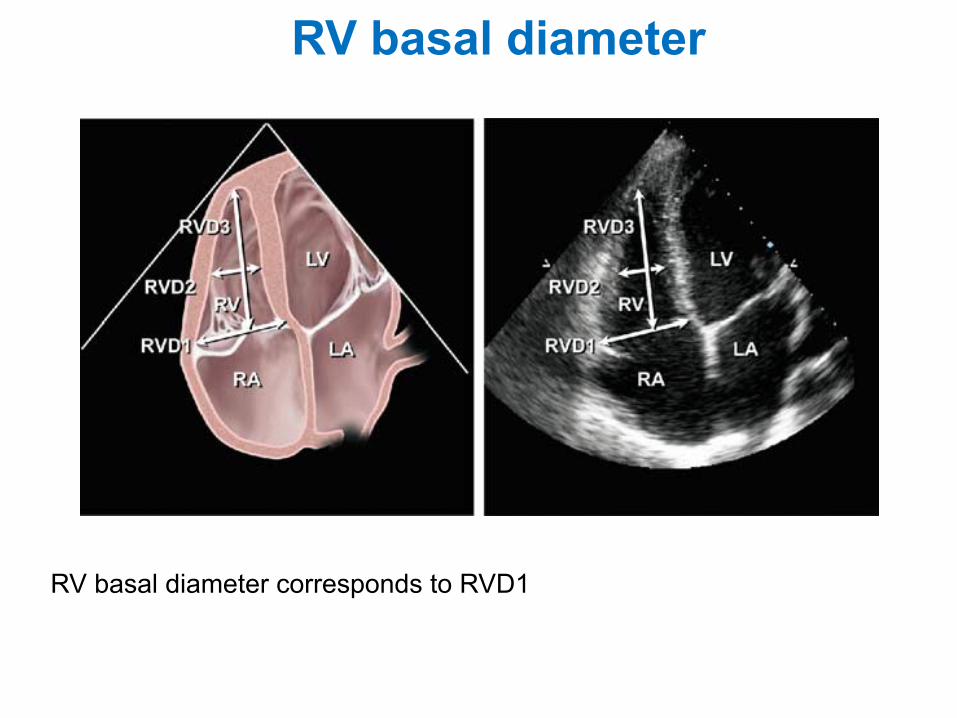
RV basal diameter corresponds to RVD1
RV basal diameter
to it. Although a distended IVC usually denotes elevated RA pres-sures, in patients with otherwise normal exam results, reassessingthe IVC size and collapsibility in the left lateral position may be usefulto avoid the potentially erroneous inference of increased RA fillingpressure. The IVC may also be dilated in normal young athletes,and in this population, it may not reflect elevated RA pressure.
Hepatic vein flow patterns provide complementary insights intoRA pressure. At low or normal RA pressures, there is systolic pre-dominance in hepatic vein flow, such that the velocity of the systolicwave (Vs) is greater than the velocity of the diastolic wave (Vd). Atelevated RA pressures, this systolic predominance is lost, such thatVs is substantially decreased and Vs/Vd is <1. The hepatic vein sys-tolic filling fraction is the ratio Vs/(Vs + Vd), and a value < 55% wasfound to be the most sensitive and specific sign of elevated RA pres-sure.15 Importantly, hepatic vein flow velocities have been validatedin mechanically ventilated patients, provided that the velocities areaveraged over $5 consecutive beats and comprising $1 respiratorycycle.
Other 2D signs of increased RA pressure include a dilated rightatrium and an interatrial septum that bulges into the left atriumthroughout the cardiac cycle. These are qualitative and comparative,and do not allow the interpreter to assign an RA pressure but if pres-ent should prompt a more complete evaluation of RA pressure as wellas a search for possible etiologies.
Advantages: IVC dimensions are usually obtainable from thesubcostal window.
Disadvantages: IVC collapse does not accurately reflect RApressure in ventilator-dependent patients. It is less reliable for interme-diate values of RA pressure.
Recommendations: For simplicity and uniformity of re-porting, specific values of RA pressure, rather than ranges,should be used in the determination of SPAP. IVC diameter# 2.1 cm that collapses >50% with a sniff suggests a normalRA pressure of 3 mm Hg (range, 0-5 mm Hg), whereas anIVC diameter > 2.1 cm that collapses <50% with a sniff sug-gests a high RA pressure of 15 mm Hg (range, 10-20 mmHg). In indeterminate cases in which the IVC diameterand collapse do not fit this paradigm, an intermediate valueof 8 mm Hg (range, 5-10 mm Hg) may be used, or, prefera-bly, secondary indices of elevated RA pressure should be in-tegrated. These include restrictive right-sided diastolicfilling pattern, tricuspid E/E0 ratio > 6, and diastolic flowpredominance in the hepatic veins (which can be quanti-fied as a systolic filling fraction < 55%). In indeterminatecases, if none of these secondary indices of elevated RApressure are present, RA pressure may be downgraded to3 mm Hg. If there is minimal IVC collapse with a sniff(<35%) and secondary indices of elevated RA pressure arepresent, RA pressure may be upgraded to 15 mm Hg. If un-certainty remains, RA pressure may be left at the interme-diate value of 8 mm Hg. In patients who are unable toadequately perform a sniff, an IVC that collapses < 20%with quiet inspiration suggests elevated RA pressure. Thismethod of assigning an RA pressure is preferable to assum-ing a fixed RA pressure value for all patients.
B. Right Ventricle
RV Wall Thickness. RV wall thickness is a useful measurement forRVH, usually the result of RVSP overload.16-18 Increased RV thicknesscan be seen in infiltrative and hypertrophic cardiomyopathies, as well
print&
web4C=F
PO
Figure 4 Inferior vena cava (IVC) view. Measurement of the IVC.The diameter (solid line) is measured perpendicular to the longaxis of the IVC at end-expiration, just proximal to the junctionof the hepatic veins that lie approximately 0.5 to 3.0 cm proximalto the ostium of the right atrium (RA).
print&web4C=F
PO
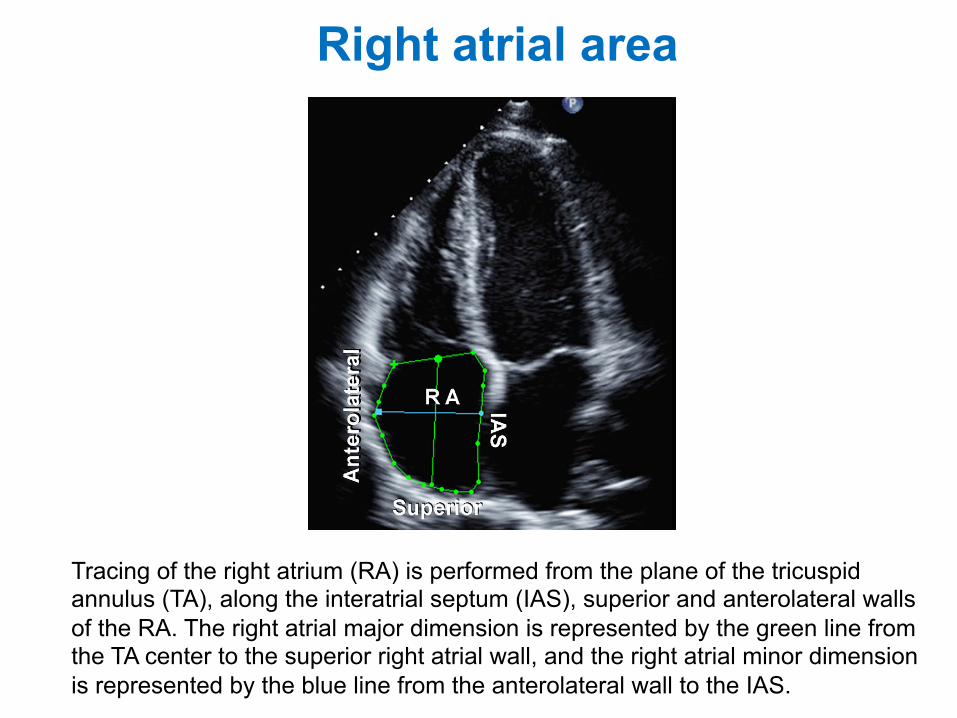
Figure 3 Tracing of the right atrium (RA) is performed from theplane of the tricuspid annulus (TA), along the interatrial septum(IAS), superior and anterolateral walls of the RA. The right atrialmajor dimension is represented by the green line from the TAcenter to the superior right atrial wall, and the right atrial minordimension is represented by the blue line from the anterolateralwall to the IAS.
692 Rudski et al Journal of the American Society of EchocardiographyJuly 2010Right atrial area
Tracing of the right atrium (RA) is performed from the plane of the tricuspid annulus (TA), along the interatrial septum (IAS), superior and anterolateral walls of the RA. The right atrial major dimension is represented by the green line from the TA center to the superior right atrial wall, and the right atrial minor dimension is represented by the blue line from the anterolateral wall to the IAS.
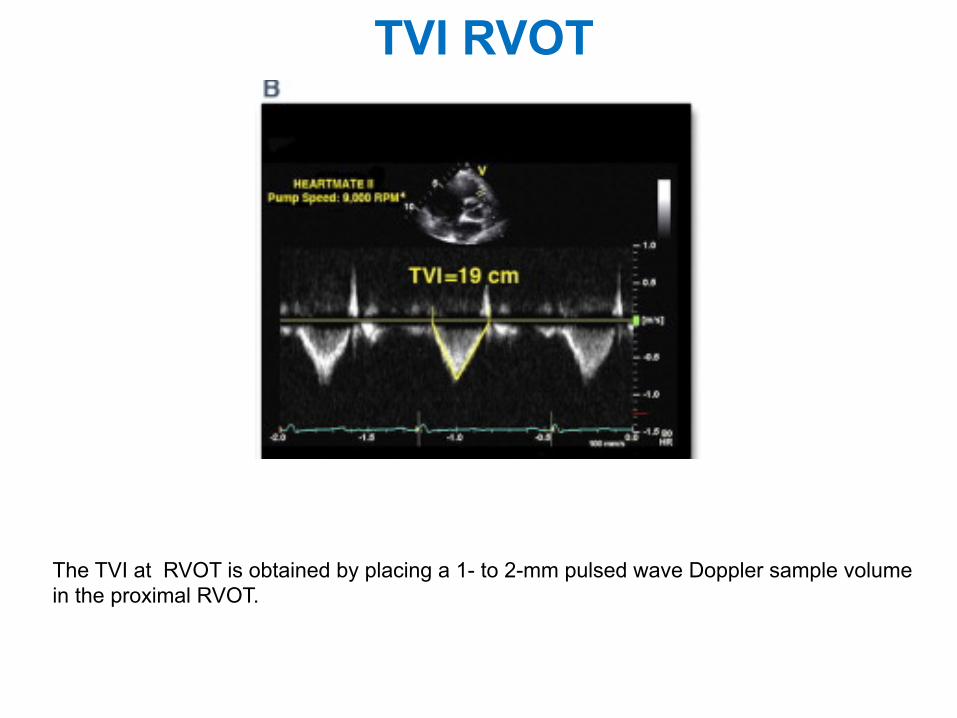
TVI RVOT
The TVI at RVOT is obtained by placing a 1- to 2-mm pulsed wave Doppler sample volume in the proximal RVOT.
patient. There are insufficient data in the elderly. Offlineanalysis by color-coded tissue Doppler currently remainsa research tool, with less data and wider confidence inter-vals for normal values.
Myocardial Acceleration During Isovolumic Contraction.Myocardial acceleration during isovolumic contraction is defined asthe peak isovolumicmyocardial velocity divided by time to peakveloc-ity and is typically measured for the right ventricle by Doppler tissueimaging at the lateral tricuspid annulus (Figure 19). For the calculationof IVA, the onset ofmyocardial acceleration is at the zero crossing pointof myocardial velocity during isovolumic contraction. Isovolumic ac-celeration (IVA) appears to be less loaddependent than ejectionperiodindices under a variety of physiologic conditions.118-121
In a series of cardiac patients under anesthesia, RV IVA appeared tobe the most consistent tissue Doppler variable for the evaluation ofRV function measured by either transthoracic echocardiography (lat-
eral wall) or transesophageal echocardiography (inferior wall).122 RVIVA has been demonstrated to correlate with the severity of illness inconditions affecting right heart function, including obstructive sleepapnea,123 mitral stenosis,124,125 repaired tetralogy of Fallot withpulmonary regurgitation,126 and transposition of the great arteriesfollowing an atrial switch procedure.127
Normal RV IVA values have been obtained from studies that haveincluded a control group of normal adults and/or children. It appearsto be age dependent, with the highest values found between the agesof 10 and 20 years.128 As with all tissue Doppler indices, the acquisi-tion technique is important to document. Pulsed-wave tissue Dopplervalues are up to 20% higher than color-coded tissue Dopplervalues.116 In addition, IVA has been shown to vary with heartrate,121 and indexing to heart rate may be appropriate in some clinicalsituations. The lower reference limit by pulsed-wave Doppler tissueimaging, pooled from 10 studies, is 2.2 m/s2, with a broad 95%confidence interval of 1.4 to 3.0 (Table 4).
print&
web4C=F
PO
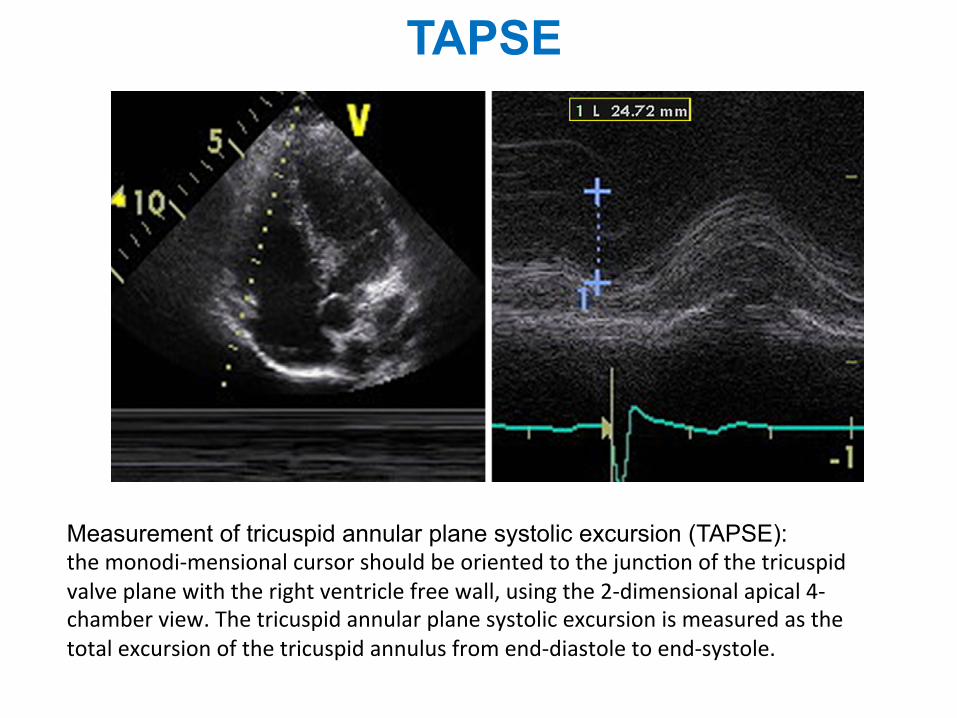
Figure 17 Measurement of tricuspid annular plane systolic excursion (TAPSE).
print&
web4C=F
PO
Figure 18 Tissue Doppler of the tricuspid annulus in a patient with normal right ventricular systolic function: (left) pulsed and (right)color-coded offline analysis.
Journal of the American Society of EchocardiographyVolume 23 Number 7
Rudski et al 703
TAPSE
Measurement of tricuspid annular plane systolic excursion (TAPSE): the monodi-‐mensional cursor should be oriented to the junc1on of the tricuspid valve plane with the right ventricle free wall, using the 2-‐dimensional apical 4-‐chamber view. The tricuspid annular plane systolic excursion is measured as the total excursion of the tricuspid annulus from end-‐diastole to end-‐systole.
Tissue Doppler Imaging of the RV
patient. There are insufficient data in the elderly. Offlineanalysis by color-coded tissue Doppler currently remainsa research tool, with less data and wider confidence inter-vals for normal values.
Myocardial Acceleration During Isovolumic Contraction.Myocardial acceleration during isovolumic contraction is defined asthe peak isovolumicmyocardial velocity divided by time to peakveloc-ity and is typically measured for the right ventricle by Doppler tissueimaging at the lateral tricuspid annulus (Figure 19). For the calculationof IVA, the onset ofmyocardial acceleration is at the zero crossing pointof myocardial velocity during isovolumic contraction. Isovolumic ac-celeration (IVA) appears to be less loaddependent than ejectionperiodindices under a variety of physiologic conditions.118-121
In a series of cardiac patients under anesthesia, RV IVA appeared tobe the most consistent tissue Doppler variable for the evaluation ofRV function measured by either transthoracic echocardiography (lat-
eral wall) or transesophageal echocardiography (inferior wall).122 RVIVA has been demonstrated to correlate with the severity of illness inconditions affecting right heart function, including obstructive sleepapnea,123 mitral stenosis,124,125 repaired tetralogy of Fallot withpulmonary regurgitation,126 and transposition of the great arteriesfollowing an atrial switch procedure.127
Normal RV IVA values have been obtained from studies that haveincluded a control group of normal adults and/or children. It appearsto be age dependent, with the highest values found between the agesof 10 and 20 years.128 As with all tissue Doppler indices, the acquisi-tion technique is important to document. Pulsed-wave tissue Dopplervalues are up to 20% higher than color-coded tissue Dopplervalues.116 In addition, IVA has been shown to vary with heartrate,121 and indexing to heart rate may be appropriate in some clinicalsituations. The lower reference limit by pulsed-wave Doppler tissueimaging, pooled from 10 studies, is 2.2 m/s2, with a broad 95%confidence interval of 1.4 to 3.0 (Table 4).
print&
web4C=F
PO
Figure 17 Measurement of tricuspid annular plane systolic excursion (TAPSE).
print&
web4C=F
PO
Figure 18 Tissue Doppler of the tricuspid annulus in a patient with normal right ventricular systolic function: (left) pulsed and (right)color-coded offline analysis.
Journal of the American Society of EchocardiographyVolume 23 Number 7
Rudski et al 703
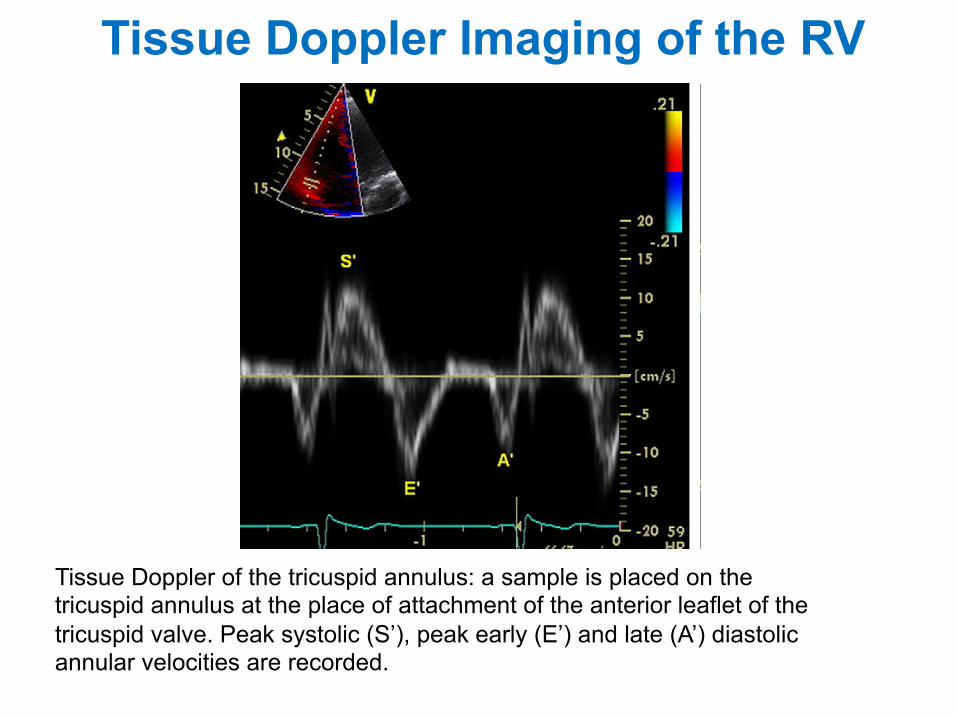
Tissue Doppler of the tricuspid annulus: a sample is placed on the tricuspid annulus at the place of attachment of the anterior leaflet of the tricuspid valve. Peak systolic (S’), peak early (E’) and late (A’) diastolic annular velocities are recorded.
to it. Although a distended IVC usually denotes elevated RA pres-sures, in patients with otherwise normal exam results, reassessingthe IVC size and collapsibility in the left lateral position may be usefulto avoid the potentially erroneous inference of increased RA fillingpressure. The IVC may also be dilated in normal young athletes,and in this population, it may not reflect elevated RA pressure.
Hepatic vein flow patterns provide complementary insights intoRA pressure. At low or normal RA pressures, there is systolic pre-dominance in hepatic vein flow, such that the velocity of the systolicwave (Vs) is greater than the velocity of the diastolic wave (Vd). Atelevated RA pressures, this systolic predominance is lost, such thatVs is substantially decreased and Vs/Vd is <1. The hepatic vein sys-tolic filling fraction is the ratio Vs/(Vs + Vd), and a value < 55% wasfound to be the most sensitive and specific sign of elevated RA pres-sure.15 Importantly, hepatic vein flow velocities have been validatedin mechanically ventilated patients, provided that the velocities areaveraged over $5 consecutive beats and comprising $1 respiratorycycle.
Other 2D signs of increased RA pressure include a dilated rightatrium and an interatrial septum that bulges into the left atriumthroughout the cardiac cycle. These are qualitative and comparative,and do not allow the interpreter to assign an RA pressure but if pres-ent should prompt a more complete evaluation of RA pressure as wellas a search for possible etiologies.
Advantages: IVC dimensions are usually obtainable from thesubcostal window.
Disadvantages: IVC collapse does not accurately reflect RApressure in ventilator-dependent patients. It is less reliable for interme-diate values of RA pressure.
Recommendations: For simplicity and uniformity of re-porting, specific values of RA pressure, rather than ranges,should be used in the determination of SPAP. IVC diameter# 2.1 cm that collapses >50% with a sniff suggests a normalRA pressure of 3 mm Hg (range, 0-5 mm Hg), whereas anIVC diameter > 2.1 cm that collapses <50% with a sniff sug-gests a high RA pressure of 15 mm Hg (range, 10-20 mmHg). In indeterminate cases in which the IVC diameterand collapse do not fit this paradigm, an intermediate valueof 8 mm Hg (range, 5-10 mm Hg) may be used, or, prefera-bly, secondary indices of elevated RA pressure should be in-tegrated. These include restrictive right-sided diastolicfilling pattern, tricuspid E/E0 ratio > 6, and diastolic flowpredominance in the hepatic veins (which can be quanti-fied as a systolic filling fraction < 55%). In indeterminatecases, if none of these secondary indices of elevated RApressure are present, RA pressure may be downgraded to3 mm Hg. If there is minimal IVC collapse with a sniff(<35%) and secondary indices of elevated RA pressure arepresent, RA pressure may be upgraded to 15 mm Hg. If un-certainty remains, RA pressure may be left at the interme-diate value of 8 mm Hg. In patients who are unable toadequately perform a sniff, an IVC that collapses < 20%with quiet inspiration suggests elevated RA pressure. Thismethod of assigning an RA pressure is preferable to assum-ing a fixed RA pressure value for all patients.
B. Right Ventricle
RV Wall Thickness. RV wall thickness is a useful measurement forRVH, usually the result of RVSP overload.16-18 Increased RV thicknesscan be seen in infiltrative and hypertrophic cardiomyopathies, as well
print&
web4C=F
PO
Figure 4 Inferior vena cava (IVC) view. Measurement of the IVC.The diameter (solid line) is measured perpendicular to the longaxis of the IVC at end-expiration, just proximal to the junctionof the hepatic veins that lie approximately 0.5 to 3.0 cm proximalto the ostium of the right atrium (RA).
print&web4C=F
PO
Figure 3 Tracing of the right atrium (RA) is performed from theplane of the tricuspid annulus (TA), along the interatrial septum(IAS), superior and anterolateral walls of the RA. The right atrialmajor dimension is represented by the green line from the TAcenter to the superior right atrial wall, and the right atrial minordimension is represented by the blue line from the anterolateralwall to the IAS.
692 Rudski et al Journal of the American Society of EchocardiographyJuly 2010Vena cava diameter
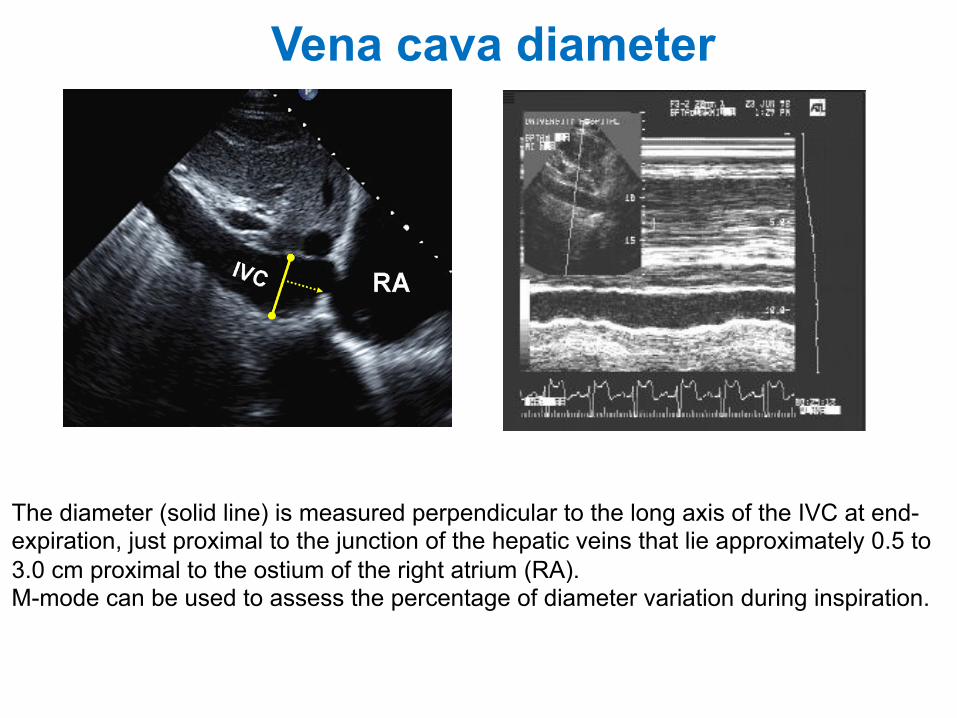
The diameter (solid line) is measured perpendicular to the long axis of the IVC at end-expiration, just proximal to the junction of the hepatic veins that lie approximately 0.5 to 3.0 cm proximal to the ostium of the right atrium (RA). M-mode can be used to assess the percentage of diameter variation during inspiration.
Tricuspidal peak velocity
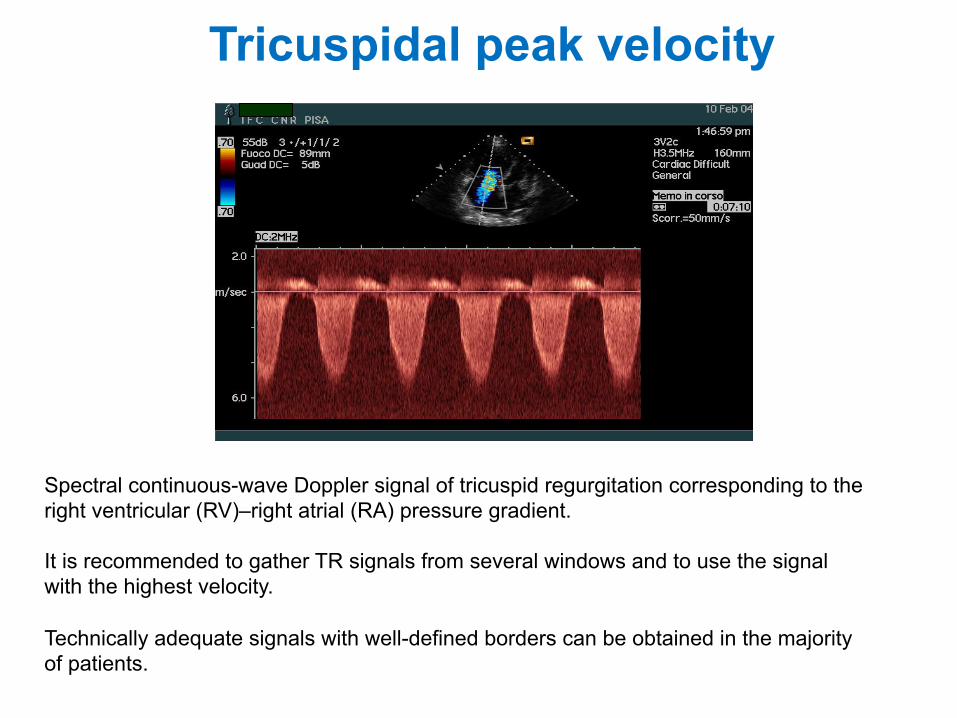
Spectral continuous-wave Doppler signal of tricuspid regurgitation corresponding to the right ventricular (RV)–right atrial (RA) pressure gradient. It is recommended to gather TR signals from several windows and to use the signal with the highest velocity. Technically adequate signals with well-defined borders can be obtained in the majority of patients.
Parameters required (2)
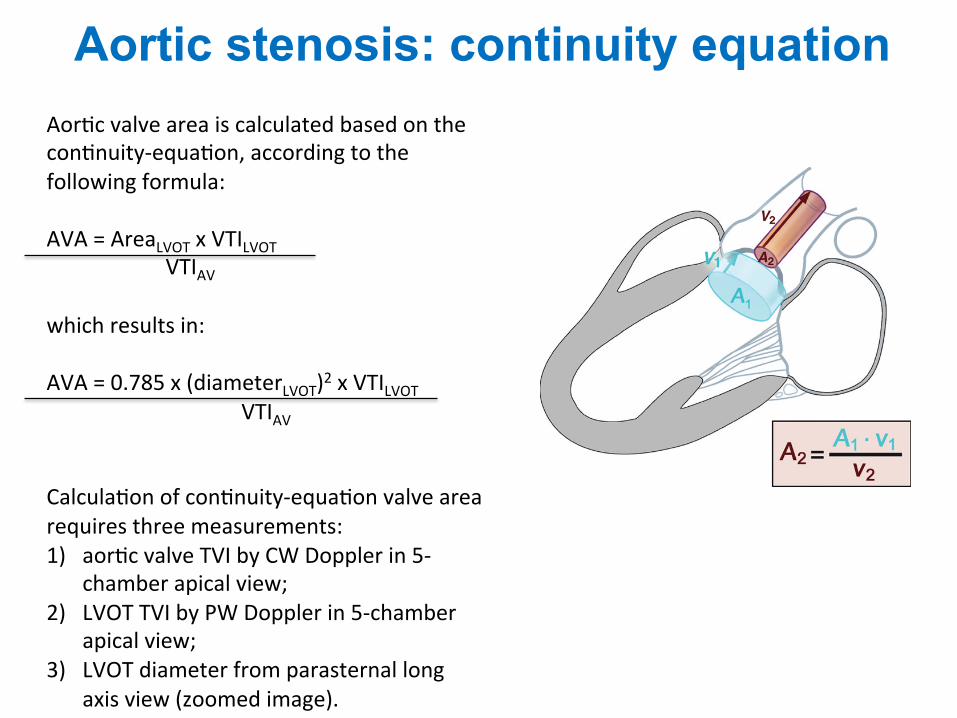
Aortic stenosis: continuity equation
In addition, the simplified Bernoulli equation assumes that theproximal velocity can be ignored, a reasonable assumptionwhen velocity is ,1 m/s because squaring a number ,1makes it even smaller. When the proximal velocity is over1.5 m/s or the aortic velocity is ,3.0 m/s, the proximal vel-ocity should be included in the Bernoulli equation so that
DP ! 4 v2max " v2
proximal
! "
when calculating maximum gradients. It is more problematicto include proximal velocity in mean gradient calculations aseach point on the ejection curve for the proximal and jet vel-ocities would need to be matched and this approach is notused clinically. In this situation, maximum velocity and gradi-ent should be used to grade stenosis severity.
Sources of error for pressure gradient calculationsIn addition to the above-mentioned sources of error
(malalignment of jet and ultrasound beam, recording ofMR jet, neglect of an elevated proximal velocity), thereare several other limitations of transaortic pressure gradientcalculations. Most importantly, any underestimation ofaortic velocity results in an even greater underestimationin gradients, due to the squared relationship between vel-ocity and pressure difference. There are two additional con-cerns when comparing pressure gradients calculated fromDoppler velocities to pressures measured at cardiac cathe-terization. First, the peak gradient calculated from themaximum Doppler velocity represents the maximum instan-taneous pressure difference across the valve, not the differ-ence between the peak LV and peak aortic pressuremeasured from the pressure tracings. Note that peak LVand peak aortic pressure do not occur at the same point intime; so, this difference does not represent a physiologicalmeasurement and this peak-to-peak difference is less thanthe maximum instantaneous pressure difference. Thesecond concern is the phenomenon of pressure recovery(PR). The conversion of potential energy to kinetic energyacross a narrowed valve results in a high velocity and adrop in pressure. However, distal to the orifice, flow decele-rates again. Although some of the kinetic energy dissipatesinto heat due to turbulences and viscous losses, some ofthe kinetic energy will be reconverted into potentialenergy with a corresponding increase in pressure, theso-called PR. Pressure recovery is greatest in stenoses withgradual distal widening since occurrence of turbulences isthen reduced. Aortic stenosis with its abrupt wideningfrom the small orifice to the larger aorta has an unfavour-able geometry for pressure recovery. In AS, PR (in mmHg)can indeed be calculated from the Doppler gradient thatcorresponds to the initial pressure drop across the valve(i.e. 4v2), the effective orifice area as given by the continu-ity equation (EOA) and the cross-sectional area (CSA) of theascending aorta (AoA) by the following equation: PR ! 4v2 #2EOA/AoA # (12EOA/AoA).11 Thus, PR is basically relatedto the ratio of EOA/AoA. As a relatively small EOA is requiredto create a relevant gradient, AoA must also be relativelysmall to end up with a ratio favouring PR. For clinical pur-poses, aortic sizes, therefore, appear to be the key playerand PR must be taken into account primarily in patientswith a diameter of the ascending aorta ,30 mm.11 It maybe clinically relevant particularly in congenital AS.However, in most adults with native AS, the magnitude ofPR is small and can be ignored as long as the diameter of
the aorta is .30 mm. When the aorta is ,30 mm,however, one should be aware that the initial pressuredrop from LV to the vena contracta as reflected by Dopplermeasurement may be significantly higher than the actualnet pressure drop across the stenosis, which representsthe pathophysiologically relevant measurement.11
Current guidelines for decision-making in patients withvalvular heart disease recommend non-invasive evaluationwith Doppler echocardiography.1,2,12,13 Cardiac catheteriza-tion is not recommended except in cases where echocardio-graphy is non-diagnostic or is discrepant with clinical data.The prediction of clinical outcomes has been primarilystudied using Doppler velocity data.
B.1.3. Valve area. Doppler velocity and pressure gradientsare flow dependent; for a given orifice area, velocity andgradient increase with an increase in transaortic flow rate,and decrease with a decrease in flow rate. Calculation ofthe stenotic orifice area or aortic valve area (AVA) ishelpful when flow rates are very low or very high,although even the degree of valve opening varies to somedegree with flow rate (see below).
Aortic valve area is calculated based on the continuity-equation (Figure 4) concept that the stroke volume (SV)ejected through the LV outflow tract (LVOT) all passes throughthe stenotic orifice (AVA) and thus SV is equal at both sites:
SVAV ! SVLVOT:
Because volume flow rate through any CSA is equal tothe CSA times flow velocity over the ejection period(the VTI of the systolic velocity curve), this equation canbe rewritten as:
AVA# VTIAV ! CSALVOT # VTILVOT
Solving for AVA yields the continuity equation14,15
AVA ! CSALVOT # VTILVOT
VTIAV
Calculation of continuity-equation valve area requiresthree measurements:
Figure 4 Schematic diagram of continuity equation.
H. Baumgartner et al.6Aor1c valve area is calculated based on the con1nuity-‐equa1on, according to the following formula: AVA = AreaLVOT x VTILVOT VTIAV which results in: AVA = 0.785 x (diameterLVOT)2 x VTILVOT VTIAV Calcula1on of con1nuity-‐equa1on valve area requires three measurements: 1) aor1c valve TVI by CW Doppler in 5-‐
chamber apical view; 2) LVOT TVI by PW Doppler in 5-‐chamber
apical view; 3) LVOT diameter from parasternal long
axis view (zoomed image).
to AS) may cause MR severity overestimation if jet size isprimarily used to evaluate MR. Careful evaluation of MRmechanism is crucial for the decision whether to alsooperate on the mitral valve.
Mitral stenosis (MS) may result in low cardiac output and,therefore, low-flow low-gradient AS.
B.4.7. High cardiac output. High cardiac output in patientson haemodialysis, with anaemia, AV fistula, or other highflow conditions may cause relatively high gradients inthe presence of mild or moderate AS. This may lead tomisdiagnosis of severe disease particularly when it isdifficult to calculate AVA in the presence of dynamic LVOTobstruction. In this situation, the shape of the CWDspectrum with a very early peak may help to quantify theseverity correctly.
B.4.8. Ascending aorta. In addition to evaluation of ASaetiology and haemodynamic severity, the echocardiographicevaluation of adults with aortic valve disease should includeevaluation of the aorta with measurement of diameters atthe sinuses of Valsalva and ascending aorta. Aortic rootdilation is associated with bicuspid aortic valve disease, thecause of AS in 50% of adults and aortic size may impact thetiming and type of intervention. In some cases, additionalimaging with CTor CMR may beneeded to fully assess the aorta.
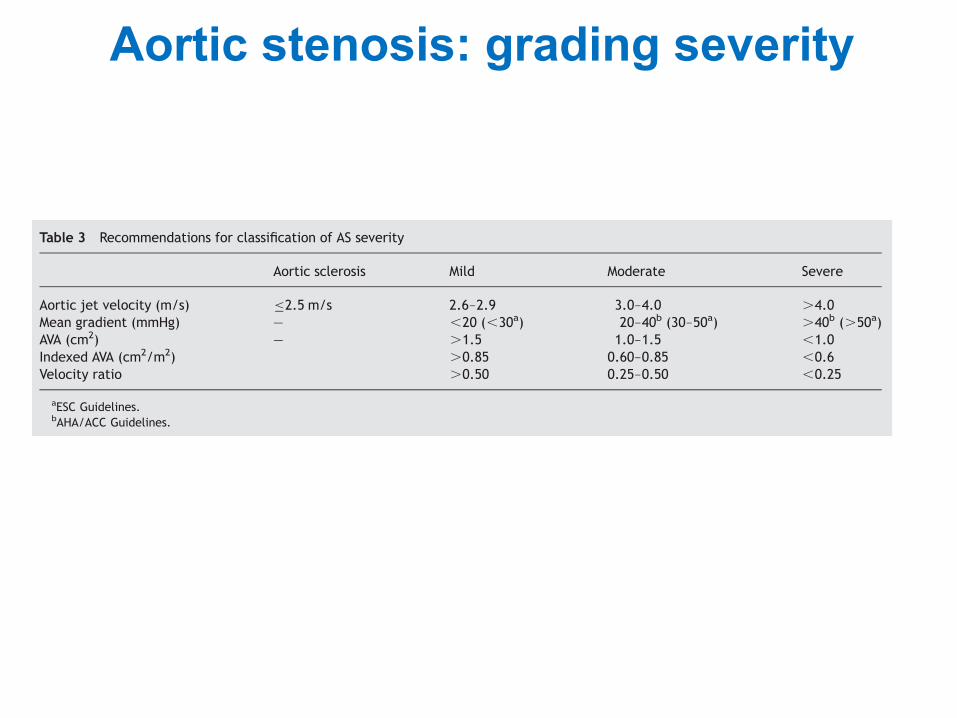
C. How to grade aortic stenosisAortic stenosis severity is best described by the specificnumerical measures of maximum velocity, mean gradient,and valve area. However, general guidelines have been setforth by the ACC/AHA and ESC for categorizing AS severityas mild, moderate, or severe to provide guidance for clinicaldecision-making. In most patients, these three Level I rec-ommended parameters, in conjunction with clinical data,evaluation of AR and LV functions, are adequate for clinicaldecision-making. However, in selected patients, such asthose with severe LV dysfunction, additional measurementsmay be helpful. Comparable values for indexed valvearea and the dimensionless velocity ratio have been indi-cated in Table 3, and the category of aortic sclerosis, as dis-tinct from mild stenosis, has been added. When aorticsclerosis is present, further quantitation is not needed. Inevaluation of a patient with valvular heart disease, thesecut-off values should be viewed with caution; no single cal-culated number should be relied on for final judgement.Instead, an integrated approach considering AVA, velocity/gradient together with LVF, flow status, and clinicalpresentation is strongly recommended. The ACC/AHA andESC Guidelines for management of valvular heart disease
provide recommendations for classification of severity(Table 3).1,2
A normal AVA in adults is !3.0–4.0 cm2. Severe stenosis ispresent when valve area is reduced to !25% of the normalsize so that a value of 1.0 cm2 is one reasonable definitionof severe AS in adults. The role of indexing for body size iscontroversial, primarily because the current algorithms fordefining body size [such as body-surface area (BSA)] do notnecessarily reflect the normal AVA in obese patients,because valve area does not increase with excess bodyweight. However, indexing valve area for BSA is importantin children, adolescents, and small adults as valve areamay seem severely narrowed when only moderate stenosisis present. Another approach to indexing for body size isto consider the LVOT to AS velocity ratio, in addition tovalve area, in clinical decision-making.
We recommend reporting of both AS maximum velocityand mean gradient. In observational clinical studies, amaximum jet velocity of 4 m/s corresponds to a mean gradi-ent of !40 mmHg and a maximum velocity of 3 m/s corre-sponds to a mean gradient of !20 mmHg. Although thereis overall correlation between peak gradient and mean gra-dient, the relationship between peak and mean gradientsdepends on the shape of the velocity curve, which varieswith stenosis severity and flow rate.
In clinical practice, many patients have an apparent dis-crepancy in stenosis severity as defined by maximum vel-ocity (and mean gradient) compared with the calculatedvalve area.
The first step in patients with either a valve area larger orsmaller than expected for a given AS maximum velocity (ormean gradient) is to verify the accuracy of the echocardio-graphic data (see above for sources of error).
The next step in evaluation of an apparent discrepancy inmeasure of AS severity is to evaluate LV ejection fractionand the severity of co-existing AR. If cardiac output is lowdue to small ventricular chamber or a low ejection fraction,a low AS velocity may be seen with a small valve area. If trans-aortic flow rate is high due to co-existing AR, valve area maybe !1.0 cm2 even though AS velocity and mean gradient arehigh. It may be useful to compare the SV calculated fromthe LVOT diameter and velocity with the SV measured on 2Dechocardiography by the biplane apical method, to confirma low or high transaortic volume flow rate.
When review of primary data confirms accuracy ofmeasurements and there is no clinical evidence for a revers-ible high output state (e.g. sepsis, hyperthyroidism), thepatient with an AS velocity of .4 m/s and a valve area of!1.0 cm2 most likely has combined moderate AS/AR or alarge body size. The AS velocity is a better predictor of
Table 3 Recommendations for classification of AS severity
Aortic sclerosis Mild Moderate Severe
Aortic jet velocity (m/s) "2.5 m/s 2.6–2.9 3.0–4.0 .4.0Mean gradient (mmHg) — ,20 (,30a) 20–40b (30–50a) .40b (.50a)AVA (cm2) — .1.5 1.0–1.5 ,1.0Indexed AVA (cm2/m2) .0.85 0.60–0.85 ,0.6Velocity ratio .0.50 0.25–0.50 ,0.25
aESC Guidelines.bAHA/ACC Guidelines.
EAE/ASE stenosis recommendations 11
Aortic stenosis: grading severity
Valve disease 43
Table 5.4 Aetiology of aortic regurgitation
Ascending aortic dilatation • Arteriosclerosis, Marfan syndrome,dissection
Valve • Bicuspid Rheumatic Calcific degenerative
• Endocarditis Prolapse Trauma
• Rare e.g. systemic lupus erythematosus,Behçet syndrome, ankylosing spondylitis
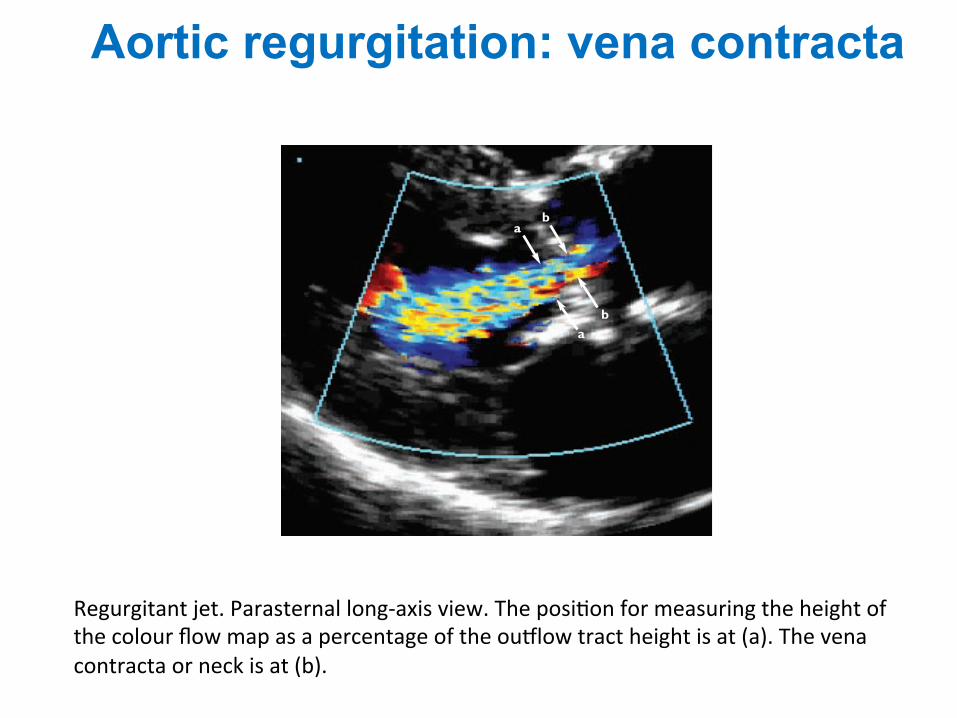
Figure 5.1 Regurgitant jet. Parasternal long-axis view. The position for measuringthe height of the colour flow map as a percentage of the outflow tract height is at(a). The vena contracta or neck is at (b)
a
a
b
b
ch05 4/5/07 1:33 pm Page 43
Regurgitant jet. Parasternal long-‐axis view. The posi1on for measuring the height of the colour flow map as a percentage of the ou<low tract height is at (a). The vena contracta or neck is at (b).
Aortic regurgitation: vena contracta
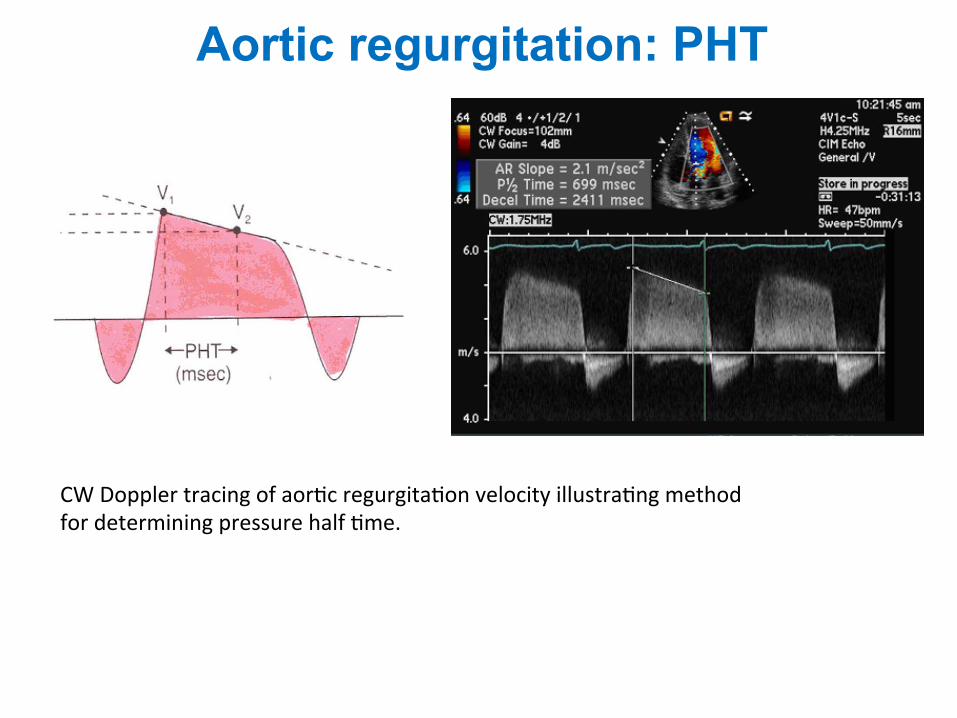
CW Doppler tracing of aor1c regurgita1on velocity illustra1ng method for determining pressure half 1me.
Aortic regurgitation: PHT
Anatomy and function of the pulmonaryvalveThe pulmonary valve is a three-leaflet structure, anatomicallysimilar to the aortic valve. The pulmonic valve structure ishowever thinner because of the lower pressures in the rightthan in the left heart system.
With 2D echo, typically only one or two leaflets can be simul-taneously visualized (Figure 14). On occasion, the pulmonaryvalve can be seen in a short-axis view. In adults, visualization ofthe pulmonary valve is obtained from the parasternal short-axisview at the level of the aortic valve or from a subcostal approach.Evaluation of the pulmonary valve anatomy is however more diffi-cult than for other valves (limited by poor acoustic access). In pul-monary hypertension, the dilatation of pulmonary artery allowsbetter assessment of the valve. The role of TEE in PR is limitedsince the pulmonary valve is more difficult to image with TEE(far from the probe). The views that maximize visualization ofthe pulmonary valve include horizontal (0 degrees) plane imagingat 25–30 cm from the incisors and a deep gastric view in 1208imaging plane.
Aetiology and mechanismsPR may be caused by congenital anomalies (quadricuspid orbicuspid valves), hypoplasia, post-repair of tetralogy of Fallotor prolapse of the pulmonary valve. Other causes include infec-tive endocarditis, carcinoid syndrome, and rheumatic heartdisease. Carcinoid syndrome results in shortening and thicken-ing of the pulmonary valve leaflet, similar to the involvement ofthe tricuspid valve. Myxomatous valve is rare, resulting in
thickening, redundancy, and sagging of the pulmonary valve leaf-lets. As for AR, examining the anatomic abnormalities associ-ated with PR may help define the mechanisms of regurgitationand yield clues to its severity. TTE, TEE, or 3D echo couldprovide useful information regarding anomalies of cuspnumber (bicuspid or quadricuspid valves), motion (doming orprolapse), or structure (hypoplasia, dysplasia, absence of pul-monary valve).18
Assessment of pulmonaryregurgitation severityDetermination of the PR severity has been less validated thandetermination of AR degree.
Colour flow DopplerColour flow imagingDetection of PR relies almost exclusively on colour flow imaging.PR is diagnosed by documenting a diastolic jet in the RV outflowtract directed towards the RV. Pathological PR is distinguishedfrom physiological PR by a longer duration of flow (holodiastolic)and a wider jet as the regurgitant jet crosses the pulmonic valve.35
Functional PR jets are usually very small, central, and spindle-shaped. In severe PR, where equalization of diastolic pulmonaryartery and RV pressures occurs early in diastole, the colour jetarea can be brief and inaccurate (dependency on the drivingpressure).43 The assessment of PR severity is usually estimatedby the diameter of the jet at its origin.44 The maximum colourjet diameter (width) is measured in diastole immediately below
. . . . . . . . . . . . . . . . . . . . . . . . . . . . . . . . . . . . . . . . . . . . . . . . . . . . . . . . . . . . . . . . . . . . . . . . . . . . . . . . . . . . . . . . . . . . . . . . . . . . . . . . . . . . . . . . . . . . . . . . . . . . . . . . . . . . . . . . . . . . . . . . . . . . . . . . . . . . . . . . . . . . . . . . . . . . . . .
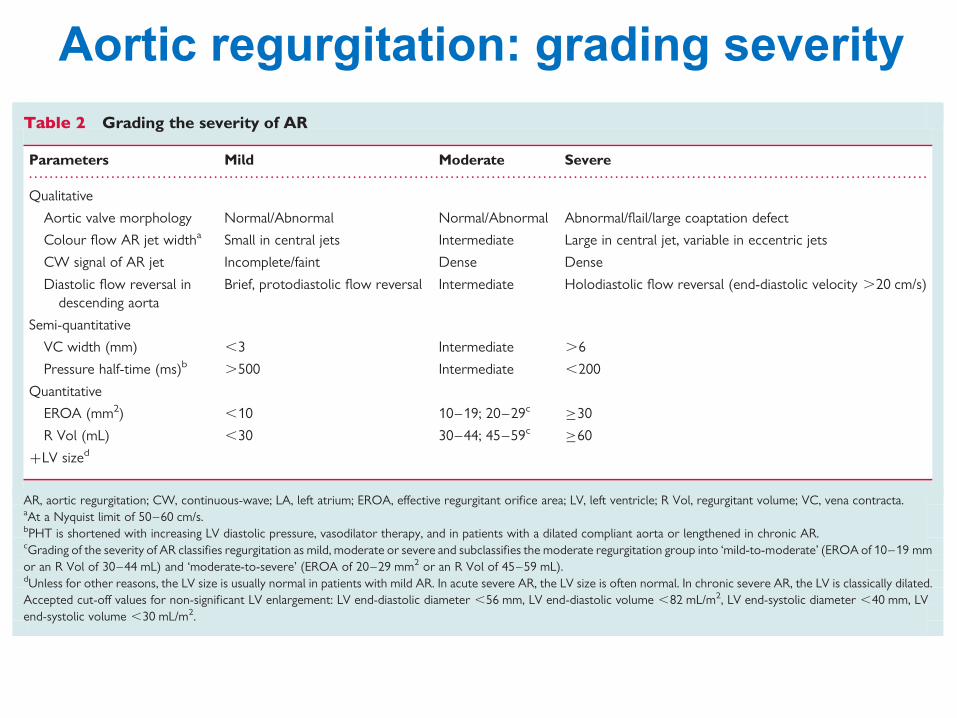
Table 2 Grading the severity of AR
Parameters Mild Moderate Severe
Qualitative
Aortic valve morphology Normal/Abnormal Normal/Abnormal Abnormal/flail/large coaptation defect
Colour flow AR jet widtha Small in central jets Intermediate Large in central jet, variable in eccentric jets
CW signal of AR jet Incomplete/faint Dense Dense
Diastolic flow reversal indescending aorta
Brief, protodiastolic flow reversal Intermediate Holodiastolic flow reversal (end-diastolic velocity .20 cm/s)
Semi-quantitative
VC width (mm) ,3 Intermediate .6
Pressure half-time (ms)b .500 Intermediate ,200
Quantitative
EROA (mm2) ,10 10–19; 20–29c !30
R Vol (mL) ,30 30–44; 45–59c !60
+LV sized
AR, aortic regurgitation; CW, continuous-wave; LA, left atrium; EROA, effective regurgitant orifice area; LV, left ventricle; R Vol, regurgitant volume; VC, vena contracta.aAt a Nyquist limit of 50–60 cm/s.bPHT is shortened with increasing LV diastolic pressure, vasodilator therapy, and in patients with a dilated compliant aorta or lengthened in chronic AR.cGrading of the severity of AR classifies regurgitation as mild, moderate or severe and subclassifies the moderate regurgitation group into ‘mild-to-moderate’ (EROA of 10–19 mmor an R Vol of 30–44 mL) and ‘moderate-to-severe’ (EROA of 20–29 mm2 or an R Vol of 45–59 mL).dUnless for other reasons, the LV size is usually normal in patients with mild AR. In acute severe AR, the LV size is often normal. In chronic severe AR, the LV is classically dilated.Accepted cut-off values for non-significant LV enlargement: LV end-diastolic diameter ,56 mm, LV end-diastolic volume ,82 mL/m2, LV end-systolic diameter ,40 mm, LVend-systolic volume ,30 mL/m2.
Recommendations for the assessment of valvular regurgitation 237
at ESC M
ember (EJE) on M
ay 25, 2010ejechocard.oxfordjournals.org
Dow
nloaded from
Aortic regurgitation: grading severity
peak instantaneous and the mean pressure gradientacross the stenosis. The mean gradient is obtainedby averaging the instantaneous gradients. Currentultrasound systems contain software to derive thepeak velocity, VTI, and mean gradients from a trac-ing of the velocity envelope. It is important toinclude both heart rate and rhythm when reportingvalve gradients.The Doppler equation is fairly accu-rate in deriving the pressure gradient across a tightstenosis. However, in AS the phenomenon of pres-sure recovery may result in a higher gradient byDoppler than the gradient measured by catheter,particularly if the distal pressure is recorded sever-al centimeters away from the stenotic valve. In prac-tice, the error is small and of minimal clinical sig-nificance.
Valve area measurements with the continuityequation. The continuity equation states that theflow passing through a stenotic valve is equal to theflow proximal to the stenosis (Figure 13). Given thatflow equals velocity multiplied by CSA, if flow isknown the area of stenosis can be derived as:
Stenotic area = Flow/Velocity across stenosis (6)
AS is the most common lesion for which the con-tinuity equation is used.4,44,45 The flow volume rep-resents the SV across the aortic valve, determined atthe LV outflow. In AS, however, the sample volumemust be positioned carefully to not be within theprestenotic flow acceleration region. Place the sam-ple volume 1 cm proximal to the aortic valve whilerecording the velocity.Then, slowly move the sample
Journal of the American Society of Echocardiography176 Quiñones et al February 2002
volume toward the valve until an increase in veloci-ty and spectral broadening is seen. Thereafter, thesample volume is moved back until a narrow band offlow velocities is obtained.The denominator of thecontinuity equation is the integral of the stenotic jet.Consequently, the maximal AS velocity must berecorded by aligning the CW beam as parallel as pos-sible to the stenotic jet. This is best accomplishedwith a nonimaging CW transducer that uses multiplewindows of interrogation.
In mitral stenosis, the continuity equation is usefulin situations for which the pressure half-timemethod is limited. However, in this lesion accuratelydetermining flow across the mitral annulus is diffi-cult. SV is therefore measured at the aortic annulusand used in the numerator of the equation; thedenominator is the integral of the mitral stenosis jet.The method is quite accurate in the absence of asso-ciated mitral regurgitation (MR).5
Mitral valve area with the pressure half-timemethod. The pressure half-time (P1/2t) method is asimple and accurate method of determining valvearea in mitral stenosis (Figure 14). Pressure half-timerepresents the time that the maximal pressure gradi-ent takes to decrease by one half.When expressed interms of velocity, this time is equivalent to the timethat the peak stenotic velocity takes to drop by 30%.Early studies established an inverse relation betweenP1/2t and mitral valve area (MVA),46 and from thisrelation the following empirical equation wasderived:
MVA = 220/P1/2t (7)
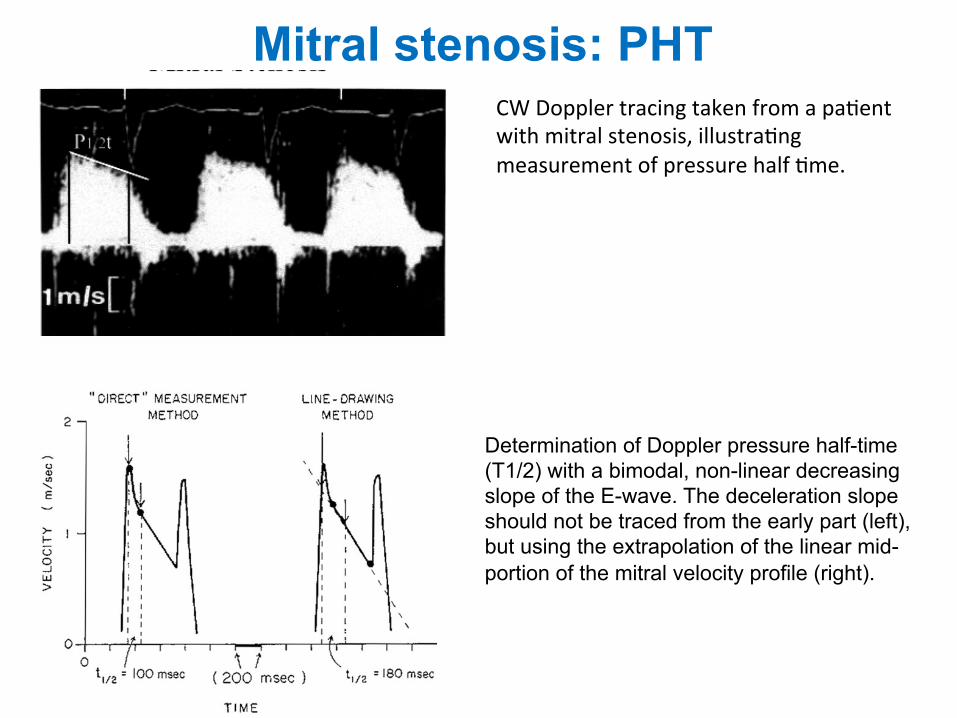
Figure 14 CW Doppler tracing taken from a patient withmitral stenosis, illustrating measurement of pressure halftime.
Figure 15 CW Doppler recording of transmitral velocityin a patient with mitral stenosis. Velocity pattern showsrapid early deceleration that decelerates to mid-diastole,giving rise to “ski slope” appearance. In these cases, esti-mating pressure half time from the slower component ofvelocity descent is better, as illustrated in second cardiaccycle.
CW Doppler tracing taken from a pa1ent with mitral stenosis, illustra1ng measurement of pressure half 1me.
Mitral stenosis: PHT
associated severe AR. The role of impaired LV diastolic func-tion is more difficult to assess because of complex and com-peting interactions between active relaxation andcompliance as regards their impact on diastolic transmitralflow.58 Early diastolic deceleration time is prolonged whenLV relaxation is impaired, while it tends to be shortened incase of decreased LV compliance.59 Impaired LV diastolicfunction is a likely explanation of the lower reliability ofT1/2 to assess MVA in the elderly.60 This concerns patientswith rheumatic MS and, even more, patients with degenera-tive calcific MS which is a disease of the elderly often associ-ated with AS and hypertension and, thus, impaired diastolicfunction. Hence, the use of T1/2 in degenerative calcific MSmay be unreliable and should be avoided.
B.1.4. Continuity equation (Level 2 Recommendation). Asin the estimation of AVA, the continuity equation is basedon the conservation of mass, stating in this case that thefilling volume of diastolic mitral flow is equal to aortic SV.
MVA ! pD2
4
! "VTIAortic
VTIMitral
! "
where D is the diameter of the LVOT (in cm) and VTI is incm.61
Stroke volume can also be estimated from the pulmonaryartery; however, this is rarely performed in practice becauseof limited acoustic windows.
The accuracy and reproducibility of the continuityequation for assessing MVA are hampered by the numberof measurements increasing the impact of errors ofmeasurements.
The continuity equation cannot be used in cases of atrialfibrillation or associated significant MR or AR.
B.1.5. Proximal isovelocity surface area method (Level 2Recommendation). The proximal isovelocity surface areamethod is based on the hemispherical shape of theconvergence of diastolic mitral flow on the atrial side ofthe mitral valve, as shown by colour Doppler. It enables
mitral volume flow to be assessed and, thus, to determineMVA by dividing mitral volume flow by the maximumvelocity of diastolic mitral flow as assessed by CWD.
MVA ! p r2# $"Valiasing#= peak VMitral $ a=180W
where r is the radius of the convergence hemisphere (in cm),Valiasing is the aliasing velocity (in cm/s), peak VMitral thepeak CWD velocity of mitral inflow (in cm/s), and a is theopening angle of mitral leaflets relative to flow direction.62
This method can be used in the presence of significant MR.However, it is technically demanding and requires multiplemeasurements. Its accuracy is impacted upon by uncertain-ties in the measurement of the radius of the convergencehemisphere, and the opening angle.
The use of colour M-mode improves its accuracy, enablingsimultaneous measurement of flow and velocity.62
B.1.6. Other indices of severity. Mitral valve resistance(Level 3 Recommendation) is defined as the ratio of meanmitral gradient to transmitral diastolic flow rate, which iscalculated by dividing SV by diastolic filling period. Mitralvalve resistance is an alternative measurement of theseverity of MS, which has been argued to be less dependenton flow conditions. This is, however, not the case. Mitralvalve resistance correlates well with pulmonary arterypressure; however, it has not been shown to have anadditional value for assessing the severity of MS as comparedwith valve area.63
The estimation of pulmonary artery pressure, usingDoppler estimation of the systolic gradient between rightventricle (RV) and right atrium, reflects the consequencesof MS rather than its severity itself. Although it is advisedto check its consistency with mean gradient and valvearea, there may be a wide range of pulmonary arterypressure for a given valve area.1,2 Nevertheless, pulmonaryartery pressure is critical for clinical decision-making and itis therefore very important to provide this measurement.
B.2. Other echocardiographic factors in the evaluation ofmitral stenosisB.2.1. Valve anatomy. Evaluation of anatomy is a majorcomponent of echocardiographic assessment of MS becauseof its implications on the choice of adequate intervention.
Commissural fusion is assessed from the short-axis paraster-nal view used for planimetry. The degree of commissuralfusion is estimated by echo scanning of the valve. However,commissural anatomy may be difficult to assess, in particularin patients with severe valve deformity. Commissures arebetter visualized using real-time 3D echocardiography.52
Commissural fusion is an important feature to distinguishrheumatic from degenerative MS and to check the consistencyof severity measurements. Complete fusion of both commis-sures generally indicates severe MS. On the other hand, thelack of commissural fusion does not exclude significant MS indegenerative aetiologies or even rheumatic MS, where reste-nosis after previous commissurotomy may be related tovalve rigidity with persistent commissural opening.
Echocardiographic examination also evaluates leafletthickening and mobility in long-axis parasternal view.Chordal shortening and thickening are assessed using long-axis parasternal and apical views. Increased echo brightnesssuggests calcification, which is best confirmed by fluoro-scopic examination. The report should also mention the
Figure 10 Determination of Doppler pressure half-time (T1/2) witha bimodal, non-linear decreasing slope of the E-wave. The decelera-tion slope should not be traced from the early part (left), but usingthe extrapolation of the linear mid-portion of the mitral velocityprofile (right). (Reproduced from Gonzalez et al.54).
EAE/ASE stenosis recommendations 15
Determination of Doppler pressure half-time (T1/2) with a bimodal, non-linear decreasing slope of the E-wave. The deceleration slope should not be traced from the early part (left), but using the extrapolation of the linear mid-portion of the mitral velocity profile (right).
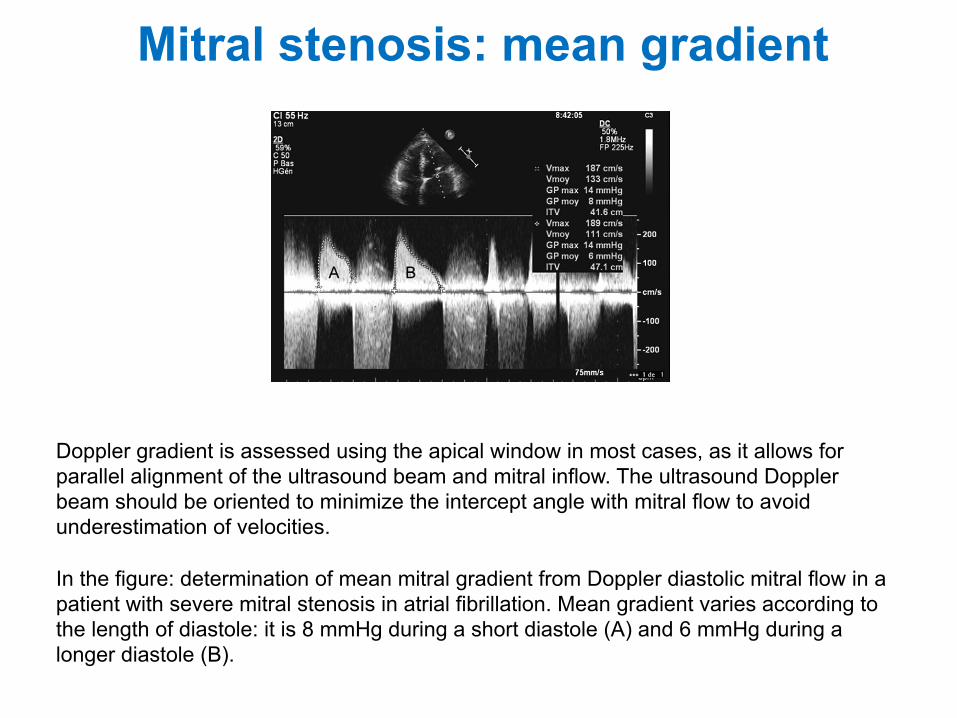
Doppler gradient is assessed using the apical window in most cases, as it allows for parallel alignment of the ultrasound beam and mitral inflow. The ultrasound Doppler beam should be oriented to minimize the intercept angle with mitral flow to avoid underestimation of velocities. In the figure: determination of mean mitral gradient from Doppler diastolic mitral flow in a patient with severe mitral stenosis in atrial fibrillation. Mean gradient varies according to the length of diastole: it is 8 mmHg during a short diastole (A) and 6 mmHg during a longer diastole (B).
dependent on the mitral valve area (MVA) as well as anumber of other factors that influence transmitral flowrate, the most important being heart rate, cardiac output,and associated MR.46 However, the consistency betweenmean gradient and other echocardiographic findings shouldbe checked, in particular in patients with poor quality ofother variables (especially planimetry of valve area) orwhen such variables may be affected by additional con-ditions [i.e. pressure half-time (T1/2) in the presence of LVdiastolic dysfunction; see below]. In addition, mean mitralgradient has its own prognostic value, in particular followingballoon mitral commissurotomy.
B.1.2. MVA Planimetry (Level 1 Recommendation).Theoretically, planimetry using 2D echocardiography of themitral orifice has the advantage of being a directmeasurement of MVA and, unlike other methods, does notinvolve any hypothesis regarding flow conditions, cardiacchamber compliance, or associated valvular lesions. Inpractice, planimetry has been shown to have the bestcorrelation with anatomical valve area as assessed onexplanted valves.47 For these reasons, planimetry isconsidered as the reference measurement of MVA.1,2
Planimetry measurement is obtained by direct tracing ofthe mitral orifice, including opened commissures, if appli-cable, on a parasternal short-axis view. Careful scanningfrom the apex to the base of the LV is required to ensure
that the CSA is measured at the leaflet tips. The measure-ment plane should be perpendicular to the mitral orifice,which has an elliptical shape (Figure 8).
Gain setting should be just sufficient to visualize thewhole contour of the mitral orifice. Excessive gain settingmay cause underestimation of valve area, in particularwhen leaflet tips are dense or calcified. Image magnifi-cation, using the zoom mode, is useful to better delineatethe contour of the mitral orifice. The correlation data onplanimetry was performed with fundamental imaging andit is unclear whether the use of harmonic imaging improvesplanimetry measurement.
The optimal timing of the cardiac cycle to measure plani-metry is mid-diastole. This is best performed using the cine-loop mode on a frozen image.
It is recommended to perform several different measure-ments, in particular in patients with atrial fibrillation and inthose who have incomplete commissural fusion (moderateMS or after commissurotomy), in whom anatomical valvearea may be subject to slight changes according to flowconditions.
Although its accuracy justifies systematic attempts toperform planimetry of MS, it may not be feasible even byexperienced echocardiographers when there is a poor acous-tic window or severe distortion of valve anatomy, in particu-lar with severe valve calcifications of the leaflet tips.Although the percentage of patients in whom planimetry is
Figure 7 Determination of mean mitral gradient from Doppler diastolic mitral flow in a patient with severe mitral stenosis in atrial fibrillation.Mean gradient varies according to the length of diastole: it is 8 mmHg during a short diastole (A) and 6 mmHg during a longer diastole (B).
Figure 8 Planimetry of the mitral orifice. Transthoracic echocardiography, parasternal short-axis view. (A) mitral stenosis. Both commissuresare fused. Valve area is 1.17 cm2. (B) Unicommissural opening after balloon mitral commissurotomy. The postero-medial commissure isopened. Valve area is 1.82 cm2. (C) Bicommissural opening after balloon mitral commissurotomy. Valve area is 2.13 cm2.
EAE/ASE stenosis recommendations 13
Mitral stenosis: mean gradient
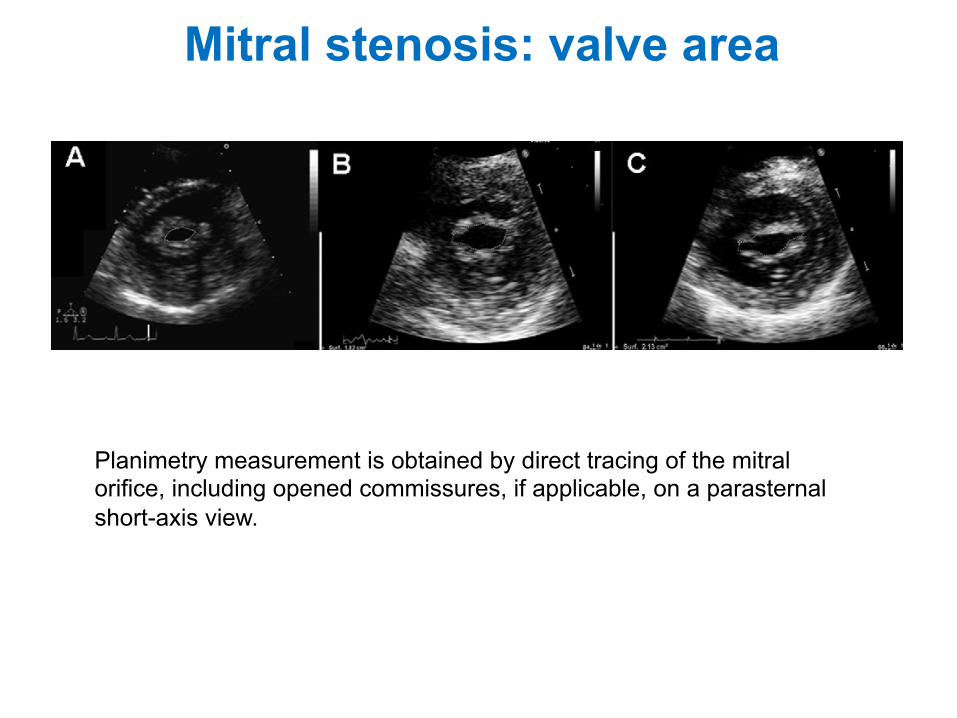
Mitral stenosis: valve area
Planimetry measurement is obtained by direct tracing of the mitral orifice, including opened commissures, if applicable, on a parasternal short-axis view.
dependent on the mitral valve area (MVA) as well as anumber of other factors that influence transmitral flowrate, the most important being heart rate, cardiac output,and associated MR.46 However, the consistency betweenmean gradient and other echocardiographic findings shouldbe checked, in particular in patients with poor quality ofother variables (especially planimetry of valve area) orwhen such variables may be affected by additional con-ditions [i.e. pressure half-time (T1/2) in the presence of LVdiastolic dysfunction; see below]. In addition, mean mitralgradient has its own prognostic value, in particular followingballoon mitral commissurotomy.
B.1.2. MVA Planimetry (Level 1 Recommendation).Theoretically, planimetry using 2D echocardiography of themitral orifice has the advantage of being a directmeasurement of MVA and, unlike other methods, does notinvolve any hypothesis regarding flow conditions, cardiacchamber compliance, or associated valvular lesions. Inpractice, planimetry has been shown to have the bestcorrelation with anatomical valve area as assessed onexplanted valves.47 For these reasons, planimetry isconsidered as the reference measurement of MVA.1,2
Planimetry measurement is obtained by direct tracing ofthe mitral orifice, including opened commissures, if appli-cable, on a parasternal short-axis view. Careful scanningfrom the apex to the base of the LV is required to ensure
that the CSA is measured at the leaflet tips. The measure-ment plane should be perpendicular to the mitral orifice,which has an elliptical shape (Figure 8).
Gain setting should be just sufficient to visualize thewhole contour of the mitral orifice. Excessive gain settingmay cause underestimation of valve area, in particularwhen leaflet tips are dense or calcified. Image magnifi-cation, using the zoom mode, is useful to better delineatethe contour of the mitral orifice. The correlation data onplanimetry was performed with fundamental imaging andit is unclear whether the use of harmonic imaging improvesplanimetry measurement.
The optimal timing of the cardiac cycle to measure plani-metry is mid-diastole. This is best performed using the cine-loop mode on a frozen image.
It is recommended to perform several different measure-ments, in particular in patients with atrial fibrillation and inthose who have incomplete commissural fusion (moderateMS or after commissurotomy), in whom anatomical valvearea may be subject to slight changes according to flowconditions.
Although its accuracy justifies systematic attempts toperform planimetry of MS, it may not be feasible even byexperienced echocardiographers when there is a poor acous-tic window or severe distortion of valve anatomy, in particu-lar with severe valve calcifications of the leaflet tips.Although the percentage of patients in whom planimetry is
Figure 7 Determination of mean mitral gradient from Doppler diastolic mitral flow in a patient with severe mitral stenosis in atrial fibrillation.Mean gradient varies according to the length of diastole: it is 8 mmHg during a short diastole (A) and 6 mmHg during a longer diastole (B).
Figure 8 Planimetry of the mitral orifice. Transthoracic echocardiography, parasternal short-axis view. (A) mitral stenosis. Both commissuresare fused. Valve area is 1.17 cm2. (B) Unicommissural opening after balloon mitral commissurotomy. The postero-medial commissure isopened. Valve area is 1.82 cm2. (C) Bicommissural opening after balloon mitral commissurotomy. Valve area is 2.13 cm2.
EAE/ASE stenosis recommendations 13
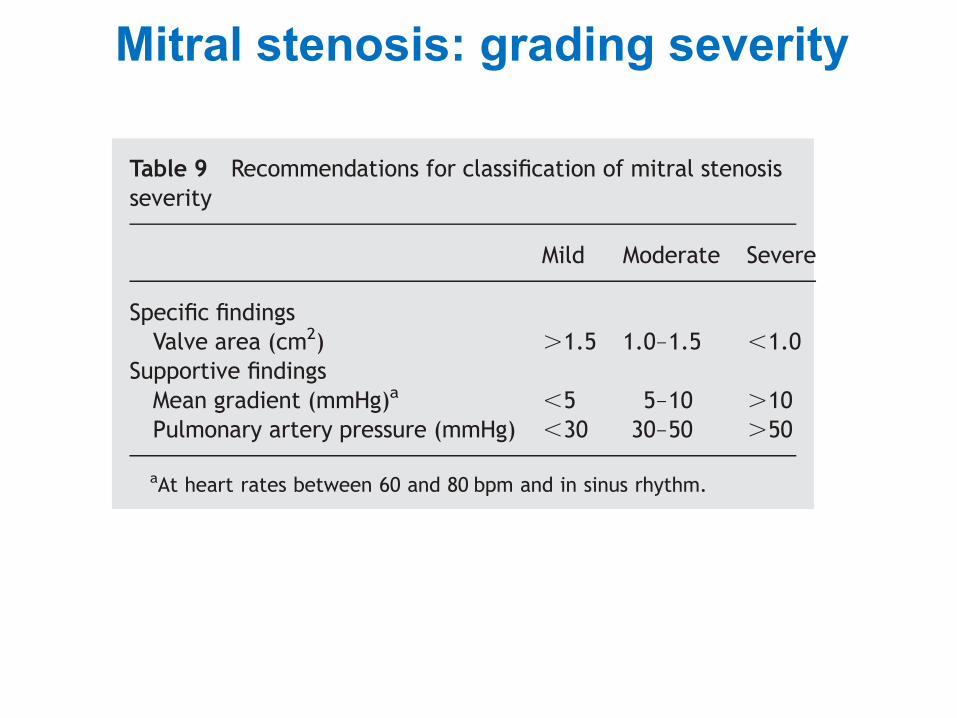
Mitral stenosis: grading severity
pulmonary vascular resistance to be assessed, which may beuseful in the case of severe pulmonary hypertension.
The normal MVA is 4.0–5.0 cm2. An MVA area of .1.5 cm2
usually does not produce symptoms. As the severity of steno-sis increases, cardiac output becomes subnormal at rest andfails to increase during exercise. This is the main reasonfor considering MS significant when MVA is ,1.5 cm2
(Table 9).1,2 Indexing on body-surface area is useful to takeinto account body size. However, no threshold of indexedvalve area is validated and indexing on body-surface areaoverestimates the severity of valve stenosis in obese patients.
Ideally, the severity assessment of rheumatic MS shouldrely mostly on valve area because of the multiple factorsinfluencing other measurements, in particular mean gradi-ent and systolic pulmonary artery pressure. This justifiesattempts to estimate MVA using the above-mentionedmethods even in patients with severe valve deformity. Thevalues of mean gradient and systolic pulmonary arterypressure are only supportive signs and cannot be consideredas surrogate markers of the severity of MS. Abnormal valuessuggest moderate to severe stenosis. However, normalresting values of pulmonary artery pressure may be observedeven in severe MS. In degenerative MS, mean gradient canbe used as a marker of severity given the limitations of pla-nimetry and T1/2.
Stenosis severity is important, although it is only one ofthe numerous patient characteristics involved in decision-making for intervention, as detailed in guidelines.1,2 Inter-vention is not considered in patients with MS and MVA.1.5 cm2, unless in symptomatic patients of large bodysize. When MVA is ,1.5 cm2, the decision to intervene isbased on the consequences of valve stenosis (symptoms,atrial fibrillation, pulmonary artery pressure) and the suit-ability of the patient for balloon mitral commissurotomy.Exercise testing is recommended in patients with MVA,1.5 cm2 who claim to be asymptomatic or with doubtfulsymptoms.
Table 8 Approaches to evaluation of mitral stenosis
Level of recommendations: (1) appropriate in all patients (yellow); (2) reasonable when additional information is needed in selected patients (green); and(3) not recommended (blue).
AR, aortic regurgitation; CSA, cross-sectional area; DFT, diastolic filling time; LA, left atrium; LV, left ventricle; LVOT, left ventricular outflow tract; MR,mitral regurgitation; MS, mitral stenosis; MVA, mitral valve area; MVres, mitral valve resistance; DP, gradient; sPAP, systolic pulmonary artery pressure; r, theradius of the convergence hemisphere, RA, right atrium; RV, right ventricle; T1/2, pressure half-time; v, velocity; VTI. velocity time integral; N, number ofinstantaneous measurements.
Table 9 Recommendations for classification of mitral stenosisseverity
Mild Moderate Severe
Specific findingsValve area (cm2) .1.5 1.0–1.5 ,1.0
Supportive findingsMean gradient (mmHg)a ,5 5–10 .10Pulmonary artery pressure (mmHg) ,30 30–50 .50
aAt heart rates between 60 and 80 bpm and in sinus rhythm.
H. Baumgartner et al.18
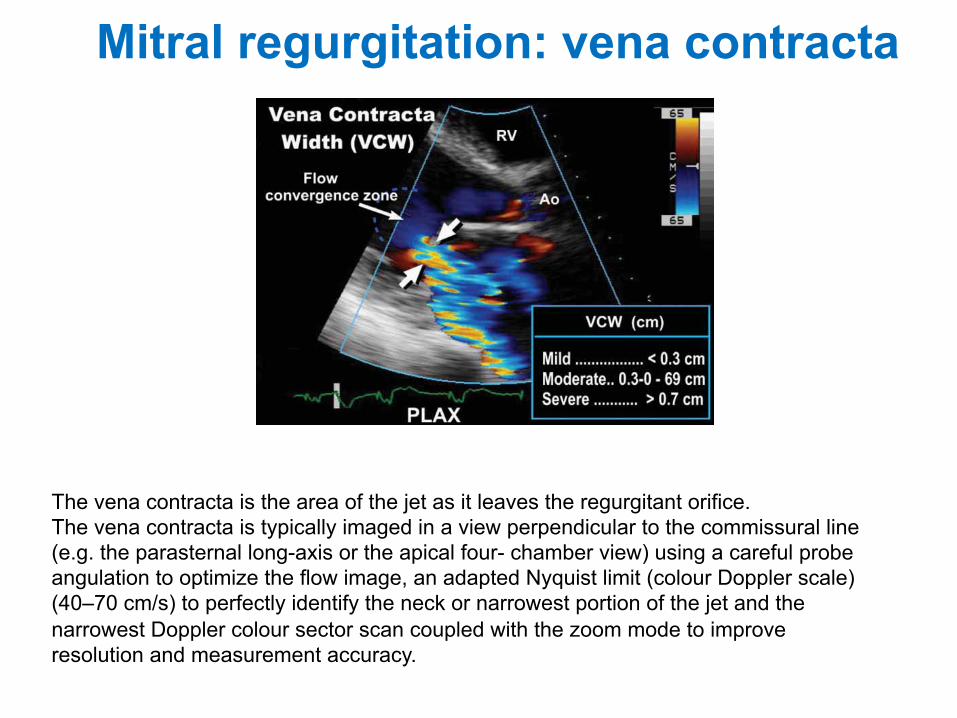
Mitral regurgitation: vena contracta 272 Suk Danik and Bulwer
Table 9Vena Contracta Width Measurements in MR
Advantages Disadvantages
1. Relatively quick and easy to assesses using standard 1. Not good at distinguishing mild from moderate MR windows or moderate from severe MR
2. Good for extremes of MR (mild and severe MR) 2. Small values; small measurement errors are multiplied3. Assesses basic size of defect 3. True cross-sectional area may be difficult to obtain—use
two apical diameteres4. Relatively independent of flow rate, driving pressure, 4. VCW measurement—a single temporal measurement
or entrainment (Coanda effect)5. Not influenced by the presence of another regurgitant 5. Overestimates true regurgitant orifice area—a problem of
leak, for example, aortic regurgitation resolution6. No need for correction for convergence angle as with 6. Not valid for multiple MR jets
proximal isovelocity suface area measurement
MR, mitral regurgitation.
Fig. 21. Vena contracta width measurement.
(Nyquist limit)—VALIAS —to give the regurgitant flowrate (Fig. 24). If the base of the PISA hemisphere is nothorizontal, it should be corrected to 180°.
Reguritant flow rate = 2!r2 " VALIAS (mL/s)
From this, the EROA can be quantified using thecontinuity principle equation (Figs. 25 and 26; seeChapter 11, Fig. 11) for flow rate: Area1 " Velocity1 =Area2 " Velocity2; and VMAX is the peak velocity of theMR jet on CW Doppler:
EROA = 2!r2 " VALIAS/VMAX
Regurgitant volume and the regurgitant fraction canthen be calculated (Fig. 27).
The PISA method can also be assessed by trans-esophageal echocardiography when indicated (Fig. 28).
The PISA method makes several assumptions(Table 10)—many of which are violated in the clinicalsetting. 3D echocardiography may ultimately assist inovercoming some of these limitations.
Other Doppler MethodsSYSTOLIC FLOW REVERSAL IN THE PULMONARY VEINS
The presence and the degree of reversal of bloodflow from the LA into the pulmonary veins can indicatethe hemodynamic impact of the MR jet. Visualizationof flow reversal into one or more pulmonary veins on
14_Danik 9/28/06 4:21 PM Page 272
The vena contracta is the area of the jet as it leaves the regurgitant orifice. The vena contracta is typically imaged in a view perpendicular to the commissural line (e.g. the parasternal long-axis or the apical four- chamber view) using a careful probe angulation to optimize the flow image, an adapted Nyquist limit (colour Doppler scale) (40–70 cm/s) to perfectly identify the neck or narrowest portion of the jet and the narrowest Doppler colour sector scan coupled with the zoom mode to improve resolution and measurement accuracy.
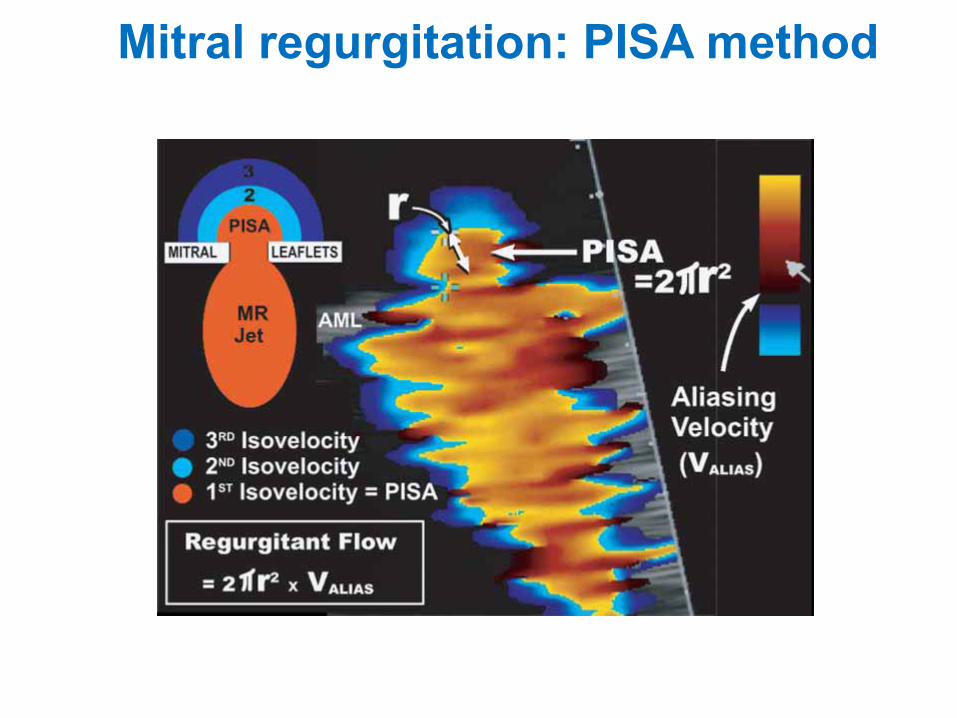
274 Suk Danik and Bulwer
severity itself, but should be further integrated withglobal cardiac function and the patient’s clinical status.Newer methods of assessing MR severity show promise,e.g., 3D echocardiography and power Doppler imaging,but are not yet routinely used in clinical practice (Fig. 34; please see companion DVD for correspondingvideo).
SURGICAL CONSIDERATIONS IN MR
Anatomical Mechanisms of MRPrecise determination of the mechanism of MR
results is necessary for successful reconstructive sur-gery of the mitral valve. Thus, the Carpentier’s func-tional classification is often used (Fig. 35).
Fig. 23. The proximal isovelocity surface area method. Fluids within a confined space accelerate toward an outlet or orifice in con-centric isovelocities. A familiar example of this occurs when water is released from a kitchen sink.
Fig. 24. Proximal isovelocity surface area (PISA).
14_Danik 9/28/06 4:21 PM Page 274
Mitral regurgitation: PISA method
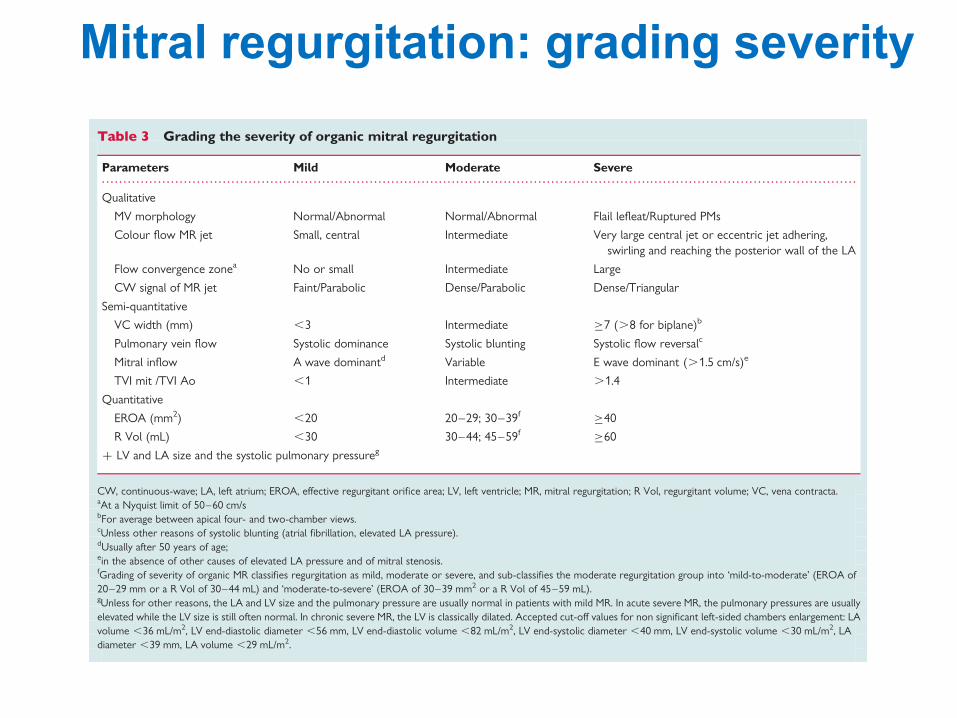
posterior ventricular border; the posterior leaflet attaches alongthe posterior margin of the annulus from the septum to the infer-olateral wall. The insertion of the septal leaflet of the tricuspidvalve is characteristically apical relative to the septal insertion ofthe anterior mitral leaflet. The three main TTE views allowingthe tricuspid valve visualization are the parasternal, the apical four-chamber and the subcostal views. Parasternal long-axis view of theRV inflow is obtained by tilting the probe inferomedially and rotat-ing it slightly clockwise from the parasternal long-axis view of theLV. This incidence reveals the anterior tricuspid leaflet (near theaortic valve) and the posterior tricuspid leaflet. Parasternal short-axis view, at the level of the aortic valve, apical four-chamber viewand subcostal four-chamber view visualize the septal and theanterior tricuspid leaflets (Figure 26). TEE for the tricuspid valveis possible with the four-chamber view at 08 in the basal transoe-sophageal and oesogastric junction planes. TEE is of interest for thediagnosis of endocarditis when suspected. It is particularly essentialto diagnose venous catheters and pacemakers lead infectionbecause TTE is often non diagnostic in these settings. TEE canalso help accurate tricuspid valve chordae visualization when trau-matic rupture is suspected with TTE. However, it is rarely possibleto visualize by 2D echo the three leaflets simultaneously. Real-time3D TTE is now routinely available and allows, with its unique capa-bility of obtaining a short-axis plane of the tricuspid valve, simul-taneous visualization of the three leaflets moving during thecardiac cycle and their attachment to the tricuspid annulus.46 3D
echo supplements 2D echo and TEE with detailed images of themorphology of the valve including leaflets size and thickness,annulus shape and size, myocardial walls, and their anatomicrelationships.
The tricuspid annulus, providing a firm support for the tricuspidleaflets insertion, is slightly larger than the mitral valve annulus.The tricuspid annulus shows a non-planar structure with an ellipticalsaddle-shaped pattern, having two high points (oriented superiorlytowards the RA) and two low points (oriented inferiorly towardthe RV that is best seen in mid-systole). Normal tricuspid valveannulus diameter in adults is 28+5 mm in the four-chamberview. Significant tricuspid annular dilatation is defined by a diastolicdiameter of .21 mm/m2 (.35 mm). A correlation exists betweentricuspid annulus diameter and TR severity: a systolic tricuspidannulus diameter .3.2 cm or a diastolic tricuspid annulus diameter.3.4 cm are often markers in favour of more significant TR. Thenormal motion and contraction of the tricuspid annulus also con-tributes to maintaining valve competence. The normal contraction(decrease in annular area in systole) of the tricuspid annulus is25%. These reference measures are currently used to propose tri-cuspid valve repair at the time of left-sided valve surgery.However, as the shape of the tricuspid annulus is not circular butoval, with a minor and a major diameter, the 2D echo measurementof the tricuspid annulus diameters (apical four-chamber view, para-sternal short-axis view) systematically underestimate the actual tri-cuspid annulus size by 3D echo. As a consequence, 65% of patients
. . . . . . . . . . . . . . . . . . . . . . . . . . . . . . . . . . . . . . . . . . . . . . . . . . . . . . . . . . . . . . . . . . . . . . . . . . . . . . . . . . . . . . . . . . . . . . . . . . . . . . . . . . . . . . . . . . . . . . . . . . . . . . . . . . . . . . . . . . . . . . . . . . . . . . . . . . . . . . . . . . . . . . . . . . . . . . .
Table 3 Grading the severity of organic mitral regurgitation
Parameters Mild Moderate Severe
Qualitative
MV morphology Normal/Abnormal Normal/Abnormal Flail lefleat/Ruptured PMs
Colour flow MR jet Small, central Intermediate Very large central jet or eccentric jet adhering,swirling and reaching the posterior wall of the LA
Flow convergence zonea No or small Intermediate Large
CW signal of MR jet Faint/Parabolic Dense/Parabolic Dense/Triangular
Semi-quantitative
VC width (mm) ,3 Intermediate !7 (.8 for biplane)b
Pulmonary vein flow Systolic dominance Systolic blunting Systolic flow reversalc
Mitral inflow A wave dominantd Variable E wave dominant (.1.5 cm/s)e
TVI mit /TVI Ao ,1 Intermediate .1.4
Quantitative
EROA (mm2) ,20 20–29; 30–39f !40
R Vol (mL) ,30 30–44; 45–59f !60
+ LV and LA size and the systolic pulmonary pressureg
CW, continuous-wave; LA, left atrium; EROA, effective regurgitant orifice area; LV, left ventricle; MR, mitral regurgitation; R Vol, regurgitant volume; VC, vena contracta.aAt a Nyquist limit of 50–60 cm/sbFor average between apical four- and two-chamber views.cUnless other reasons of systolic blunting (atrial fibrillation, elevated LA pressure).dUsually after 50 years of age;ein the absence of other causes of elevated LA pressure and of mitral stenosis.fGrading of severity of organic MR classifies regurgitation as mild, moderate or severe, and sub-classifies the moderate regurgitation group into ‘mild-to-moderate’ (EROA of20–29 mm or a R Vol of 30–44 mL) and ‘moderate-to-severe’ (EROA of 30–39 mm2 or a R Vol of 45–59 mL).gUnless for other reasons, the LA and LV size and the pulmonary pressure are usually normal in patients with mild MR. In acute severe MR, the pulmonary pressures are usuallyelevated while the LV size is still often normal. In chronic severe MR, the LV is classically dilated. Accepted cut-off values for non significant left-sided chambers enlargement: LAvolume ,36 mL/m2, LV end-diastolic diameter ,56 mm, LV end-diastolic volume ,82 mL/m2, LV end-systolic diameter ,40 mm, LV end-systolic volume ,30 mL/m2, LAdiameter ,39 mm, LA volume ,29 mL/m2.
Recommendations for the assessment of valvular regurgitation 321Mitral regurgitation: grading severity
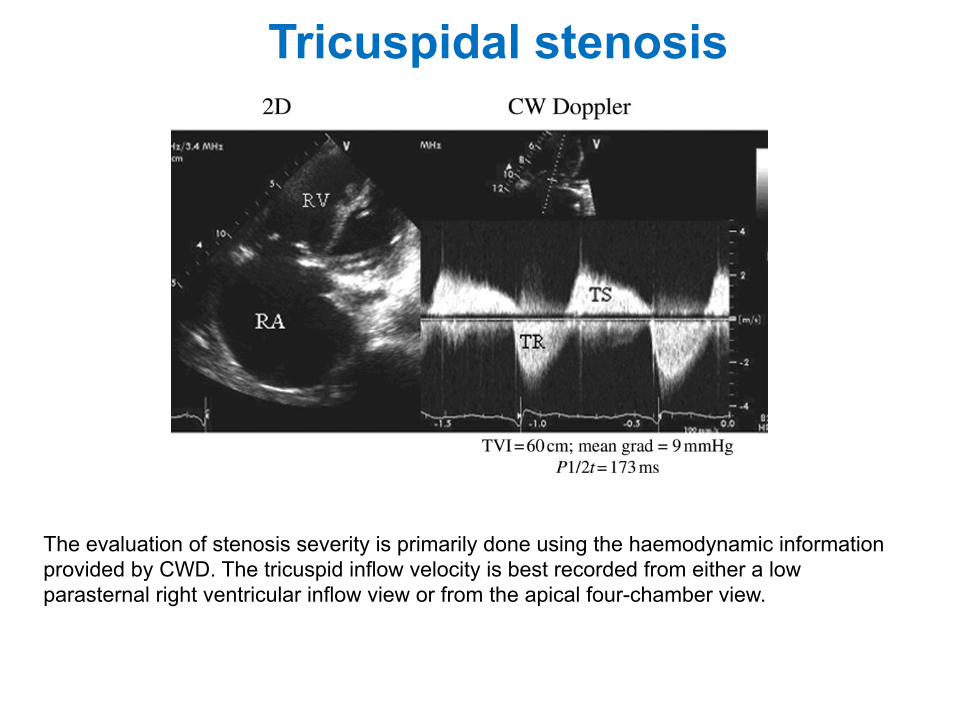
Tricuspidal stenosis
The evaluation of stenosis severity is primarily done using the haemodynamic information provided by CWD. The tricuspid inflow velocity is best recorded from either a low parasternal right ventricular inflow view or from the apical four-chamber view.
The impact of echocardiographic findings on the prognosisof MS has mainly been studied after balloon mitral commis-surotomy. Multivariate analyses performed in studies report-ing a follow-up of at least 10 years identified valve anatomyas a strong predictive factor of event-free survival.71–74
Indices of the severity of MS or its haemodynamic conse-quences immediately after balloon commissurotomy arealso predictors of event-free survival, whether it isMVA,70,73 mean gradient,70,72 and left atrial or pulmonaryartery pressure.72,73 The degree of MR following balloonmitral commissurotomy and baseline patient characteristicssuch as age, functional class, and cardiac rhythm are alsostrong predictors of long-term results of balloon mitral com-missurotomy.71–73
Large studies of natural history and of results of surgicalcommissurotomy predate the current echocardiographicpractice and thus do not enable the prognostic value ofechocardiographic findings to be assessed.
IV. Tricuspid stenosis
A. Causes and anatomic presentation
Tricuspid stenosis (TS) is currently the least common of thevalvular stenosis lesions given the low incidence of rheu-matic heart disease. In regions where rheumatic heartdisease is still prevalent, TS is rarely an isolated disorder;more often, it is accompanied by MS. Other causes of TSinclude carcinoid syndrome (always combined with TRwhich is commonly predominant),75 rare congenital malfor-mations,76–79 valvular or pacemaker endocarditis andpacemaker-induced adhesions,80–82 lupus valvulitis,83 andmechanical obstruction by benign or malignant tumors.84–
87 Most commonly, TS is accompanied by regurgitation sothat the higher flows through the valve further increasethe transvalvular gradient and contribute to a greaterelevation of right atrial pressures.88
As with all valve lesions, the initial evaluation starts withan anatomical assessment of the valve by 2D echocardiogra-phy using multiple windows such as parasternal right
ventricular inflow, parasternal short axis, apical four-chamber and subcostal four-chamber. One looks for valvethickening and/or calcification, restricted mobility withdiastolic doming, reduced leaflet separation at peakopening, and right atrial enlargement (Figure 11).89 In carci-noid syndrome, one sees severe immobility of the leaflets,described as a ‘frozen’ appearance (Figure 12). Echocardio-graphy also allows for the detection of valve obstruction byatrial tumours, metastatic lesions, or giant vegetations.Three-dimensional echocardiography can provide betteranatomical detail of the relation of the three leaflets toeach other and assessment of the orifice area.90 Usingcolour flow Doppler one can appreciate narrowing of thediastolic inflow jet, higher velocities that produce mosaiccolour dispersion, and associated valve regurgitation.
B. How to assess tricuspid stenosis
The evaluation of stenosis severity is primarily done using thehaemodynamic information provided by CWD. Although thereare reports of quantification of orifice area by 3D echocardio-graphy, the methodology is neither standardized nor suffi-ciently validated to be recommended as a method ofchoice. The tricuspid inflow velocity is best recorded fromeither a low parasternal right ventricular inflow view orfrom the apical four-chamber view. For measurement pur-poses, all recording should be made at sweep speed of100 mm/s.90 Because tricuspid inflow velocities are affectedby respiration, all measurements taken must be averagedthroughout the respiratory cycle or recorded at end-expira-tory apnea. In patients with atrial fibrillation, measurementsfrom a minimum of five cardiac cycles should be averaged.Whenever possible, it is best to assess the severity of TS atheart rates ,100 bpm, preferably between 70 and 80 bpm.As with MS, faster heart rates make it impossible to appreciatethe deceleration time (or pressure half-time).
The hallmark of a stenotic valve is an increase in trans-valvular velocity recorded by CWD (Figures 11 and 12).Peak inflow velocity through a normal tricuspid valverarely exceeds 0.7 m/s. Tricuspid inflow is normally
Figure 11 The left panel illustrates a 2D echocardiographic image of a stenotic tricuspid valve obtained in a modified apical four-chamberview during diastole. Note the thickening and diastolic doming of the valve, and the marked enlargement of the right atrium (RA). The rightpanel shows a CW Doppler recording through the tricuspid valve. Note the elevated peak diastolic velocity of 2 m/s and the systolic tricuspidregurgitation (TR) recording. The diastolic time–velocity integral (TVI), mean gradient (Grad), and pressure half-time (T1/2) values are listed.
EAE/ASE stenosis recommendations 19

Tricuspidal regurgitation
mild or moderate TR.54 Intermediate values are not accurate at dis-tinguishing moderate from mild TR. As for MR, the regurgitant orificegeometry is complex and not necessarily circular. A poor correlationhas been suggested between the 2D vena contracta width and the 3Dassessment of the EROA. This could underline the poor accuracy ofthe 2D vena contracta width in eccentric jets. With 3D echo, anEROA . 75 mm2 seems to indicate severe TR.55 However, thesedata need to be confirmed in further studies.Key point
When feasible, the measurement of the vena contractais recommended to quantify TR. A vena contracta width
!7 mm defines severe TR. Lower values are difficult tointerpret. In case of multiple jets, the respective valuesof the vena contracta width are not additive. The assess-ment of the vena contracta by 3D echo is still reservedto research purposes.
The flow convergence methodAlthough providing quantitative assessment, clinical practice revealsthat the flow convergence method is rarely applied in TR. Thisapproach has been validated in small studies.56–58 The apical four-chamber view and the parasternal long and short axis views are clas-sically recommended for optimal visualization of the PISA. The areaof interest is optimized by lowering imaging depth and the Nyquistlimit to "15–40 cm/s. The radius of the PISA is measured at mid-systole using the first aliasing (Figure 30). Qualitatively, a TR PISAradius .9 mm at a Nyquist limit of 28 cm/s alerts to the presenceof significant TR whereas a radius ,5 mm suggests mild TR.57 AnEROA ! 40 mm2 or a R Vol of !45 mL indicates severe TR. Asmentioned in the first part of the recommendations on the assess-ment of valvular regurgitation, the PISA method faces several advan-tages and limitations.1 It could underestimate the severity of TR by30%. This method is also less accurate in eccentric jets. To note, thenumber of studies having evaluated the value of the flow conver-gence method in TR are still limited.Key point
When feasible, the PISA method is reasonable toquantify the TR severity. An EROA ! 40 mm2 or a RVol ! 45 mL indicates severe TR.
Pulsed DopplerDoppler volumetric methodQuantitative PW Doppler method is rarely used to quantify the TRseverity. As for MR, this approach is time consuming and is associ-ated with several drawbacks (see above).
Anterograde velocity of tricuspid inflowSimilar to MR, the severity of TR will affect the early tricuspid dias-tolic filling (E velocity). In the absence of tricuspid stenosis, the peakE velocity increases in proportion to the degree of TR. Tricuspidinflow Doppler tracings are obtained at the tricuspid leaflet tips. Apeak E velocity !1 m/s suggests severe TR (Figure 31).
Hepatic vein flowPulsed Doppler evaluation of hepatic venous flow pattern isanother aid for grading TR. In normal individuals, the patternof flow velocity consists of antegrade systolic, transient flowreversal as the TV annulus recoils at the end of systole, ante-grade diastolic and a retrograde A wave caused by atrial contrac-tion. Such hepatic flow patterns are affected by respiration. Withincreasing severity of TR, there is a decrease in hepatic vein sys-tolic velocity. In severe TR, systolic flow reversal occurs(Figure 32). The sensitivity of flow reversal for severe TR is80%.53 Thus, the absence of systolic flow reversal does notrule out severe TR. Blunted systolic hepatic vein flow can beobserved in case of abnormal right atrial and RV compliance,atrial fibrillation and elevated right atrial pressure from anycause.59 Blunting of hepatic flow may thus lack of specificity.
Figure 28 Visual assessment of tricuspid regurgitant jet usingcolour-flow imaging. (A) Large central jet; (B) eccentric jet witha clear Coanda effect. CV, four-chamber view.
Figure 29 Semi-quantitative assessment of tricuspid regurgita-tion severity using the vena contracta width (VC). The threecomponents of the regurgitant jet (flow convergence zone,vena contracta, jet turbulence) are obtained. CV, chamber view.
P. Lancellotti et al.326
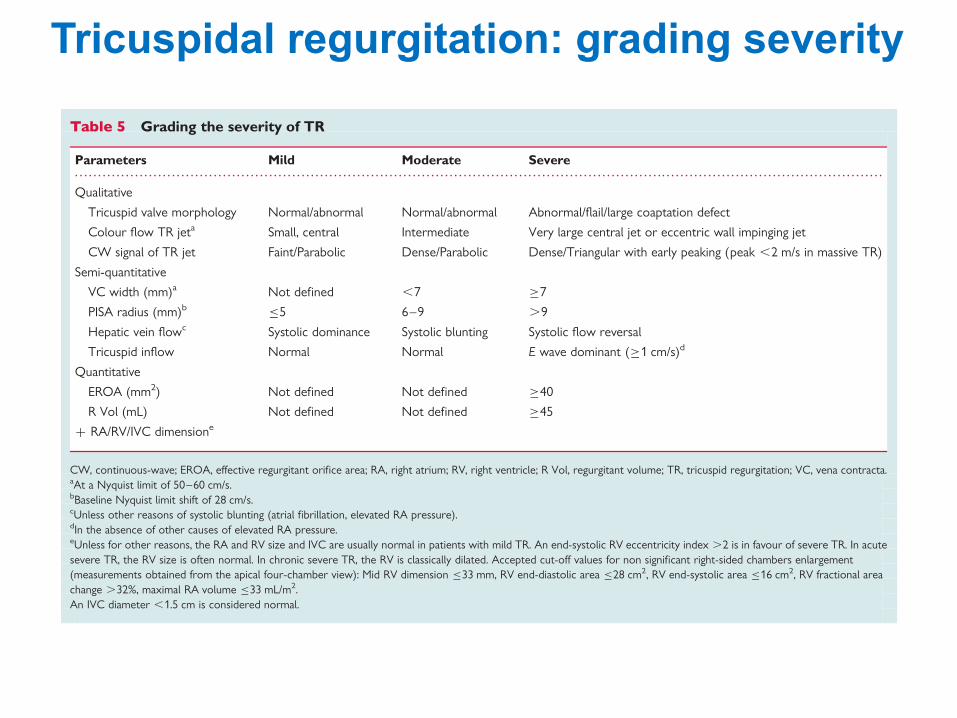
Tricuspidal regurgitation: grading severity
longest right lateral distance by the distance connecting the ventri-cular septum and the RV free wall—is in favour of severe TR (sen-sitivity of 79%).50 Conversely, it has been reported a poorcorrelation between the RV area, the fractional area change andthe degree of TR. RV dysfunction may be seen in both left-sidedand right-sided vavular heart disease. In unoperated patients withmitral valve disease, subnormal RV ejection fraction at rest isassociated with decreased exercise tolerance and mortality. Inoperated patients, a RV ejection fraction ,20% predicted post-operative death.61 Progressive RV dysfunction may also resultfrom chronic TR. In a recent study, it has been shown that flail tri-cuspid valve is associated with decreased survival and increasingrisk of heart failure.62 This indicates that sustained severe TR fora long time could lead to significant RV muscle dysfunction. Asfor the LV, the RV ejection fraction is a crude estimate of RV func-tion. It is dependent on loading conditions, ventricular interactionas well as myocardial structure. New parameters are currentlyavailable for a better assessment of RV function but they stillneed to be validated in both left and right-sided valve diseases. Atricuspid annular plane systolic excursion (TAPSE) ,8.5 mm(M-mode line place at the level of lateral tricuspid annulus onapical four-chamber view) correlates with a RV ejection fractionof ,25%. A TAPSE ,15 mm is considered as significantlyreduced. A systolic tissue Doppler velocity measured at thelateral tricuspid annulus ,11 cm/s correlates with a RV ejectionfraction of ,45%.63 Both the TAPSE and the systolic velocity areless accurate in patients with severe TR.64 Little is known aboutthe value of myocardial acceleration during isovolumic contractionand RV strain in valvular regurgitation.
Key pointWhen TR is more than mild TR, the evaluation of RV
dimensions and function, RA volume, inferior vena cavadiameter and the pulmonary arterial systolic pressure ismandatory.1 The assessment of myocardial function byusing the TAPSE or the systolic myocardial velocities isreasonable to identify subtle RV dysfunction.
Role of exercise echocardiographyAs for MR, the goal of exercise echocardiography is to examine theRV functional reserve and to evaluate the changes in pulmonaryartery systolic pressure. No data are currently available on patientswith isolated TR.
Integrating indices of severityEchocardiographic assessment of TR includes integration of datafrom 2D/3D imaging of the valve, right heart chambers, septalmotion and inferior vena cava as well as Doppler measures ofregurgitant severity (Table 5). Colour flow Doppler should beexamined in multiple windows. The consensus of the expert isto advocate grading the severity of TR by using the vena contractawidth and the PISA method, except in the presence of mild or lessTR. However, as extensive data on the usefulness of theseapproaches are still lacking, the experts also recommend corro-borating the results of these methods with the other available par-ameters. Advantages and limitations of the various echo Dopplerparameters used in assessing TR severity are detailed in Table 6.
. . . . . . . . . . . . . . . . . . . . . . . . . . . . . . . . . . . . . . . . . . . . . . . . . . . . . . . . . . . . . . . . . . . . . . . . . . . . . . . . . . . . . . . . . . . . . . . . . . . . . . . . . . . . . . . . . . . . . . . . . . . . . . . . . . . . . . . . . . . . . . . . . . . . . . . . . . . . . . . . . . . . . . . . . . . . . . .
Table 5 Grading the severity of TR
Parameters Mild Moderate Severe
Qualitative
Tricuspid valve morphology Normal/abnormal Normal/abnormal Abnormal/flail/large coaptation defect
Colour flow TR jeta Small, central Intermediate Very large central jet or eccentric wall impinging jet
CW signal of TR jet Faint/Parabolic Dense/Parabolic Dense/Triangular with early peaking (peak ,2 m/s in massive TR)
Semi-quantitative
VC width (mm)a Not defined ,7 !7
PISA radius (mm)b "5 6–9 .9
Hepatic vein flowc Systolic dominance Systolic blunting Systolic flow reversal
Tricuspid inflow Normal Normal E wave dominant (!1 cm/s)d
Quantitative
EROA (mm2) Not defined Not defined !40
R Vol (mL) Not defined Not defined !45
+ RA/RV/IVC dimensione
CW, continuous-wave; EROA, effective regurgitant orifice area; RA, right atrium; RV, right ventricle; R Vol, regurgitant volume; TR, tricuspid regurgitation; VC, vena contracta.aAt a Nyquist limit of 50–60 cm/s.bBaseline Nyquist limit shift of 28 cm/s.cUnless other reasons of systolic blunting (atrial fibrillation, elevated RA pressure).dIn the absence of other causes of elevated RA pressure.eUnless for other reasons, the RA and RV size and IVC are usually normal in patients with mild TR. An end-systolic RV eccentricity index .2 is in favour of severe TR. In acutesevere TR, the RV size is often normal. In chronic severe TR, the RV is classically dilated. Accepted cut-off values for non significant right-sided chambers enlargement(measurements obtained from the apical four-chamber view): Mid RV dimension "33 mm, RV end-diastolic area "28 cm2, RV end-systolic area "16 cm2, RV fractional areachange .32%, maximal RA volume "33 mL/m2.An IVC diameter ,1.5 cm is considered normal.
Recommendations for the assessment of valvular regurgitation 329
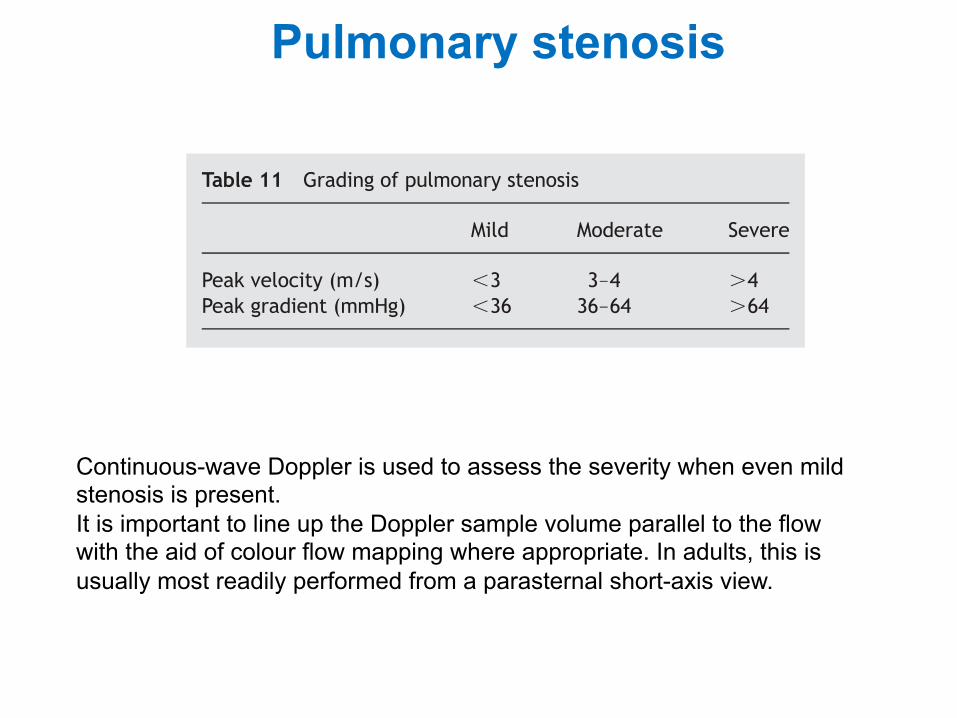
Pulmonary stenosis
A. Causes and anatomic presentation
Pulmonary stenosis is almost always congenital in origin. Thenormal pulmonary valve is trileaflet. The congenitallystenotic valve may be trileaflet, bicuspid, unicuspid, ordysplastic.97
Acquired stenosis of the pulmonary valve is very uncom-mon. Rheumatic pulmonary stenosis is rare even when thevalve is affected by the rheumatic process.98 Carcinoiddisease is the commonest cause of acquired pulmonaryvalve disease (combined stenosis and regurgitation withusually predominant regurgitation) and this may be suffi-ciently severe to require prosthetic replacement. Varioustumors may compress the RV outflow tract leading to func-tional pulmonary stenosis. These tumors may arise fromwithin the heart or associated vasculature or be externalto the heart and compress from without.99,100 Pulmonaryvalve stenosis may also occur as part of more complex con-genital lesions such as tetralogy of Fallot, complete atrio-ventricular canal, double outlet RV, and univentricularheart. Peripheral pulmonary artery stenosis may co-existwith valvular pulmonary stenosis such as in Noonan’s syn-drome and Williams syndrome.
Stenosis below (proximal to) the pulmonary valve mayresult from a number of causes, both congenital andacquired. Congenital ventricular septal defect (VSD) mayalso be associated with RV outflow tract obstruction second-ary to development of obstructive midcavitary or infundibu-lar muscle bundles (double chamber RV) or in rare cases as aresult of the jet lesion produced by the VSD in this area.Severe right ventricular hypertrophy of any cause but insome cases caused by valvular pulmonary stenosis itselfmay be responsible for narrowing of the infundibular areabelow the pulmonary valve. Iatrogenic causes include priorsurgery or intervention on this area. Other causes includehypertrophic or infiltrative processes such as hypertrophicobstructive cardiomyopathy or glycogen storage disordersand compression from a tumour or vascular structure.
Stenosis of the pulmonary artery above the valve (distal tothe valve) may occur in the main pulmonary trunk at thebifurcation, or more distally in the branch vessels. In rareinstances, a membrane just above the valve may cause ste-nosis. Pulmonary artery stenosis may occur as an isolatedfinding without other malformations.
B. How to grade pulmonary stenosis
Pulmonic stenosis severityQuantitative assessment of pulmonary stenosis severity is
based mainly on the transpulmonary pressure gradient. Cal-culation of pulmonic valve area by planimetry is not possiblesince the required image plane is in general not available.Continuity equation or proximal isovelocity surface areamethod, although feasible in principle, has not been vali-dated in pulmonary stenosis and is rarely performed.
B.1.1. Pressure gradient. The estimation of the systolicpressure gradient is derived from the transpulmonaryvelocity flow curve using the simplified Bernoulli equationDP ! 4v2.
This estimation is reliable, as shown by the good corre-lation with invasive measurement using cardiac catheteriza-tion.101 Continuous-wave Doppler is used to assess theseverity when even mild stenosis is present. It is important
to line up the Doppler sample volume parallel to the flowwith the aid of colour flow mapping where appropriate. Inadults, this is usually most readily performed from a para-sternal short-axis view but in children and in some adultsthe highest gradients may be found from the subcostalwindow. A modified apical five-chamber view may also beused where the transducer is angled clockwise to bring inthe RV outflow tract. Ideally, the highest velocity in multipleviews should be used for the determination.102,103
In most instances of valvular pulmonary stenosis, themodified Bernoulli equation works well and there is noneed to account for the proximal velocity as this is usually,1 m/s. There are exceptions to this, however. In thesetting of subvalvular or infundibular stenosis and pulmonarystenosis as part of a congenital syndrome or as a result of RVhypertrophy, the presence of two stenoses in series maymake it impossible to ascertain precisely the individual con-tribution of each. In addition, such stenoses in series maycause significant PR resulting in a higher Doppler gradientcompared with the net pressure drop across both ste-noses.104 Pulsed-wave Doppler may be useful to detect thesites of varying levels of obstruction in the outflow tractand in lesser degrees of obstruction may allow a full evalu-ation of it. Muscular infundibular obstruction is frequentlycharacterized by a late peaking systolic jet that appears‘dagger shaped’, reflecting the dynamic nature of theobstruction; this pattern can be useful is separatingdynamic muscular obstruction from fixed valvular obstruc-tion, where the peak velocity is generated early in systole.
In certain situations, TEE may allow a more accurateassessment of the pulmonary valve and RVOT. The pulmon-ary valve may be identified from a mid-oesophagealwindow at varying transducer positions from 50 to 908,anterior to the aortic valve. The RVOT is often well seenin this view. It is in general impossible to line up CW to accu-rately ascertain maximal flow velocity. Other windows inwhich the pulmonary outflow tract may be interrogatedinclude the deep transgastric view in which by appropriatetorquing of the transducer, the RV inflow and outflow maybe appreciated in a single image. This view can allow accu-rate alignment of the Doppler beam with the area of subval-var/valvular stenosis through the RV outflow tract.
In pulmonary valve stenosis, the pressure gradient acrossthe valve is used to ascertain severity of the lesion moreso than in left-sided valve conditions due in part to the dif-ficulty in obtaining an accurate assessment of pulmonaryvalve area. The following definitions of severity have beendefined in the 2006 American College of Cardiology/American Heart Association (ACC/AHA) guidelines on themanagement of valvular heart disease:1
Severe stenosis (Table 11): a peak jet velocity .4 m/s (peakgradient .64 mmHg) Moderate stenosis: peak jet velocityof 3–4 m/s (peak gradient 36–64 mmHg)
Table 11 Grading of pulmonary stenosis
Mild Moderate Severe
Peak velocity (m/s) ,3 3–4 .4Peak gradient (mmHg) ,36 36–64 .64
EAE/ASE stenosis recommendations 21
Continuous-wave Doppler is used to assess the severity when even mild stenosis is present. It is important to line up the Doppler sample volume parallel to the flow with the aid of colour flow mapping where appropriate. In adults, this is usually most readily performed from a parasternal short-axis view.
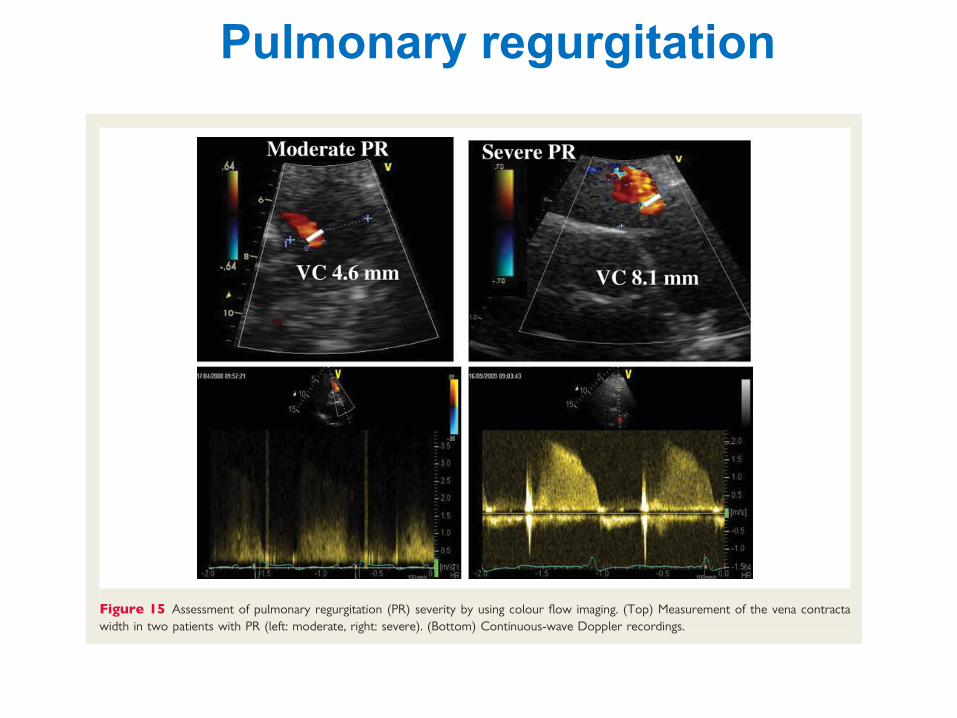
Pulmonary regurgitation
Figure 15 Assessment of pulmonary regurgitation (PR) severity by using colour flow imaging. (Top) Measurement of the vena contractawidth in two patients with PR (left: moderate, right: severe). (Bottom) Continuous-wave Doppler recordings.
Figure 16 Example of a patient with a severe pulmonary regurgitation (PR). (A) Complete lack of valve coaptation (left) and measurement ofthe vena contracta width (VC) (right); (B) colour-coded M-mode depicting the time dependency of flow signal during the heart cycle; (C ) con-tinuous Doppler recording of PR showing a rapid flow deceleration during the diastole (red arrow) and increased systolic flow velocity (notrelated to concomitant pulmonary stenosis).
P. Lancellotti et al.240 at ESC
Mem
ber (EJE) on May 25, 2010
ejechocard.oxfordjournals.orgD
ownloaded from
List of abbrevia-ons LV = lea ventricle WMSI = wall mo1on score index LVOT = lea ventricular ou<low tract TVI = 1me-‐velocity integral LA = lea atrium E = early mitral diastolic velocity A = late mitral diastolic velocity DT = decelera1on 1me IVRT =isovolumetric relaxa1on 1me TDI = 1ssue Doppler imaging S’ = myocardial systolic lea ventricular velocity E’ = early myocardial diastolic velocity A’ = late myocardial diastolic velocity RV = right ventricle RA = right atrium RVOT = right ventricular ou<low tract TAPSE = tricuspid annular plane systolic excursion IVC = inferior vena cava PHT = pressure half 1me
References: - Rudski LG, Lai WW, Afilalo J, et al. Guidelines for the echocardio- graphic assessment of the right heart in adults. J Am Soc Echocardiogr 2010;23:685-713. - Lang RM, Bierig M, Devereux RB, et al, American Society of 487 Echocardiography's Nomenclature and Standards Committee, Task Force on Chamber Quantification; American College of Cardiology 489 Echocardiography Committee, American Heart Association; 490 European Association of Echocardiography, European Society of 491 Cardiology. Recommendations for chamber quantification. Eur J 492 Echocardiogr 2006;7:79-108. - Lancellotti P, Moura L, Pierard LA, Agricola E, Popescu BA, Tribouilloy C, Hagendorff A, Monin JL, Badano L, Zamorano JL; European Association of Echocardiography. European Association of Echocardiography recommendations for the assessment of valvular regurgitation. Part 2: mitral and tricuspid regurgitation (native valve disease). Eur J Echocardiogr. 2010 May;11(4):307-32. - Lancellotti P, Tribouilloy C, Hagendorff A, Moura L, Popescu BA, Agricola E, Monin JL, Pierard LA, Badano L, Zamorano JL; European Association of Echocardiography. European Association of Echocardiography recommendations for the assessment of valvular regurgitation. Part 1: aortic and pulmonary regurgitation (native valve disease). Eur J Echocardiogr. 2010 Apr;11(3):223-44. - Baumgartner H, Hung J, Bermejo J, Chambers JB, Evangelista A, Griffin BP, Iung B, Otto CM, Pellikka PA, Quiñones M; EAE/ASE. Echocardiographic assessment of valve stenosis: EAE/ASE recommendations for clinical practice. Eur J Echocardiogr. 2009 Jan;10(1):1-25.