Embed Size (px)
Citation preview
2011-12 School Accountability Report Card for Lupine Hills Elementary School Page 1 of 12
Lupine Hills Elementary School
School Accountability Report Card
Reported Using Data from the 2011-12 School Year
Published During 2012-13
Every school in California is required by state law to publish a School Accountability Report Card (SARC), by February 1 of each year. The SARC contains information about the condition and performance of each California public school. • For more information about SARC requirements, see the California Department of Education (CDE) SARC webpage at
http://www.cde.ca.gov/ta/ac/sa/. • For additional information about the school, parents and community members should contact the school principal or the district
office.
I. Data and Access
EdData Partnership Web Site EdData is a partnership of the CDE, EdSource, and the Fiscal Crisis Management and Assistance Team (FCMAT) that provides extensive financial, demographic, and performance information about California’s public kindergarten through grade twelve school districts and schools. DataQuest DataQuest is an online data tool located on the CDE DataQuest webpage at http://dq.cde.ca.gov/dataquest/ that contains additional information about this school and comparisons of the school to the district, the county, and the state. Specifically, DataQuest is a dynamic system that provides reports for accountability (e.g., state Academic Performance Index [API], federal Adequate Yearly Progress [AYP]), test data, enrollment, high school graduates, dropouts, course enrollments, staffing, and data regarding English learners. Internet Access Internet access is available at public libraries and other locations that are publicly accessible. Access to the Internet at libraries and public locations is generally provided on a first-come, first-served basis. Other use restrictions may include the hours of operation, the length of time that a workstation may be used (depending on availability), the types of software programs available on a workstation, and the ability to print documents.
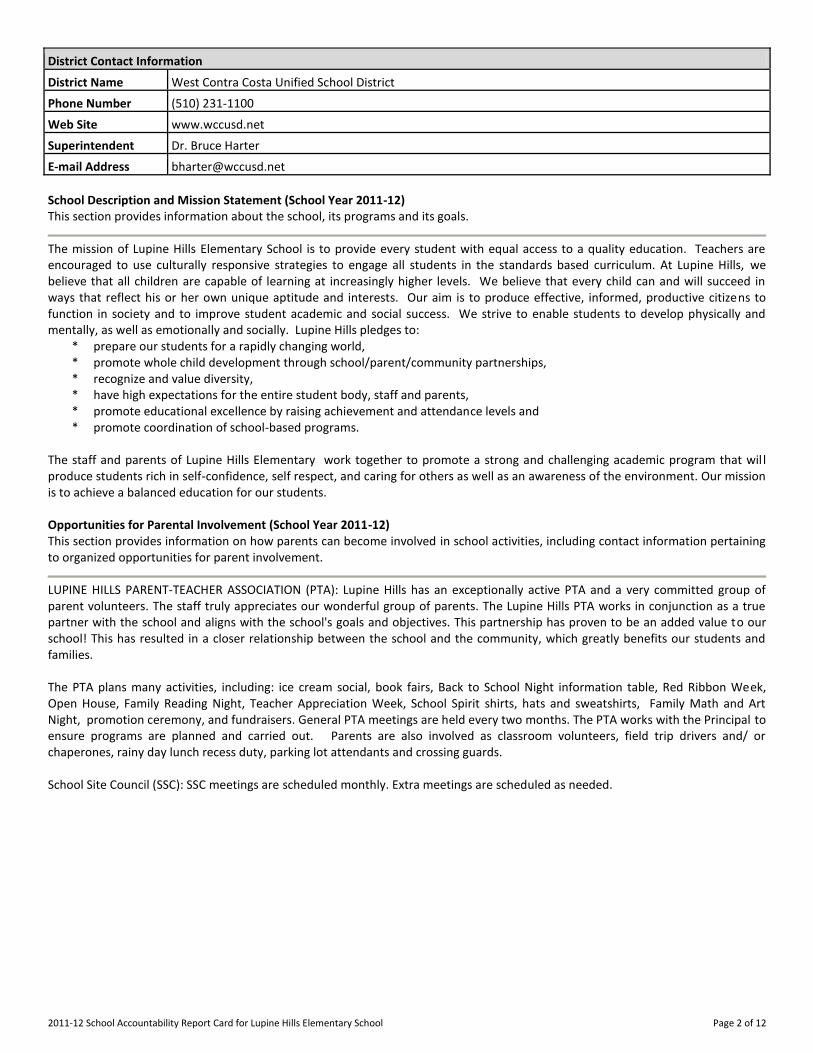
II. About This School Contact Information (School Year 2012-13)
School Contact Information
School Name------- Lupine Hills Elementary School
Street------- 1919 Lupine Road
City, State, Zip------- Hercules, CA 94547
Phone Number------- (510) 231-1411
Principal------- Liz Lonsdale
E-mail Address------- [email protected]
CDS Code------- 07-61796-6097141
2011-12 School Accountability Report Card for Lupine Hills Elementary School Page 2 of 12
District Contact Information
District Name------- West Contra Costa Unified School District
Phone Number------- (510) 231-1100
Web Site------- www.wccusd.net
Superintendent------- Dr. Bruce Harter
E-mail Address------- [email protected]
School Description and Mission Statement (School Year 2011-12) This section provides information about the school, its programs and its goals.
The mission of Lupine Hills Elementary School is to provide every student with equal access to a quality education. Teachers are encouraged to use culturally responsive strategies to engage all students in the standards based curriculum. At Lupine Hills, we believe that all children are capable of learning at increasingly higher levels. We believe that every child can and will succeed in ways that reflect his or her own unique aptitude and interests. Our aim is to produce effective, informed, productive citizens to function in society and to improve student academic and social success. We strive to enable students to develop physically and mentally, as well as emotionally and socially. Lupine Hills pledges to:
* prepare our students for a rapidly changing world, * promote whole child development through school/parent/community partnerships, * recognize and value diversity, * have high expectations for the entire student body, staff and parents, * promote educational excellence by raising achievement and attendance levels and * promote coordination of school-based programs.
The staff and parents of Lupine Hills Elementary work together to promote a strong and challenging academic program that wil l produce students rich in self-confidence, self respect, and caring for others as well as an awareness of the environment. Our mission is to achieve a balanced education for our students. Opportunities for Parental Involvement (School Year 2011-12) This section provides information on how parents can become involved in school activities, including contact information pertaining to organized opportunities for parent involvement.
LUPINE HILLS PARENT-TEACHER ASSOCIATION (PTA): Lupine Hills has an exceptionally active PTA and a very committed group of parent volunteers. The staff truly appreciates our wonderful group of parents. The Lupine Hills PTA works in conjunction as a true partner with the school and aligns with the school's goals and objectives. This partnership has proven to be an added value to our school! This has resulted in a closer relationship between the school and the community, which greatly benefits our students and families. The PTA plans many activities, including: ice cream social, book fairs, Back to School Night information table, Red Ribbon Week, Open House, Family Reading Night, Teacher Appreciation Week, School Spirit shirts, hats and sweatshirts, Family Math and Art Night, promotion ceremony, and fundraisers. General PTA meetings are held every two months. The PTA works with the Principal to ensure programs are planned and carried out. Parents are also involved as classroom volunteers, field trip drivers and/ or chaperones, rainy day lunch recess duty, parking lot attendants and crossing guards. School Site Council (SSC): SSC meetings are scheduled monthly. Extra meetings are scheduled as needed.
2011-12 School Accountability Report Card for Lupine Hills Elementary School Page 3 of 12
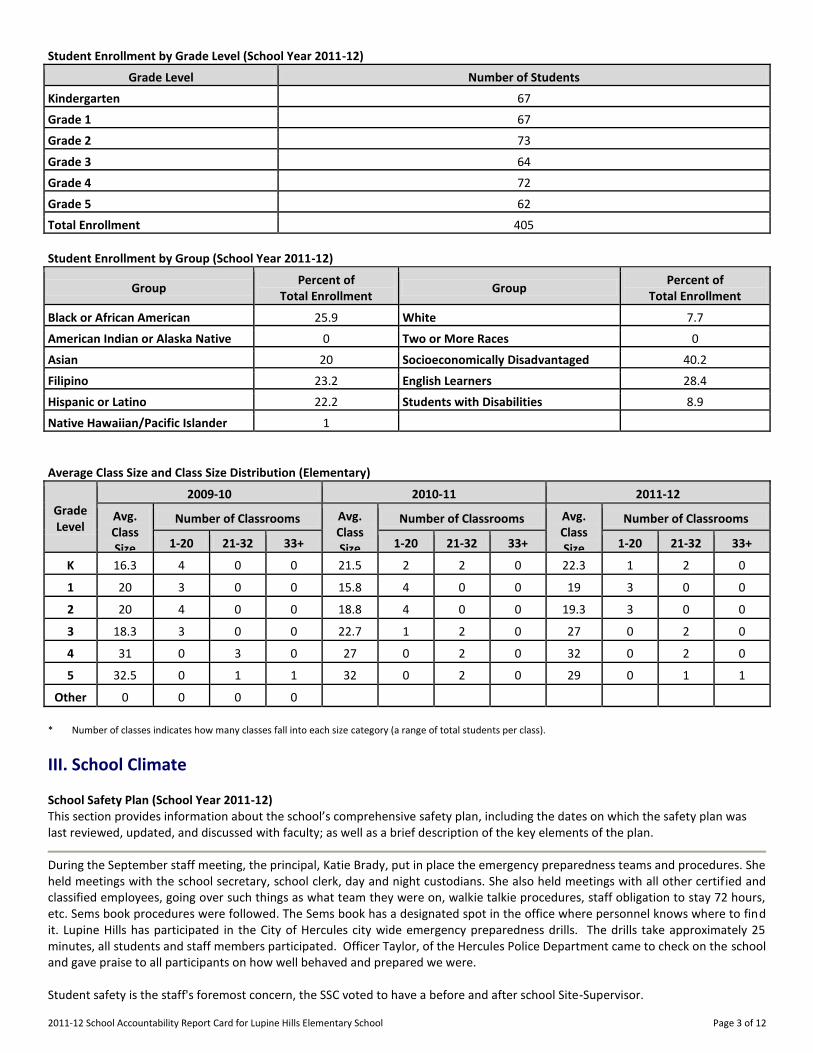
Student Enrollment by Grade Level (School Year 2011-12)
Grade Level Number of Students
Kindergarten------- 67
Grade 1------- 67
Grade 2------- 73
Grade 3------- 64
Grade 4------- 72
Grade 5------- 62
Total Enrollment------- 405
Student Enrollment by Group (School Year 2011-12)
Group Percent of
Total Enrollment Group
Percent of Total Enrollment
Black or African American------- 25.9 White 7.7
American Indian or Alaska Native-------
0 Two or More Races 0
Asian------- 20 Socioeconomically Disadvantaged 40.2
Filipino------- 23.2 English Learners 28.4
Hispanic or Latino------- 22.2 Students with Disabilities 8.9
Native Hawaiian/Pacific Islander 1
Average Class Size and Class Size Distribution (Elementary)
Grade Level
2009-10 2010-11 2011-12
Avg. Class Size
Number of Classrooms Avg. Class Size
Number of Classrooms Avg. Class Size
Number of Classrooms
1-20 21-32 33+ 1-20 21-32 33+ 1-20 21-32 33+
K ----------
16.3 4 0 0 21.5 2 2 0 22.3 1 2 0
1 ----------
20 3 0 0 15.8 4 0 0 19 3 0 0
2 ----------
20 4 0 0 18.8 4 0 0 19.3 3 0 0
3 ----------
18.3 3 0 0 22.7 1 2 0 27 0 2 0
4 ----------
31 0 3 0 27 0 2 0 32 0 2 0
5 ----------
32.5 0 1 1 32 0 2 0 29 0 1 1
Other ----------
0 0 0 0
* Number of classes indicates how many classes fall into each size category (a range of total students per class).
III. School Climate
School Safety Plan (School Year 2011-12) This section provides information about the school’s comprehensive safety plan, including the dates on which the safety plan was last reviewed, updated, and discussed with faculty; as well as a brief description of the key elements of the plan.
During the September staff meeting, the principal, Katie Brady, put in place the emergency preparedness teams and procedures. She held meetings with the school secretary, school clerk, day and night custodians. She also held meetings with all other certified and classified employees, going over such things as what team they were on, walkie talkie procedures, staff obligation to stay 72 hours, etc. Sems book procedures were followed. The Sems book has a designated spot in the office where personnel knows where to find it. Lupine Hills has participated in the City of Hercules city wide emergency preparedness drills. The drills take approximately 25 minutes, all students and staff members participated. Officer Taylor, of the Hercules Police Department came to check on the school and gave praise to all participants on how well behaved and prepared we were. Student safety is the staff's foremost concern, the SSC voted to have a before and after school Site-Supervisor.
2011-12 School Accountability Report Card for Lupine Hills Elementary School Page 4 of 12
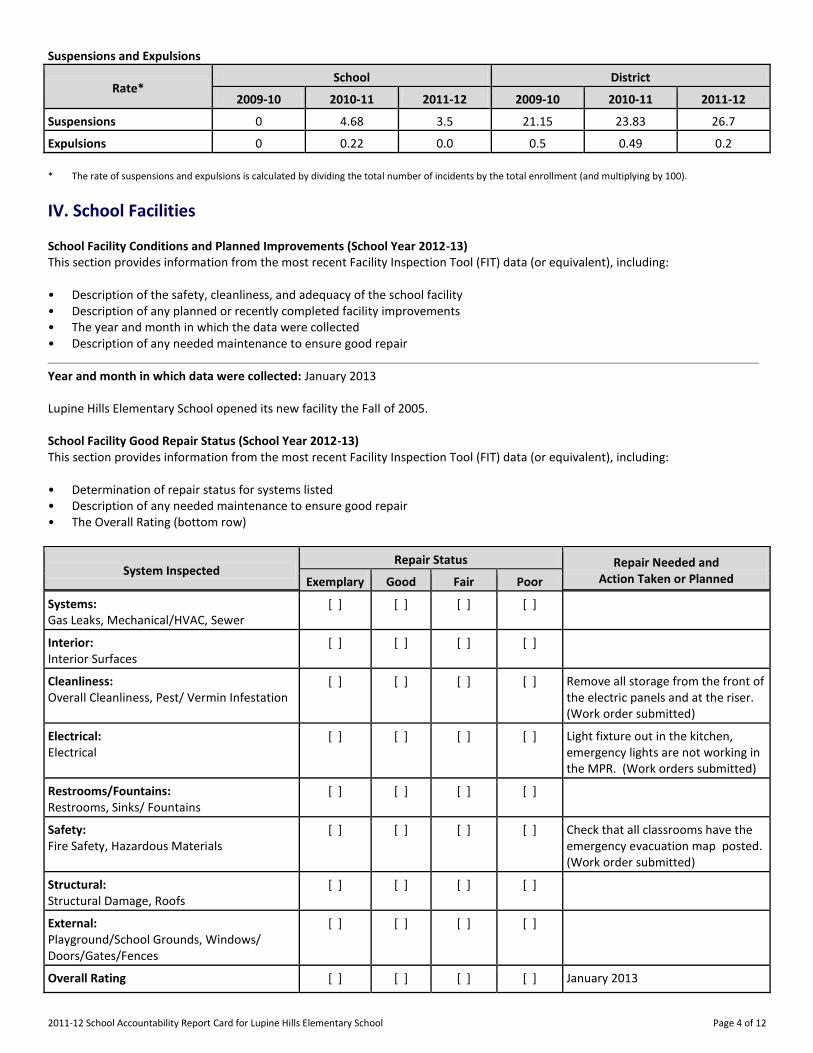
Suspensions and Expulsions
Rate* School District
2009-10 2010-11 2011-12 2009-10 2010-11 2011-12
Suspensions------- 0 4.68 3.5 21.15 23.83 26.7
Expulsions------- 0 0.22 0.0 0.5 0.49 0.2
* The rate of suspensions and expulsions is calculated by dividing the total number of incidents by the total enrollment (and multiplying by 100).
IV. School Facilities
School Facility Conditions and Planned Improvements (School Year 2012-13) This section provides information from the most recent Facility Inspection Tool (FIT) data (or equivalent), including: • Description of the safety, cleanliness, and adequacy of the school facility • Description of any planned or recently completed facility improvements • The year and month in which the data were collected • Description of any needed maintenance to ensure good repair
Year and month in which data were collected: January 2013 Lupine Hills Elementary School opened its new facility the Fall of 2005. School Facility Good Repair Status (School Year 2012-13) This section provides information from the most recent Facility Inspection Tool (FIT) data (or equivalent), including: • Determination of repair status for systems listed • Description of any needed maintenance to ensure good repair • The Overall Rating (bottom row)
System Inspected Repair Status Repair Needed and
Action Taken or Planned Exemplary Good Fair Poor
Systems: Gas Leaks, Mechanical/HVAC, Sewer
[ ] [ ] [ ] [ ]
Interior: Interior Surfaces
[ ] [ ] [ ] [ ]
Cleanliness: Overall Cleanliness, Pest/ Vermin Infestation
[ ] [ ] [ ] [ ] Remove all storage from the front of the electric panels and at the riser. (Work order submitted)
Electrical: Electrical
[ ] [ ] [ ] [ ] Light fixture out in the kitchen, emergency lights are not working in the MPR. (Work orders submitted)
Restrooms/Fountains: Restrooms, Sinks/ Fountains
[ ] [ ] [ ] [ ]
Safety: Fire Safety, Hazardous Materials
[ ] [ ] [ ] [ ] Check that all classrooms have the emergency evacuation map posted. (Work order submitted)
Structural: Structural Damage, Roofs
[ ] [ ] [ ] [ ]
External: Playground/School Grounds, Windows/ Doors/Gates/Fences
[ ] [ ] [ ] [ ]
Overall Rating [ ] [ ] [ ] [ ] January 2013
2011-12 School Accountability Report Card for Lupine Hills Elementary School Page 5 of 12
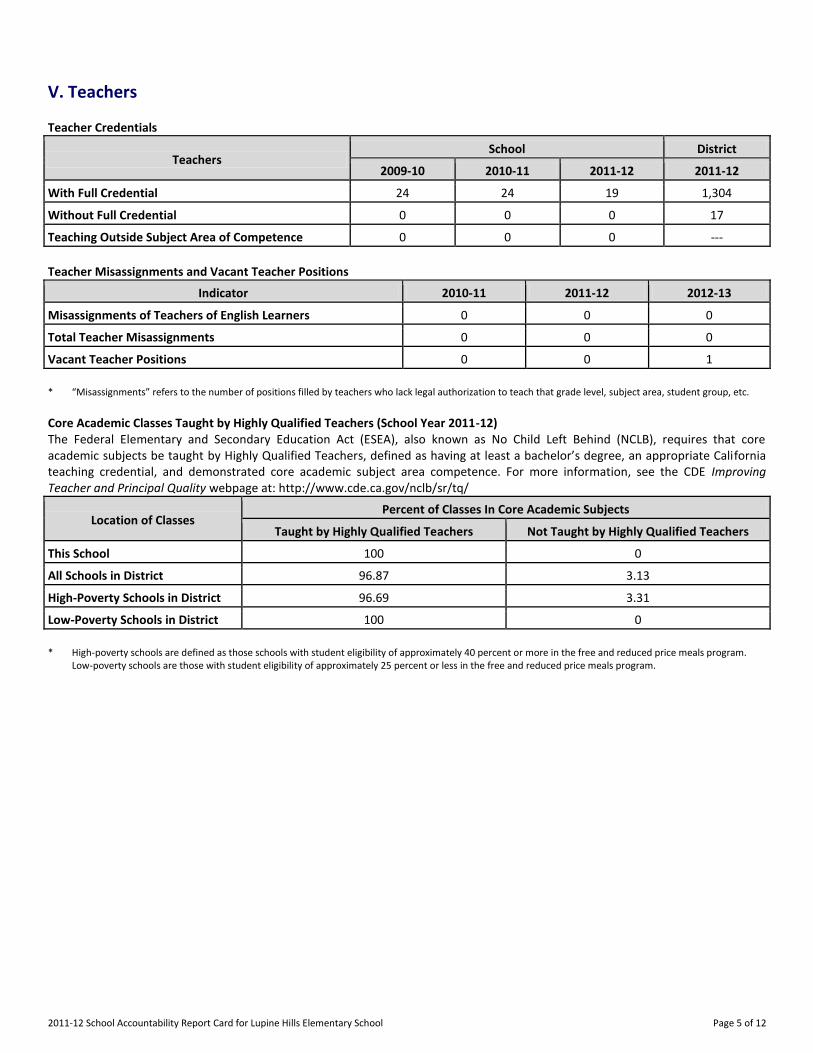
V. Teachers
Teacher Credentials
Teachers School District
2009-10 2010-11 2011-12 2011-12
With Full Credential 24 24 19 1,304
Without Full Credential 0 0 0 17
Teaching Outside Subject Area of Competence 0 0 0 ---
Teacher Misassignments and Vacant Teacher Positions
Indicator 2010-11 2011-12 2012-13
Misassignments of Teachers of English Learners 0 0 0
Total Teacher Misassignments 0 0 0
Vacant Teacher Positions 0 0 1
* “Misassignments” refers to the number of positions filled by teachers who lack legal authorization to teach that grade level, subject area, student group, etc. Core Academic Classes Taught by Highly Qualified Teachers (School Year 2011-12) The Federal Elementary and Secondary Education Act (ESEA), also known as No Child Left Behind (NCLB), requires that core academic subjects be taught by Highly Qualified Teachers, defined as having at least a bachelor’s degree, an appropriate California teaching credential, and demonstrated core academic subject area competence. For more information, see the CDE Improving Teacher and Principal Quality webpage at: http://www.cde.ca.gov/nclb/sr/tq/
Location of Classes Percent of Classes In Core Academic Subjects
Taught by Highly Qualified Teachers Not Taught by Highly Qualified Teachers
This School 100 0
All Schools in District 96.87 3.13
High-Poverty Schools in District 96.69 3.31
Low-Poverty Schools in District 100 0
* High-poverty schools are defined as those schools with student eligibility of approximately 40 percent or more in the free and reduced price meals program.
Low-poverty schools are those with student eligibility of approximately 25 percent or less in the free and reduced price meals program.
2011-12 School Accountability Report Card for Lupine Hills Elementary School Page 6 of 12
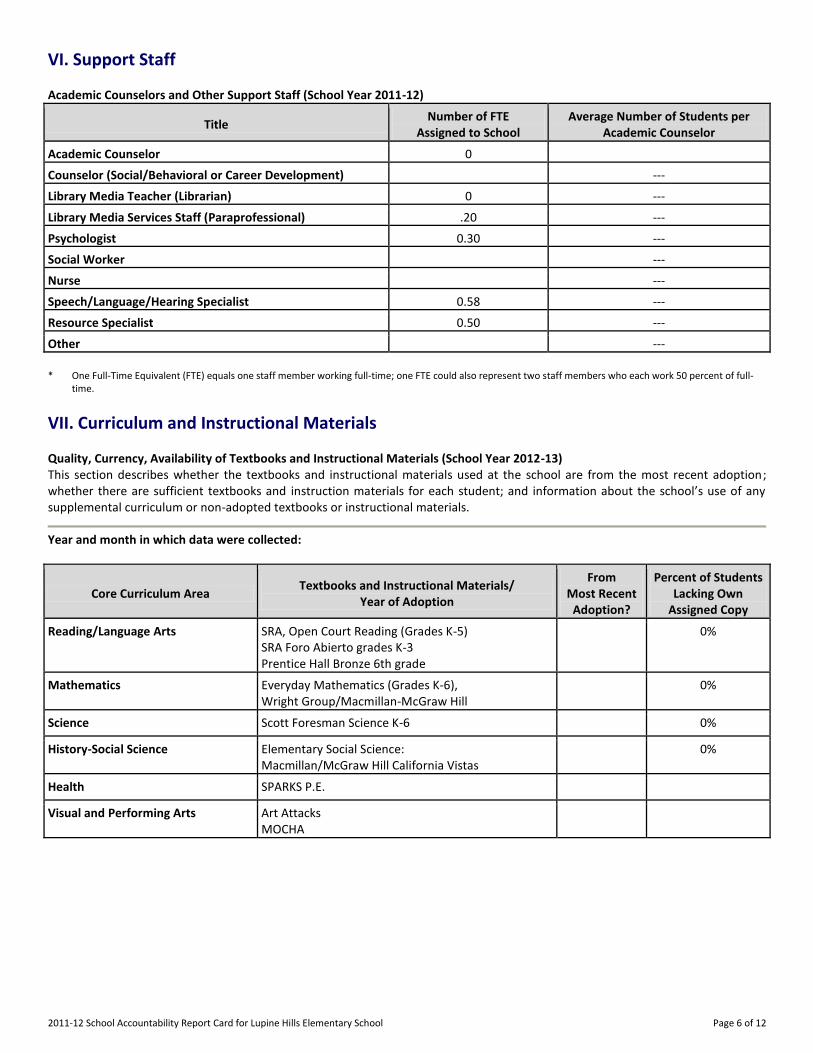
VI. Support Staff
Academic Counselors and Other Support Staff (School Year 2011-12)
Title Number of FTE
Assigned to School Average Number of Students per
Academic Counselor
Academic Counselor------- 0
Counselor (Social/Behavioral or Career Development) ---
Library Media Teacher (Librarian) 0 ---
Library Media Services Staff (Paraprofessional) .20 ---
Psychologist------- 0.30 ---
Social Worker------- ---
Nurse------- ---
Speech/Language/Hearing Specialist 0.58 ---
Resource Specialist------- 0.50 ---
Other------- ---
* One Full-Time Equivalent (FTE) equals one staff member working full-time; one FTE could also represent two staff members who each work 50 percent of full-
time.
VII. Curriculum and Instructional Materials
Quality, Currency, Availability of Textbooks and Instructional Materials (School Year 2012-13) This section describes whether the textbooks and instructional materials used at the school are from the most recent adoption; whether there are sufficient textbooks and instruction materials for each student; and information about the school’s use of any supplemental curriculum or non-adopted textbooks or instructional materials.
Year and month in which data were collected:
Core Curriculum Area Textbooks and Instructional Materials/
Year of Adoption
From Most Recent
Adoption?
Percent of Students Lacking Own
Assigned Copy
Reading/Language Arts SRA, Open Court Reading (Grades K-5)
SRA Foro Abierto grades K-3
Prentice Hall Bronze 6th grade
0%
Mathematics Everyday Mathematics (Grades K-6), Wright Group/Macmillan-McGraw Hill
0%
Science------- Scott Foresman Science K-6 0%
History-Social Science Elementary Social Science: Macmillan/McGraw Hill California Vistas
0%
Health------- SPARKS P.E.
Visual and Performing Arts Art Attacks
MOCHA
2011-12 School Accountability Report Card for Lupine Hills Elementary School Page 7 of 12
VIII. School Finances
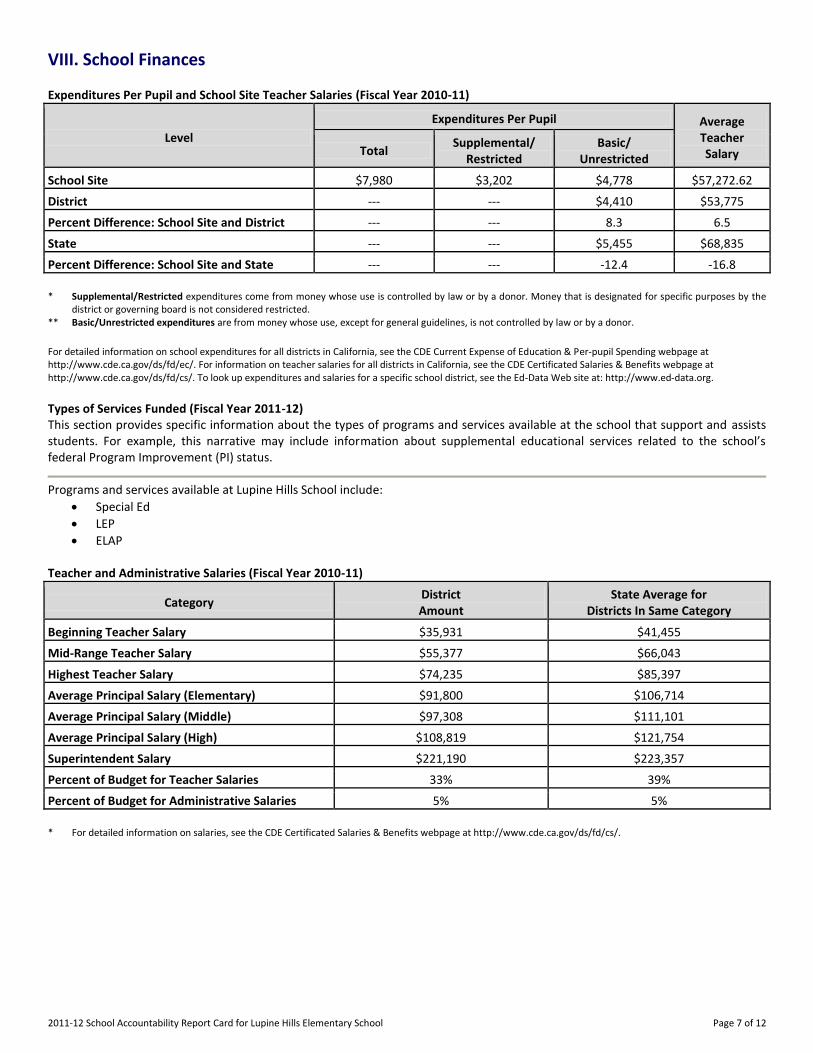
Expenditures Per Pupil and School Site Teacher Salaries (Fiscal Year 2010-11)
Level
Expenditures Per Pupil Average Teacher Salary Total
Supplemental/ Restricted
Basic/ Unrestricted
School Site------- $7,980 $3,202 $4,778 $57,272.62
District------- --- --- $4,410 $53,775
Percent Difference: School Site and District --- --- 8.3 6.5
State------- --- --- $5,455 $68,835
Percent Difference: School Site and State --- --- -12.4 -16.8
* Supplemental/Restricted expenditures come from money whose use is controlled by law or by a donor. Money that is designated for specific purposes by the
district or governing board is not considered restricted. ** Basic/Unrestricted expenditures are from money whose use, except for general guidelines, is not controlled by law or by a donor. For detailed information on school expenditures for all districts in California, see the CDE Current Expense of Education & Per-pupil Spending webpage at http://www.cde.ca.gov/ds/fd/ec/. For information on teacher salaries for all districts in California, see the CDE Certificated Salaries & Benefits webpage at http://www.cde.ca.gov/ds/fd/cs/. To look up expenditures and salaries for a specific school district, see the Ed-Data Web site at: http://www.ed-data.org. Types of Services Funded (Fiscal Year 2011-12) This section provides specific information about the types of programs and services available at the school that support and assists students. For example, this narrative may include information about supplemental educational services related to the school’s federal Program Improvement (PI) status.
Programs and services available at Lupine Hills School include:
Special Ed
LEP
ELAP Teacher and Administrative Salaries (Fiscal Year 2010-11)
Category District Amount
State Average for Districts In Same Category
Beginning Teacher Salary $35,931 $41,455
Mid-Range Teacher Salary $55,377 $66,043
Highest Teacher Salary $74,235 $85,397
Average Principal Salary (Elementary) $91,800 $106,714
Average Principal Salary (Middle) $97,308 $111,101
Average Principal Salary (High) $108,819 $121,754
Superintendent Salary $221,190 $223,357
Percent of Budget for Teacher Salaries 33% 39%
Percent of Budget for Administrative Salaries 5% 5%
* For detailed information on salaries, see the CDE Certificated Salaries & Benefits webpage at http://www.cde.ca.gov/ds/fd/cs/.
2011-12 School Accountability Report Card for Lupine Hills Elementary School Page 8 of 12
IX. Student Performance
The Standardized Testing and Reporting (STAR) Program consists of several key components, including: • California Standards Tests (CSTs), which include English-language arts (ELA) and mathematics in grades two through eleven;
science in grades five, eight, and nine through eleven; and history-social science in grades eight, and nine through eleven. • California Modified Assessment (CMA), an alternate assessment that is based on modified achievement standards in ELA for
grades three through eleven; mathematics for grades three through seven, Algebra I, and Geometry; and science in grades five and eight, and Life Science in grade ten. The CMA is designed to assess those students whose disabilities preclude them from achieving grade-level proficiency on an assessment of the California content standards with or without accommodations.
• California Alternate Performance Assessment (CAPA), includes ELA and mathematics in grades two through eleven, and science
for grades five, eight, and ten. The CAPA is given to those students with significant cognitive disabilities whose disabilities prevent them from taking either the CSTs with accommodations or modifications or the CMA with accommodations.
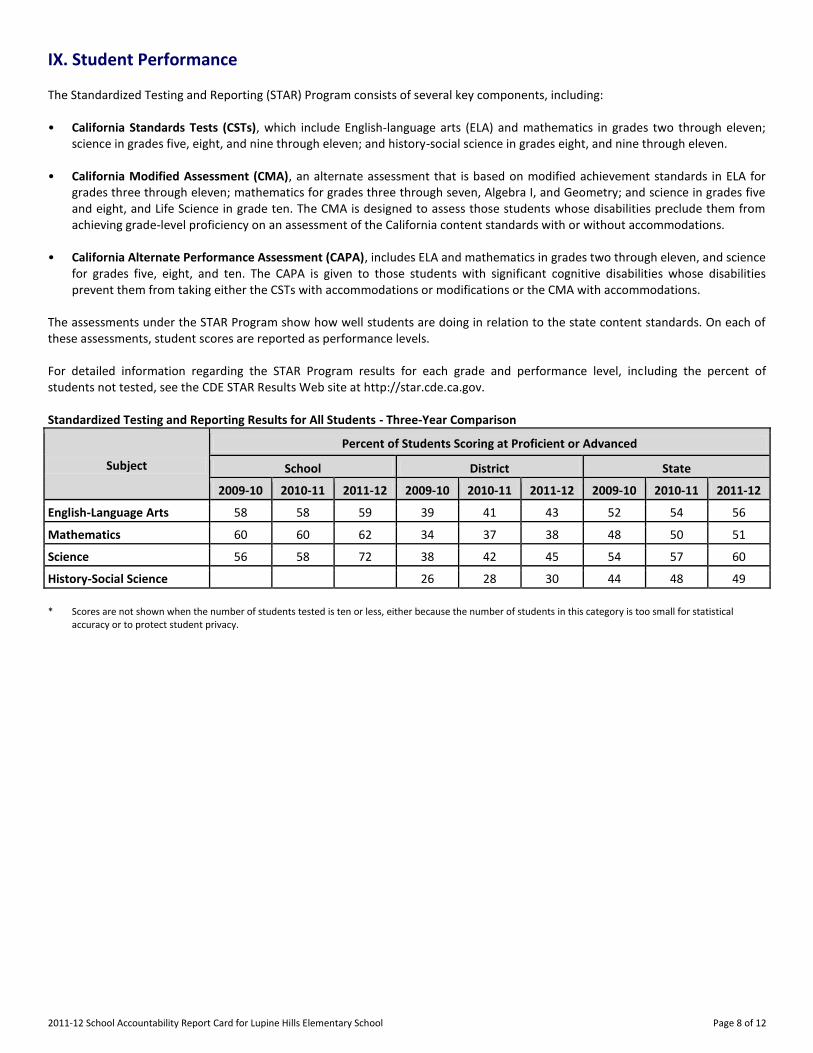
The assessments under the STAR Program show how well students are doing in relation to the state content standards. On each of these assessments, student scores are reported as performance levels. For detailed information regarding the STAR Program results for each grade and performance level, including the percent of students not tested, see the CDE STAR Results Web site at http://star.cde.ca.gov. Standardized Testing and Reporting Results for All Students - Three-Year Comparison
Subject
Percent of Students Scoring at Proficient or Advanced
School District State
2009-10 2010-11 2011-12 2009-10 2010-11 2011-12 2009-10 2010-11 2011-12
English-Language Arts 58 58 59 39 41 43 52 54 56
Mathematics------- 60 60 62 34 37 38 48 50 51
Science------- 56 58 72 38 42 45 54 57 60
History-Social Science 26 28 30 44 48 49
* Scores are not shown when the number of students tested is ten or less, either because the number of students in this category is too small for statistical
accuracy or to protect student privacy.
2011-12 School Accountability Report Card for Lupine Hills Elementary School Page 9 of 12
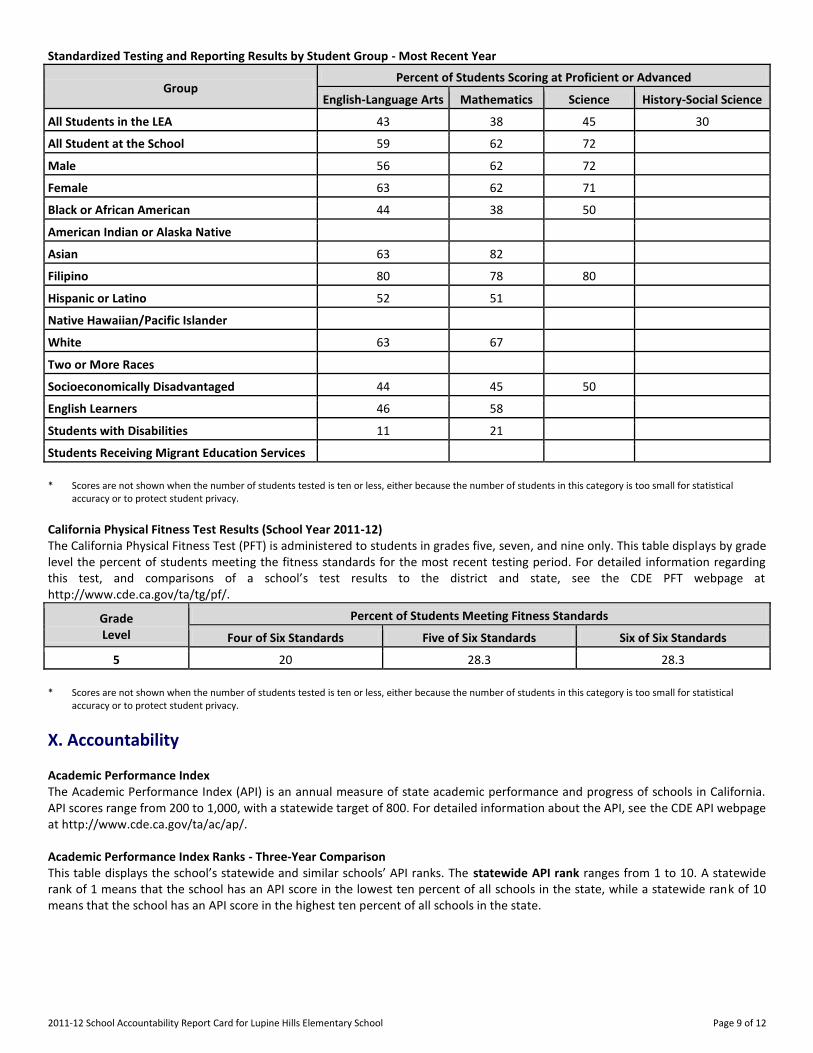
Standardized Testing and Reporting Results by Student Group - Most Recent Year
Group Percent of Students Scoring at Proficient or Advanced
English-Language Arts Mathematics Science History-Social Science
All Students in the LEA 43 38 45 30
All Student at the School 59 62 72
Male------- 56 62 72
Female------- 63 62 71
Black or African American 44 38 50
American Indian or Alaska Native
Asian------- 63 82
Filipino------- 80 78 80
Hispanic or Latino 52 51
Native Hawaiian/Pacific Islander
White------- 63 67
Two or More Races-------
Socioeconomically Disadvantaged 44 45 50
English Learners------- 46 58
Students with Disabilities 11 21
Students Receiving Migrant Education Services
* Scores are not shown when the number of students tested is ten or less, either because the number of students in this category is too small for statistical
accuracy or to protect student privacy. California Physical Fitness Test Results (School Year 2011-12) The California Physical Fitness Test (PFT) is administered to students in grades five, seven, and nine only. This table displays by grade level the percent of students meeting the fitness standards for the most recent testing period. For detailed information regarding this test, and comparisons of a school’s test results to the district and state, see the CDE PFT webpage at http://www.cde.ca.gov/ta/tg/pf/.
Grade Level
Percent of Students Meeting Fitness Standards
Four of Six Standards Five of Six Standards Six of Six Standards
-------5------- 20 28.3 28.3
* Scores are not shown when the number of students tested is ten or less, either because the number of students in this category is too small for statistical
accuracy or to protect student privacy.
X. Accountability
Academic Performance Index The Academic Performance Index (API) is an annual measure of state academic performance and progress of schools in California. API scores range from 200 to 1,000, with a statewide target of 800. For detailed information about the API, see the CDE API webpage at http://www.cde.ca.gov/ta/ac/ap/. Academic Performance Index Ranks - Three-Year Comparison This table displays the school’s statewide and similar schools’ API ranks. The statewide API rank ranges from 1 to 10. A statewide rank of 1 means that the school has an API score in the lowest ten percent of all schools in the state, while a statewide rank of 10 means that the school has an API score in the highest ten percent of all schools in the state.
2011-12 School Accountability Report Card for Lupine Hills Elementary School Page 10 of 12
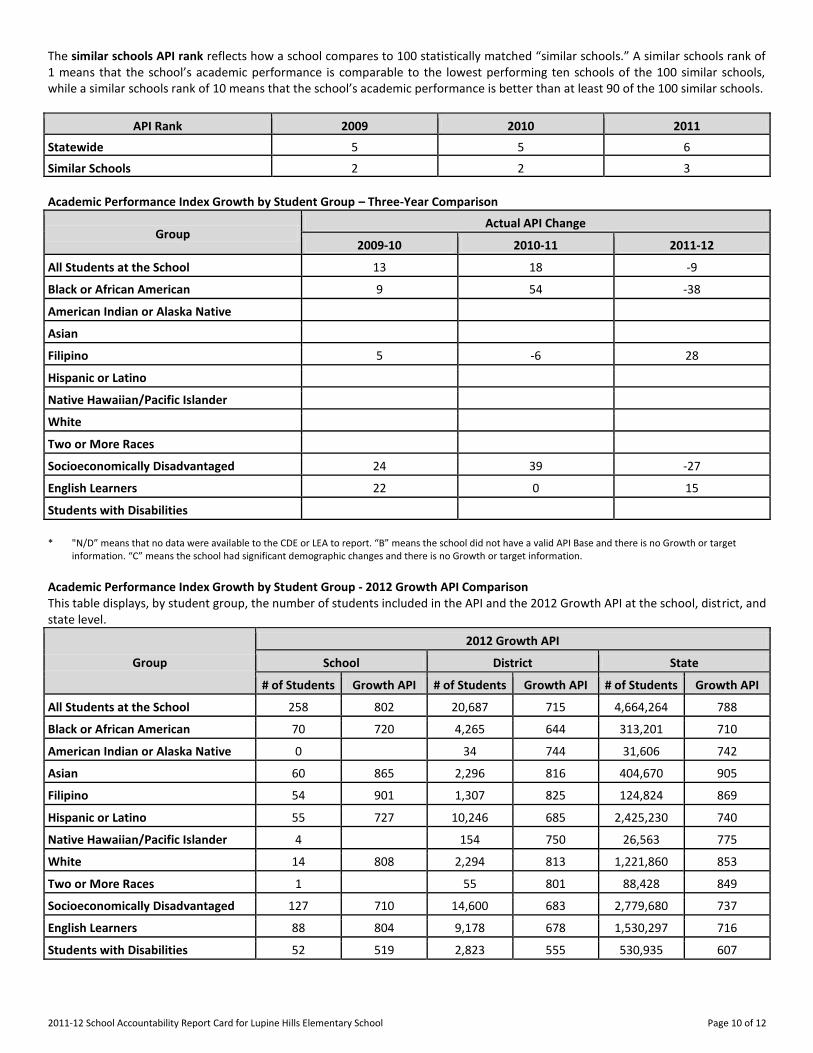
The similar schools API rank reflects how a school compares to 100 statistically matched “similar schools.” A similar schools rank of 1 means that the school’s academic performance is comparable to the lowest performing ten schools of the 100 similar schools, while a similar schools rank of 10 means that the school’s academic performance is better than at least 90 of the 100 similar schools.
API Rank 2009 2010 2011
Statewide------- 5 5 6
Similar Schools------- 2 2 3
Academic Performance Index Growth by Student Group – Three-Year Comparison
Group Actual API Change
2009-10 2010-11 2011-12
All Students at the School 13 18 -9
Black or African American 9 54 -38
American Indian or Alaska Native
Asian-------
Filipino------- 5 -6 28
Hispanic or Latino
Native Hawaiian/Pacific Islander
White-------
Two or More Races
Socioeconomically Disadvantaged 24 39 -27
English Learners 22 0 15
Students with Disabilities
* "N/D” means that no data were available to the CDE or LEA to report. “B” means the school did not have a valid API Base and there is no Growth or target
information. “C” means the school had significant demographic changes and there is no Growth or target information.
Academic Performance Index Growth by Student Group - 2012 Growth API Comparison This table displays, by student group, the number of students included in the API and the 2012 Growth API at the school, district, and state level.
Group
2012 Growth API
School District State
# of Students Growth API # of Students Growth API # of Students Growth API
All Students at the School 258 802 20,687 715 4,664,264 788
Black or African American 70 720 4,265 644 313,201 710
American Indian or Alaska Native 0 34 744 31,606 742
Asian------- 60 865 2,296 816 404,670 905
Filipino------- 54 901 1,307 825 124,824 869
Hispanic or Latino 55 727 10,246 685 2,425,230 740
Native Hawaiian/Pacific Islander 4 154 750 26,563 775
White------- 14 808 2,294 813 1,221,860 853
Two or More Races 1 55 801 88,428 849
Socioeconomically Disadvantaged 127 710 14,600 683 2,779,680 737
English Learners 88 804 9,178 678 1,530,297 716
Students with Disabilities 52 519 2,823 555 530,935 607
2011-12 School Accountability Report Card for Lupine Hills Elementary School Page 11 of 12
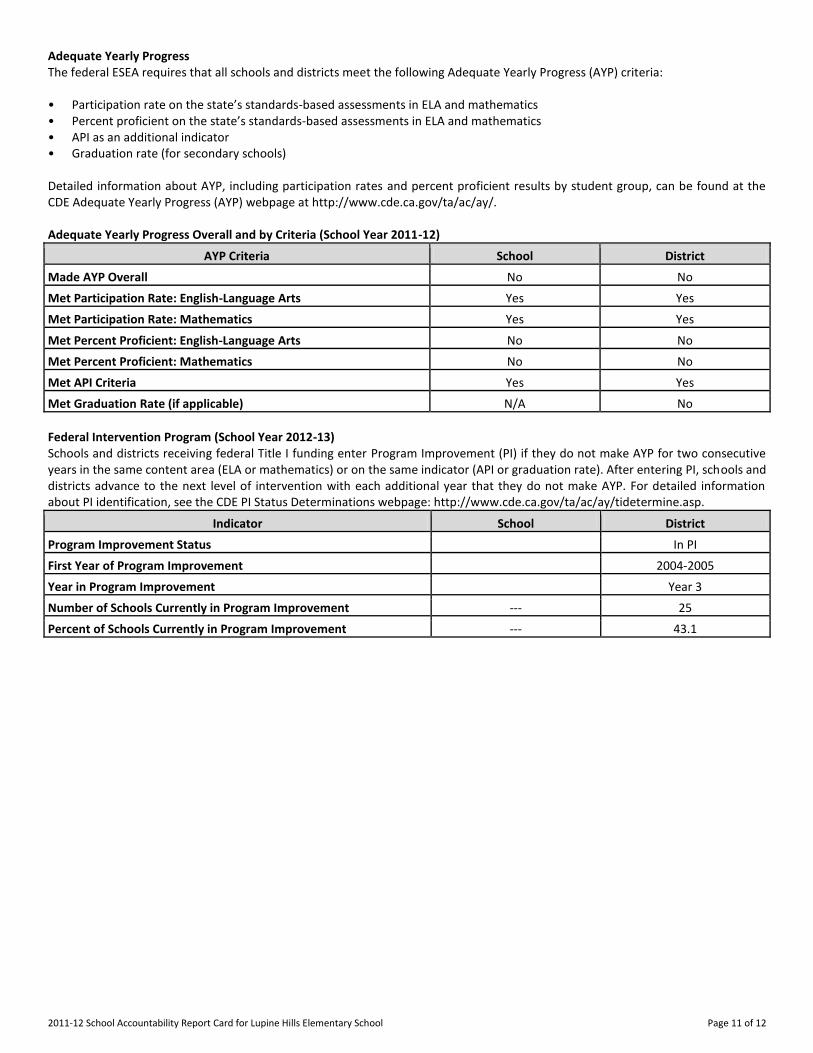
Adequate Yearly Progress The federal ESEA requires that all schools and districts meet the following Adequate Yearly Progress (AYP) criteria: • Participation rate on the state’s standards-based assessments in ELA and mathematics • Percent proficient on the state’s standards-based assessments in ELA and mathematics • API as an additional indicator • Graduation rate (for secondary schools) Detailed information about AYP, including participation rates and percent proficient results by student group, can be found at the CDE Adequate Yearly Progress (AYP) webpage at http://www.cde.ca.gov/ta/ac/ay/. Adequate Yearly Progress Overall and by Criteria (School Year 2011-12)
AYP Criteria School District
Made AYP Overall No No
Met Participation Rate: English-Language Arts Yes Yes
Met Participation Rate: Mathematics Yes Yes
Met Percent Proficient: English-Language Arts No No
Met Percent Proficient: Mathematics No No
Met API Criteria Yes Yes
Met Graduation Rate (if applicable) N/A No
Federal Intervention Program (School Year 2012-13) Schools and districts receiving federal Title I funding enter Program Improvement (PI) if they do not make AYP for two consecutive years in the same content area (ELA or mathematics) or on the same indicator (API or graduation rate). After entering PI, schools and districts advance to the next level of intervention with each additional year that they do not make AYP. For detailed information about PI identification, see the CDE PI Status Determinations webpage: http://www.cde.ca.gov/ta/ac/ay/tidetermine.asp.
Indicator School District
Program Improvement Status In PI
First Year of Program Improvement 2004-2005
Year in Program Improvement Year 3
Number of Schools Currently in Program Improvement --- 25
Percent of Schools Currently in Program Improvement --- 43.1
2011-12 School Accountability Report Card for Lupine Hills Elementary School Page 12 of 12
XI. Instructional Planning and Scheduling
Professional Development This section provides information on the number of days provided for professional development and continuous professional growth in the most recent three year period. Questions that may be answered include: • What are the primary/major areas of focus for staff development and specifically how were they selected? For example, were
student achievement data used to determine the need for professional development in reading instruction? • What are the methods by which professional development is delivered (e.g., after school workshops, conference attendance,
individual mentoring, etc.)? • How are teachers supported during implementation (e.g., through in-class coaching, teacher-principal meetings, student
performance, and data reporting, etc.)?
Edusoft Training Computer Training Leap Frog Intervention Training Language Arts Training English Learner Training Intervention Strategies New Marh Curriculum 2010-2011 DIBELS Equity professional development with Sharroky Hollie Quality instruction and instructional leadership are at the heart of the district's achievement efforts. To ensure this, the Academic Support Division engages teachers, administrators and other personnel in ongoing professional development focused on improving teaching and learning. Training is provided to principals and other administrators to improve their ability to provide strong instructional leadership and guide teaching and learning at school sites. The principals, in turn, provide support to teachers through staff conferences, opportunities for collaborative study and planning, and individual coaching based on ongoing classroom observations. Teachers and other staff are provided with both on and off-site professional development in all standards based curriculum content areas. Beyond the content areas, professional development is provided in English Language Development, differentiated instruction and educational technology. In addition, training is made available in classroom management and the effective use of assessment data and teacher data teams in meeting the needs of all students. A primary goal of the professional development program is ensuring that all students are served by skilled, highly qualified teachers and that teachers are supported by strong, knowledgeable instructional leaders.