Embed Size (px)
DESCRIPTION
LUNG TRANSPLANTATION. Adult Recipients. 2014. JHLT. 2014 Oct; 33(10): 1009-1024. Table of Contents. Donor, recipient and center characteristics: slides 3-24 Post transplant survival and rejection: slides 25-56 - PowerPoint PPT Presentation
Citation preview

LUNG TRANSPLANTATION
Adult Recipients
2014JHLT. 2014 Oct; 33(10): 1009-1024

Table of Contents
Donor, recipient and center characteristics: slides 3-24
Post transplant survival and rejection: slides 25-56
Functional and employment status and rehospitalization
post transplant: slides 58-61
Induction and maintenance immunosuppression: slides
62-84
Post transplant morbidities: slides 85-107
Multivariable analyses: slides 108-169
2014JHLT. 2014 Oct; 33(10): 1009-1024

Donor, Recipient and Center Characteristics
2014JHLT. 2014 Oct; 33(10): 1009-1024

Adult Lung RetransplantsRetransplants by Year and Location
19901992
19941996
19982000
20022004
20062008
20102012
0
20
40
60
80
100
120
140
160
180
200
0
1
2
3
4
5
6
7
8
9
10
Europe North AmericaOthers % of retransplants
N o
f R
etr
an
sp
lan
ts
Ov
era
ll %
of
Re
txs
2014JHLT. 2014 Oct; 33(10): 1009-1024

Adult Lung RetransplantsRetransplants by Inter-transplant Interval
(Retransplants: January 1990 – June 2013)
<1 month 1 month-<1 year
1-<3 years 3-<5 years 5-<10 years
10+ years Not re-
ported
0
10
20
30
40
10.5 12.8
27.1
16.219.7
5.38.4
Time Between Previous and Current Transplant
% o
f R
etr
an
sp
lan
ts
2014JHLT. 2014 Oct; 33(10): 1009-1024

Adult Lung TransplantsAverage Center Volume by Location(Transplants: January 2000 – June 2013)
1-4 5-9 10-19 20-29 30-39 40-49 50+0
10
20
30
40
50
60
19
9
1914
5 3 2
26
10
20
11
11
4 6
11
6
3
0
1
20
Other
North America
Europe
Average number of lung transplants per year
Nu
mb
er
of
Ce
nte
rs
2014JHLT. 2014 Oct; 33(10): 1009-1024

Adult Lung TransplantsAverage Center Volume by Location(Transplants: January 2008 – June 2013)
1-4 5-9 10-19 20-29 30-39 40-49 50+0
10
20
30
40
50
60
115
16 138
3 5
15
9
20
812
58
3
6
6
0 0
2
1
Other
North America
Europe
Average number of lung transplants per year
Nu
mb
er
of
Ce
nte
rs
2014JHLT. 2014 Oct; 33(10): 1009-1024

Adult Lung TransplantsIndications (Transplants: January 1995 – June 2013)
Diagnosis SLT (N = 15,321) BLT (N = 26,579) TOTAL (N = 41,900)
COPD/Emphysema 6,594 ( 43.0%) 7,078 ( 26.6%) 13,672 ( 32.6%)
Idiopathic Pulmonary Fibrosis 5,354 ( 34.9%) 4,825 ( 18.2%) 10,179 ( 24.3%)
Cystic Fibrosis 234 ( 1.5%) 6,628 ( 24.9%) 6,862 ( 16.4%)
Alpha-1 771 ( 5.0%) 1,572 ( 5.9%) 2,343 ( 5.6%)
Idiopathic Pulmonary Arterial Hypertension 92 ( 0.6%) 1,158 ( 4.4%) 1,250 ( 3.0%)
Pulmonary Fibrosis, Other 677 ( 4.4%) 970 ( 3.6%) 1,647 ( 3.9%)
Bronchiectasis 62 ( 0.4%) 1,069 ( 4.0%) 1,131 ( 2.7%)
Sarcoidosis 280 ( 1.8%) 776 ( 2.9%) 1,056 ( 2.5%)
Retransplant: Obliterative Bronchiolitis 312 ( 2.0%) 379 ( 1.4%) 691 ( 1.6%)
Connective Tissue Disease 177 ( 1.2%) 409 ( 1.5%) 586 ( 1.4%)
Obliterative Bronchiolitis (Not Retransplant) 105 ( 0.7%) 351 ( 1.3%) 456 ( 1.1%)
LAM 138 ( 0.9%) 302 ( 1.1%) 440 ( 1.1%)
Retransplant: Not Obliterative Bronchiolitis 205 ( 1.3%) 227 ( 0.9%) 432 ( 1.0%)
Congenital Heart Disease 58 ( 0.4%) 291 ( 1.1%) 349 ( 0.8%)
Cancer 7 ( 0.0%) 29 ( 0.1%) 36 ( 0.1%)
Other 255 ( 1.7%) 515 ( 1.9%) 770 ( 1.8%)
For some retransplants, diagnosis other than retransplant was reported, so the total number and percentage of retransplants may be greater.
2014JHLT. 2014 Oct; 33(10): 1009-1024

Adult Lung TransplantsDistribution of Procedure Type for Major Indications by Year
Year of TX
Alpha-1 COPD Cystic Fibrosis IPF IPAH
Double Single Double Single Double Single Double Single Double Single
1998 49.3 50.7 29.8 70.2 93.6 6.4 19.2 80.8 87.0 13.0
1999 46.6 53.4 28.1 71.9 91.3 8.7 23.3 76.7 86.4 13.6
2000 57.9 42.1 29.3 70.7 93.9 6.1 30.9 69.1 93.0 7.0
2001 60.1 39.9 30.0 70.0 93.8 6.2 31.4 68.6 89.8 10.2
2002 56.6 43.4 38.9 61.1 96.2 3.8 35.1 64.9 87.9 12.1
2003 65.7 34.3 43.0 57.0 95.6 4.4 41.6 58.4 95.5 4.5
2004 73.4 26.6 45.9 54.1 96.3 3.7 44.7 55.3 94.4 5.6
2005 77.0 23.0 49.0 51.0 97.3 2.7 46.0 54.0 92.4 7.6
2006 71.8 28.2 58.2 41.8 98.5 1.5 47.6 52.4 100.0 0.0
2007 81.7 18.3 63.4 36.6 97.6 2.4 49.4 50.6 94.7 5.3
2008 80.2 19.8 65.4 34.6 98.6 1.4 52.0 48.0 94.1 5.9
2009 86.7 13.3 66.3 33.7 99.6 0.4 51.8 48.2 97.3 2.7
2010 85.8 14.2 70.3 29.7 99.4 0.6 55.8 44.2 94.7 5.3
2011 87.7 12.3 72.8 27.2 98.6 1.4 54.5 45.5 96.8 3.2
2012 92.1 7.9 73.9 26.1 98.4 1.6 60.1 39.9 95.0 5.0
2014JHLT. 2014 Oct; 33(10): 1009-1024

Adult Lung TransplantsProcedure Type within Indication, by Year
1998
2000
2002
2004
2006
2008
2010
2012
1998
2000
2002
2004
2006
2008
2010
2012
1998
2000
2002
2004
2006
2008
2010
2012
1998
2000
2002
2004
2006
2008
2010
2012
0%
10%
20%
30%
40%
50%
60%
70%
80%
90%
100%Bilateral/Double Lung Transplant Single Lung Transplant
% o
f T
ran
sp
lan
ts
AT Def COPD IPF IPAH
2014JHLT. 2014 Oct; 33(10): 1009-1024

Adult Lung TransplantsIndications for Single Lung Transplants
(Transplants: January 1995 – June 2013)
5%
43%
2%
35%1%
3%
11%
Alpha-1 COPD CF IPF IPAH Retx Other*
*Other includes:
Pulmonary Fibrosis, Other: 4.4%
Bronchiectasis: 0.4%
Sarcoidosis: 1.8%
Connective Tissue Disease: 1.2%
OB (non-Retx): 0.7%
LAM: 0.9%
Congenital Heart Disease: 0.4%
Miscellaneous: 1.7%
2014 For some retransplants, diagnosis other than retransplant was reported, so the total percentage of retransplants may be greater.
JHLT. 2014 Oct; 33(10): 1009-1024

Adult Lung TransplantsIndications for Bilateral/Double Lung Transplants
(Transplants: January 1995 – June 2013)
6%
27%
25%
18% 4% 2%
18%
Alpha-1 COPD CF IPF IPAH Retx Other*
*Other includes:
Pulmonary Fibrosis, Other: 3.6%
Bronchiectasis: 4.0%
Sarcoidosis: 2.9%
Connective Tissue Disease: 1.5%
OB (non-Retx): 1.3%
LAM: 1.1%
Congenital Heart Disease: 1.1%
Miscellaneous: 2.0%
2014 For some retransplants, diagnosis other than retransplant was reported, so the total percentage of retransplants may be greater.
JHLT. 2014 Oct; 33(10): 1009-1024

Adult Lung TransplantsMajor Indications by Year (%)
19901991
19921993
19941995
19961997
19981999
20002001
20022003
20042005
20062007
20082009
20102011
20120
20
40
60
80
100 CF IPF COPD Alpha-1 IPAH Retx
Transplant Year
% o
f T
ran
sp
lan
ts
2014 For some retransplants, diagnosis other than retransplant was reported, so the total percentage of retransplants may be greater.
JHLT. 2014 Oct; 33(10): 1009-1024

Adult Lung TransplantsMajor Indications by Year (Number)
1990
1991
1992
1993
1994
1995
1996
1997
1998
1999
2000
2001
2002
2003
2004
2005
2006
2007
2008
2009
2010
2011
2012
0
500
1,000
1,500
2,000
2,500
3,000
3,500
CF IPF COPD Alpha-1 IPAH Retx
Transplant Year
Nu
mb
er
of
Tra
ns
pla
nts
2014 For some retransplants, diagnosis other than retransplant was reported, so the total number of retransplants may be greater.
JHLT. 2014 Oct; 33(10): 1009-1024

Adult Lung TransplantsDiagnosis Distribution by Location(Transplants: January 2000 – June 2013)
0%
20%
40%
60%
80%
100%
Europe North America Other
Other
Sarcoidosis
Retx
Pulmonary Fibrosis, Other
IPAH
IPF
CF
COPD
Bronchiectasis
Alpha-1% o
f T
ran
sp
lan
ts
2014 For some retransplants, diagnosis other than retransplant was reported, so the total percentage of retransplants may be greater.
JHLT. 2014 Oct; 33(10): 1009-1024

Adult Lung TransplantsDiagnosis Distribution by Location and Era
(Transplants: January 2000 – June 2013)
0%
20%
40%
60%
80%
100%
Alpha-1 Bronchiectasis COPD CF IPF IPAH Pulmonary Fibrosis, Other Retx Sarcoidosis
Other
% o
f T
ran
sp
lan
ts
2005 - 6/2013
Europe North America Other
2005 - 6/20132005 - 6/20132000 - 2004 2000 - 2004 2000 - 2004
2014 For some retransplants, diagnosis other than retransplant was reported, so the total percentage of retransplants may be greater.
JHLT. 2014 Oct; 33(10): 1009-1024

Adult Lung TransplantsRecipient Characteristics by Transplant Type
(Transplants: January 2000 – June 2013)Primary (N=34,408) First Retransplant (N=1,443) p-value
Recipient age (years) 55.0 (23.0 - 67.0) 46.0 (21.0 - 65.0) <0.0001
Recipient genderMale 56.3% 53.4%
0.0330Female 43.7% 46.6%
Diagnosis
Alpha-1 5.0% 1.2%
<0.0001
COPD 32.9% 5.7%
CF 16.6% 6.5%
IPF 26.5% 7.6%
IPAH 2.7% 1.4%
Retx 0.0% 65.9%
Other 16.4% 11.6%
Location
Europe 36.4% 38.8%
0.0714North America 56.9% 55.6%
Other 6.7% 5.5%
Age is expressed as median (5th-95th percentiles) 2014JHLT. 2014 Oct; 33(10): 1009-1024

Adult Lung TransplantsDonor and Donor/Recipient Characteristics by Transplant
Type (Transplants: January 2000 – June 2013)
Primary (N=34,408) First Retransplant* (N=1,443) p-value
Donor age (years) 38.0 (16.0 - 61.0) 38.0 (16.0 - 62.0) 0.7457
Donor/recipient CMV status
D(-)/R(-) 17.5% 11.8%
<0.0001D(-)/R(+) 21.8% 19.4%
D(+)/R(-) 24.2% 20.0%
D(+)/R(+) 36.4% 48.8%
Donor cause of death
Head Trauma 40.2% 42.7%
0.1879Stroke 39.8% 37.3%
Other 20.0% 20.0%
Age is expressed as median (5th-95th percentiles)* at time of retransplant
2014JHLT. 2014 Oct; 33(10): 1009-1024

Adult Lung TransplantsTransplant Type Distribution by Era(Transplants: January 1990 – June 2013)
1990-1997 1998-2004 2005-6/20130%
20%
40%
60%
80%
100%
Primary Retransplant
% o
f T
ran
sp
lan
ts
2014JHLT. 2014 Oct; 33(10): 1009-1024

Adult Lung TransplantsTransplant Type Distribution by Recipient Age Group
(Transplants: January 1990 – June 2013)
18-34 35-49 50-59 60-65 >650%
20%
40%
60%
80%
100%
Primary Retransplant
% o
f T
ran
sp
lan
ts
2014JHLT. 2014 Oct; 33(10): 1009-1024

Adult Lung TransplantsTransplant Type Distribution by Recipient Age Group
(Transplants: January 2005 – June 2013)
18-34 35-49 50-59 60-65 >650%
20%
40%
60%
80%
100%
Primary Retransplant
% o
f T
ran
sp
lan
ts
2014JHLT. 2014 Oct; 33(10): 1009-1024

Adult Lung TransplantsTransplant Type Distribution by Recipient Gender
(Transplants: January 1990 – June 2013)
Male Female0%
20%
40%
60%
80%
100%
Primary Retransplant
% o
f T
ran
sp
lan
ts
2014JHLT. 2014 Oct; 33(10): 1009-1024

Adult Lung TransplantsTransplant Type Distribution by Diagnosis
(Transplants: January 1990 – June 2013)
Alpha-1 COPD CF IPF IPAH Retx Other*0%
20%
40%
60%
80%
100%
Primary Retransplant
% o
f T
ran
sp
lan
ts
2014JHLT. 2014 Oct; 33(10): 1009-1024

Adult Lung TransplantsTransplant Type Distribution by Location
(Transplants: January 1990 – June 2013)
Europe North America Other0%
20%
40%
60%
80%
100%
Primary Retransplant
% o
f T
ran
sp
lan
ts
2014JHLT. 2014 Oct; 33(10): 1009-1024

Post Transplant Survival and Rejection
2014JHLT. 2014 Oct; 33(10): 1009-1024

Adult Lung TransplantsKaplan-Meier Survival (Transplants: January 1990 – June 2012)
0 1 2 3 4 5 6 7 8 9 10 11 12 13 14 15 16 17 18 190
10
20
30
40
50
60
70
80
90
100
Years
Su
rviv
al (
%)
N = 43,501
Median survival = 5.6 years
2014JHLT. 2014 Oct; 33(10): 1009-1024
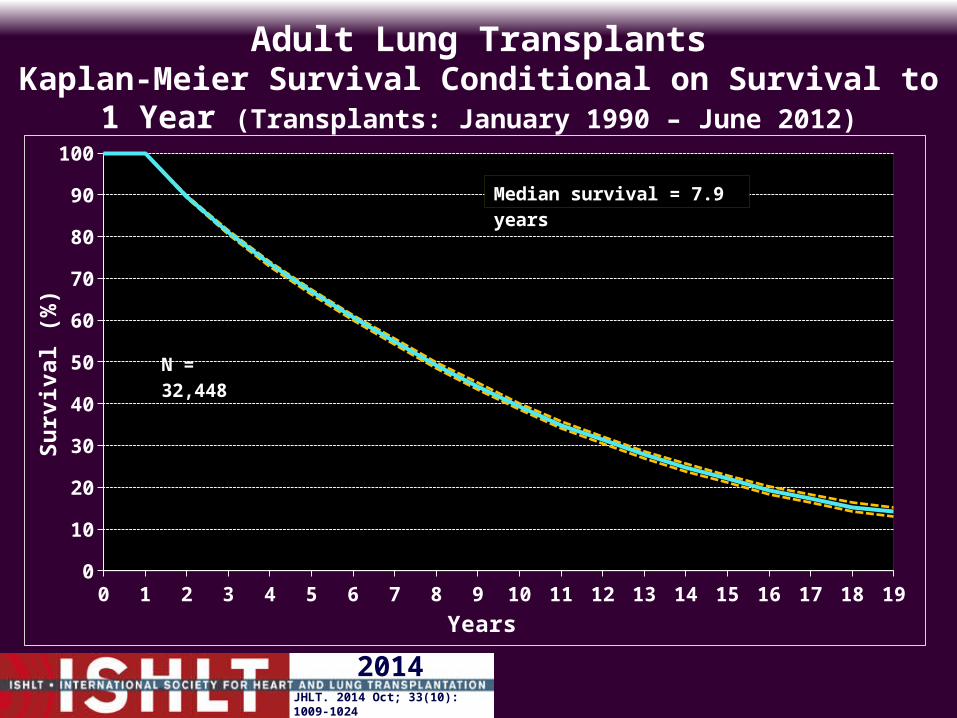
Adult Lung TransplantsKaplan-Meier Survival Conditional on Survival to 1 Year
(Transplants: January 1990 – June 2012)
0 1 2 3 4 5 6 7 8 9 10 11 12 13 14 15 16 17 18 190
10
20
30
40
50
60
70
80
90
100
Years
Su
rviv
al (
%)
N = 32,448
Median survival = 7.9 years
2014JHLT. 2014 Oct; 33(10): 1009-1024

Adult Lung TransplantsKaplan-Meier Survival by Procedure Type
(Transplants: January 1994 – June 2012)
0 1 2 3 4 5 6 7 8 9 10 11 12 13 14 15 16 17 180
10
20
30
40
50
60
70
80
90
100
Bilateral/Double Lung (N=25,041)
Single Lung (N=15,251)
Years
Su
rviv
al (
%)
Median survival (years):Bilateral/Double lung: 7.1; Conditional = 9.7Single lung: 4.6; Conditional = 6.5
p < 0.0001
2014JHLT. 2014 Oct; 33(10): 1009-1024

Adult Lung RetransplantsKaplan-Meier Survival (Retransplants: January 1982 – June 2011)
0 1 2 3 4 5 6 7 8 9 10 11 12 13 14 15 160
10
20
30
40
50
60
70
80
90
100
Years
Su
rviv
al (
%)
N =1,673
Median survival = 2.5 yearsConditional median survival = 6.3 years f
2014JHLT. 2014 Oct; 33(10): 1009-1024

Adult Lung TransplantsKaplan-Meier Survival by Transplant Type
(Transplants: January 1990 – June 2012)
0 1 2 3 4 5 6 7 8 9 10 11 12 13 14 15 160
10
20
30
40
50
60
70
80
90
100
Primary (N=41,767)
First Retransplant (N=1,673)
Years
Su
rviv
al (
%)
Median survival (years): Primary: 5.7; Conditional=7.9Retransplant: 2.5; Conditional=6.3
p < 0.0001
2014JHLT. 2014 Oct; 33(10): 1009-1024

Adult Lung TransplantsKaplan-Meier Survival by Inter-transplant Interval
(Transplants: January 1990 – June 2012)
0 1 2 3 4 5 6 7 8 9 10 110
10
20
30
40
50
60
70
80
90
100Primary <1 month 1 month-
<1 year1-<3 years 3-<5 years 5+ years
Years
Su
rviv
al (
%)
All pair-wise comparisons were significant at p < 0.05 except Primary vs. 5+ years, 1 month–<1 year vs. 1-<3 years, 1 month-<1 year vs. 3-<5 years, 1-<3 years vs. 3-<5 years and 3-<5 years vs. 5+ years
2014 Retransplants are limited to first retransplant recipientsJHLT. 2014 Oct; 33(10): 1009-1024

Adult Lung TransplantsKaplan-Meier Survival by Era
(Transplants: January 1990 – June 2012)
0 1 2 3 4 5 6 7 8 9 10 11 12 13 14 150
10
20
30
40
50
60
70
80
90
100
1990-1997 (N=8,372)1998-2004 (N=12,108)2005-6/2012 (N=23,021)
Years
Su
rviv
al (
%)
N at risk = 1,250
N at risk = 61
N at risk = 792
Median survival (years):1990-1997: 4.1; Conditional = 7.01998-2004: 5.7; Conditional = 8.32005-6/2012: 6.1; Conditional = NA
All pair-wise comparisons were significant at p <0.001
2014JHLT. 2014 Oct; 33(10): 1009-1024

Adult Lung TransplantsKaplan-Meier Survival by Era and Transplant Type
(Transplants: January 1990 – June 2012)
0 1 2 3 4 5 6 7 8 9 10 11 12 13 14 150
10
20
30
40
50
60
70
80
90
100
Primary 1990-1997 (N=8,041) Primary 1998-2004 (N=11,748)Primary 2005-6/2012 (N=21,978) First Retx 1990-1997 (N=322)Frist Retx 1998-2004 (N=335) First Retx 2005-6/2012 (N=1,016)
Years
Su
rviv
al (
%)
Median survival (years): Primary: 1990-97=4.3; 1998-04=5.8; 2005-6/12=6.3Retx: 1990-97=1.0; 1998-04=1.9; 2005-6/12=3.0
All pair-wise comparisons between transplant types within each era and between eras within each transplant type were significant at p < 0.05 except forRetx: 1990-1997 vs. 1998-2004Retx: 1998-2004 vs. 2005-6/2012
2014JHLT. 2014 Oct; 33(10): 1009-1024

Adult Lung TransplantsKaplan-Meier Survival by Transplant Type and Age Group
(Transplants: January 1990 – June 2012)
0 1 2 3 4 5 6 7 8 9 10 11 12 13 140
10
20
30
40
50
60
70
80
90
100
Primary 18-34 (N=7,053) Primary 35-49 (N=9,615) Primary 50-59 (N=14,535)
Primary 60+ (N=10,564) First Retx 18-34 (N=484) First Retx 35-49 (N=491)
First Retx 50-59 (N=434) First Retx 60+ (N=264)
Years
Su
rviv
al (
%)
All pair-wise comparisons between transplant types within each age group and between age groups for primary transplants were significant at p < 0.05. No pair-wise comparisons between age groups for first retransplants were significant at p < 0.05 except 18-34 vs. 60+ and 35-49 vs. 60+.
2014JHLT. 2014 Oct; 33(10): 1009-1024

Adult Lung TransplantsKaplan-Meier Survival by Gender(Transplants: January 1990 – June 2012)
0 1 2 3 4 5 6 7 8 9 10 11 12 13 14 15 16 17 18 190
10
20
30
40
50
60
70
80
90
100
Male (N=23,855)
Female (N=19,644)
Years
Su
rviv
al (
%)
Median survival (years): Male = 5.4; Female = 5.8
p < 0.0001
N at risk = 88
N at risk = 78
2014JHLT. 2014 Oct; 33(10): 1009-1024

Adult Lung TransplantsKaplan-Meier Survival by Transplant Type and Gender
(Transplants: January 1990 – June 2012)
0 1 2 3 4 5 6 7 8 9 10 11 12 13 14 15 16 17 18 190
10
20
30
40
50
60
70
80
90
100
Primary/Male (N=22,963) Primary/Female (N=18,803)
First Retx/Male (N=865) First Retx/Female (N=807)
Years
Su
rviv
al (
%)
Median survival (years): Primary: Male = 5.5; Female = 6.0First Retx: Male = 2.4; Female = 2.6
All pair-wise comparisons were significant at p < 0.05 exceptRetx: male vs. female
2014JHLT. 2014 Oct; 33(10): 1009-1024

Adult Lung TransplantsKaplan-Meier Survival by Diagnosis
(Transplants: January 1990 – June 2012)
0 1 2 3 4 5 6 7 8 9 10 11 12 13 14 150
10
20
30
40
50
60
70
80
90
100Alpha-1 (N=2,764) CF (N=6,766) COPD (N=13,973)
IPF (N=9,673) IPAH (N=1,488) Sarcoidosis (N=1,044)
Years
Su
rviv
al (
%)
Median survival (years): Alpha-1=6.4; CF=8.3; COPD=5.5; IPF=4.7; IPAH=5.5; Sarcoidosis=5.7
All pair-wise comparisons with CF were significant at p < 0.0001Alpha-1 vs. COPD: p < 0.0001Alpha-1 vs. IPF: p < 0.0001COPD vs. IPF: p < 0.001IPF vs. IPAH: p = 0.0362
2014JHLT. 2014 Oct; 33(10): 1009-1024

Adult Lung TransplantsKaplan-Meier Survival by Transplant Type and Diagnosis
(Transplants: January 1990 – June 2012)
0 1 2 3 4 5 6 7 8 9 10 11 12 13 14 150
10
20
30
40
50
60
70
80
90
100
Primary/CF (N=6,653) Primary/COPD (N=13,861)Primary/IPF (N=9,541) First Retx/CF (N=101)First Retx/COPD (N=104) First Retx/IPF (N=129)
Years
Su
rviv
al (
%)
Median survival (years): Primary: CF=8.3; COPD=5.5; IPF=4.7Retransplant: CF=3.2; COPD=1.8; IPF=3.1
All pair-wise comparisons between transplant types within COPD and CF and between diagnoses for primary transplants were significant at p < 0.001. No other pair-wise comparisons within diagnosis or transplant type were significant at < 0.05
2014JHLT. 2014 Oct; 33(10): 1009-1024

Adult Lung TransplantsKaplan-Meier Survival by Diagnosis Conditional on
Survival to 3 Months (Transplants: January 1990 – June 2012)
0 1 2 3 4 5 6 7 8 9 10 11 12 13 14 150
10
20
30
40
50
60
70
80
90
100
Alpha-1 (N=2,401) CF (N=6,009)
COPD (N=12,511) IPF (N=8,183)
IPAH (N=1,131) Sarcoidosis (N=883)
Years
Su
rviv
al (
%)
Median survival (years): Alpha-1=7.7; CF=10.0; COPD=6.2; IPF=5.9; IPAH=9.2; Sarcoidosis=7.3
All pair-wise comparisons were significant at p < 0.05 except Alpha-1 vs. Sarcoidosis, COPD vs. IPF, CF vs. IPAH and IPAH vs. Sarcoidosis
2014JHLT. 2014 Oct; 33(10): 1009-1024

Adult Lung TransplantsKaplan-Meier Survival by Transplant Type and Diagnosis Conditional
on Survival to 3 Months (Transplants: January 1990 – June 2012)
0 1 2 3 4 5 6 7 8 9 10 11 12 13 14 150
10
20
30
40
50
60
70
80
90
100
Primary/CF (N=5,934) Primary/COPD (N=12,433)Primary/IPF (N=8,094) First Retx/CF (N=67)First Retx/COPD (N=73) First Retx/IPF (N=86)
Years
Su
rviv
al (
%)
Median survival (years): Primary: CF=10.0; COPD=6.2; IPF=5.9Retransplant: CF=NA; COPD=5.9; IPF=NA
No pair-wise comparisons between transplant types within each diagnosis and between diagnoses within each transplant type were significant at p < 0.05 except Primary: CF vs. COPD and Primary: CF vs. IPF
2014JHLT. 2014 Oct; 33(10): 1009-1024

Adult Lung TransplantsKaplan-Meier Survival by Diagnosis Conditional on Survival to 1 Year (Transplants: January 1990 – June 2012)
0 1 2 3 4 5 6 7 8 9 10 11 12 13 14 150
10
20
30
40
50
60
70
80
90
100
Alpha-1 (N=2,119) CF (N=5,305)COPD (N=10,973) IPF (N=6,853)IPAH (N=1,008) Sarcoidosis (N=746)
Years
Su
rviv
al (
%)
Median survival (years): Alpha-1=8.7; CF=11.1; COPD=7.0; IPF=7.0; IPAH=10.1; Sarcoidosis=8.9
All pair-wise comparisons were significant at p < 0.05 except CF vs. IPAH, COPD vs. IPF and IPAH vs. Sarcoidosis
2014JHLT. 2014 Oct; 33(10): 1009-1024

Adult Lung TransplantsKaplan-Meier Survival by Procedure Type
(Transplants: January 1990 – June 2012)Diagnosis: Alpha-1 Antitrypsin Deficiency
0 1 2 3 4 5 6 7 8 9 10 11 12 13 14 15 16 170
10
20
30
40
50
60
70
80
90
100
Single Lung (N=1,122)
Bilateral/Double Lung (N=1,641)
Years
Su
rviv
al (
%)
N at risk = 27
N at risk = 34
p < 0.0001
2014JHLT. 2014 Oct; 33(10): 1009-1024

Adult Lung TransplantsKaplan-Meier Survival by Procedure Type
(Transplants: January 1990 – June 2012)Diagnosis: COPD/Emphysema
0 1 2 3 4 5 6 7 8 9 10 11 12 13 14 15 16 170
10
20
30
40
50
60
70
80
90
100
Single Lung (N = 7,377)
Bilateral/Double Lung (N = 6,585)
Years
Su
rviv
al (
%)
N at risk = 39
N at risk = 28
p < 0.0001
2014JHLT. 2014 Oct; 33(10): 1009-1024

Adult Lung TransplantsKaplan-Meier Survival by Procedure Type and Era
(Transplants: January 1990 – June 2012)Diagnosis: COPD/Emphysema, Single Lung
0 1 2 3 4 5 6 7 8 9 10 11 12 130
10
20
30
40
50
60
70
80
90
100
1990-1997 (N = 2,047)
1998-2004 (N = 2,946)
2005-6/2012 (N = 2,384)
Years
Su
rviv
al (
%)
N at risk = 156
N at risk = 90
N at risk = 176
1990-1997 vs. 1998-2004: p < 0.00011990-1997 vs. 2005-6/2012: p < 0.00011998-2004 vs. 2005-6/2012: p = 0.9981
2014JHLT. 2014 Oct; 33(10): 1009-1024

Adult Lung TransplantsKaplan-Meier Survival by Procedure Type and Era
(Transplants: January 1990 – June 2012)Diagnosis: COPD/Emphysema, Bilateral/Double Lung
0 1 2 3 4 5 6 7 8 9 10 11 12 130
10
20
30
40
50
60
70
80
90
100
1990-1997 (N = 579)
1998-2004 (N = 1,625)
2005-6/2012 (N = 4,381)
Years
Su
rviv
al (
%)
N at risk = 87
N at risk = 59
N at risk = 233
1990-1997 vs. 1998-2004: p = 0.01311990-1997 vs. 2005-6/2012: p = 0.00311998-2004 vs. 2005-6/2012: p = 0.7588
2014JHLT. 2014 Oct; 33(10): 1009-1024

Adult Lung TransplantsKaplan-Meier Survival by Procedure Type
(Transplants: January 1990 – June 2012)Diagnosis: Idiopathic Pulmonary Fibrosis
0 1 2 3 4 5 6 7 8 9 10 11 12 13 14 15 160
10
20
30
40
50
60
70
80
90
100
Single Lung (N=5,366)
Bilateral/Double Lung (N=4,304)
Years
Su
rviv
al (
%)
N at risk = 36
N at risk = 15p < 0.0001
2014JHLT. 2014 Oct; 33(10): 1009-1024

Adult Lung TransplantsKaplan-Meier Survival by Procedure Type and Era
(Transplants: January 1990 – June 2012)Diagnosis: Idiopathic Pulmonary Fibrosis, Single Lung
0 1 2 3 4 5 6 7 8 9 10 11 12 130
10
20
30
40
50
60
70
80
90
100
1990-1997 (N = 945)
1998-2004 (N = 1,456)
2005-6/2012 (N = 2,965)
Years
Su
rviv
al (
%)
N at risk = 67
N at risk = 42
N at risk = 140
1990-1997 vs. 1998-2004: p = 0.01541990-1997 vs. 2005-6/2012: p = 0.00441998-2004 vs. 2005-6/2012: p = 0.7211
2014JHLT. 2014 Oct; 33(10): 1009-1024

Adult Lung TransplantsKaplan-Meier Survival by Procedure Type and Era
(Transplants: January 1990 – June 2012)Diagnosis: Idiopathic Pulmonary Fibrosis, Bilateral/Double Lung
0 1 2 3 4 5 6 7 8 9 10 11 12 130
10
20
30
40
50
60
70
80
90
100
1990-1997 (N = 254)
1998-2004 (N = 757)
2005-6/2012 (N = 3,293)
Years
Su
rviv
al (
%)
N at risk = 36
N at risk = 22
N at risk = 148
1990-1997 vs. 1998-2004: p = 0.00221990-1997 vs. 2005-6/2012: p < 0.00011998-2004 vs. 2005-6/2012: p = 0.0035
2014JHLT. 2014 Oct; 33(10): 1009-1024

Adult Lung TransplantsKaplan-Meier Survival by Procedure Type
(Transplants: January 1990 – June 2012)Diagnosis: Idiopathic Arterial Pulmonary Hypertension
0 1 2 3 4 5 6 7 8 9 10 11 12 13 14 15 160
10
20
30
40
50
60
70
80
90
100
Single Lung (N = 283)
Bilateral/Double Lung (N = 1,205)
Years
Su
rviv
al (
%)
N at risk = 20
N at risk = 31p < 0.0001
2014JHLT. 2014 Oct; 33(10): 1009-1024

Adult Lung TransplantsKaplan-Meier Survival by Procedure Type and Era
(Transplants: January 1990 – June 2012)Diagnosis: Cystic Fibrosis, Bilateral/Double Lung
0 1 2 3 4 5 6 7 8 9 10 11 12 130
10
20
30
40
50
60
70
80
90
1001990-1997 (N=1,107)
1998-2004 (N=1,946)
2005-6/2012 (N=3,590)
Years
Su
rviv
al (
%)
N at risk = 221
N at risk = 148
N at risk = 228
1990-1997 vs. 1998-2004: p < 0.00011990-1997 vs. 2005-6/2012: p < 0.00011998-2004 vs. 2005-6/2012: p = 0.0032
2014JHLT. 2014 Oct; 33(10): 1009-1024

Adult Lung TransplantsPercentage Experiencing Treated Rejection between Discharge
and 1-Year Follow-Up (Follow-ups: July 2004 – June 2013)
Overall(N=11,91
3)
18-34(N=1,570)
35-49(N=1,925)
50-59(N=3,619)
60-65(N=3,204)
>65(N=1,595)
Female(N=5,113)
Male(N=6,800)
0
10
20
30
40
50
60
% e
xper
ienc
ing
trea
ted
reje
ctio
n w
ithi
n 1
year
Analysis is limited to patients who were alive at the time of the follow-up Treated rejection = Recipient was reported to (1) have
at least one acute rejection episode that was treated with an anti-rejection agent; or (2) have been hospitalized for rejection.
No pair-wise comparisons were significant at < 0.05 except 18-34 vs. 35-49 and 18-34 vs. 60-65
2014JHLT. 2014 Oct; 33(10): 1009-1024

Adult Lung TransplantsPercentage Experiencing Any Rejection between Discharge
and 1-Year Follow-Up (Follow-ups: July 2004 – June 2013)
Overall(N=11,913
)
18-34(N=1,570)
35-49(N=1,925)
50-59(N=3,619)
60-65(N=3,204)
>65(N=1,595)
Female(N=5,113)
Male(N=6,800)
0
10
20
30
40
50
60
% e
xper
ienc
ing
reje
ctio
n w
ithi
n 1
year
Analysis is limited to patients who were alive at the time of the follow-up No rejection = Recipient had (i) no acute rejection
episodes and (ii) was reported either as not hospitalized for rejection or did not receive anti-rejection agents.
No pair-wise comparisons were significant at < 0.05 except 18-34 vs. 35-49 and 18-34 vs. 60-65
2014JHLT. 2014 Oct; 33(10): 1009-1024

Adult Lung TransplantsPercentage Experiencing Treated Rejection between Discharge
and 1-Year Follow-Up (Follow-ups: July 2004 – June 2013)
Overall 18-34 35-49 50-59 60-65 >65 Female Male
Primary (N=11,443) First Retransplant (N=463)
% e
xper
ienc
ing
trea
ted
reje
ctio
n w
ithi
n 1
year
Analysis is limited to patients who were alive at the time of the follow-up Treated rejection = Recipient was reported to (1) have
at least one acute rejection episode that was treated with an anti-rejection agent; or (2) have been hospitalized for rejection.
No pair-wise comparisons were significant at < 0.05
2014JHLT. 2014 Oct; 33(10): 1009-1024

Adult Lung TransplantsKaplan-Meier Survival by Donor/Recipient CMV Status
(Transplants: October 1999 – June 2012)
0 1 2 3 4 5 6 7 8 9 10 11 120
20
40
60
80
100
D(-)/R(-) (N = 2,817)
D(-)/R(+) (N = 3,517)
D(+)/R(-) (N = 3,837)
D(+)/R(+) (N = 5,949)
Years
Su
rviv
al (
%)
All pair-wise comparisons were significant at p < 0.05 except D(+)/R(-) vs. D(+)/R(+)
2014JHLT. 2014 Oct; 33(10): 1009-1024

Adult Lung TransplantsKaplan-Meier Survival by Donor/Recipient CMV Status and
Era (Transplants: October 1999 – June 2012)Era 1 = 10/1999-2004; Era 2 = 2005-6/2012
0 1 2 3 4 5 6 720
40
60
80
100D(-)/R(-) Era 1 (N=893) D(-)/R(-) Era 2 (N=1,924)
D(-)/R(+) Era 1 (N=1,183) D(-)/R(+) Era 2 (N=2,334)
D(+)/R(-) Era 1 (N=1,016) D(+)/R(-) Era 2 (N=2,821)
D(+)/R(+) Era 1 (N=1,752) D(+)/R(+) Era 2 (N=4,197)
Years
Su
rviv
al (
%)
No pair-wise comparisons between eras within each CMV group and between CMV groups within each era were significant at p<0.05 except10/1999-2004: D(-)/R(-) vs. D(+)/R(-) and D(-)/R(-) vs. D(+)/R(+)2005-6/2012: D(-)/R(-) vs. D(+)/R(-), D(-)/R(-) vs. D(+)/R(+) and D(-)/R(+) vs. D(+)/R(-)
2014JHLT. 2014 Oct; 33(10): 1009-1024

Adult Lung TransplantsPercentage Experiencing Treated Rejection between Discharge and
1-Year Follow-Up by Donor/Recipient CMV Status(Follow-ups: July 2004 – June 2013)
0
10
20
30
40
50
D(-)/R(-) (N=1,846) D(-)/R(+) (N=2,245) D(+)/R(-) (N=2,661) D(+)/R(+) (N=4,086)
% e
xper
ienc
ing
trea
ted
reje
ctio
n w
ithi
n 1
year
No pair-wise comparisons were significant at p < 0.05
Analysis is limited to patients who were alive at the time of the follow-up Treated rejection = Recipient was reported to (1) have
at least one acute rejection episode that was treated with an anti-rejection agent; or (2) have been hospitalized for rejection.
2014JHLT. 2014 Oct; 33(10): 1009-1024

Adult Lung TransplantsPercentage Experiencing Any Rejection between Discharge and 1-
Year Follow-Up by Donor/Recipient CMV Status(Follow-ups: July 2004 – June 2013)
0
10
20
30
40
50
D(-)/R(-) (N=1,846) D(-)/R(+) (N=2,245) D(+)/R(-) (N=2,661) D(+)/R(+) (N=4,086)
% e
xper
ienc
ing
reje
ctio
n w
ithi
n 1
year
No pair-wise comparisons were significant at p < 0.05
Analysis is limited to patients who were alive at the time of the follow-up
2014Any rejection = Recipient was reported to (1) have at least one acute rejection episode; or (2) have been hospitalized for rejection.
JHLT. 2014 Oct; 33(10): 1009-1024

Functional and Employment Status and Rehospitalization Post
Transplant
2014JHLT. 2014 Oct; 33(10): 1009-1024

Adult Lung TransplantsFunctional Status of Surviving Recipients
(Follow-ups: March 2005 – June 2013)
0%
20%
40%
60%
80%
100%
1 Year(N = 10,758)
2 Years(N = 8,605)
3 Years(N =7,080)
10%
20%
30%
40%
50%
60%
70%
80%
90%
100%
2014JHLT. 2014 Oct; 33(10): 1009-1024

Adult Lung TransplantsEmployment Status of Surviving Recipients
(Follow-ups: April 1994 – June 2013)
0%
20%
40%
60%
80%
100%
1 Year(N = 13,702)
3 Years(N = 8,672)
5 Years(N = 5,576)
Working (FT/PT Status unknown)
Working Part Time
Working Full Time
Retired
Not Working
2014JHLT. 2014 Oct; 33(10): 1009-1024

Adult Lung TransplantsRehospitalization Post Transplant of Surviving Recipients
(Follow-ups: April 1994 – June 2013)
0%
20%
40%
60%
80%
100%
1 Year (N=19,500)
3 Years (N=12,232)
5 Years (N=7,939)
Hospitalized, Rejection + Infection Hospitalized, Infection OnlyHospitalized, Rejection Only Hospitalized, Not Rejection/Not InfectionNo Hospitalization
2014JHLT. 2014 Oct; 33(10): 1009-1024

Induction and Maintenance Immunosuppression
2014JHLT. 2014 Oct; 33(10): 1009-1024

Adult Lung TransplantsInduction Immunosuppression
Analysis limited to patients receiving prednisone(Transplants: January 2002 – June 2013)
Any Induction (N=8,608)
Polyclonal ALG/ATG (N=1,649)
IL-2R Antagonist (N=6,056)
Alemtuzumab (N=922)
0
10
20
30
40
50
60
% o
f p
ati
en
ts
Analysis is limited to patients who were alive at the time of the discharge2014
JHLT. 2014 Oct; 33(10): 1009-1024

Adult Lung TransplantsInduction Immunosuppression
Analysis limited to patients receiving prednisone(Transplants: 2002, 2006 and January 2013 – June 2013)
Any Induction Polyclonal ALG/ATG
IL-2R Antagonist Alemtuzumab0
10
20
30
40
50
60
70
2002 2006 1/2013-6/2013
% o
f p
ati
en
ts
Analysis is limited to patients who were alive at the time of the discharge2014
JHLT. 2014 Oct; 33(10): 1009-1024

Adult Lung TransplantsInduction Immunosuppression
Analysis limited to patients receiving prednisone(Transplants: January 2000 – December 2012)
Analysis is limited to patients who were alive at the time of the discharge
2000
2002
2004
2006
2008
2010
2012
2000
2002
2004
2006
2008
2010
2012
2000
2002
2004
2006
2008
2010
2012
2000
2002
2004
2006
2008
2010
2012
0
10
20
30
40
50
60
70
% o
f p
ati
en
ts
Any Induction Polyclonal ALG/ATG IL-2R Antagonist Alemtuzumab
2014JHLT. 2014 Oct; 33(10): 1009-1024

Adult Lung TransplantsSurvival by Induction Usage Conditional on Survival to 14
Days (Transplants: April 1994 – June 2012)
0 1 2 3 4 5 6 7 8 9 10 11 12 13 14 15 160
25
50
75
100
No induction (N = 10,725)
Induction (N = 9,602)
Years
Su
rviv
al (
%)
N at risk = 142
N at risk = 51
p < 0.0001
2014JHLT. 2014 Oct; 33(10): 1009-1024

Adult Lung TransplantsSurvival by Induction Usage Conditional on Survival to 14
Days (Transplants: January 2000 – June 2012)
0 1 2 3 4 5 6 7 8 9 10 110
25
50
75
100
No induction (N = 7,722)
Induction (N = 8,398)
Years
Su
rviv
al (
%)
N at risk = 120
N at risk = 141
p < 0.0001
2014JHLT. 2014 Oct; 33(10): 1009-1024

Adult Lung TransplantsMaintenance Immunosuppression at Time of Follow-up
Analysis limited to patients receiving prednisone(Follow-ups: January 2002 – June 2013)
Cyclosporine Tacrolimus Sirolimus/ Everolimus
MMF/MPA Azathioprine0
20
40
60
80
100
Year 1 (N = 12,803) Year 5 (N = 5,397)
% o
f p
ati
en
ts
NOTE: Different patients are analyzed in Year 1 and Year 5
Analysis is limited to patients who were alive at the time of the follow-up
2014JHLT. 2014 Oct; 33(10): 1009-1024

Analysis is limited to patients who were alive at the time of the discharge
CyA TAC Sirolimus/
Everolimus
MMF/MPA
AZA CyA TAC Sirolimus/
Everolimus
MMF/MPA
AZA0
20
40
60
80
100
% o
f p
ati
en
ts
1-Year Follow-Up 5-Year Follow-Up
Consecutive bars within each drug type represent follow-ups in years from 2002 through 06/2013
Adult Lung TransplantsMaintenance Immunosuppression at Time of Follow-up
Analysis limited to patients receiving prednisone(Follow-ups: January 2002 – June 2013)
NOTE: Different patients are analyzed in Year 1 and Year 5
2014JHLT. 2014 Oct; 33(10): 1009-1024

Adult Lung TransplantsMaintenance Immunosuppression at Time of 1 Year Follow-up
Analysis limited to patients receiving prednisone(Follow-ups: 2002, 2006 and July 2011 – June 2013)
Cyclosporine Tacrolimus Sirolimus/Everolimus
MMF/MPA
Azathioprine0
20
40
60
80
100 2002 (N = 726) 2006 (N = 1,101) 7/2012-6/2013 (N = 1,514)
% o
f p
ati
en
ts
Analysis is limited to patients who were alive at the time of the follow-up
NOTE: Different patients are analyzed in each time frame
2014JHLT. 2014 Oct; 33(10): 1009-1024

Adult Lung TransplantsMaintenance Immunosuppression at Time of Follow-up
Analysis limited to patients receiving prednisone(Follow-ups: January 2002 – June 2013)
Cal-cineurin Inhibitor
CellCycle Sirolimus/Everolimu
s
Cal-cineurin Inhibitor
CellCycle Sirolimus/Everolimu
s
0
20
40
60
80
100
% o
f p
ati
en
ts
NOTE: Different patients are analyzed in Year 1 and Year 5
Tac
CyA
Tac
CyAAZA AZA
MMF/MPA
MMF
1 Year Follow-up (N = 12,803) 5 Year Follow-up (N = 5,397)
Analysis is limited to patients who were alive at the time of the follow-up
2014JHLT. 2014 Oct; 33(10): 1009-1024

Adult Lung TransplantsMaintenance Immunosuppression Drug Combinations at
Time of Follow-up (Follow-ups: January 2002 – June 2013)Analysis limited to patients receiving prednisone
0%
20%
40%
60%
80%
100%
Year 1 (N = 12,803)
Year 5 (N = 5,397)
Other
Sirolimus/Everolimus + Calcineurin + Cellcycle
Sirolimus/Everolimus + Cellcycle
Sirolimus/Everolimus + Calcineurin
Tacrolimus Alone
Tacrolimus + MMF/MPA
Tacrolimus + AZA
Cyclosporine + MMF/MPA
Cyclosporine + AZA
% o
f P
ati
en
ts
Analysis is limited to patients who were alive at the time of the follow-up
NOTE: Different patients are analyzed in Year 1 and Year 5
2014JHLT. 2014 Oct; 33(10): 1009-1024

Adult Lung TransplantsKaplan-Meier Survival by Maintenance Immunosuppression
Combinations Conditional on Survival to 1 Year (Transplants: January 2000 – June 2012)
Analysis limited to patients receiving prednisone
0 1 2 3 4 5 6 7 8 9 10 110
25
50
75
100
Tacrolimus + MMF/MPA use at discharge and 1 year (N=4,702)
Tacrolimus + AZA use at discharge and 1 year (N=1,725)
Cyclosporine + MM/MPA use at discharge and 1 year (N=504)
Cyclosporine + AZA use at discharge and 1 year (N=551)
Years
Su
rviv
al (
%)
p < 0.0001
2014JHLT. 2014 Oct; 33(10): 1009-1024

Adult Lung TransplantsKaplan-Meier Survival by Maintenance Immunosuppression
Combinations Conditional on Survival to 1 Year (Transplants: January 2000 – June 2012)
Analysis limited to patients receiving prednisone Diagnosis: COPD/Emphysema
0 1 2 3 4 5 6 7 8 9 10 110
25
50
75
100
Tacrolimus + MMF/MPA use at discharge and 1 year (N=1,363)
Tacrolimus + AZA use at discharge and 1 year (N=566)
Cyclosporine + MM/MPA use at discharge and 1 year (N=213)
Cyclosporine + AZA use at discharge and 1 year (N=243)
Years
Su
rviv
al (
%)
p = 0.0088
2014JHLT. 2014 Oct; 33(10): 1009-1024

Adult Lung TransplantsKaplan-Meier Survival by Maintenance Immunosuppression
Combinations Conditional on Survival to 1 Year (Transplants: January 2000 – June 2012)
Analysis limited to patients receiving prednisone Diagnosis: Idiopathic Pulmonary Fibrosis
0 1 2 3 4 5 6 7 8 9 100
25
50
75
100
Tacrolimus + MMF/MPA use at discharge and 1 year (N=1,543)
Tacrolimus + AZA use at discharge and 1 year (N=518)
Cyclosporine + MM/MPA use at discharge and 1 year (N=127)
Cyclosporine + AZA use at discharge and 1 year (N=105)
Years
Su
rviv
al (
%)
p = 0.0019
2014JHLT. 2014 Oct; 33(10): 1009-1024

Adult Lung TransplantsKaplan-Meier Survival by Maintenance Immunosuppression
Combinations Conditional on Survival to 1 Year (Transplants: January 2000 – June 2012)
Analysis limited to patients receiving prednisone Diagnosis: Cystic Fibrosis
0 1 2 3 4 5 6 7 8 90
25
50
75
100
Tacrolimus + MMF/MPA use at discharge and 1 year (N=683)Tacrolimus + AZA use at discharge and 1 year (N=236)Cyclosporine + MM/MPA use at discharge and 1 year (N=42)Cyclosporine + AZA use at discharge and 1 year (N=78)
Years
Su
rviv
al (
%)
p = 0.5040
2014JHLT. 2014 Oct; 33(10): 1009-1024

Adult Lung TransplantsPercentage Experiencing Treated Rejection between Discharge and 1-
Year Follow-Up by Type of Induction (Follow-ups: July 2004 – June 2013)
0
10
20
30
40
50
60
No induction (N=5,486) Polyclonal (N=1,144)IL-2R Antagonist (N=4,431) Alemtuzumab (N=804)
% e
xper
ien
cin
g tr
eate
d r
ejec
tion
wit
hin
1 y
ear
Analysis is limited to patients who were alive at the time of the follow-up
Treated rejection = Recipient was reported to (1) have at least one acute rejection episode that was treated with an anti-rejection agent; or (2) have been hospitalized for rejection.
No pair-wise comparisons were significant at p < 0.05 except No induction vs. IL-2R and IL-2R vs. Alemtuzumab
2014JHLT. 2014 Oct; 33(10): 1009-1024

Adult Lung TransplantsPercentage Experiencing Any Rejection between Discharge and 1-Year
Follow-Up by Type of Induction (Follow-ups: July 2004 – June 2013)
0
10
20
30
40
50
60No induction (N=5,486) Polyclonal (N=1,144)IL-2R Antagonist (N=4,431) Alemtuzumab (N=804)
% e
xper
ien
cin
g re
ject
ion
wit
hin
1 y
ear
Analysis is limited to patients who were alive at the time of the follow-up No rejection = Recipient had (i) no acute rejection
episodes and (ii) was reported either as not hospitalized for rejection or did not receive anti-rejection agents.
No pair-wise comparisons were significant at p < 0.05 except No induction vs. IL-2R and IL-2R vs. Alemtuzumab
2014JHLT. 2014 Oct; 33(10): 1009-1024

Adult Lung TransplantsPercentage Experiencing Treated Rejection between Discharge and 1-
Year Follow-Up by Type of Induction (Follow-ups: July 2004 – June 2013)
18-34(N=1,566)
35-49(N=1,919)
50-59(N=3,598)
60-65(N=3,192)
>65(N=1,590)
Female(N=5,096)
Male(N=6,769)
0
10
20
30
40
50
60
No induction Polyclonal IL-2R Antagonist Alemtuzumab
% e
xper
ien
cin
g tr
eate
d r
ejec
tion
wit
hin
1 y
ear
No induction vs. IL-2R (male), Polyclonal vs. Alemtuzumab (50-69) and IL-2R vs. Alemtuzumab (50-59 years and female) were significant at p < 0.05. No other pair-wise comparisons were significant at p<0.05
Analysis is limited to patients who were alive at the time of the follow-up Treated rejection = Recipient was reported to (1) have at least one acute rejection episode that was treated with an anti-rejection agent; or (2) have been hospitalized for rejection.
2014JHLT. 2014 Oct; 33(10): 1009-1024

Adult Lung TransplantsPercentage Experiencing Any Rejection between Discharge and 1-Year
Follow-Up by Type of Induction (Follow-ups: July 2004 – June 2012)
18-34(N=1,566)
35-49(N=1,919)
50-59(N=3,598)
60-65(N=3,192)
>65(N=1,590)
Female(N=5,096)
Male(N=6,769)
0
10
20
30
40
50
60
No induction Polyclonal IL-2R Antagonist Alemtuzumab
% e
xper
ien
cin
g re
ject
ion
wit
hin
1 y
ear
Polyclonal vs. IL-2R (>65 years), Polyclonal vs. Alemtuzumab (50-59 years) and IL-2R vs. Alemtuzumab (50-59 years and female) were significant at p < 0.05. No other pair-wise comparisons were significant at p<0.05
Analysis is limited to patients who were alive at the time of the follow-up No rejection = Recipient had (i) no acute rejection episodes and (ii) was reported either as not hospitalized for rejection or did not receive anti-rejection agents.
2014JHLT. 2014 Oct; 33(10): 1009-1024

Adult Lung TransplantsPercentage Experiencing Treated Rejection between Discharge and 1-
Year Follow-Up by Maintenance Immunosuppression(Follow-ups: July 2004 – June 2013)
0
10
20
30
40
50
60
70CyA + MMF/MPA (N=551) CyA + AZA (N=804)TAC + MMF/MPA (N=6,514) TAC + AZA (N=2,685)
% e
xper
ien
cin
g tr
eate
d r
ejec
tion
wit
hin
1 y
ear
All pair-wise comparisons were significant at p < 0.05 except CyA + MMF/MPA vs. TAC + AZA
Analysis is limited to patients who were alive at the time of the follow-up
Treated rejection = Recipient was reported to (1) have at least one acute rejection episode that was treated with an anti-rejection agent; or (2) have been hospitalized for rejection.
2014JHLT. 2014 Oct; 33(10): 1009-1024

Adult Lung TransplantsPercentage Experiencing Rejection between Discharge and 1-Year
Follow-Up by Maintenance Immunosuppression(Follow-ups: July 2004 – June 2013)
0
10
20
30
40
50
60
70 CyA + MMF/MPA (N=551) CyA + AZA (N=804)TAC + MMF/MPA (N=6,514) TAC + AZA (N=2,685)
% e
xper
ien
cin
g re
ject
ion
wit
hin
1 y
ear
All pair-wise comparisons were significant at p < 0.05 except CyA + MMF/MPA vs. TAC + AZA
Analysis is limited to patients who were alive at the time of the follow-up
No rejection = Recipient had (i) no acute rejection episodes and (ii) was reported either as not hospitalized for rejection or did not receive anti-rejection agents.
2014JHLT. 2014 Oct; 33(10): 1009-1024

Adult Lung TransplantsPercentage Experiencing Treated Rejection between Discharge and
1-Year Follow-Up by Maintenance Immunosuppression(Follow-ups: July 2004 – June 2012)
18-34(N=1,384)
35-49(N=1,699)
50-59(N=3,194)
60-65(N=2,869)
>65(N=1,408)
Female(N=4,519)
Male(N=6,035)
0
10
20
30
40
50
60
70 CyA + MMF/MPA CyA + AZA TAC + MMF/MPA TAC + AZA
% e
xper
ien
cin
g tr
eate
d r
ejec
tion
wit
hin
1
year
CyA + MMF/MPA vs. CyA + AZA (except >65 years), CyA + MMF/MPA vs. TAC + MMF/MPA (female), CyA + AZA vs. TAC + MMF/MPA, CyA + AZA vs. TAC + AZA (except >65 years), and TAC + MMF/MPA vs. TAC + AZA (>65 years and female) were significant at p < 0.05. No other pair-wise comparisons were significant.
Analysis is limited to patients who were alive at the time of the follow-up Treated rejection = Recipient was reported to (1) have at least one acute rejection episode that was treated with an anti-rejection agent; or (2) have been hospitalized for rejection.
2014JHLT. 2014 Oct; 33(10): 1009-1024

Adult Lung TransplantsPercentage Experiencing Rejection between Discharge and 1-Year
Follow-Up by Maintenance Immunosuppression(Follow-ups: July 2004 – June 2013)
18-34(N=1,384)
35-49(N=1,699)
50-59(N=3,194)
60-65(N=2,869)
>65(N=1,408)
Female(N=4,519)
Male(N=6,035)
0
10
20
30
40
50
60
70 CyA + MMF/MPA CyA + AZA TAC + MMF/MPA TAC + AZA
% e
xper
ien
cin
g re
ject
ion
wit
hin
1 y
ear
CyA + MMF/MPA vs. CyA + AZA (except 35-49 and >65 years), CyA + MMF/MPA vs. TAC + MMF/MPA (female), CyA + AZA vs. TAC + MMF/MPA, CyA + AZA vs. TAC + AZA (except >65 years), and TAC + MMF/MPA vs. TAC + AZA (except 18-34, 34-49 and >65 years) were significant at p < 0.05. No other pair-wise comparisons were significant.
Analysis is limited to patients who were alive at the time of the follow-up No rejection = Recipient had (i) no acute rejection episodes and (ii) was reported either as not hospitalized for rejection or did not receive anti-rejection agents.
2014JHLT. 2014 Oct; 33(10): 1009-1024

Post Transplant Morbidities
2014JHLT. 2014 Oct; 33(10): 1009-1024

Adult Lung TransplantsCumulative Morbidity Rates in Survivors within 1 Year Post
Transplant (Follow-ups: April 1994 – June 2013)
Outcome
Follow-ups: April 1994 – June 2003
Follow-ups: July 2003– June 2013
Within 1 Year
Total number
with known response
Within 1 Year
Total number
with known response
Hypertension 50.8% (N = 5,982) 52.3% (N = 10,503)
Renal Dysfunction 26.1% (N = 5,991) 21.6% (N = 12,890)
Abnormal Creatinine ≤ 2.5 mg/dl 15.8% 16.1%
Creatinine > 2.5 mg/dl 8.3% 3.8%
Chronic Dialysis 2.0% 1.7%
Renal Transplant 0.0% 0.1%
Hyperlipidemia 16.3% (N = 6,264) 31.3% (N = 10,937)
Diabetes 20.1% (N = 5,959) 25.6% (N = 12,856)
Bronchiolitis Obliterans Syndrome 9.4% (N = 5,592) 9.4% (N = 12,169)
2014JHLT. 2014 Oct; 33(10): 1009-1024

Adult Lung TransplantsCumulative Morbidity Rates in Survivors within 1 Year Post
Transplant by Transplant Type (Follow-ups: April 1994 – June 2013)
Outcome
Primary First Retransplant
Within 1 Year
Total number
with known response
Within 1 Year
Total number
with known response
Hypertension 51.5% (N = 15,962) 58.1% (N = 516)
Renal Dysfunction 22.9% (N = 18,269) 27.2% (N = 604)
Abnormal Creatinine ≤ 2.5 mg/dl 16.0% 16.4%
Creatinine > 2.5 mg/dl 5.1% 7.0%
Chronic Dialysis 1.7% 3.1%
Renal Transplant 0.1% 0.7%
Hyperlipidemia 25.8% (N = 16,653) 26.6% (N = 541)
Diabetes 23.9% (N = 18,206) 22.8% (N = 601)
Bronchiolitis Obliterans Syndrome 9.2% (N = 17,185) 16.7% (N = 568)
2014JHLT. 2014 Oct; 33(10): 1009-1024

Adult Lung TransplantsCumulative Morbidity Rates in Survivors within 1 and 5 Years
Post Transplant (Follow-ups: April 1994 – June 2013)
Outcome Within 1 Year
Total number
with known response
Within 5 Years
Total number
with known response
Hypertension 51.8% (N = 16,485) 81.7% (N = 4,866)
Renal Dysfunction 23.1% (N = 18,881) 54.8% (N = 6,278)
Abnormal Creatinine ≤ 2.5 mg/dl 16.0% 36.3%
Creatinine > 2.5 mg/dl 5.2% 14.6%
Chronic Dialysis 1.8% 3.2%
Renal Transplant 0.1% 0.7%
Hyperlipidemia 25.9% (N = 17,201) 58.7% (N = 5,222)
Diabetes 23.8% (N = 18,815) 40.2% (N = 6,175)
Bronchiolitis Obliterans Syndrome 9.4% (N = 17,761) 40.6% (N = 5,328)
2014JHLT. 2014 Oct; 33(10): 1009-1024

Adult Lung RetransplantsCumulative Morbidity Rates in Survivors within 1 and 5 Years
Post First Retransplant (Follow-ups: April 1994 – June 2013)
Outcome Within 1 Year
Total number
with known response
Within 5 Years
Total number
with known response
Hypertension 58.1% (N = 516) 83.9% (N = 87)
Renal Dysfunction 27.2% (N = 604) 61.6% (N = 146)
Abnormal Creatinine ≤ 2.5 mg/dl 16.4% 34.9%
Creatinine > 2.5 mg/dl 7.0% 16.4%
Chronic Dialysis 3.1% 7.5%
Renal Transplant 0.7% 2.7%
Hyperlipidemia 26.6% (N = 541) 59.0% (N = 100)
Diabetes 22.8% (N = 601) 39.9% (N = 138)
Bronchiolitis Obliterans Syndrome 16.7% (N = 568) 53.4% (N = 118)
2014JHLT. 2014 Oct; 33(10): 1009-1024

Adult Lung TransplantsCumulative Morbidity Rates in Survivors within 10 Years
Post-Transplant (Follow-ups: April 1994 – June 2013)
Outcome Within 10 Years
Total number with known response
Renal Dysfunction 73.5% (N = 1,270)
Abnormal Creatinine ≤ 2.5 mg/dl 41.1%
Creatinine > 2.5 mg/dl 19.4%
Chronic Dialysis 7.8%
Renal Transplant 5.3%
Bronchiolitis Obliterans Syndrome 63.4% (N = 946)
2014JHLT. 2014 Oct; 33(10): 1009-1024

Adult Lung TransplantsFreedom from Bronchiolitis Obliterans Syndrome
Conditional on Survival to 14 days (Follow-ups: April 1994 – June 2013)
0 1 2 3 4 5 6 7 8 9 10 11 12 13 14 150
20
40
60
80
100
Freedom from Bronchiolitis Obliterans Syndrome (N = 17,811)
Years
% F
ree
fro
m B
ron
ch
iolit
is O
blit
-e
ran
s S
yn
dro
me
N at risk = 12
2014JHLT. 2014 Oct; 33(10): 1009-1024

Adult Lung TransplantsFreedom from Bronchiolitis Obliterans Syndromeby Diagnosis Conditional on Survival to 14 days
(Follow-ups: April 1994 – June 2013)
0 1 2 3 4 5 6 7 8 9 100
20
40
60
80
100
Alpha-1 (N=955) CF (N=2,468)
COPD (N=6,163) IPF (N=4,743)
IPAH (N=478) Sarcoidosis (N=521)
Years
% F
ree
fro
m B
ron
ch
iolit
is O
blit
-e
ran
s S
yn
dro
me
No pair-wise comparisons were significant at p < 0.05 except CF vs. COPD
2014JHLT. 2014 Oct; 33(10): 1009-1024

Adult Lung TransplantsFreedom from Bronchiolitis Obliterans Syndrome
by Induction Use Conditional on Survival to 14 days(Follow-ups: April 1994 – June 2013)
0 1 2 3 4 5 6 7 8 9 10 11 12 130
20
40
60
80
100No induction (N = 8,749)Induction (N = 7,990)
Years
% F
ree
fro
m B
ron
ch
iolit
is O
blit
-e
ran
s S
yn
dro
me
N at risk = 40
N at risk = 20
p = 0.0002
2014JHLT. 2014 Oct; 33(10): 1009-1024

Adult Lung TransplantsFreedom from Bronchiolitis Obliterans Syndromeby Induction Use Conditional on Survival to 1 Year
(Follow-ups: April 1994 – June 2013)
0 1 2 3 4 5 6 7 8 9 10 11 12 130
20
40
60
80
100No induction (N = 7,891)Induction (N = 7,262)
Years
% F
ree
fro
m B
ron
ch
iolit
is O
blit
-e
ran
s S
yn
dro
me
N at risk = 40
N at risk = 20
p = 0.0003
2014JHLT. 2014 Oct; 33(10): 1009-1024

Adult Lung TransplantsFreedom from Bronchiolitis Obliterans Syndrome
by Donor/Recipient CMV Status Conditional on Survival to 14 Days (Follow-ups: April 1994 – June 2013)
0 1 2 3 4 5 6 7 8 9 10 11 12 130
20
40
60
80
100
D(-)/R(-) (N = 2,806)
D(-)/R(+) (N = 3,667)
D(+)/R(-) (N = 3,670)
D(+)/R(+) (N = 6,045)
Years
% F
ree
fro
m B
ron
ch
iolit
is O
blit
-e
ran
s S
yn
dro
me
N at risk = 15
N at risk = 25
N at risk = 11
N at risk = 14
No pair-wise comparisons were significant at p < 0.05 except D(+)/R(-) vs. D(+)/R(+): p = 0.0113
2014JHLT. 2014 Oct; 33(10): 1009-1024

Adult Lung TransplantsFreedom from Bronchiolitis Obliterans Syndrome
by Donor/Recipient CMV StatusConditional on Survival to 1 Year (Follow-ups: April 1994 – June 2013)
0 1 2 3 4 5 6 7 8 9 10 11 120
20
40
60
80
100
D(-)/R(-) (N = 2,346) D(-)/R(+) (N = 3,071)
D(+)/R(-) (N = 2,869) D(+)/R(+) (N = 4,915)
Years
% F
ree
fro
m B
ron
ch
iolit
is O
blit
-e
ran
s S
yn
dro
me
N at risk = 21
N at risk = 31
N at risk = 18
N at risk = 21
No p-values were significant at p < 0.05
2014JHLT. 2014 Oct; 33(10): 1009-1024

Adult Lung Transplants Freedom from Severe Renal Dysfunction*
(Follow-ups: April 1994 – June 2013)
0 1 2 3 4 5 6 7 8 9 10 11 12 13 14 150
20
40
60
80
100
Freedom from Severe Rena...
Years
% F
ree
fro
m S
ev
ere
Re
na
l Dy
s-
fun
cti
on
N at risk = 33
* Severe renal dysfunction = Creatinine > 2.5 mg/dl (221 μmol/L), dialysis or renal transplant
2014JHLT. 2014 Oct; 33(10): 1009-1024

Adult Lung Transplants Freedom from Severe Renal Dysfunction* Conditional on
Survival to 1 Year (Follow-ups: April 1994 – June 2013)
0 1 2 3 4 5 6 7 8 9 10 11 12 13 14 150
20
40
60
80
100
Freedom from Severe Ren...
Years
% F
ree
fro
m S
ev
ere
Re
na
l Dy
s-
fun
cti
on
N at risk = 33
* Severe renal dysfunction = Creatinine > 2.5 mg/dl (221 μmol/L), dialysis or renal transplant
2014JHLT. 2014 Oct; 33(10): 1009-1024

Adult Lung TransplantsFreedom from Severe Renal Dysfunction* by Maintenance
Immunosuppression Combinations at DischargeConditional on Survival to 14 Days (Transplants: January 2000 – June 2012)
Analysis limited to patients receiving prednisone
0 1 2 3 4 5 6 7 8 9 10 110
20
40
60
80
100
TAC+MMF/MPA (N = 6,903) TAC+AZA (N = 3,219)
CyA+MMF/MPA (N = 1,032) CyA+AZA (N = 1,585)
Years
% F
ree
fro
m S
ev
ere
Re
na
l Dy
s-
fun
cti
on
* Severe renal dysfunction = Creatinine > 2.5 mg/dl (221 μmol/L), dialysis or renal transplant
All pair-wise comparisons with CyA + MMF/MPA were significant at p < 0.001. No other pair-wise comparisons were significant at p < 0.05.
2014JHLT. 2014 Oct; 33(10): 1009-1024

Adult Lung TransplantsCumulative Post Transplant Malignancy Rates in
Survivors(Follow-ups: April 1994 – June 2013)
Malignancy/Type 1-Year Survivors
5-Year Survivors
10-Year Survivors
No Malignancy 18,644 (96.4%) 5,600 (84.3%) 1,049 (72.2%)
Malignancy (all types combined) 701 (3.6%) 1,042 (15.7%) 403 (27.8%)
Malignancy Type*
Skin 237 724 284
Lymphoma 261 101 43
Other 176 263 113
Type Not Reported 27 9 0
* Recipients may have experienced more than one type of malignancy so sum of individual malignancy types may be greater than total number with malignancy.
Other malignancies reported include: adenocarcinoma (2; 2; 1), bladder (2; 1; 0), lung (2; 4; 0), breast (1; 5; 2); prostate (0; 5; 1), cervical (1; 1; 0); liver (1; 1; 1); colon (1; 1; 0). Numbers in parentheses represent the number of reported cases within each time period.
2014JHLT. 2014 Oct; 33(10): 1009-1024

Adult Lung Transplants Freedom from Malignancy (Follow-ups: April 1994 – June 2013)
0 1 2 3 4 5 6 7 8 9 10 11 12 13 14 15 16 170
20
40
60
80
100
All malignancy Lymphoma Skin Other
Years
% F
ree
fro
m M
alig
na
nc
y
2014JHLT. 2014 Oct; 33(10): 1009-1024

Adult Lung TransplantsFreedom from Malignancy Conditional on Survival to 1 Year
(Follow-ups: April 1994 – June 2013)
0 1 2 3 4 5 6 7 8 9 10 11 12 13 14 15 16 170
20
40
60
80
100
All malignancy Lymphoma Skin Other
Years
% F
ree
fro
m M
alig
na
nc
y
2014JHLT. 2014 Oct; 33(10): 1009-1024

Adult Lung TransplantsCause of Death (Deaths: January 1992 – June 2013)
Cause of Death 0-30 Days (N = 2,905)
31 Days - 1 Year
(N = 5,098)
>1 Year - 3 Years
(N = 4,797)
>3 Years - 5 Years
(N = 2,746)
>5 Years – 10 Years
(N = 3,263)
>10 Years (N = 1,092)
Bronchiolitis 8 (0.3%) 233 (4.6%) 1,230 (25.6%) 804 (29.3%) 806 (24.7%) 219 (20.1%)
Acute Rejection 96 (3.3%) 93 (1.8%) 75 (1.6%) 17 (0.6%) 18 (0.6%) 2 (0.2%)
Lymphoma 1 (0.0%) 114 (2.2%) 84 (1.8%) 42 (1.5%) 60 (1.8%) 35 (3.2%)
Malignancy, Non-Lymphoma 5 (0.2%) 144 (2.8%) 380 (7.9%) 300 (10.9%) 448 (13.7%) 135 (12.4%)
CMV 0 116 (2.3%) 48 (1.0%) 7 (0.3%) 4 (0.1%) 1 (0.1%)
Infection, Non-CMV 550 (18.9%) 1,803 (35.4%) 1,041 (21.7%) 506 (18.4%) 586 (18.0%) 182 (16.7%)
Graft Failure 702 (24.2%) 844 (16.6%) 906 (18.9%) 493 (18.0%) 558 (17.1%) 181 (16.6%)
Cardiovascular 329 (11.3%) 257 (5.0%) 210 (4.4%) 138 (5.0%) 182 (5.6%) 83 (7.6%)
Technical 330 (11.4%) 180 (3.5%) 45 (0.9%) 14 (0.5%) 28 (0.9%) 8 (0.7%)
Other 884 (30.4%) 1,314 (25.8%) 778 (16.2%) 425 (15.5%) 573 (17.6%) 246 (22.5%)
Percentages represent % of deaths in the respective time period
2014JHLT. 2014 Oct; 33(10): 1009-1024

Adult Lung RetransplantsCause of Death (Deaths: January 1992 – June 2013)
Cause of Death 0-30 Days (N = 226)
31 Days - 1 Year
(N = 306)
>1 Year - 3 Years
(N = 215)
>3 Years - 5 Years (N = 80)
>5 Years – 10 Years (N = 88)
>10 Years (N = 18)
Bronchiolitis 4 (1.8%) 26 (8.5%) 78 (36.3%) 30 (37.5%) 22 (25.0%) 6 (33.3%)
Acute Rejection 6 (2.7%) 8 (2.6%) 0 0 0 0
Lymphoma 0 4 (1.3%) 4 (1.9%) 2 (2.5%) 3 (3.4%) 0
Malignancy, Non-Lymphoma 0 3 (1.0%) 11 (5.1%) 5 (6.3%) 6 (6.8%) 2 (11.1%)
CMV 0 5 (1.6%) 3 (1.4%) 0 0 0
Infection, Non-CMV 39 (17.3%) 102 (33.3%) 39 (18.1%) 16 (20.0%) 13 (14.8%) 0
Graft Failure 56 (24.8%) 49 (16.0%) 45 (20.9%) 15 (18.8%) 20 (22.7%) 2 (11.1%)
Cardiovascular 24 (10.6%) 16 (5.2%) 10 (4.7%) 2 (2.5%) 3 (3.4%) 1 (5.6%)
Technical 31 (13.7%) 7 (2.3%) 1 (0.5%) 0 1 (1.1%) 1 (5.6%)
Other 66 (29.2%) 86 (28.1%) 24 (11.2%) 10 (12.5%) 20 (22.7%) 6 (33.3%)
Percentages represent % of deaths in the respective time period
2014JHLT. 2014 Oct; 33(10): 1009-1024

Adult Lung TransplantsCause of Death Stratified by Transplant Type
(Deaths: January 1992 – June 2013)
Transplant Type
Cause of Death 0-30 Days 31 Days - 1 Year
>1 Year - 3 Years
>3 Years - 5 Years >5 Years
Primary
Bronchiolitis 4 (0.1%) 207 (4.3%) 1,152 (25.1%) 774 (29.0%) 997 (23.5%)
Malignancy 6 (0.2%) 251 (5.2%) 449 (9.8%) 335 (12.6%) 667 (15.7%)
Infection 511 (19.1%) 1,812 (37.8%) 1,047 (22.9%) 497 (18.6%) 760 (17.9%)
Graft Failure 646 (24.1%) 795 (16.6%) 861 (18.8%) 478 (17.9%) 717 (16.9%)
Cardiovascular 305 (11.4%) 241 (5.0%) 200 (4.4%) 136 (5.1%) 261 (6.1%)
Technical 299 (11.2%) 173 (3.6%) 44 (1.0%) 14 (0.5%) 34 (0.8%)
All known causes 2,679 4,792 4,582 2,666 4,249
Retransplant
Bronchiolitis 4 (1.8%) 26 (8.5%) 78 (36.3%) 30 (37.5%) 28 (26.4%)
Malignancy 0 7 (2.3%) 15 (7.0%) 7 (8.8%) 11 (10.4%)
Infection 39 (17.3%) 107 (35.0%) 42 (19.5%) 16 (20.0%) 13 (12.3%)
Graft Failure 56 (24.8%) 49 (16.0%) 45 (20.9%) 15 (18.8%) 22 (20.8%)
Cardiovascular 24 (10.6%) 16 (5.2%) 10 (4.7%) 2 (2.5%) 4 (3.8%)
Technical 31 (13.7%) 7 (2.3%) 1 (0.5%) 0 2 (1.9%)
All known causes 226 306 215 80 106
Acute rejection and other causes of death are not shown on the slide
2014JHLT. 2014 Oct; 33(10): 1009-1024

Adult Lung Transplants Relative Incidence of Leading Causes of Death
(Deaths: January 1992 – June 2013)
0-30 Days (N=2,905)
31 Days – 1 Year (N=5,098)
>1 Year – 3 Years
(N=4,797)
>3 Years – 5 Years
(N=2,746)
>5 Years – 10 Years
(N=3,263)
>10 Years (N=1,092)
0
10
20
30
40
50Bronchiolitis Malignancy (non-Lymph/PTLD)Infection (non-CMV) Graft FailureCardiovascular
% o
f D
ea
ths
2014JHLT. 2014 Oct; 33(10): 1009-1024

Adult Lung Retransplants Relative Incidence of Leading Causes of Death
(Deaths: January 1992 – June 2013)
0-30 Days (N=226) 31 Days – 1 Year (N=306)
>1 Year – 3 Years (N=215)
>3 Years – 5 Years (N=80)
>5 Years (N=106)0
10
20
30
40
50Bronchiolitis Malignancy (non-Lymph/PTLD)Infection (non-CMV) Graft FailureCardiovascular
% o
f D
ea
ths
2014JHLT. 2014 Oct; 33(10): 1009-1024

Multivariable Analyses
2014JHLT. 2014 Oct; 33(10): 1009-1024

Adult Lung Transplants (January 2000 – June 2012)
Risk Factors For 1 Year Mortality
N = 16,785* Retransplant includes those with a retransplant diagnosis or a previous transplant was reported. ** Other = All diagnoses other than COPD, IPAH, IPF, cystic fibrosis, sarcoidosis, pulmonary fibrosis, bronchiectasis, alpha-1 antitrypsin deficiency, retransplant , LAM and Connective Tissue Disease.
2014JHLT. 2014 Oct; 33(10): 1009-1024

Adult Lung Transplants (January 2000 – June 2012)
Risk Factors For 1 Year Mortality
Continuous Factors (see figures)
Recipient age Recipient oxygen required at rest
Transplant center volume Cardiac output
Height difference Recipient FVC % predicted
Bilirubin Creatinine
2014JHLT. 2014 Oct; 33(10): 1009-1024

Adult Lung Transplants (January 2000 – June 2012)
Risk Factors For 1 Year Mortality with 95% Confidence Limits Recipient Age
20 25 30 35 40 45 50 55 60 650.0
0.5
1.0
1.5
2.0
Recipient Age
Ha
zard
Ra
tio
of
1 Y
ea
r M
ort
alit
y
p < 0.0001
2014JHLT. 2014 Oct; 33(10): 1009-1024

Adult Lung Transplants (January 2000 – June 2012)
Risk Factors For 1 Year Mortality with 95% Confidence Limits Center Volume
5 10 15 20 25 30 35 40 45 500.0
0.5
1.0
1.5
2.0
Center Volume (cases per year)
Ha
zard
Ra
tio
of
1 Y
ea
r M
ort
alit
y
p < 0.0001
2014JHLT. 2014 Oct; 33(10): 1009-1024

Adult Lung Transplants (January 2000 – June 2012)
Risk Factors For 1 Year Mortality with 95% Confidence Limits Height Difference
-15 -10 -5 0 5 10 15 200.0
0.5
1.0
1.5
2.0
Donor Height - Recipient Height (cm)
Ha
zard
Ra
tio
of
1 Y
ea
r M
ort
alit
y
p = 0.0037
2014JHLT. 2014 Oct; 33(10): 1009-1024

Adult Lung Transplants (January 2000 – June 2012)
Risk Factors For 1 Year Mortality with 95% Confidence Limits Recipient Pre-Transplant Bilirubin
0.0 0.5 1.0 1.5 2.00.0
0.5
1.0
1.5
2.0
Recipient Bilirubin (mg/dl)
Ha
zard
Ra
tio
of
1 Y
ea
r M
ort
alit
y
p = 0.0002
2014JHLT. 2014 Oct; 33(10): 1009-1024

Adult Lung Transplants (January 2000 – June 2012)
Risk Factors For 1 Year Mortality with 95% Confidence Limits Recipient Oxygen Required at Rest
0 1 2 3 4 5 60.0
0.5
1.0
1.5
2.0
Oxygen Required at Rest (L/min)
Ha
zard
Ra
tio
of
1 Y
ea
r M
ort
alit
y
p < 0.0001
2014JHLT. 2014 Oct; 33(10): 1009-1024

Adult Lung Transplants (January 2000 – June 2012)
Risk Factors For 1 Year Mortality with 95% Confidence Limits Recipient Pre-Transplant Cardiac Output
3 4 5 6 7 80.0
0.5
1.0
1.5
2.0
Cardiac output
Ha
zard
Ra
tio
of
1 Y
ea
r M
ort
alit
y
p = 0.0011
2014JHLT. 2014 Oct; 33(10): 1009-1024

Adult Lung Transplants (January 2000 – June 2012)
Risk Factors For 1 Year Mortality with 95% Confidence Limits Recipient FVC (% predicted)
25 30 35 40 45 50 55 60 65 70 75 800.0
0.5
1.0
1.5
2.0
Recipient FVC (% predicted)
Ha
zard
Ra
tio
of
1 Y
ea
r M
ort
alit
y
p < 0.0001
2014JHLT. 2014 Oct; 33(10): 1009-1024

Adult Lung Transplants (January 2000 – June 2012)
Risk Factors For 1 Year Mortality with 95% Confidence Limits Recipient Creatinine at Transplant
0.50 0.75 1.00 1.25 1.500.0
0.5
1.0
1.5
2.0
Creatinine
Ha
zard
Ra
tio
of
1 Y
ea
r M
ort
alit
y
p = 0.0022
2014JHLT. 2014 Oct; 33(10): 1009-1024

Adult Lung Transplants (January 2000 – June 2012)
Diagnosis = COPD/EmphysemaRisk Factors For 1 Year Mortality
N = 5,3142014JHLT. 2014 Oct; 33(10): 1009-1024

Adult Lung Transplants (January 2000 – June 2012)
Diagnosis = COPD/Emphysema Risk Factors For 1 Year Mortality
Continuous Factors (see figures)
Recipient age Cardiac output
Transplant center volume Recipient FVC % predicted
Donor height Recipient FEV1 % predicted
Recipient oxygen required at rest
2014JHLT. 2014 Oct; 33(10): 1009-1024

Adult Lung Transplants (January 2000 – June 2012)
Diagnosis = COPD/EmphysemaRisk Factors For 1 Year Mortality with 95% Confidence Limits
Recipient Age
25 30 35 40 45 50 55 60 650.0
0.5
1.0
1.5
2.0
Recipient Age
Ha
zard
Ra
tio
of
1 Y
ea
r M
ort
alit
y
p < 0.0001
2014JHLT. 2014 Oct; 33(10): 1009-1024

Adult Lung Transplants (January 2000 – June 2012)
Diagnosis = COPD/EmphysemaRisk Factors For 1 Year Mortality with 95% Confidence Limits
Center Volume
5 10 15 20 25 30 35 40 45 500.0
0.5
1.0
1.5
2.0
Center Volume (cases per year)
Ha
zard
Ra
tio
of
1 Y
ea
r M
ort
alit
y
p = 0.0016
2014JHLT. 2014 Oct; 33(10): 1009-1024

Adult Lung Transplants (January 2000 – June 2012)
Diagnosis = COPD/EmphysemaRisk Factors For 1 Year Mortality with 95% Confidence Limits
Donor Height
150 155 160 165 170 175 180 1850.0
0.5
1.0
1.5
2.0
Donor Height (cm)
Ha
zard
Ra
tio
of
1 Y
ea
r M
ort
alit
y
p = 0.0321
2014JHLT. 2014 Oct; 33(10): 1009-1024

Adult Lung Transplants (January 2000 – June 2012)
Diagnosis = COPD/EmphysemaRisk Factors For 1 Year Mortality with 95% Confidence Limits
Recipient Oxygen Required at Rest
0 1 2 3 40.0
0.5
1.0
1.5
2.0
Oxygen Required at Rest (L/min)
Ha
zard
Ra
tio
of
1 Y
ea
r M
ort
alit
y
p = 0.0192
2014JHLT. 2014 Oct; 33(10): 1009-1024

Adult Lung Transplants (January 2000 – June 2012)
Diagnosis = COPD/EmphysemaRisk Factors For 1 Year Mortality with 95% Confidence Limits
Recipient Pre-Transplant Cardiac Output
3 4 5 6 7 80.0
0.5
1.0
1.5
2.0
2.5
Cardiac output
Ha
zard
Ra
tio
of
1 Y
ea
r M
ort
alit
y
p = 0.0063
2014JHLT. 2014 Oct; 33(10): 1009-1024

Adult Lung Transplants (January 2000 – June 2012)
Diagnosis = COPD/EmphysemaRisk Factors For 1 Year Mortality with 95% Confidence Limits
Recipient FVC (% predicted)
25 30 35 40 45 50 55 60 65 70 75 800.0
0.5
1.0
1.5
2.0
Recipient FVC (% predicted)
Ha
zard
Ra
tio
of
1 Y
ea
r M
ort
alit
y
p = 0.0310
2014JHLT. 2014 Oct; 33(10): 1009-1024

Adult Lung Transplants (January 2000 – June 2012)
Diagnosis = COPD/EmphysemaRisk Factors For 1 Year Mortality with 95% Confidence Limits
Recipient FEV1 (% predicted)
25 30 35 40 45 500.0
0.5
1.0
1.5
2.0
Recipient FEV1 (% predicted)
Ha
zard
Ra
tio
of
1 Y
ea
r M
ort
alit
y
p = 0.0262
2014JHLT. 2014 Oct; 33(10): 1009-1024

Adult Lung Transplants (January 2000 – June 2012)
Diagnosis = IPFRisk Factors For 1 Year Mortality
N = 5,0042014JHLT. 2014 Oct; 33(10): 1009-1024

Adult Lung Transplants (January 2000 – June 2012)
Diagnosis = IPF Risk Factors For 1 Year Mortality
Continuous Factors (see figures)
Recipient age Recipient oxygen required at rest
Transplant center volume Bilirubin
Donor height Creatinine
2014JHLT. 2014 Oct; 33(10): 1009-1024

Adult Lung Transplants (January 2000 – June 2012)
Diagnosis = IPF Risk Factors For 1 Year Mortality with 95% Confidence Limits
Recipient Age
35 40 45 50 55 60 650.0
0.5
1.0
1.5
2.0
Recipient Age
Ha
zard
Ra
tio
of
1 Y
ea
r M
ort
alit
y
p < 0.0001
2014JHLT. 2014 Oct; 33(10): 1009-1024

Adult Lung Transplants (January 2000 – June 2012)
Diagnosis = IPF Risk Factors For 1 Year Mortality with 95% Confidence Limits
Center Volume
5 10 15 20 25 30 35 40 45 500.0
0.5
1.0
1.5
2.0
2.5
Center Volume (cases per year)
Ha
zard
Ra
tio
of
1 Y
ea
r M
ort
alit
y
p < 0.0001
2014JHLT. 2014 Oct; 33(10): 1009-1024

Adult Lung Transplants (January 2000 – June 2012)
Diagnosis = IPF Risk Factors For 1 Year Mortality with 95% Confidence Limits
Donor Height
150 160 170 180 1900.0
0.5
1.0
1.5
2.0
Donor Height (cm)
Ha
zard
Ra
tio
of
1 Y
ea
r M
ort
alit
y
p < 0.0001
2014JHLT. 2014 Oct; 33(10): 1009-1024

Adult Lung Transplants (January 2000 – June 2012)
Diagnosis = IPF Risk Factors For 1 Year Mortality with 95% Confidence Limits
Recipient Oxygen Required at Rest
0 1 2 3 4 5 60.0
0.5
1.0
1.5
2.0
Oxygen Required at Rest (L/min)
Ha
zard
Ra
tio
of
1 Y
ea
r M
ort
alit
y
p = 0.0020
2014JHLT. 2014 Oct; 33(10): 1009-1024

Adult Lung Transplants (January 2000 – June 2012)
Diagnosis = IPF Risk Factors For 1 Year Mortality with 95% Confidence Limits
Recipient Bilirubin
0.0 0.5 1.0 1.50.0
0.5
1.0
1.5
2.0
Bilirubin (mg/dl)
Ha
zard
Ra
tio
of
1 Y
ea
r M
ort
alit
y
p < 0.0001
2014JHLT. 2014 Oct; 33(10): 1009-1024

Adult Lung Transplants (January 2000 – June 2012)
Diagnosis = IPFRisk Factors For 1 Year Mortality with 95% Confidence Limits
Recipient Creatinine at Transplant
0.50 0.75 1.00 1.25 1.500.0
0.5
1.0
1.5
2.0
Creatinine
Ha
zard
Ra
tio
of
1 Y
ea
r M
ort
alit
y
p = 0.0037
2014JHLT. 2014 Oct; 33(10): 1009-1024

Adult Lung Transplants (January 2000 – June 2008)
Risk Factors For 5 Year Mortality
N = 9,930* Retransplant includes those with a retransplant diagnosis or a previous transplant was reported
2014JHLT. 2014 Oct; 33(10): 1009-1024

Continuous Factors (see figures)
Recipient age Recipient oxygen required at rest
Transplant center volume Cardiac output
Height difference
Adult Lung Transplants (January 2000 – June 2008)
Risk Factors For 5 Year Mortality
2014JHLT. 2014 Oct; 33(10): 1009-1024

Adult Lung Transplants (January 2000 – June 2008)
Risk Factors For 5 Year Mortality with 95% Confidence Limits Recipient Age
20 25 30 35 40 45 50 55 60 650.0
0.5
1.0
1.5
2.0
Recipient Age
Ha
zard
Ra
tio
of
5 Y
ea
r M
ort
alit
y
p < 0.0001
2014JHLT. 2014 Oct; 33(10): 1009-1024

Adult Lung Transplants (January 2000 – June 2008)
Risk Factors For 5 Year Mortality with 95% Confidence Limits Center Volume
5 10 15 20 25 30 35 40 45 500.0
0.5
1.0
1.5
2.0
Center Volume (cases per year)
Ha
zard
Ra
tio
of
5 Y
ea
r M
ort
alit
y
p < 0.0001
2014JHLT. 2014 Oct; 33(10): 1009-1024

Adult Lung Transplants (January 2000 – June 2008)
Risk Factors For 5 Year Mortality with 95% Confidence Limits Height Difference
-15 -10 -5 0 5 10 15 200.0
0.5
1.0
1.5
2.0
Donor Height - Recipient Height (cm)
Ha
zard
Ra
tio
of
5 Y
ea
r M
ort
alit
y
p = 0.0260
2014JHLT. 2014 Oct; 33(10): 1009-1024

Adult Lung Transplants (January 2000 – June 2008)
Risk Factors For 5 Year Mortality with 95% Confidence Limits Recipient Oxygen Required at Rest
0 1 2 3 4 5 60.0
0.5
1.0
1.5
2.0
Oxygen Required at Rest (L/min)
Ha
zard
Ra
tio
of
5 Y
ea
r M
ort
alit
y
p = 0.0013
2014JHLT. 2014 Oct; 33(10): 1009-1024

Adult Lung Transplants (January 2000 – June 2008)
Risk Factors For 5 Year Mortality with 95% Confidence Limits Recipient Pre-Transplant Cardiac Output
3 4 5 6 7 80.0
0.5
1.0
1.5
2.0
Cardiac output
Ha
zard
Ra
tio
of
5 Y
ea
r M
ort
alit
y
p < 0.0001
2014JHLT. 2014 Oct; 33(10): 1009-1024

Adult Lung Transplants (January 2000 – June 2008)
Risk Factors For 5 Year MortalityConditional on Survival to 1 Year
N = 7,8902014JHLT. 2014 Oct; 33(10): 1009-1024

Continuous Factors (see figures)
Recipient age Recipient oxygen required at rest
Transplant center volume Cardiac output
BMI difference PVR
Adult Lung Transplants (January 2000 – June 2008)
Risk Factors For 5 Year MortalityConditional on Survival to 1 Year
2014JHLT. 2014 Oct; 33(10): 1009-1024

Adult Lung Transplants (January 2000 – June 2008)
Risk Factors For 5 Year Mortality with 95% Confidence LimitsConditional on Survival to 1 Year
Recipient Age
20 25 30 35 40 45 50 55 60 650.0
0.5
1.0
1.5
2.0
2.5
3.0
Recipient Age
Ha
zard
Ra
tio
of
5 Y
ea
r M
ort
alit
y
p < 0.0001
2014JHLT. 2014 Oct; 33(10): 1009-1024

Adult Lung Transplants (January 2000 – June 2008)
Risk Factors For 5 Year Mortality with 95% Confidence LimitsConditional on Survival to 1 Year
Center Volume
5 10 15 20 25 30 35 40 45 500.0
0.5
1.0
1.5
2.0
Center Volume (cases per year)
Ha
zard
Ra
tio
of
5 Y
ea
r M
ort
alit
y
p = 0.0003
2014JHLT. 2014 Oct; 33(10): 1009-1024

Adult Lung Transplants (January 2000 – June 2008)
Risk Factors For 5 Year Mortality with 95% Confidence LimitsConditional on Survival to 1 Year
BMI Difference
-8 -6 -4 -2 0 2 4 6 80.0
0.5
1.0
1.5
2.0
Donor BMI - Recipient BMI (kg/m2)
Ha
zard
Ra
tio
of
5 Y
ea
r M
ort
alit
y
p = 0.0087
2014JHLT. 2014 Oct; 33(10): 1009-1024

Adult Lung Transplants (January 2000 – June 2008)
Risk Factors For 5 Year Mortality with 95% Confidence LimitsConditional on Survival to 1 Year
Recipient Oxygen Required at Rest
0 1 2 3 4 5 60.0
0.5
1.0
1.5
2.0
Oxygen Required at Rest (L/min)
Ha
zard
Ra
tio
of
5 Y
ea
r M
ort
alit
y
p = 0.0082
2014JHLT. 2014 Oct; 33(10): 1009-1024

Adult Lung Transplants (January 2000 – June 2008)
Risk Factors For 5 Year Mortality with 95% Confidence LimitsConditional on Survival to 1 Year
Recipient Pre-Transplant Cardiac Output
3 4 5 6 7 80.0
0.5
1.0
1.5
2.0
2.5
Cardiac output
Ha
zard
Ra
tio
of
5 Y
ea
r M
ort
alit
y
p = 0.0142
2014JHLT. 2014 Oct; 33(10): 1009-1024

Adult Lung Transplants (January 2000 – June 2008)
Risk Factors For 5 Year Mortality with 95% Confidence LimitsConditional on Survival to 1 Year
Recipient PVR
1 2 3 4 5 60.0
0.5
1.0
1.5
2.0
Recipient PVR
Ha
zard
Ra
tio
of
5 Y
ea
r M
ort
alit
y
p = 0.0018
2014JHLT. 2014 Oct; 33(10): 1009-1024

Adult Lung Transplants (January 1997 – June 2003)
Risk Factors For 10 Year Mortality
N = 5,7762014
JHLT. 2014 Oct; 33(10): 1009-1024

Continuous Factors (see figures)
Recipient age Recipient oxygen required at rest
Transplant center volume Cardiac output
Donor Age Creatinine
BMI difference
Adult Lung Transplants (January 1997 – June 2003)
Risk Factors For 10 Year Mortality
2014JHLT. 2014 Oct; 33(10): 1009-1024

Adult Lung Transplants (January 1997 – June 2003)
Risk Factors For 10 Year Mortality with 95% Confidence LimitsRecipient Age
20 25 30 35 40 45 50 55 60 650.0
0.5
1.0
1.5
2.0
Recipient Age
Ha
zard
Ra
tio
of
10
Ye
ar
Mo
rta
lity
p < 0.0001
2014JHLT. 2014 Oct; 33(10): 1009-1024

Adult Lung Transplants (January 1997 – June 2003)
Risk Factors For 10 Year Mortality with 95% Confidence Limits Center Volume
5 10 15 20 25 30 35 40 45 500.0
0.5
1.0
1.5
2.0
Center Volume (cases per year)
Ha
zard
Ra
tio
of
10
Ye
ar
Mo
rta
lity
p < 0.0001
2014JHLT. 2014 Oct; 33(10): 1009-1024

Adult Lung Transplants (January 1997 – June 2003)
Risk Factors For 10 Year Mortality with 95% Confidence LimitsDonor Age
15 20 25 30 35 40 45 50 550.0
0.5
1.0
1.5
2.0
Donor Age
Ha
zard
Ra
tio
of
10
Ye
ar
Mo
rta
lity
p = 0.0009
2014JHLT. 2014 Oct; 33(10): 1009-1024

Adult Lung Transplants (January 1997 – June 2003)
Risk Factors For 10 Year Mortality with 95% Confidence LimitsBMI Difference
-8 -6 -4 -2 0 2 4 6 80.0
0.5
1.0
1.5
2.0
Donor BMI - Recipient BMI (kg/m2)
Ha
zard
Ra
tio
of
10
Ye
ar
Mo
rta
lity
p < 0.0001
2014JHLT. 2014 Oct; 33(10): 1009-1024

Adult Lung Transplants (January 1997 – June 2003)
Risk Factors For 10 Year Mortality with 95% Confidence LimitsRecipient Oxygen Required at Rest
0 1 2 3 4 5 60.0
0.5
1.0
1.5
2.0
Oxygen Required at Rest (L/min)
Ha
zard
Ra
tio
of
10
Ye
ar
Mo
rta
lity
p = 0.0057
2014JHLT. 2014 Oct; 33(10): 1009-1024

Adult Lung Transplants (January 1997 – June 2003)
Risk Factors For 10 Year Mortality with 95% Confidence LimitsRecipient Pre-Transplant Cardiac Output
3 4 5 6 7 80.0
0.5
1.0
1.5
2.0
2.5
Cardiac output
Ha
zard
Ra
tio
of
10
Ye
ar
Mo
rta
lity
p = 0.0326
2014JHLT. 2014 Oct; 33(10): 1009-1024

Adult Lung Transplants (January 1997 – June 2003)
Risk Factors For 10 Year Mortality with 95% Confidence Limits Recipient Creatinine at Transplant
0.50 0.75 1.00 1.25 1.500.0
0.5
1.0
1.5
2.0
Creatinine
Ha
zard
Ra
tio
of
10
Ye
ar
Mo
rta
lity
p = 0.0242
2014JHLT. 2014 Oct; 33(10): 1009-1024

Adult Lung Transplants (January 1995 – June 2008)
Risk Factors For Retransplantation within 5 Years
N = 13,778* Other = All diagnoses other than COPD, IPAH, IPF, cystic fibrosis, sarcoidosis, pulmonary fibrosis, bronchiectasis, alpha-1 antitrypsin deficiency, retransplant , LAM and Connective Tissue Disease.
2014JHLT. 2014 Oct; 33(10): 1009-1024

Adult Lung Transplants (January 1995 – June 2008)
Risk Factors For Retransplantation within 5 Years
Continuous Factors (see figures)
Recipient age Recipient height
Donor age BMI ratio
2014JHLT. 2014 Oct; 33(10): 1009-1024

Adult Lung Transplants (January 1995 – June 2008) Risk Factors For Retransplantation within 5 Years with 95% Confidence Limits
Recipient Age
25 30 35 40 45 50 55 60 650.0
1.0
2.0
3.0
4.0
5.0
6.0
7.0
Recipient Age
Ha
zard
Ra
tio
of
Re
tra
ns
pla
nta
tio
n
wit
hin
5 Y
ea
rs
p < 0.0001
2014JHLT. 2014 Oct; 33(10): 1009-1024

Adult Lung Transplants (January 1995 – June 2008) Risk Factors For Retransplantation within 5 Years with 95% Confidence Limits
Donor Age
15 20 25 30 35 40 45 50 550.0
0.5
1.0
1.5
2.0
Donor Age
Ha
zard
Ra
tio
of
Re
tra
ns
pla
nta
tio
n
wit
hin
5 Y
ea
rs
p = 0.0048
2014JHLT. 2014 Oct; 33(10): 1009-1024

Adult Lung Transplants (January 1995 – June 2008) Risk Factors For Retransplantation within 5 Years with 95% Confidence Limits
Recipient Height
155 160 165 170 175 180 1850.0
0.5
1.0
1.5
2.0
2.5
3.0
Recipient Height (cm)
Ha
zard
Ra
tio
of
Re
tra
ns
pla
nta
tio
n
wit
hin
5 Y
ea
rs
p < 0.0001
2014JHLT. 2014 Oct; 33(10): 1009-1024

Adult Lung Retransplants (January 1995 – June 2012)
Retransplant recipientsRisk Factors For 1 Year Mortality
N = 7312014JHLT. 2014 Oct; 33(10): 1009-1024

Adult Lung Retransplants (January 1995 – June 2012)
Retransplant recipientsRisk Factors For 1 Year Mortality
Continuous Factors (see figures)
Transplant center volume Creatinine
Donor height
2014JHLT. 2014 Oct; 33(10): 1009-1024

Adult Lung Retransplants (January 1995 – June 2012)
Retransplant recipientsRisk Factors For 1 Year Mortality with 95% Confidence Limits
Center Volume
10 15 20 25 30 35 40 45 500.0
0.5
1.0
1.5
2.0
2.5
Center Volume (cases per year)
Ha
zard
Ra
tio
of
1 Y
ea
r M
ort
alit
y
p = 0.0170
2014JHLT. 2014 Oct; 33(10): 1009-1024

Adult Lung Retransplants (January 1995 – June 2012)
Retransplant recipients Risk Factors For 1 Year Mortality with 95% Confidence Limits
Donor Height
155 160 165 170 175 180 1850.0
0.5
1.0
1.5
2.0
2.5
3.0
Donor Height (cm)
Ha
zard
Ra
tio
of
1 Y
ea
r M
ort
alit
y
p = 0.0133
2014JHLT. 2014 Oct; 33(10): 1009-1024

Adult Lung Retransplants (January 1995 – June 2012)
Retransplant recipientsRisk Factors For 1 Year Mortality with 95% Confidence Limits
Recipient Creatinine at Transplant
0.50 0.75 1.00 1.25 1.500.0
0.5
1.0
1.5
2.0
Creatinine
Ha
zard
Ra
tio
of
1 Y
ea
r M
ort
alit
y
p = 0.0054
2014JHLT. 2014 Oct; 33(10): 1009-1024