Embed Size (px)
Citation preview

Biochimica et Biophysica Acta, 462 (1977) 450-466 © Elsevier/North-Holland Biomedical Press
BBA 47392
LUMINESCENCE OF BACTERIORHODOPSIN FROM H A L O B A C T E R I U M
H A L O B I U M AND ITS CONNECTION WITH THE PHOTOCHEMICAL CON-
VERSIONS OF THE CHROMOPHORE
V. A. SINESHCHEKOV and F. F. LITVIN
Physico-Chemical Biology, Biology Department, Moscow State University, Moscow, (U.S.S.R.)
(Received April 25th, 1977)
SUMMARY
Red luminescence of purple membranes from Halobacterium halobium cells in suspension, dry film or freeze-dried preparations was studied and its emission, excita- tion and polarization spectra are reported. The emission spectra have three bands at 665-670, 720-730 and at 780-790 nm. The position (maximum at 580 nm) and shape of the excitation spectra are close to those of the absorption spectra. The spectra depend on experimental conditions, in particular on pH of the medium. Acidification increases the long wavelength part of the emission spectra and shifts the main excita- tion maximum 50-60 nm to the longer wavelength side. Low-temperature light- induced changes of the absorption, emission and excitation spectra are presented. Several absorbing and emitting species of bacteriorhodopsin are responsible for the observed spectral changes. The bacteriorhodopsin photoconversion rate constant was estimated to be about 1 • 101 z s- t at -- 196 °C from the quantum yields of the lumines- cence (1 • 10 -a) and photoreaction (1 • 10-z). The temperature dependence of the luminescence quantum yield points to the existence of two or three quenching pro- cesses with different activation energies. High degree of luminescence polarization (about 45-47 %) throughout the absorption and fluorescence spectra and its tempera- ture independence show that there is no energy transfer between bacteriorhodopsin molecules and no chromophore rotation during the excitation lifetime. In carotenoid- containing membranes, energy migration from the bulk of carotenoids to bacterio- rhodopsin was not found either. Bacteriorhodopsin phosphorescence was not observ- ed in the 500-1100 nm region and the emission is believed to be fluorescence by nature.
INTRODUCTION
It was found in a number of investigations that the halophilic bacterium Halobacterium halobium was capable of utilizing light energy [1-3]. This process includes a proton transfer through a membrane and is mediated by bacteriorhodopsin [1-9]. However, the mechanism of its initial photophysical and photochemical stages remains obscure.

451
The luminescence measurements of bacteriorhodopsin and its photochemical products can be an effective means for studying the very earliest stages of the photo- process, namely, the generation of electronic excited states, their deactivation, energy transfer between molecules and its trapping, etc., as well as for the investigation of the molecular organisation of the pigment apparatus of purple membranes.
Preliminary measurements of the luminescence of this pigment have been described independently by Sineshchekov and Litvin [10], Lewis et al. [11 ], Ebrey et al. [12], and Alfano et al. [13]. The lifetime of bacteriorhodopsin fluorescence was directly measured to be 40 ps at 90 K [13]. The major objective of the present work was to investigate spectroscopically bacteriorhodopsin luminescence in connection with the functional photochemical properties of the pigment. It was also of interest to find out whether bacteriorhodopsin luminescence could be sensitized by carotenoids.
MATERIALS AND METHODS
Purple membranes were obtained from Halobacterium halobium R1 cells, the medium and conditions for cell growth and the membrane isolation procedures employed being essentially the same as in refs. 4 and I4. The final fraction of purple membranes contained only traces of carotenoids and the ratio A28o nrn/A57o nm was about 2 : 1. However, in a number of experiments, part of the purple membrane material was taken before the sucrose gradient stage. This resulted in substantially higher proportion of carotenoids (up to 1 molecule of bacterioruberin per bacterio- rhodopsin molecule, as determined from the absorption spectra) and this material was mainly used for the investigation of the heterogeneous energy transfer.
The main samples of the measurements were purple membranes in water/ glycerol (1 : 1, v/v) medium (pH ----- 6.8-7.0) and their thin (about 0.05 ram) dry films. The films were obtained on microscope cover glasses by evaporation of water at the room temperature from purple membrane water suspension spread over a glass surface. Although the mode of the film preparation was standardized the spectra of the samples were somewhat different (see below). This can be due to the variations of local pH in a film, film thickness, the degree of its heterogeneity, the content of water, etc. As it was shown in ref. 15, purple membranes in dry films retained photochemical activity. Freeze-dried preparations of purple membranes and extracts from them and It. halobium cell suspensions were also investigated. Fractional absorbance of the samples was below 0.5--0.6 (A < 0.35). The optical path length was 2 mm for purple membrane and cell suspensions and extracts.
Absorption spectra were recorded on an SF-10 double beam recording spectro- photometer with an integrating sphere into which a sample (in a Dewar cell in the case of low-temperature measurements) was placed to avoid light scattering. The absorption spectra presented in the paper are given in fractional absorbance so that they could be compared with the excitation spectra.
Luminescence emission, excitation and polarization spectra were measured with a spectrofluorimeter with two grating monochromators the first version of which was described in ref. 16. It was additionally equipped with a photocell for measure- ments of light passing through a sample to control absorption (transmission) and scattering changes and with a photomultiplier which could be put before the analysing monochromator to measure fluorescence intensity in a wide spectral region (beyond

452
720 nm). The angle between the excitation and emission beams was 30 °. The light source was a 100 W halogen tungsten lamp.
Luminescence in the 600-850 nm region was excited with a monochromator (light intensity, 1 • 103 erg/cm 2 • s) or by the use of colored glass filters in the blue- green (400-500 nm, light intensity, 1 • l0 s erg/cm 2 • s). The exciting light of high intensity was also used as actinic light in the experiments on bacteriorhodopsin photo- conversions. Luminescence excitation spectra were measured for the emission beyond 720 nm, the monitoring spectral intervals being obtained either with a combination of the monochromator and cutting off filters or with filters only. Excitation and emission bandpasses were within 1--6 nm. All the fluorescence and excitation spectra were corrected for the spectral sensitivity of the spectrofluorimeter and for the number of incident exciting quanta.
Polarization measurements were performed with polarizing filters placed in the path of exciting and emitted light before and after the sample, respectively.
Temperature of a sample varied within +20 to --196 °C and was monitored with a thermocouple.
RESULTS
The luminescence of bacteriorhodopsin In the suspensions and dry films of purple membranes, the luminescence of
bacteriorhodopsin and the products of its photoconversions were found in the long wavelength region beyond 600 nm. The data related to this emission will be presented below. The short wavelength luminescence of cells, membranes and extracts from them was also recorded, the main bands being in the region 450-550 nm (the excita- tion was at 400 nm; band path, 6 nm). However, it was principally due to substances contained in the culture medium and was not investigated in this work. Besides, certain difficulties arose in the measurements of the weak bacteriorhodopsin lumines- cence in the cells since it closely overlapped with this relatively strong emission men- tioned above.
The red luminescence spectra of purple membranes extend to beyond 820-850 nm. Their structure is complex and includes the main maximum at 720-730 nm and two bands at 665 and 780-790 nm (see fluorescence spectra presented in Figs. 1-4, 8 and 10). The half-band width was estimated to be of about 75 nm from the criterion of bands resolution and the data on the relative intensity and distances between the resolved bands, as is suggested in refs. 17, 18. The shape and position of the lumines- cence spectra of purple membranes are somewhat different for the different samples under investigation (dry films, freeze-dried preparations, suspensions). For example, a decrease in the relative intensity of the short wavelength band at 665 nm is observed in going from a suspension to a dry film and a freeze-dried preparation; at the same time the relative intensity of the band at 780-790 nm is lower in the former (Fig. 1).
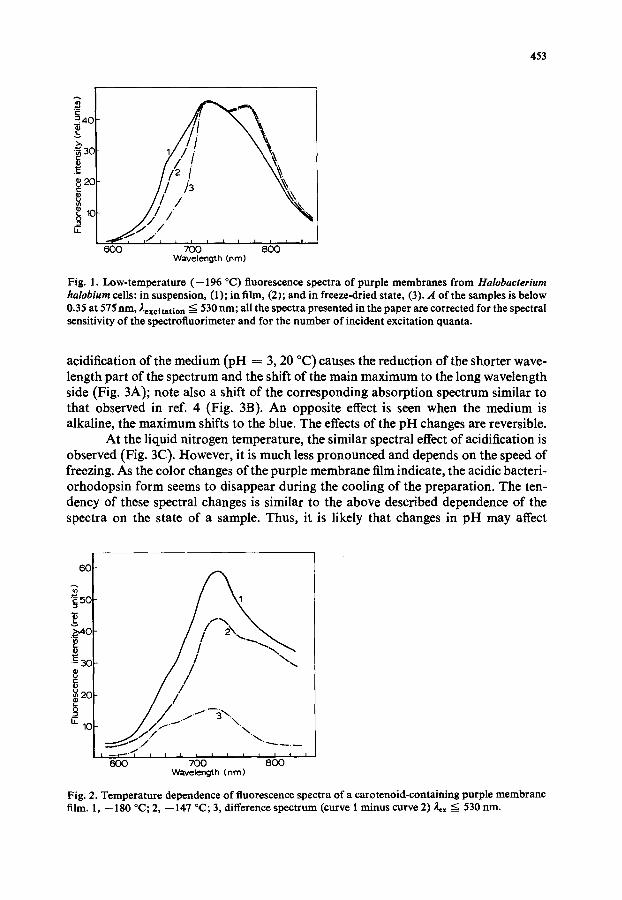
The spectra depend also on the experimental conditions, such as temperature, pH changes, preillumination, effect of solvents, wavelength of the excitation. Thus, when the temperature increases from --196 °C to the room temperature, changes in the relative intensity of the bands in the spectrum can be observed. Fig. 2 shows the fluorescence spectra at --147 and --180 °C and a difference spectrum; at --180 °C relatively higher emission is observed at 660 and 720 nm. Our experiments show that
453
~4o
}3o g
~ 2c
I.L
"*11~1 / I / ' I I I I I I I I r I 6OO 7OO 8O0
W a v e l e n g t h ( r im)
Fig. 1. Low-temperature (--196 °C) fluorescence spectra of purple membranes from Halobacterium halobium cells: in suspension, (1); in film, (2); and in freeze-dried state, (3). A of the samples is below 0.35 at 575 nm, Aexcitation --~ 530 nm; all the spectra presented in the paper are corrected for the spectral sensitivity of the spectrofiuorimeter and for the number of incident excitation quanta.
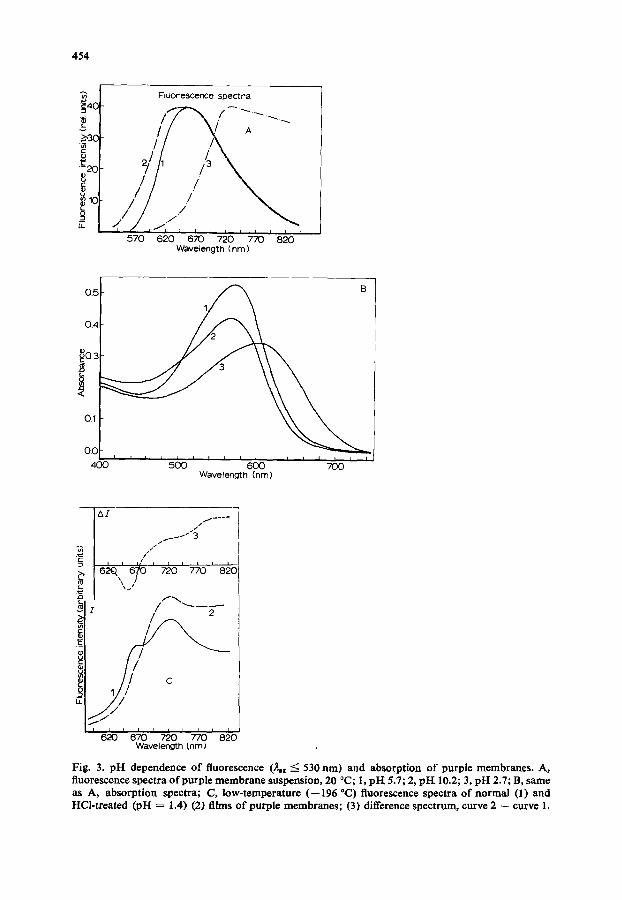
acidification of the medium (pH = 3, 20 °C) causes the reduction of the shorter wave- length part of the spectrum and the shift of the main maximum to the long wavelength side (Fig. 3A); note also a shift of the corresponding absorption spectrum similar to that observed in ref. 4 (Fig. 3B). An opposite effect is seen when the medium is alkaline, the maximum shifts to the blue. The effects of the pH changes are reversible.
At the liquid nitrogen temperature, the similar spectral effect of acidification is observed (Fig. 3C). However, it is much less pronounced and depends on the speed of freezing. As the color changes of the purple membrane film indicate, the acidic bacteri- orhodopsin form seems to disappear during the cooling of the preparation. The ten- dency of these spectral changes is similar to the above described dependence of the spectra on the state of a sample. Thus, it is likely that changes in pH may affect
60
~5o
.~o
3O
g
I t 10
I/~////.//...." --:~\.\.\. 6 0 0 7 0 0 8 0 0
Wave leng th ( n m )
Fig. 2. Temperature dependence of fluorescence spectra of a carotenoid-containing purple membrane film. 1, --180 °C; 2, --14"/°C; 3, difference spectrum (curve 1 minus curve 2) 2=x ~ 530 nm.
454
"~4C
~3C @
8 2C
Fluorescence spectra
//
/ / / / -I I~ I I I I I I I I I I
570 620 670 720 770 820 Wavelength Cnm)
0.5
0.4
~0.3
0.1
O.C I 400
B
L ' ' ' s ~ , ' ~ ' ' ' 6 ' , ~ ' . . . . , ' ' ' , ~ , - , ' '
Wavelength (nm)
AI
"~ I I I I I , , i i i ~, ~m,@ ~o 77o ~o
~5
2 /
6~o' 6-)o ' 7~o' ho' 8~o Wavelength (nm)
Fig. 3. pH dependence of fluorescence (~©x <: 530 nm) and absorption of purple membranes. A, fluorescence spectra of purple membrane suspension, 20 °C; 1, pI-[ 5.7; 2, pH 10.2; 3, pH 2.7; B, samo as A, absorption spectra; C, low-temperature (--196 °C) fluor©sccnce spectra of normal (1) and HCl-treated (pH = 1.4) (2) films of purple membranes; (3) difference spectrum, curve 2 -- curve 1.

455
70
~60
~5c
~ 3C ._.g
~2c
/ /
/ /
/ /
/ /
. l
4 0 0 I ~ = I 5 ~ I I I I 6 / I O 0 I I "P"m 1 7 0 0
Wavelength ( n m )
50 A
~o e~
0
g
10
I-
if- 1 " ' 7 " - , , 4 0 0 500 600 700
Wavelength (nrn)
5o~
.g
tl..
i2ot
6 ' ' ' ' ~ ' ' ' ' 6o ' ' 6 0 8 Wavelength (rim)
Fig. 4. Low-temperature (--196 °C) fluorescence excitation (2,.~,s ~ 720 nm), emission (2=: ~ 530 rim) and absorption spectra of carotenoid containing purple membrane films; A, short wavelength type of excitation spectra (1), absorption spectrum (2); B, long wavelength type of excitation spectra (1), absorption spectrum (2); C, emission spectra (1, 2) of the samples presented in A and B, respec- tively. The intensity of exciting monochromatic light arid the speed of scanning were so chosen that spectral changes due to low-temperature photochemistry did not exceed the error of registration (about 2 %).

456
fluorescence through changes in the physical state of the sample. The shape of the spectra depend also on the preillumination with blue or red
actinic light (see below) and it shows minor changes with the wavelength of mono- chromatic exciting light in a 400-540 nm region at --196 °C.
A dramatic effect causing the bleaching of a sample and the disappearance of the red emission is brought about by the treatment of a purple membrane film with an organic solvent (acetone + ethyl alcohol).
In order to determine the position of the absorption bands corresponding to the above emission bands and to examine the possibility of energy transfer from caro- tenoids to bacteriorhodopsin and between bacteriorhodopsin centers, luminescence excitation spectra measurements were undertaken.
It was found that the low temperature excitation spectrum of purple mem- branes in a film had a maximum at 570-580 nm, and a shoulder at 510-520 nm (see Fig. 4A, curve 1; also Fig. 9, curves 1, 2, below). The long wavelength side of the main band is not of the Gaussian shape. At the same time, the comparison of the excitation and absorption spectra shows that the former is slightly shifted toward the longer wavelength side. This and the deviation from Gaussian form point to the existence of minor bands in the 610-650 nm region. Moreover, in a number of samples, the main maximum in the excitation spectra appears in this region. There are the maxima at 620-630 nm (Figs. 4B, 5A, curve 1 and Fig. 6) and 635-640 nm (Fig. 5A curve 2 and also Fig. 8, curve 2, see below) and shoulders at 575-580 nm, that is in the region of the main absorption maximum. Thus, in these "anomalous" excitation spectra the position of the maximum does not coincide with that of the absorption spectra. It is worth noting that the corresponding fluorescence spectra are characterized by higher intensity in the region beyond 720 nm (see the maxima at 720 and 780 nm, Fig. 4C, curve 2). This is possibly connected with the appearance of a modified bacteriorhodop- sin due to changes in the physical state of the samples; we consider it likely that this may be due to pH changes (see below).
In the samples with a great proportion of carotenoids, the excitation bands belonging to these pigments are not observed. Moreover, there is a decrease in the efficiency of excitation in this region and the appearance of minima at 486, 512 and 547 nm corresponding to the carotenoid maxima in the absorption spectra (see Figs. 4B and 6). All this indicates that there is no bacteriorhodopsin luminescence sensitiza- tion by carotenoids which give only a screening effect.
The excitation spectra are affected by the same factors as those which changed the above emission spectra, namely, temperature, pH and preillumination.
The acidification of the medium shifts the excitation and absorption maxima to the red, the effect being much more pronounced in the case of the excitation spectrum, as is seen from the difference spectra, Fig. 5, A and B, curves 3.
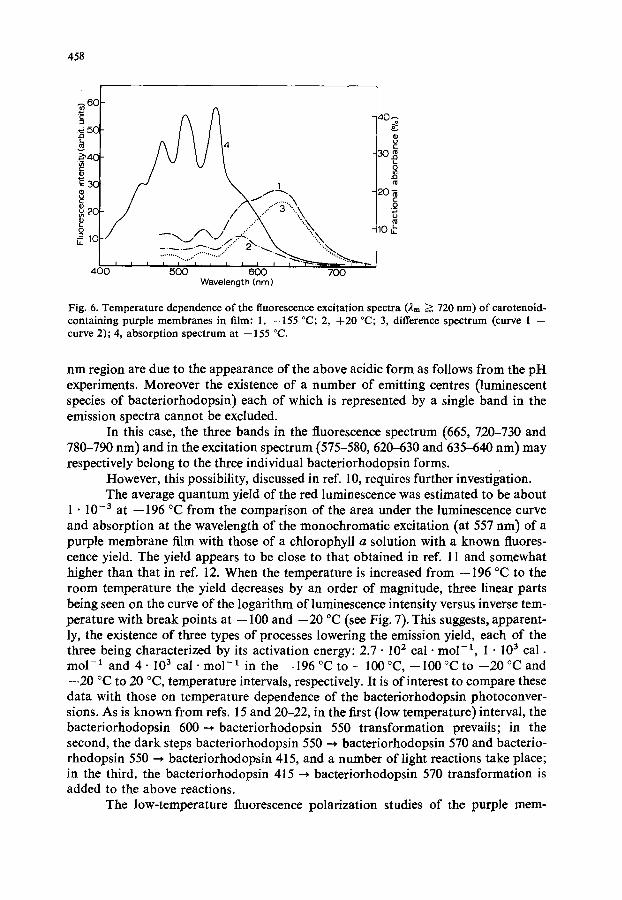
Besides, the long wave length bands at 610-650 nm seem to be more sensitive to temperature changes than the main short wave length one at 575-580 nm, as is seen in Fig. 6.
The observed variations in the shape and positions of the excitation spectra (as well as the above emission spectra changes) may be explained by the appearance of a longer wavelength bacteriorhodopsin (possibly acidic forms similar to that obtained in ref. 4 in the reaction of the reversible bacteriorhodopsin color changes from purple, absorption maximum at 560 nm, to blue, maximum at 603 nm, at low pH). To explain

457
A
i , f /-/ , 400 500 600 70[
Wavelength (nm )
8O
70~
z~
5o~ .c_
g
20 u.
10
B
5(3
10
4OO 5OO 6OO 70O Wavelength (nm)
Fig. 5. The effect of acidification on low-temperature (--196 °C) fluorescence excitation (2m ~ 720 nm) (A) and absorption 03) spectra of normal (I) and acid-treated (pH = 1.4) (2) films of purple membranes; (3) difference spectrum.
the above "anomalous" excitation spectra these forms are to have higher quantum yields than of the main bacteriorhodopsin form.
Close similarity between the excitation and absorption spectra of bacterio- rhodopsin in the membranes (Fig. 4A and Fig. 9, curves 1 and 2) indicates that the luminescence belongs to this pigment.
The discrepancy between the absorption spectrum and the "anomalous" excitation spectrum could be explained by the spectral dependence of the fluorescence quantum yield as it was observed for all-trance retinal in ref. 19.
However, it is more likely that the luminescence excitation bands at a 620-660
458
~ 6O
~ 4C 4 1
3c
2c ........ 3 . ' x
o ,c
?"'-r- 40q 500 600 700
Wavelength (nm )
4 0 ~
8 302
t~
2o~
~o ~
Fig. 6. Temperature dependence of the fluorescence excitation spectra (2m ~ 720 rim) of carotenoid- containing purple membranes in film: 1, --155 °C; 2, +20 °C; 3, difference spectrum (curve 1 -- curve 2); 4, absorption spectrum at --155 °C.
nm region are due to the appearance of the above acidic form as follows from the pH experiments. Moreover the existence of a number of emitting centres (luminescent species of bacteriorhodopsin) each of which is represented by a single band in the emission spectra cannot be excluded.
In this case, the three bands in the fluorescence spectrum (665, 720-730 and 780-790 nm) and in the excitation spectrum (575-580, 620-630 and 635-640 nm) may respectively belong to the three individual bacteriorhodopsin forms.
However, this possibility, discussed in ref. 10, requires further investigation. The average quantum yield of the red luminescence was estimated to be about
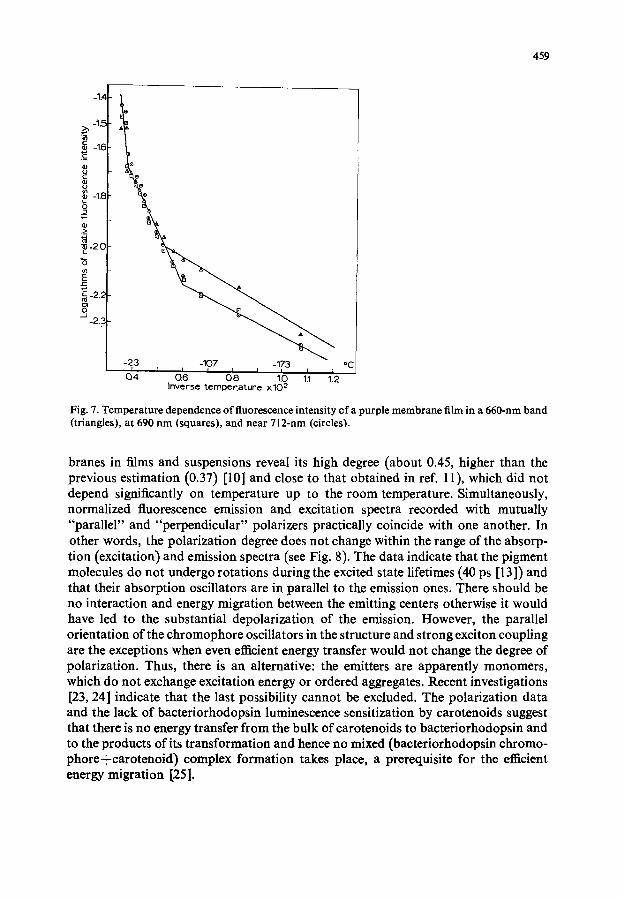
1 • 10 -3 at --196 °C from the comparison of the area under the luminescence curve and absorption at the wavelength of the monochromatic excitation (at 557 nm) of a purple membrane film with those of a chlorophyll a solution with a known fluores- cence yield. The yield appears to be close to that obtained in ref. 11 and somewhat higher than that in ref. 12. When the temperature is increased from --196 °C to the room temperature the yield decreases by an order of magnitude, three linear parts being seen on the curve of the logarithm of luminescence intensity versus inverse tem- perature with break points at -- 100 and --20 °C (see Fig. 7). This suggests, apparent- ly, the existence of three types of processes lowering the emission yield, each of the three being characterized by its activation energy: 2.7.102 cal. mo1-1, 1 • 103 cal. mol -x and 4.103 cal • mo1-1 in the --196 °C to --100°C, --100°C to --20 °C and --20 °C to 20 °C, temperature intervals, respectively. It is of interest to compare these data with those on temperature dependence of the bacteriorhodopsin photoconver- sions. As is known from refs. 15 and 20-22, in the first (low temperature) interval, the bacteriorhodopsin 600 ~ bacteriorhodopsin 550 transformation prevails; in the second, the dark steps bacteriorhodopsin 550 --* bacteriorhodopsin 570 and bacterio- rhodopsin 550 -~ bacteriorhodopsin 415, and a number of light reactions take place; in the third, the bacteriorhodopsin 415 ~ bacteriorhodopsin 570 transformation is added to the above reactions.
The low-temperature fluorescence polarization studies of the purple mem-
459
_1.h
c_ o
o
o .>_
~-2C "5
~ -2.,~
._a -2.2
#
AA® ®
®
-107 -173 - ~ 3 I I I I I I I I Q4 0.6 0.8 1.0 1.1 1.2
Inverse temper.ature x lO 2
°C
Fig. 7. Tempera tu re dependence of fluorescence intensi ty of a purple membrane film in a 660-nm band (triangles), a t 690 n m (squares), and near 712-nm (circles).
branes in films and suspensions reveal its high degree (about 0.45, higher than the previous estimation (0.37) [10] and close to that obtained in ref. 11), which did not depend significantly on temperature up to the room temperature. Simultaneously, normalized fluorescence emission and excitation spectra recorded with mutually "parallel" and "perpendicular" polarizers practically coincide with one another. In other words, the polarization degree does not change within the range of the absorp- tion (excitation) and emission spectra (see Fig. 8). The data indicate that the pigment molecules do not undergo rotations during the excited state lifetimes (40 ps [13]) and that their absorption oscillators are in parallel to the emission ones. There should be no interaction and energy migration between the emitting centers otherwise it would have led to the substantial depolarization of the emission. However, the parallel orientation of the chromophore oscillators in the structure and strong exciton coupling are the exceptions when even et~cient energy transfer would not change the degree of polarization. Thus, there is an alternative: the emitters are apparently monomers, which do not exchange excitation energy or ordered aggregates. Recent investigations [23, 24] indicate that the last possibility cannot be excluded. The polarization data and the lack of bacteriorhodopsin luminescence sensitization by carotenoids suggest that there is no energy transfer from the bulk of carotenoids to bacteriorhodopsin and to the products of its transformation and hence no mixed (bacteriorhodopsin chromo- phore+carotenoid) complex formation takes place, a prerequisite for the et~cient energy migration [25].

460
~3C .N ®
1¢
58O
~6C
84C
~2c LL
aa & A
B ' ' ' s 6 o ' ' ' ' 6 6 o ' ' ' ' 7 6 o '
i i ' ' ' 5 6 o 6 6 o ' 7oo '
Wavelength (nml
o °
8
2o ~
~o ~
o~
10
5O
30
~20
U_
C ~ ~ ~_A A A ~L~..A._~A~A_.~_~..a.__._~ -
8 ~ ' ' ' ' ~ o ' ' ' '8~' D
f 600 700 800
W a v e l e n g t h ( n m )
Fig. 8. Fluorescence polarization measurements of the purple membranes in a film at -196 °C; A, polarization spectrum of fluorescence excitation; B, absorption (1) and fluorescence excitation (;tin 720 nm) (2) spectra; C, polarization spectrum of fluorescence; D, emission spectrum (;rex ~ 530 nm).
Connection between the fluorescence and the photochemical changes ofbacteriorhodopsin Simultaneous measurements of the absorption and luminescence changes in the
same sample brought about by the exciting light were carried out (in collaboration with S. P. Balashov) in order to understand the mode of the participation of the emitting centers in the low-temperature bacteriorhodopsin conversions observed earlier in the absorption spectra at -- 180 °C [15, 20-22]. They were the appearance of the bacteriorhodopsin-600 (or P-600) product under the short wavelength light (;t __<
461
560 nm) and its back transformation into initial bacteriorhodopsin under the long wavelength illumination beyond 640 nm.
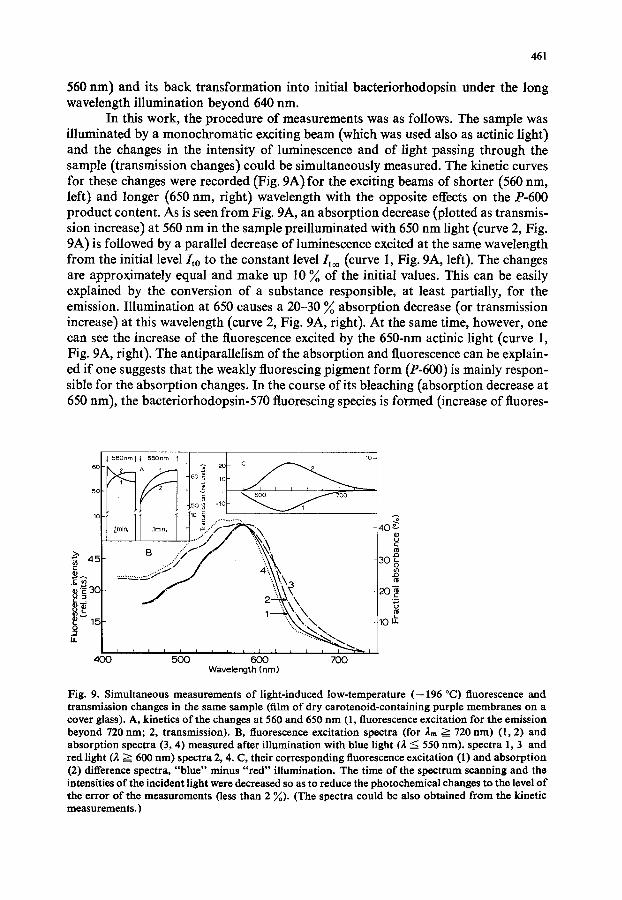
In this work, the procedure of measurements was as follows. The sample was illuminated by a monochromatic exciting beam (which was used also as actinic light) and the changes in the intensity of luminescence and of light passing through the sample (transmission changes) could be simultaneously measured. The kinetic curves for these changes were recorded (Fig. 9A) for the exciting beams of shorter (560 nm, left) and longer (650 nm, right) wavelength with the opposite effects on the £-600 product content. As is seen from Fig. 9A, an absorption decrease (plotted as transmis- sion increase) at 560 nm in the sample preilluminated with 650 nm light (curve 2, Fig. 9A) is followed by a parallel decrease of luminescence excited at the same wavelength from the initial level/to to the constant level/too (curve 1, Fig. 9A, left). The changes are approximately equal and make up 10 ~o of the initial values. This can be easily explained by the conversion of a substance responsible, at least partially, for the emission. Illumination at 650 causes a 20-30 ~o absorption decrease (or transmission increase) at this wavelength (curve 2, Fig. 9A, right). At the same time, however, one can see the increase of the fluorescence excited by the 650-nm actinic light (curve 1, Fig. 9A, right). The antiparallelism of the absorption and fluorescence can be explain- ed if one suggests that the weakly fluorescing pigment form (£-600) is mainly respon- sible for the absorption changes. In the course of its bleaching (absorption decrease at 650 nm), the bacteriorhodopsin-570 fluorescing species is formed (increase of fluores-
5 0
10
45
°"ii U ~ g~
400
I S6Onmll . . . . ~ ~ C ~0~ 2 A 1 2 0
2 6C 10
. .7/ / .~ / 4,..~ ~, " ' ~ ' ~ ~ '-,~ \.k
""~ ~ - ~ . ~ .
500 600 700 Wavelength (nm)
Fig. 9. Simultaneous measurements of light-induced low-temperature (--196 °C) fluorescence and transmission changes in the same sample (film of dry carotenoid-containing purple membranes on a cover glass). A, kinetics of the changes at 560 and 650 nm (1, fluorescence excitation for the emission beyond 720 nm; 2, transmission). B, fluorescence excitation spectra (for 2m ~ 720 rim) (1,2) and absorption spectra (3, 4) measured after illumination with blue light (2 <: 550 rim). spectra 1, 3 and red light (2 ~ 600 rim) spectra 2, 4. C, their corresponding fluorescence excitation (1) and absorpt ion (2) difference spectra, "b lue" minus " red" illumination. The time of the spectrum scanning and the intensities of the incident light were decreased so as to reduc~ the photochemical changes to the level of the error of the measurements (less than 2 %). (The spectra could be also obtained from the kinetic measurements. )
462
cence). Besides, the fluorescence increase can be partially due to decrease of the screening of exciting light by P-600.
The above mentioned changes can be observed at temperatures from --196 °C up to --50 °C. Measurements with polarized light revealed that there were the same effects independently of mutual orientation of the polarizers.
The interconversion of the shorter wavelength form with relatively higher quantum yield of luminescence and of the nonfluorescent/-600 product is confirmed by the spectroscopic investigations of these effects (see Fig. 9, B and C). The lumines- cence excitation (E = I/Io, where I is fluorescence intensity and Io, the intensity of exciting light in quanta) (curves 1 and 2) and absorption spectra (A = I--T) (curves 3 and 4) were obtained from the kinetic data. For this, P-600 was accumulated in the sample by its illumination with the shorter wave-length light (2 < 560 nm) before each measurement of the kinetic curve under monochromatic illumination in a 560- 730 nm region. The spectra reflected the dependence of the initial (Eo, Ao) and con- stant (E~o, A~o) levels of luminescence and absorption on the wavelength of illumina- tion.
They could be also obtained at low exciting light intensities by scanning the spectra of the sample preilluminated with high intensity light in the short (2 =< 560 nm) and long (2 _>_ 640 nm) wavelength regions. The difference luminescence excita- tion and absorption spectra with the maxima at 600-620 nm corresponding to the variable components of the kinetics (Evar = Eoo--Eo and Ava r = .4oo--Ao) are close to one another, although the signs of the changes are opposite, (see Fig. 9C.)
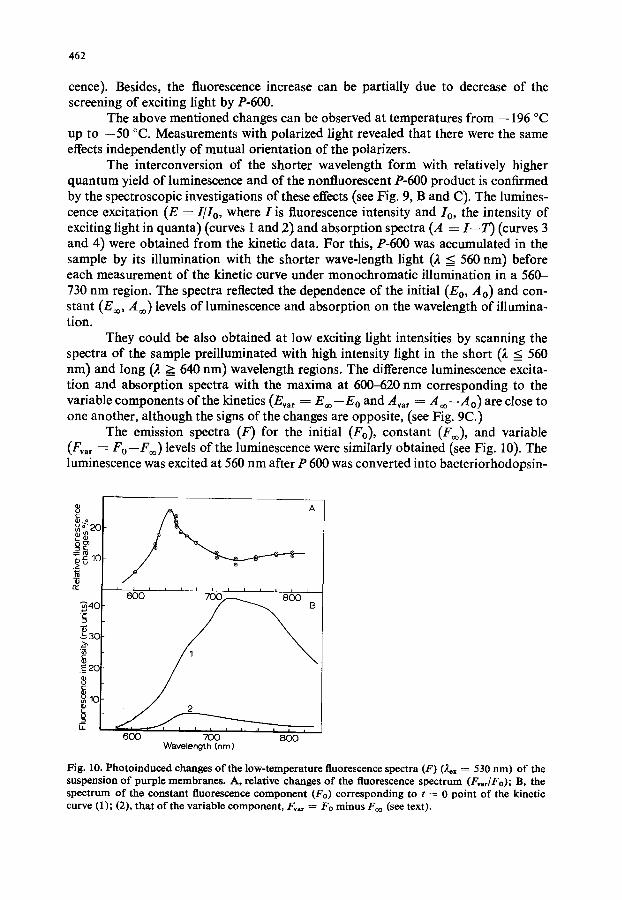
The emission spectra (F) for the initial (Fo), constant (F~o), and variable (F~ar = Fo--F=) levels of the luminescence were similarly obtained (see Fig. 10). The luminescence was excited at 560 nm after P 600 was converted into bacteriorhodopsin-
re"
~30
,~ 20
h
~ A
~0~' ' ' ' i i i ¢ , , , , i
60O 70O 8OO Wavelength (nm)
Fig. 10. Photoinduced changes of the low-temperature fluorescence spectra (F) (~x = 530 nm) of the suspension of purple membranes. A, relative changes of the fluorescence spectrum (FvadFo); B, the spectrum of the constant fluorescence component (Fo) corresponding to t ~ 0 point of the kinetic curve (1); (2), that of the variable component, Fva, = Fo minus F~o (see text).

463
570 by the illumination of the sample with red light, ;t >= 650 nm and the kinetic curves were measured as a function of emission wavelength in the 600-850 nm region. The spectrum of the variable component differs substantially from that of the constant one, the maximum changes up to 35 ~o being at 650 nm (see Fig. 10).
The observed fluorescence intensity changes are most likely not the fluores- cence induction (or transient) found in the green cell photosynthesis since in the later case the fluorescence intensity changes are not accompanied by absorption changes of the bulk of the pigment and are due to the changes in the emission quantum yield. Photochemical activity of P-600, on the one hand, and the absence of its luminescence, on the other, suggest that P-600 is a bacterial analog of visual prelumirhodopsin, as it was supposed elsewhere [15, 20] from the absorption measurements.
Phosphorescence measurements of H. halobium cells suspension and purple membrane films on microscope cover glasses with a resolving time of 1 • 10 -4 s and sensitivity of 1 • 10- 6 of an emission quantum yield in a region of 500-1100 nm at --196 °C were carried out together with A. A. Krasnovski, Jr. and N. N. Lebedev in order to find out if triplets of bacteriorhodopsin and, possibly, of other pigments exist. An emission band at 800 nm with a half band width of 40 nm and a corresponding band at 590 nm with a half band width of 20 nm in the excitation spectrum were found. The comparison of the spectra of the cells washed out of medium, cell suspen- sion, and fresh medium revealed that the emission was due to a pigment, possibly, porphyrin secreted by the cells into the medium. Bacteriorhodopsin phosphorescence was not registered. Thus, the question of the existence of phosphorescence with other parameters as well as the triplet-triplet energy transfer remains open (either the phos- phorescence lifetime is shorter than the resolution time, or the wavelength of the emission of triplet molecules is beyond the region of registration, as is in the case of carotenoids).
Thus, considering all the data in this paper on the nature of the emission one can come to the conclusion that it is fluorescence of bacteriorhodopsin. It also agrees with the measurements of bacteriorhodopsin excitation lifetimes [13] which is too short for phosphorescence.
DISCUSSION
The obtained luminescence data seem to be worth discussing in relation to the mechanism of energy conversion and molecular organization of the energy storage apparatus.
The average quantum yield of the low temperature fluorescence turns out to be rather low (1 • 10-a) which speaks well for the efficient quenching of the singlet excited states. Since the radiation lifetimes of the excited states of bacteriorhodopsin evaluated from the area under the absorption curve is of the order of 1 • 10 -9 s, the radiationless degradation rate constant is to be of about 1 • 101~ s -~ at the observed fluorescence quantum yield. The degradation rate constant can be even higher for the photo- chemically active bacteriorhodopsin-575 form and, especially, bacteriorhodopsin-600 form since their fluorescence quantum yields are much lower than the average one. Taking into account the fact that the quantum yield of the photochemical reaction of bacteriorhodopsin is high (0.5 > tp > 0.2) [15] and assuming that the reaction goes via singlet states, one can come to the conclusion that this reaction rate constant is

464
also of the order of 1 • 101~ s -1. Proceeding from the fact that the luminescence decreases by an order of magni-
tude and more when temperature is risen from --196 °C to 20 °C, one can conclude that the sum of the thermal and photochemical reaction rate constants increases also to the same extent. At the same time the quantum yield of the photoreaction remains relatively unchanged [6, 15]. These data can be understood if one suggests that there should be the parallel increase of the thermal degradation rate constant and the photochemical reaction rate constant with temperature.
The ratio of the quantum yields of the direct to back photoreactions, bacterio- rhodopsin-575 ~-bacteriorhodopsin-600, are estimated elsewhere [15, 22] to be 0.5. However, the fluorescence quantum yields of the photoactive centers differ substantial- ly, the yields of bact~iorhodopsin-575 being much higher. This could also be explain- ed by the relatively higher photochemical and thermal degradation rate constants of bacteriorhodopsin-600. From this point of view the state of the energy-rich bacterio- rhodopsin-600 centers at -- 196 °C can be considered as that of the bacteriorhodopsin- 575 molecules "heated up" to the room temperature.
The comparison of the initial low temperature photoreactions of visual rhodop- sin and bacteriorhodopsin reveals their close similarity [15, 20-22]. Both reactions are the energy storage light stages (the concept of energy storage in bathorhodopsin is given in ref. 26) and their spectral effects, i.e. the bathochromic shifts of the absorption bands, are practically the same (about 30 rim).
It was natural to suggest from this analogy that the basis of the bacteriorhodop- sin function is the photoinduced cis-trans isomerization of the chromophore [14, 15, 27] as is accepted in the research of vision.
However, there are other facts [27] which indicate that the bacteriorhodopsin- 575 ~ bacteriorhodopsin-600 photoreaction may be trans-cis isomerization. Then the energy storage in both processes (and bathochromic shift from 575 to 600 nm) is independent of the direction ofisomerization. Hence, one can suggest that the isomeri- zation is not the only process responsible for the energy storage. In this stage, there are the initial conformation changes of the complex which allow a consequent chemical transformation involving the energy storage. Probably, the stereoisomerization serves the function of spatial separation of the active groups in the complex and energy can be stored in either of the isomers (in the trans-isomer in vision and cis-isomer in the purple membranes). Such photochromic reactions are known for the compounds related to the bacteriorhodopsin chromophore. Of special interest in this respect is the photochromic reaction involving intramolecular proton translocation since it can lead to the subsequent release of a proton [28]. The latter process was suggested as one of the steps of the bacteriorhodopsin action [16, 29].
The stereoisomerization step cannot be ruled out. Moreover, it seems to be important for the very earliest stages of the energy stabilization process.
In some respects, the stereoisomerization can be considered as a usual thermal degradation act leading not to the initial state of the chromophore but to its stereoiso- mer. In this process, there is a probability for the chromophore in the excited state to return to its initial ground state which lowers the quantum yield of the photoconver- sion. The potential barrier dividing the two isomers in the ground state is overcome in the excited state whore it is not high (about 3 • 1 0 2 - 4 • 103 cal/mol) for the bacterio- rhodopsin-570 ~ bacteriorhodopsin-600 reaction. The activation energies are obtain-

465
ed f rom the temperature dependence of bacteriorhodopsin fluorescence (see above) and f rom the fact that the bacteriorhodopsin photoconversion is the main quenching process. This is also evidenced by the high degradation rate. The activation barrier for the back reaction (bacteriorhodopsin-600 ~ bacteriorhodopsin-570) and for the ther- mal degradation is apparently even lower as judged f rom the fact that the bacterio- rhodopsin-600 luminescence is quenched. Perhaps, the chromophore in the bacterio- rhodopsin-600 complex has more freedom of rotation than that of the basic bacterio- rhodopsin-570 form which can be due to conformation changes.
In this work, the emission belonging to the bacteriorhodopsin triplet molecules was not found. This can be due to the low lifetime of the expected triplet states since the time of the formation of visual analog of P-600 according to ref. 30 is comparable with the lifetime of the excited singlet states (6 ps). In this connection, the role of the bacteriorhodopsin triplets as a long-lived active state in this process become question- able. At the same time, the existence of triplets is of interest for the understanding of the energy stabilization process. I f one assumes that the reaction goes via triplets, then the intersystem crossing would be the main fluorescence quenching process and Ksx is to be of 1011 s-1 and to increase with temperature. In this case the quantum yield of the photoreaction will be determined by the constants of thermal degradation and isomerization f rom the triplet level.
One can suggest that in the process of bacteriorhodopsin photoconversion there should be the intramolecular electron separation (redistribution of electron density), stereoisomerization and proton translocation followed by H+-release f rom the complex.
ACKNOWLEDGEMENTS
The authors are grateful to Professor V. P. Skulachev for his critical reading of the manuscript.
REFERENCES
10esterhelt, D. and Stoeckenius, W. (1973) Proc. Natl. Acad. Sci. Lr.S. 70, 2853-2857 2 Danort, A. and Stoeckenius, W. (1974) Proc. Natl. Acad. Sci. U.S. 71, 1234-1238 30esterhelt, D. and Krippahl, G. (1973) FEBS Lett. 36, 72-76 40esterhelt, D. and Stoeckenius, W. (1971) Nature New Biol. 233, 149-152 5 Racker, E. and Stoeckenius, W. (1974) J. Biol. Chem. 249, 662-663 60esterhelt, D. and Hess, B. (1973) Eur. J. Biochem. 37, 316-326 7 Kayushin, L. P. and Skulachev, V. P. (1974) FEBS Lett. 39, 39-42 8 Drachev, L. A., Kaulen, A. D., Ostroumov, S. A. and Skulachev, V. P. (1974) FEBS Lett. 39,
43-45 9 Barskii, E. L., Drachev, L. A., Kaulen, A. O., Kondrashin, A. A., Liberman, E. A., Ostroumov,
A. A., Samuilov, A. D., Semertov, A. U., Skulachev, V. R. and Jasaitis, A. A. (1975) Bioorgani- cheskaja Khimija I, 113-126
10 Sineshchekov, V. A. and Litvin, F. F. (1976) Biofizika (Russ) 21,313-320 11 Lewis, A., Spoonhower, J. P. and. Perreault, G. J. (1976) Nature 260, 675-678 12 Ebrey, T., Govindjee, R., Becket, B., AIfano, R. and Yu, W. (1976) Biophys. J. 16, 99a (Abstr.) 13 Aifano, R. R., Yu, W., Govindjee, R., Becket, B. and Ebrey, T. G. (1976~ Biophys. J. 16, 541-545 14 Oesterhelt, D., Meentzen, M. and Schumann, L. 0973) Eur. J. Biochem. 40, 453-463 15 Litvin, F. F., Balashov, S. P. and Sineshchekov, V. A. (1975) Bioorganicheskaja Khimija 1767-
1777 16 Litvin, F. F. and Sineshchekov, V. A. (1963) Biofizika 8, 516-518 (Russ)

466
17 Stone, H. (1962) J. Opt. Soc. Amer. 52 N9, 998-1003 18 Guljaev, B. A., Litvin, F. F. and Vedeneev, E. P. (1971) Nauchnye Doklady Vysshej Shkoly,
Biologicheskie Nauki 4, 49-57 19 Balke, D. E. and Becker, R. S. (1967) J. Am. Chem. Soc. 187, 5061-5062 20 Lozier, K. I-L and Stoeckenius, W. (1974) Fed. Proc. 33, 1408 (Abstr.) 21 Stoeckenius, W. and Lozier, R. H. (1974) J. Supramol. Struct. 2, 769-774 22 Lozier, R. H., Bogomolni, R. A. and Stoeckenius W. (1975) Biophys. J. 15, 995-962 23 Becher, B. and Ebrey, T. G. (1976) Biochem. Biophys. Res. Commun. 69, 1-6 24 Bauer, R.-J., Dencher, N. A. and Heyn, M. P. (1976) Biophys. Struct. Mech. 2, 79-92 25 Sineshchekov, V. A., Litvin, F. F. and Das, M. (1972) Photochem. Photobiol. 15, 187-197 26 I-Ionig, B. and Ebrey, T. G. (1976) Biophys. J. 16 N2, 98a (Abstr.) 27 Jan, L. Y. (1975) Vision Res. 15, 1081-1087 28 Terenin, A. N. (1977) in Fotortika Molekul Krasitelei i Rodstvennyh Organicheskih Soedinenii,
pp. 251-258, Nauka, Leningrad 29 Lewis, A., Spoonhower, J., Bogomolni, A., Lozier, R. and Stoeckenius, W. (1974) Proc. Natl.
Acad. Sci. U.S. 71, 4462-4466 30 Busch, G. E., Applebury, M. L., Lamola, A. A. and Rentzepis, P. M. (1972) Proc. Natl. Acad.
Sci. Lt.S. 69, 2802-2806


![Nature of the primary photochemical events in rhodopsin ... · ing protein in the purple membrane of Halobacterium halobium [241,242,243,310]. This halophilic archaibac- terium grows](https://img.pdfslide.us/doc/110x75/5fd42fe2cd98eb29aa637c47/nature-of-the-primary-photochemical-events-in-rhodopsin-ing-protein-in-the-purple.jpg)