Embed Size (px)
Citation preview
Luiz F. Brito1, F. S. Schenkel1, H. R. Oliveira1,2, A. Cánovas1 & F. Miglior1,3
1Centre for Genetic Improvement of Livestock, University of Guelph, Guelph, ON, Canada 2Department of Animal Science, Federal University of Vicosa, Vicosa, MG, Brazil
3Canadian Dairy Network, Guelph, ON, Canada
Auckland, New ZealandFebruary - 2018
1
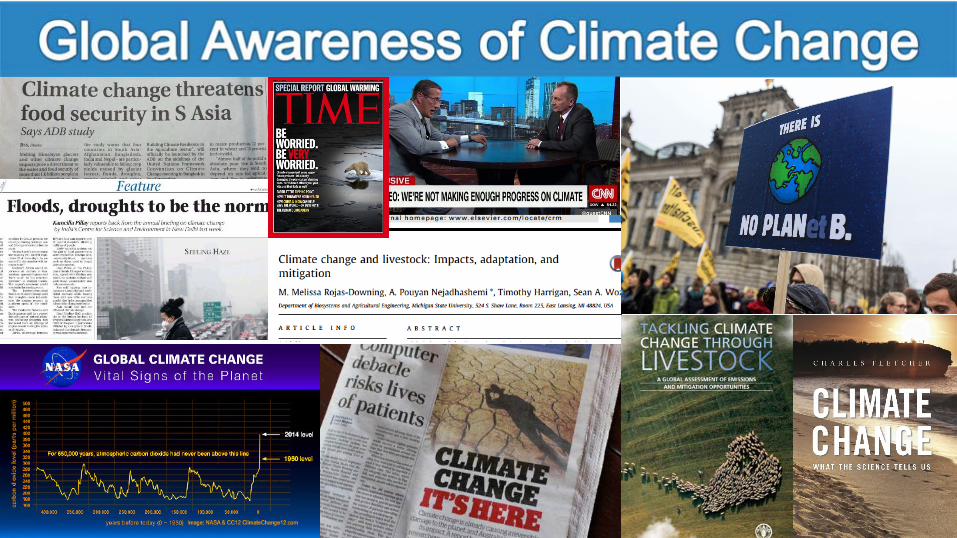
Global estimates of emissions by species:
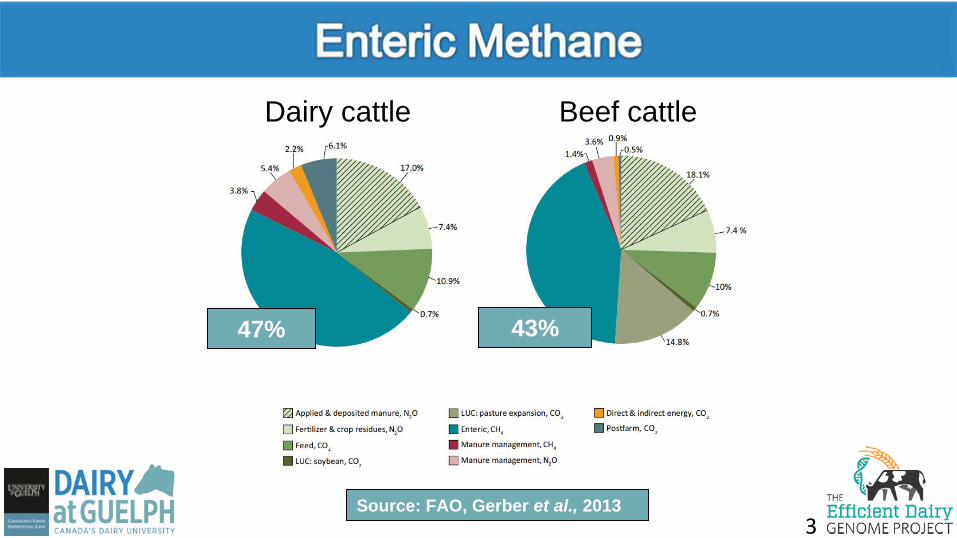
Source: FAO, Gerber et al., 2013
14.5% of global GHG emissions
2
3
Dairy cattle
Source: FAO, Gerber et al., 2013
47% 43%
Beef cattle
4
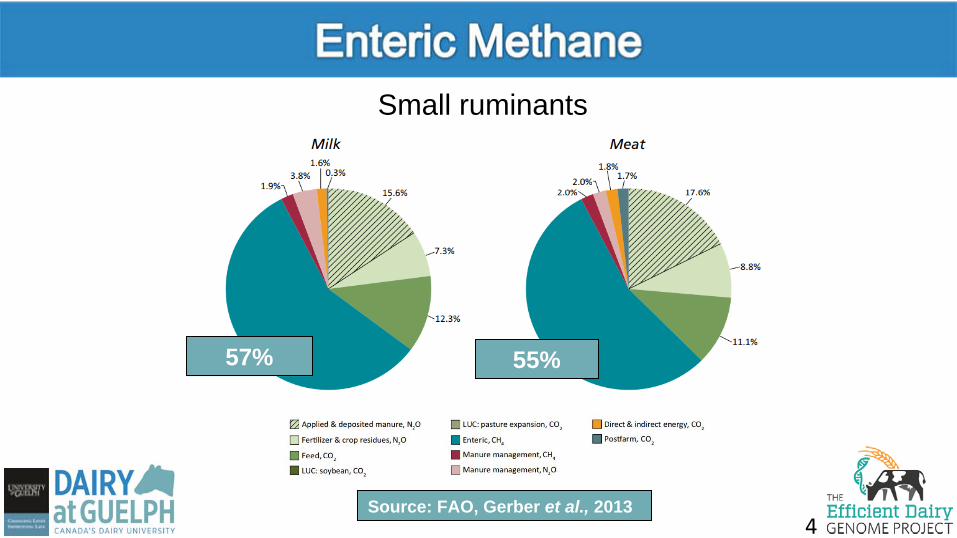
Small ruminants
57% 55%
Source: FAO, Gerber et al., 2013
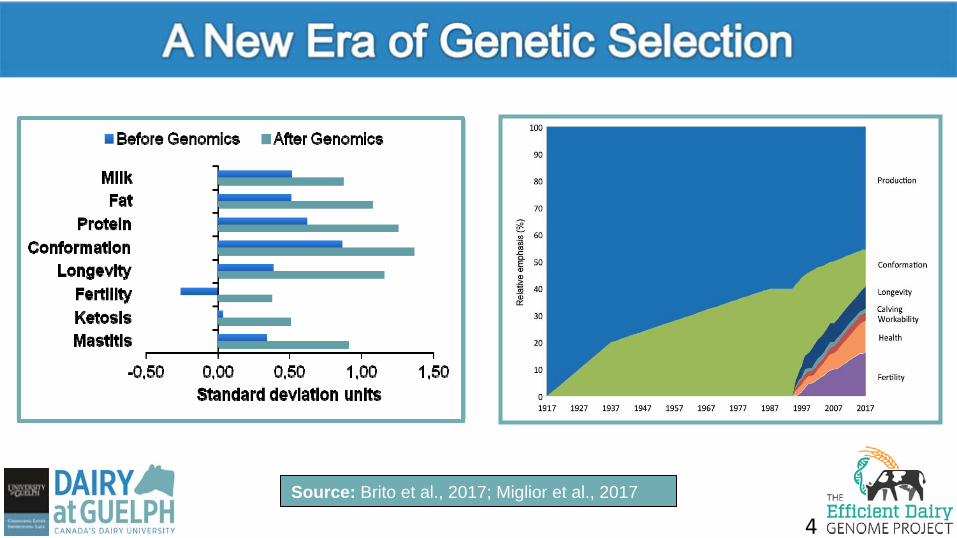
4Source: Brito et al., 2017; Miglior et al., 2017
• Various efforts around the world (e.g., de Haas et al., 2017; Negussie et al., 2017)– Numerous breeds/species– Alternative measurement equipment and protocols– Different indicator traits and prediction equations
• Reliable h2 estimates: large across-generation datasets• Methane emission seems to be heritable (e.g., Pickering et al., 2015;
de Haas et al., 2016)• Are there significant differences across breeds/species and indicator
traits?
6
7
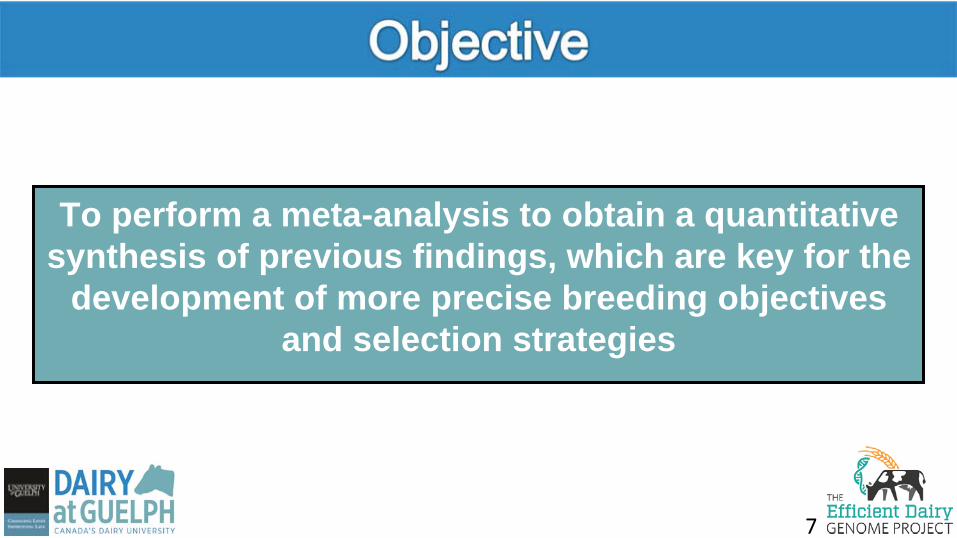
To perform a meta-analysis to obtain a quantitative synthesis of previous findings, which are key for the
development of more precise breeding objectives and selection strategies
8
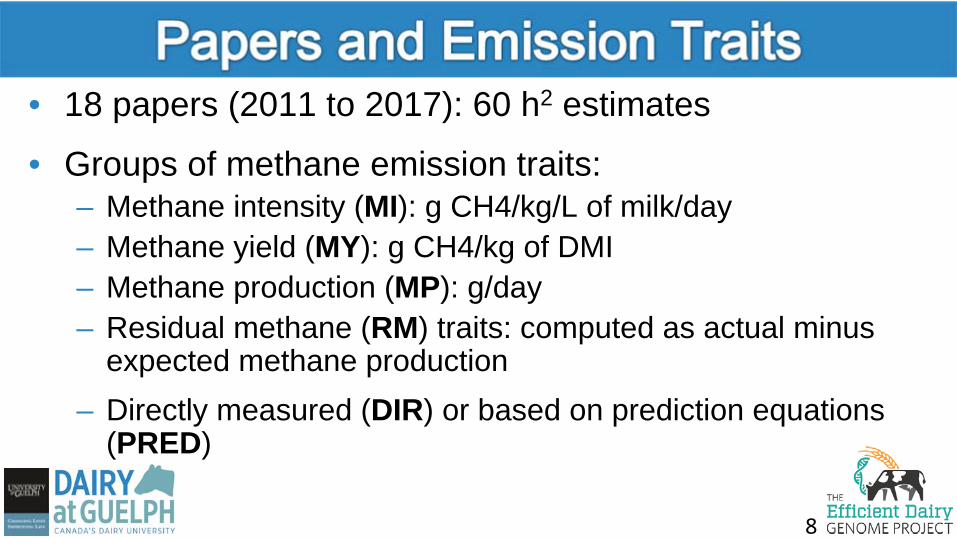
• 18 papers (2011 to 2017): 60 h2 estimates
• Groups of methane emission traits:– Methane intensity (MI): g CH4/kg/L of milk/day– Methane yield (MY): g CH4/kg of DMI – Methane production (MP): g/day– Residual methane (RM) traits: computed as actual minus
expected methane production – Directly measured (DIR) or based on prediction equations
(PRED)
9
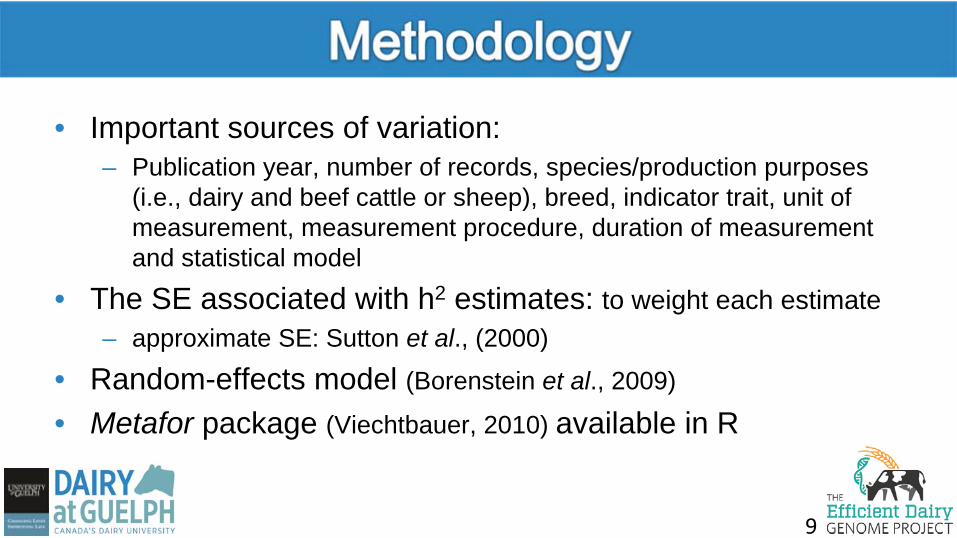
• Important sources of variation: – Publication year, number of records, species/production purposes
(i.e., dairy and beef cattle or sheep), breed, indicator trait, unit of measurement, measurement procedure, duration of measurement and statistical model
• The SE associated with h2 estimates: to weight each estimate– approximate SE: Sutton et al., (2000)
• Random-effects model (Borenstein et al., 2009)
• Metafor package (Viechtbauer, 2010) available in R
10
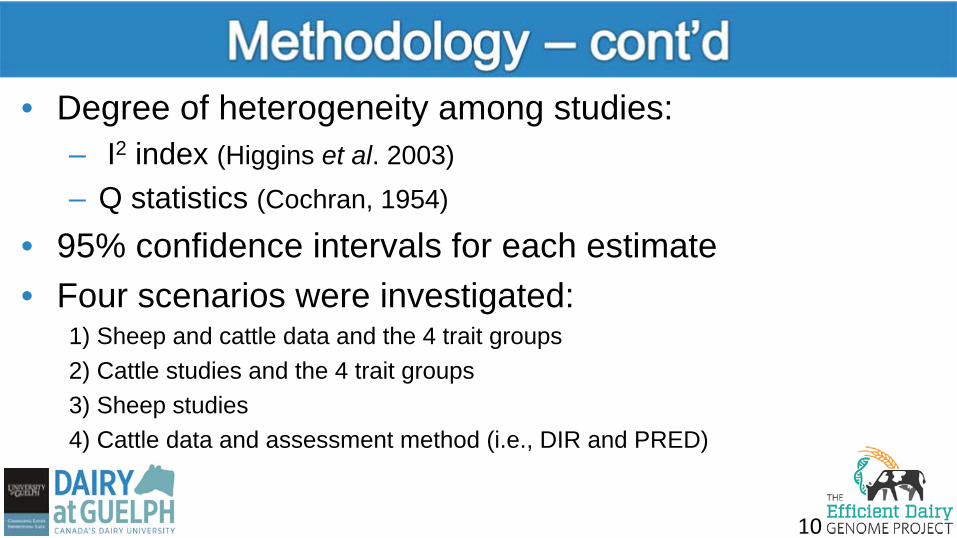
• Degree of heterogeneity among studies:– I2 index (Higgins et al. 2003)– Q statistics (Cochran, 1954)
• 95% confidence intervals for each estimate • Four scenarios were investigated:
1) Sheep and cattle data and the 4 trait groups2) Cattle studies and the 4 trait groups3) Sheep studies4) Cattle data and assessment method (i.e., DIR and PRED)
11
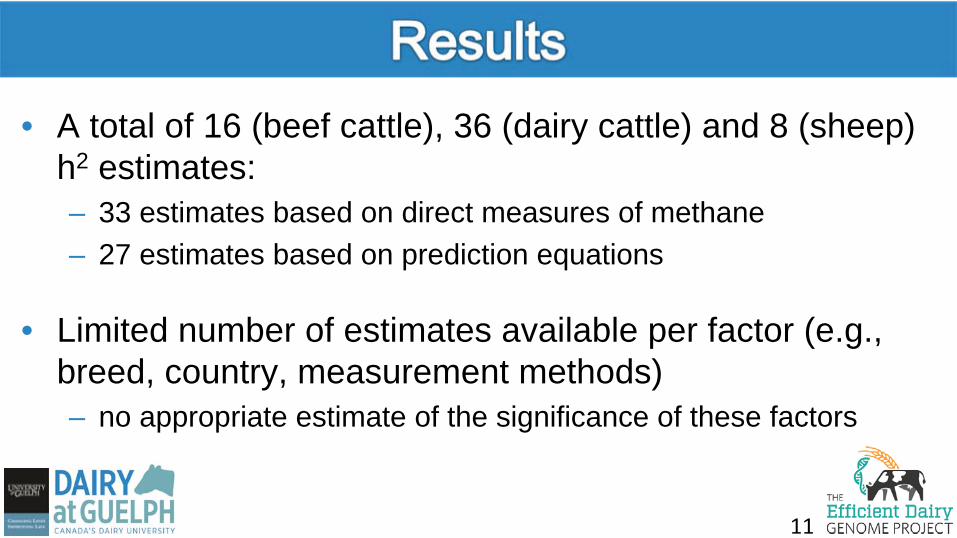
• A total of 16 (beef cattle), 36 (dairy cattle) and 8 (sheep) h2 estimates:– 33 estimates based on direct measures of methane– 27 estimates based on prediction equations
• Limited number of estimates available per factor (e.g., breed, country, measurement methods)– no appropriate estimate of the significance of these factors
12
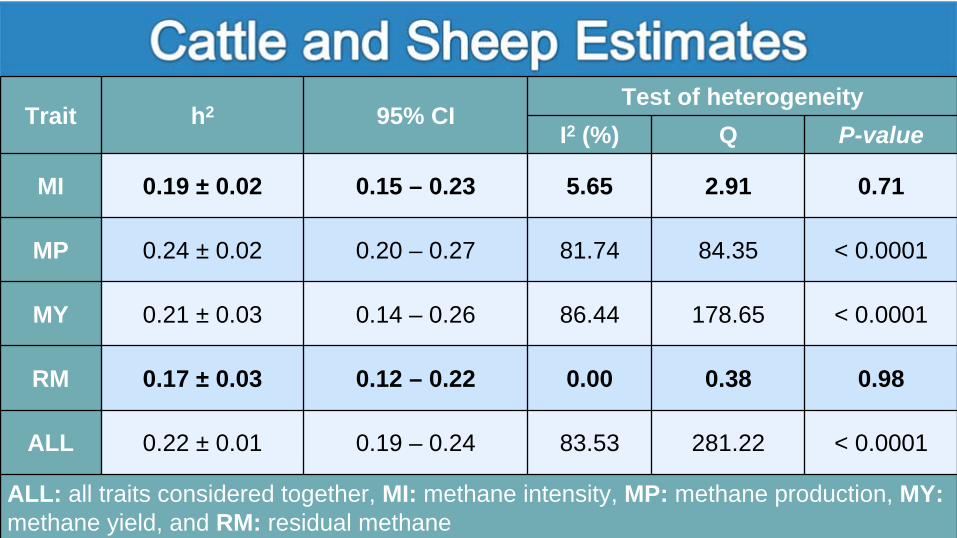
Trait h2 95% CITest of heterogeneity
I2 (%) Q P-value
MI 0.19 ± 0.02 0.15 – 0.23 5.65 2.91 0.71
MP 0.24 ± 0.02 0.20 – 0.27 81.74 84.35 < 0.0001
MY 0.21 ± 0.03 0.14 – 0.26 86.44 178.65 < 0.0001
RM 0.17 ± 0.03 0.12 – 0.22 0.00 0.38 0.98
ALL 0.22 ± 0.01 0.19 – 0.24 83.53 281.22 < 0.0001
ALL: all traits considered together, MI: methane intensity, MP: methane production, MY: methane yield, and RM: residual methane
13
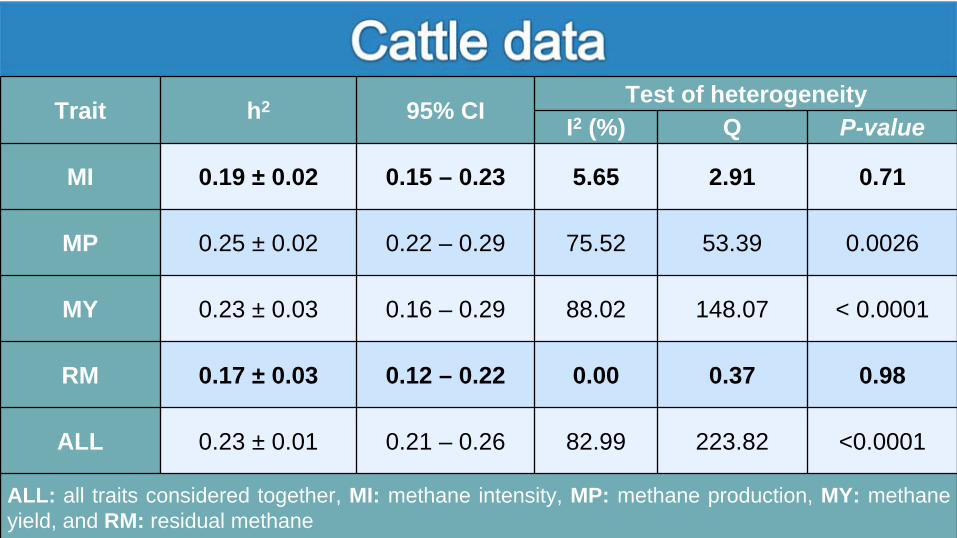
Trait h2 95% CI Test of heterogeneityI2 (%) Q P-value
MI 0.19 ± 0.02 0.15 – 0.23 5.65 2.91 0.71
MP 0.25 ± 0.02 0.22 – 0.29 75.52 53.39 0.0026
MY 0.23 ± 0.03 0.16 – 0.29 88.02 148.07 < 0.0001
RM 0.17 ± 0.03 0.12 – 0.22 0.00 0.37 0.98
ALL 0.23 ± 0.01 0.21 – 0.26 82.99 223.82 <0.0001
ALL: all traits considered together, MI: methane intensity, MP: methane production, MY: methane yield, and RM: residual methane
14
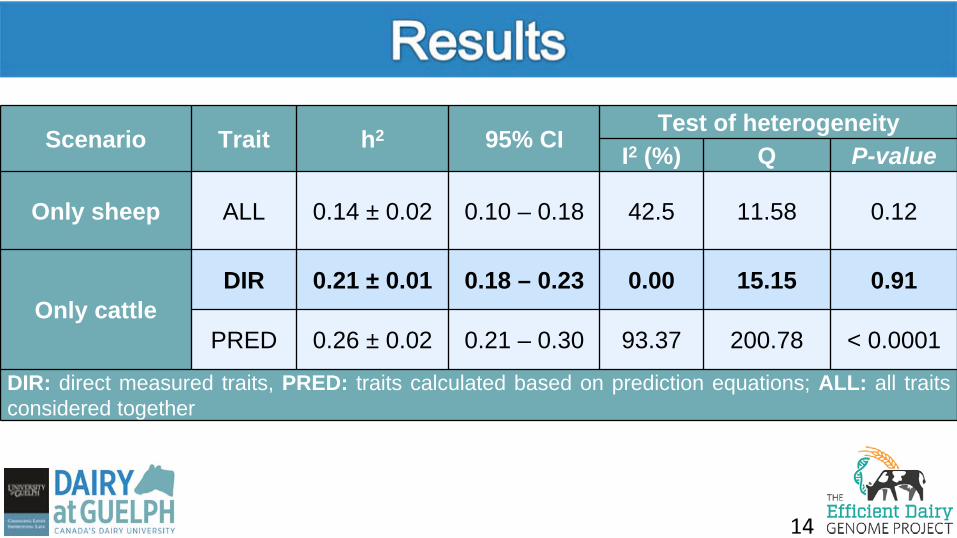
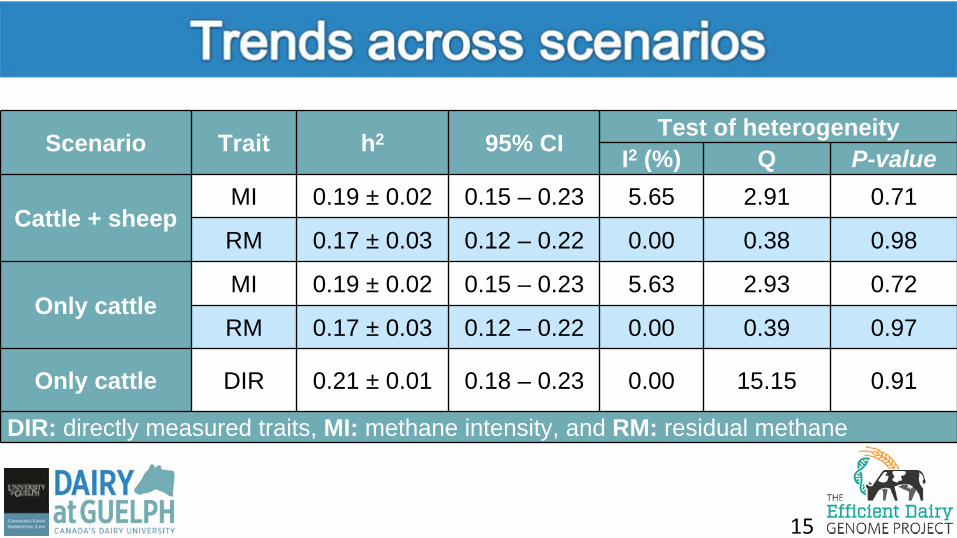
Scenario Trait h2 95% CI Test of heterogeneityI2 (%) Q P-value
Only sheep ALL 0.14 ± 0.02 0.10 – 0.18 42.5 11.58 0.12
Only cattleDIR 0.21 ± 0.01 0.18 – 0.23 0.00 15.15 0.91
PRED 0.26 ± 0.02 0.21 – 0.30 93.37 200.78 < 0.0001
DIR: direct measured traits, PRED: traits calculated based on prediction equations; ALL: all traits considered together
15
Scenario Trait h2 95% CI Test of heterogeneityI2 (%) Q P-value
Cattle + sheepMI 0.19 ± 0.02 0.15 – 0.23 5.65 2.91 0.71
RM 0.17 ± 0.03 0.12 – 0.22 0.00 0.38 0.98
Only cattleMI 0.19 ± 0.02 0.15 – 0.23 5.63 2.93 0.72
RM 0.17 ± 0.03 0.12 – 0.22 0.00 0.39 0.97
Only cattle DIR 0.21 ± 0.01 0.18 – 0.23 0.00 15.15 0.91
DIR: directly measured traits, MI: methane intensity, and RM: residual methane
16
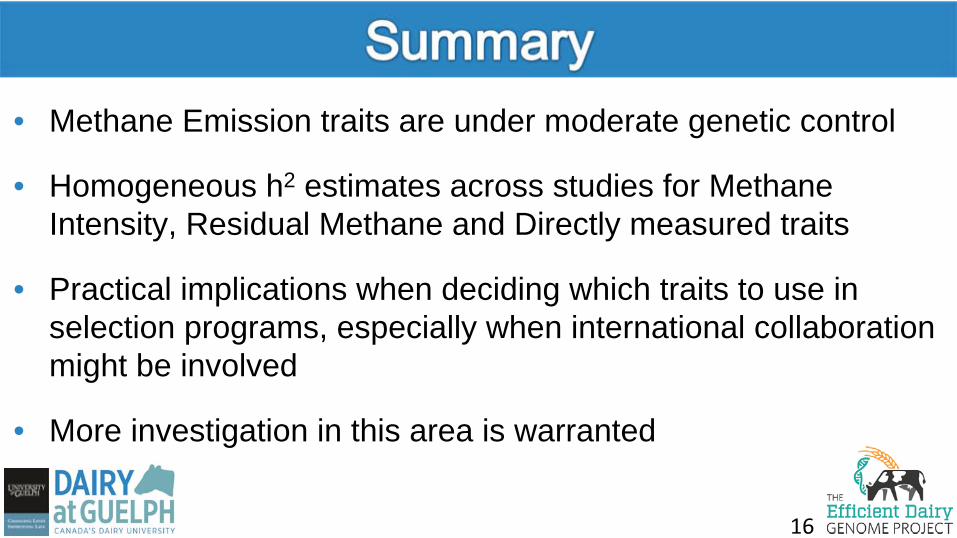
• Methane Emission traits are under moderate genetic control
• Homogeneous h2 estimates across studies for Methane Intensity, Residual Methane and Directly measured traits
• Practical implications when deciding which traits to use in selection programs, especially when international collaboration might be involved
• More investigation in this area is warranted