Embed Size (px)
Citation preview
1
Risk Aversion Luigi Guiso
AXA Annual Corporate Meeting
2
Luigi Guiso AXA PROFESSOR OF HOUSEHOLD FINANCE Einaudi
Institute for Economics and Finance

3
In the eyes of individuals financial institutions and markets have become more complex:Many more productsMany more complex financial products More difficult contracts to understand More intricate interactions
A dual complex relationship: consumers
Complexity has gone up, ability to grasp and understand not as much
1

4
In the eyes of financial institutions customers have become more complex to deal with:More demandingMore volatile and behavior harder to predictMore heterogeneous: in preferences, in beliefs, in
needs and in endowment
Harder to fit with appropriate products
A dual complex relation: intermediaries
Intermediaries (and firms more generally) capability to deal with customers is continuously challenged
2
5
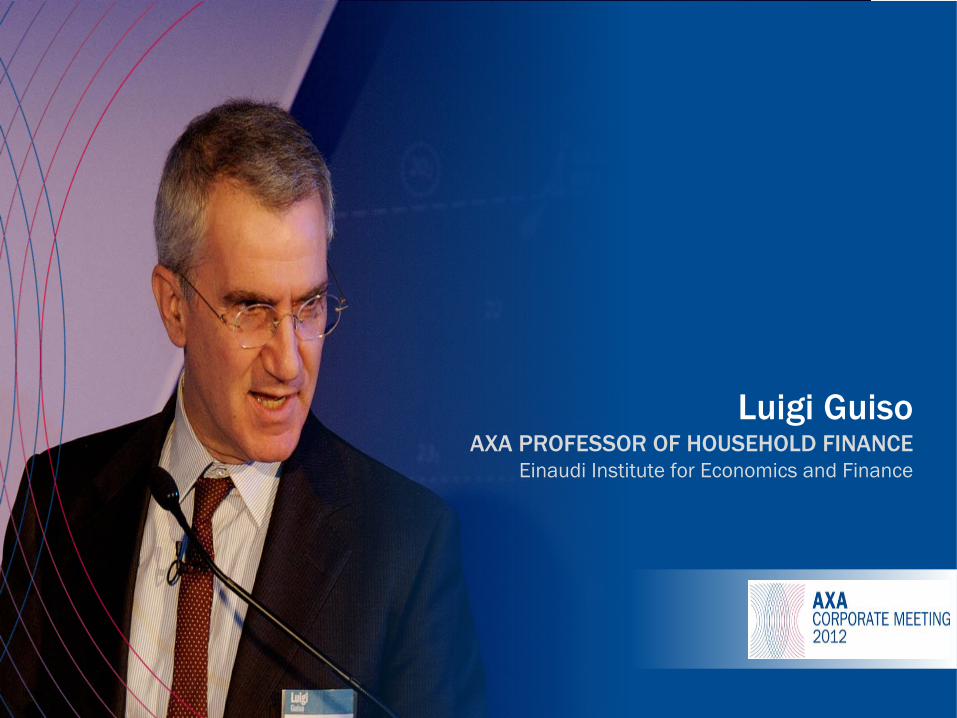
Most important: the change in availability and distribution of information induced by the ICT revolutionImmediate implication: a change in the nature of the relation between customers and intermediaries
Proximate causes
Focus: look at two dimensions of this change
The reversal of the traditional model of asymmetric information
The increased exposure to reputation spillovers
1
2
3

6
To Perugia: Risk aversionTo Perugia: Risk aversion
Luigi Guiso AXA PROFESSOR OF HOUSEHOLD FINANCE Einaudi
Institute for Economics and Finance
7
Risk and Financial Decisions
Risk aversion is the single most important determinant of the demand for insurance
It is also the single most important determinant of portfolio choice
A large part of the heterogeneity in portfolio allocations between risk and riskless assets and in demand for insurance should be explained by investors risk attitudes (assuming common priors and beliefs)

8
Questions
How can we measure risk aversion?
What determines the attitude toward risk?
Is it just an innate parameter?
Can it depend upon observable characteristics? And if so which ones
Does it vary over time and across states?
9
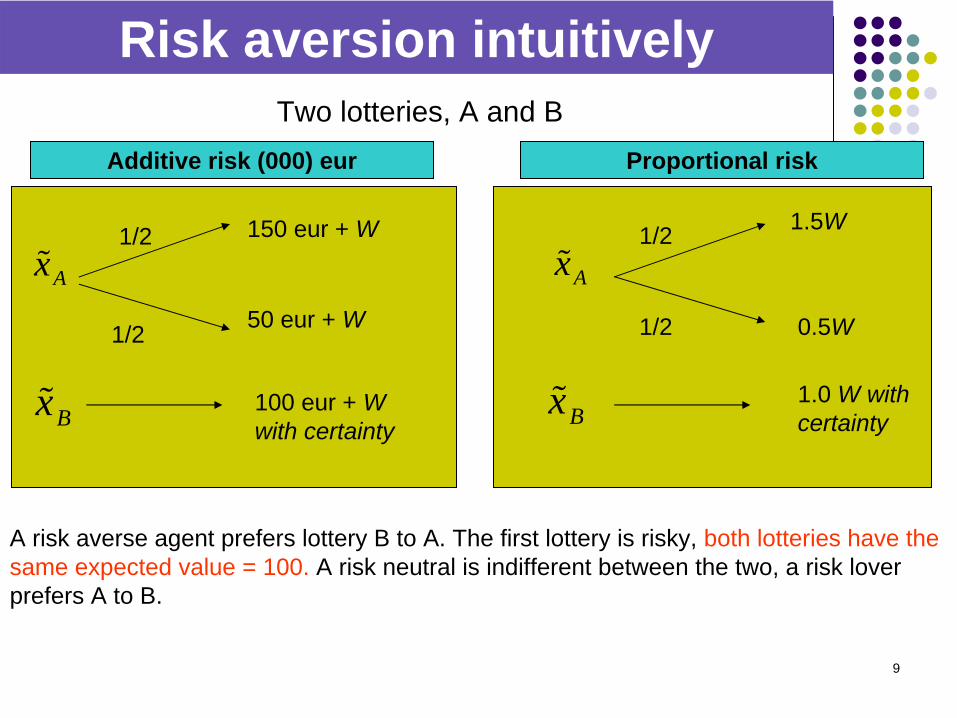
Risk aversion intuitivelyTwo lotteries, A and B
Ax
A risk averse agent prefers lottery B to A. The first lottery is risky, both lotteries have the same expected value = 100. A risk neutral is indifferent between the two, a risk lover prefers A to B.
1.5W
0.5W
1/2
1/2
Ax
Bx 1.0 W with certainty
Ax1/2 150 eur + W
50 eur + W
Bx 100 eur + W with certainty
1/2
Additive risk (000) eur Proportional risk

10
Risk aversion: formally
2 2
''( ) ( )'( ) 2 2
x xU W A WU W
If one dislikes risk he is willing to pay to avoid it. How much is called the risk premium
Additive risk Proportional risk
Amount of wealth one is willing to giveup to avoid the risk
RA: euros per unit of risk
Fraction of wealth one is willing to giveup to avoid proportional risk
RA: percentage per unit of risk
2 2
''( ) ( )'( ) 2 2
x xR R
U W W a WU W
2 2
''( ) ( )'( ) 2 2
x xU W a WU W
Riskpremium
Riskaversion
Risk Riskpremium
Riskaversion
Risk
Ex: Ex: 2 2500 50x x 2 0.25 0.5x x
if 0,125 1 R Ra if 12.5 0.01 (1 eur per unit of risk)
R Ra

11
How can we measure risk aversion?

12
1. Several strategies to elicit individual attitudes towards risk => rely on answers to specifically designed questions. Major distinction:
2. Qualitative indicators: allow to sort individuals between more and less risk tolerant
3. Quantitative: allow to obtain a measure of how much a person is willing to pay to avoid a given risk
Strategies to elicit risk attitudes

13
Qualitative Measures of Risk Attitudes
Often used in psychology
Also relied upon in the financial industry to elicit an investor risk tolerance and provide financial advise (MIFID)
Zuckerman SSS (sensation-seeking) Scale
Commonly used in psychology
Risk seeking seen as a personality trait
14
Zuckerman SSS scale
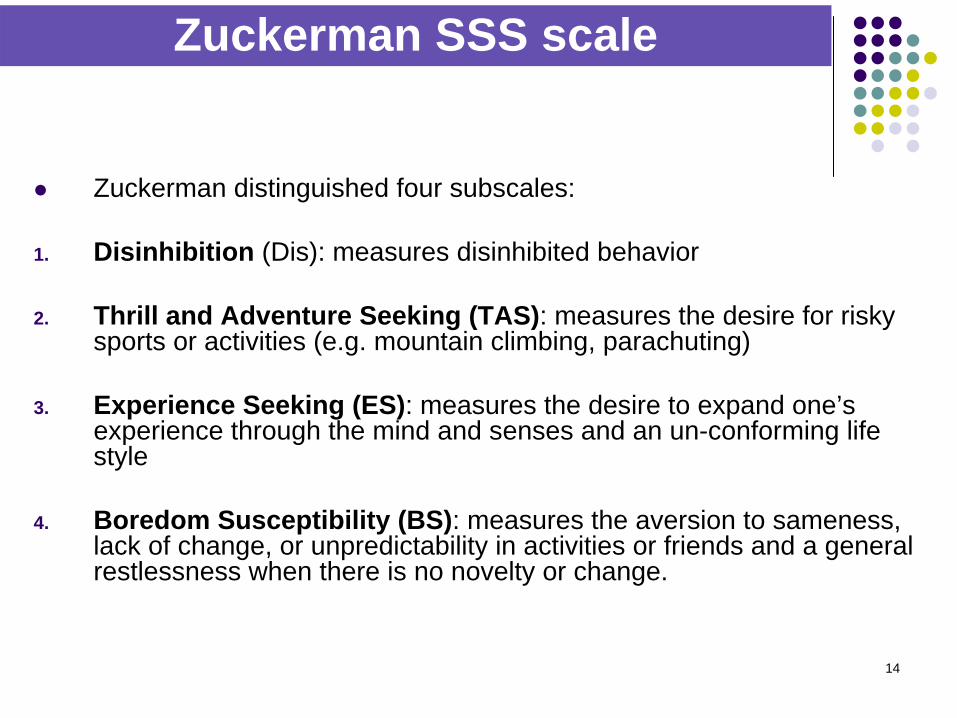
Zuckerman distinguished four subscales:
1. Disinhibition (Dis): measures disinhibited behavior
2. Thrill and Adventure Seeking (TAS): measures the desire for risky sports or activities (e.g. mountain climbing, parachuting)
3. Experience Seeking (ES): measures the desire to expand one’s experience through the mind and senses and an un-conforming life style
4. Boredom Susceptibility (BS): measures the aversion to sameness, lack of change, or unpredictability in activities or friends and a general restlessness when there is no novelty or change.
15
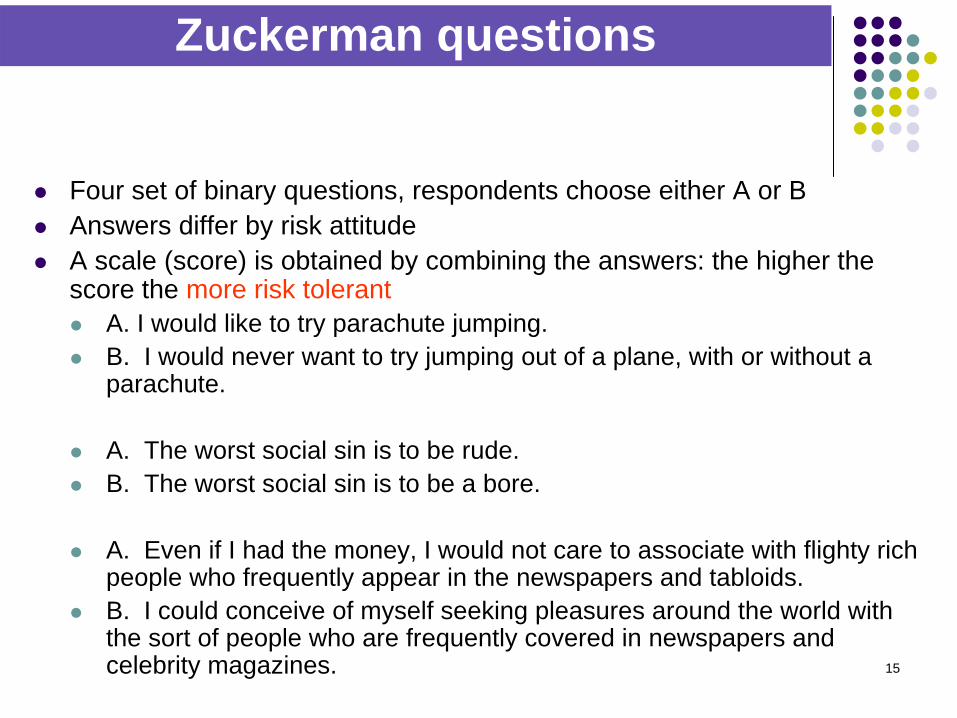
Zuckerman questions
Four set of binary questions, respondents choose either A or B
Answers differ by risk attitude
A scale (score) is obtained by combining the answers: the higher the score the more risk tolerant
A. I would like to try parachute jumping.
B. I would never want to try jumping out of a plane, with or without a parachute.
A. The worst social sin is to be rude.
B. The worst social sin is to be a bore.
A. Even if I had the money, I would not care to associate with flighty rich people who frequently appear in the newspapers and tabloids.
B. I could conceive of myself seeking pleasures around the world with the sort of people who are frequently covered in newspapers and celebrity magazines.
16
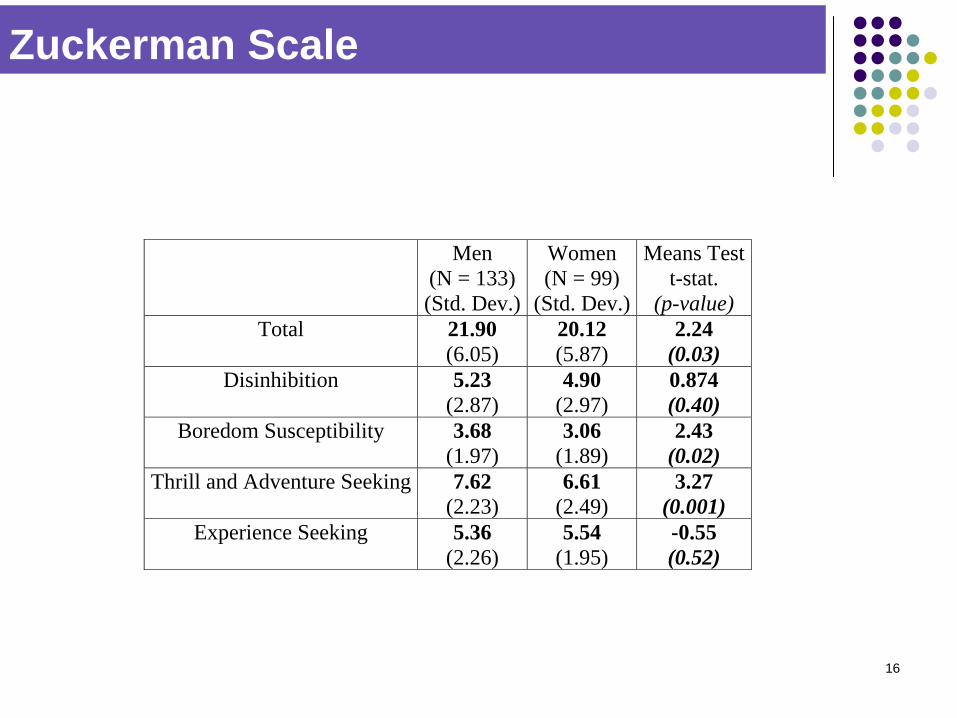
Zuckerman Scale
Men (N = 133) (Std. Dev.)
Women (N = 99)
(Std. Dev.)
Means Test t-stat.
(p-value) Total
21.90 (6.05)
20.12 (5.87)
2.24 (0.03)
Disinhibition
5.23 (2.87)
4.90 (2.97)
0.874 (0.40)
Boredom Susceptibility
3.68 (1.97)
3.06 (1.89)
2.43 (0.02)
Thrill and Adventure Seeking 7.62 (2.23)
6.61 (2.49)
3.27 (0.001)
Experience Seeking
5.36 (2.26)
5.54 (1.95)
-0.55 (0.52)

17
Qualitative Measures of Risk View of risk: 1
Ask individuals their view about risk (Unicredit survey). “How would you classify risk among the following two
alternatives ? 1. Risk is an uncertain event from which one can extract a
profit2. Risk is an uncertain event from which one should seek
protection.
Most respondents (71%) answer (2), considering risk a threat rather than an opportunity
18
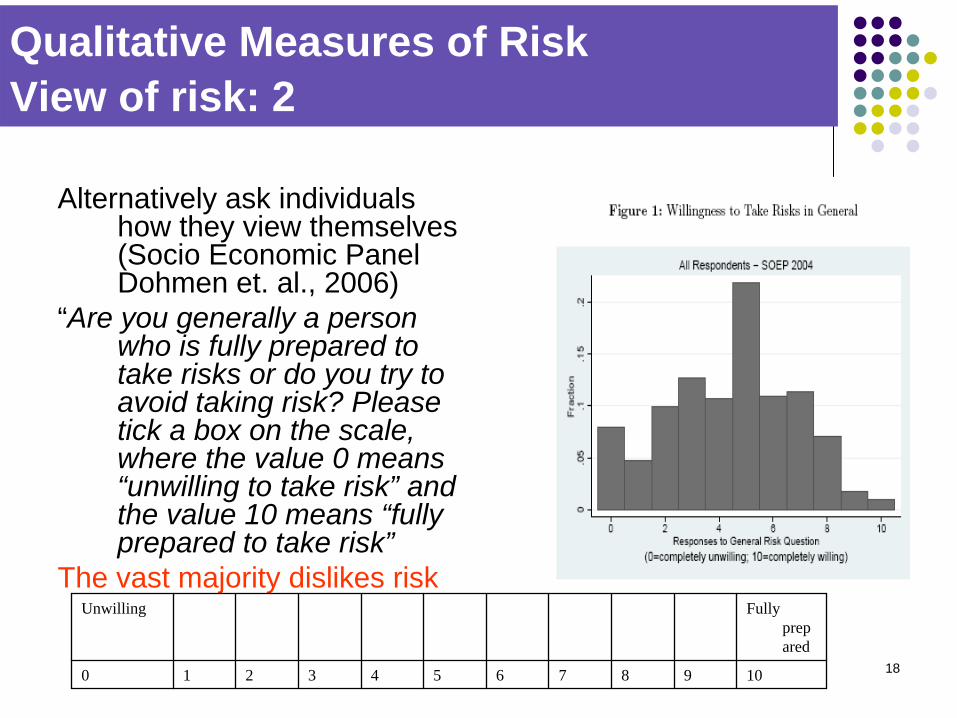
Qualitative Measures of Risk View of risk: 2
Alternatively ask individuals how they view themselves (Socio Economic Panel Dohmen et. al., 2006)
“Are you generally a person who is fully prepared to take risks or do you try to avoid taking risk? Please tick a box on the scale, where the value 0 means “unwilling to take risk” and the value 10 means “fully prepared to take risk”
The vast majority dislikes riskUnwilling Fully
prep ared
0 1 2 3 4 5 6 7 8 9 10
19
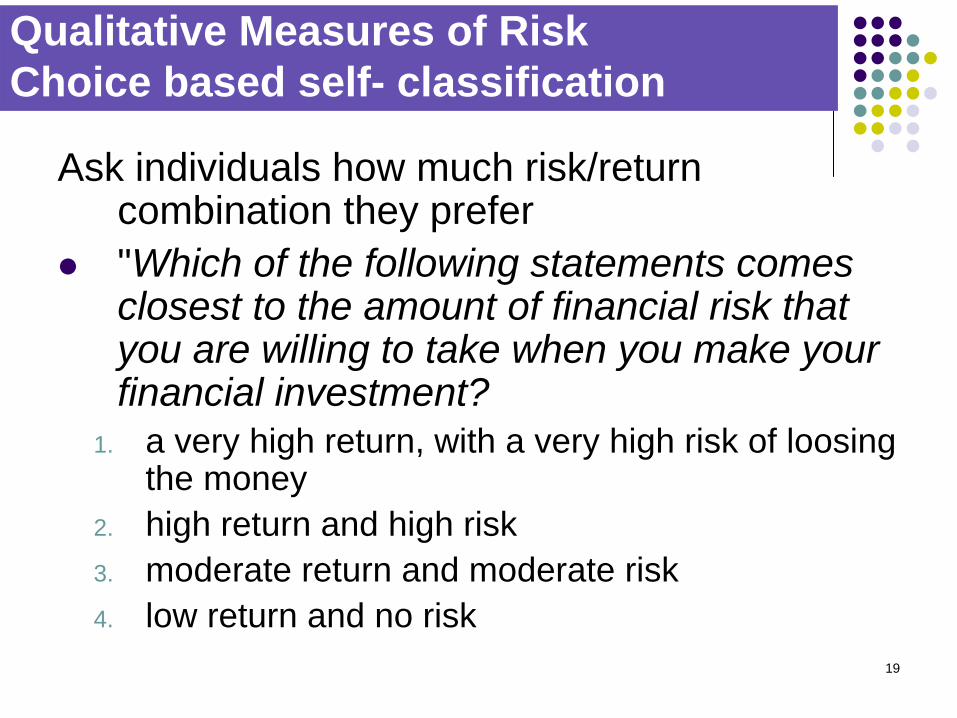
Qualitative Measures of Risk Choice based self- classification
Ask individuals how much risk/return combination they prefer
"Which of the following statements comes closest to the amount of financial risk that you are willing to take when you make your financial investment?
1. a very high return, with a very high risk of loosing the money
2. high return and high risk 3. moderate return and moderate risk4. low return and no risk
20
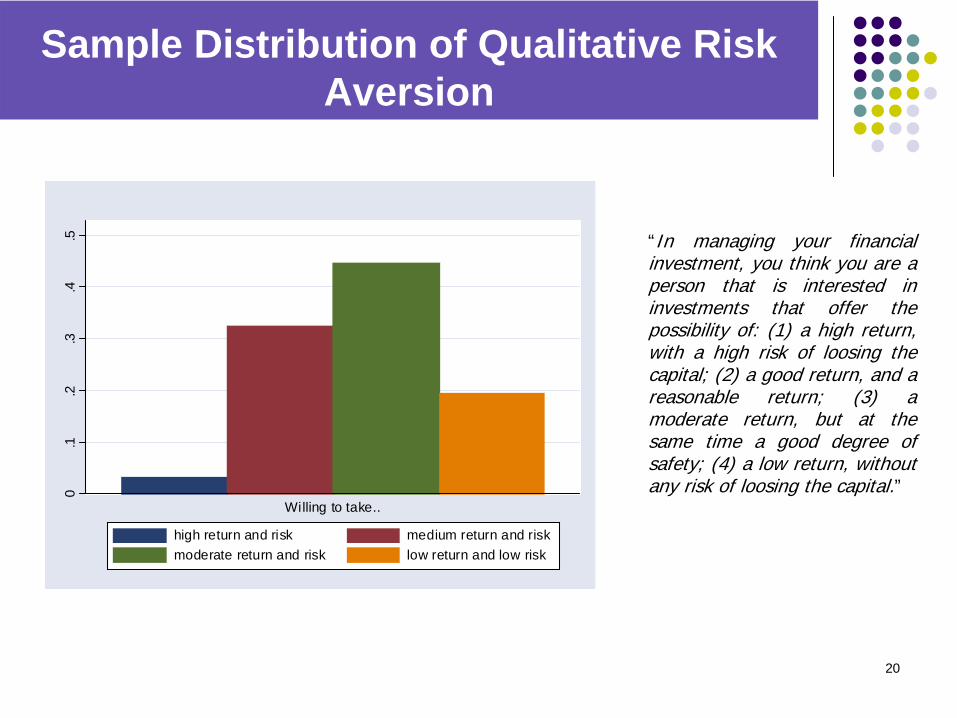
Sample Distribution of Qualitative Risk Aversion
“In managing your financial investment, you think you are a person that is interested in investments that offer the possibility of: (1) a high return, with a high risk of loosing the capital; (2) a good return, and a reasonable return; (3) a moderate return, but at the same time a good degree of safety; (4) a low return, without any risk of loosing the capital.”0
.1.2
.3.4
.5
Willing to take..
high return and risk medium return and riskmoderate return and risk low return and low risk
21
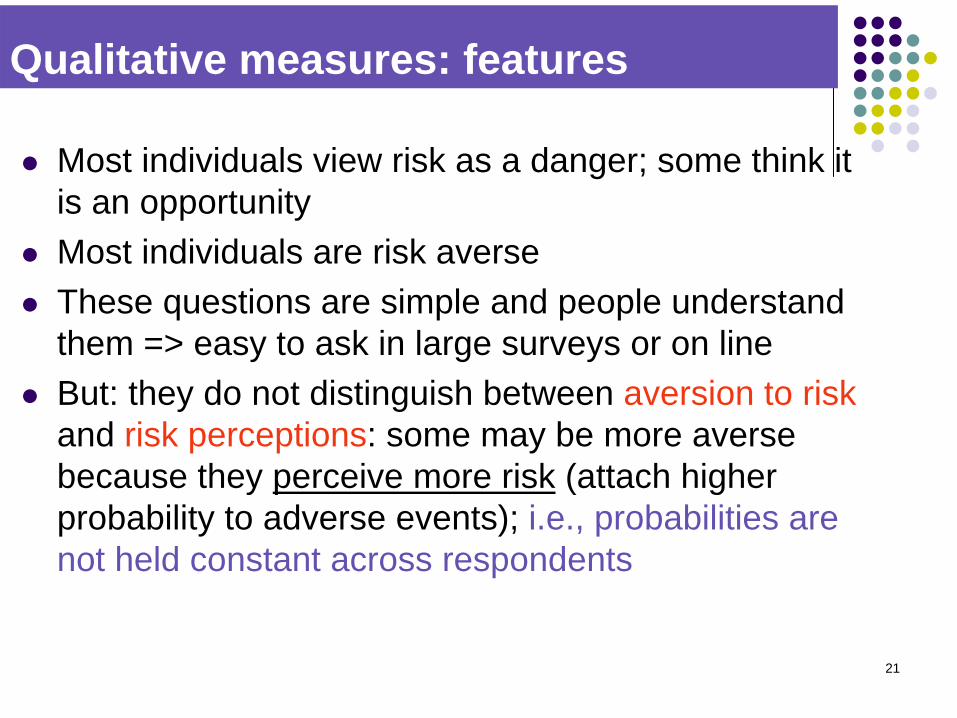
Qualitative measures: features
Most individuals view risk as a danger; some think it is an opportunity
Most individuals are risk averse
These questions are simple and people understand them => easy to ask in large surveys or on line
But: they do not distinguish between aversion to risk and risk perceptions: some may be more averse because they perceive more risk (attach higher probability to adverse events); i.e., probabilities are not held constant across respondents

22
Quantitative Measures of Risk Attitudes
Ask willingness to pay for a risky prospect. Example: A firm is selling a security that over a year yields
50000 EUR with probability 1/2
0 EUR with probability 1/2 You can buy the security. Wha
R
t is the maximum price you would be willing to pay? Let us say is . The price reveals the risk aversion of the individual:- High => low risk aversion- Low => high risk aversion Probabilities a
P
PP
re held constant, so approach identifies risk aversion

23
Problems
This approach too has its own problems 1. The question is difficult to understand => high
non responses (over 50% in the SHIW)2. People tend to understate willingness to pay=>
risk aversion may be highly overstated. 3. Why should individuals reveal their true
willingness to pay? One can set up mechanisms to induce individuals to tell the truth
24
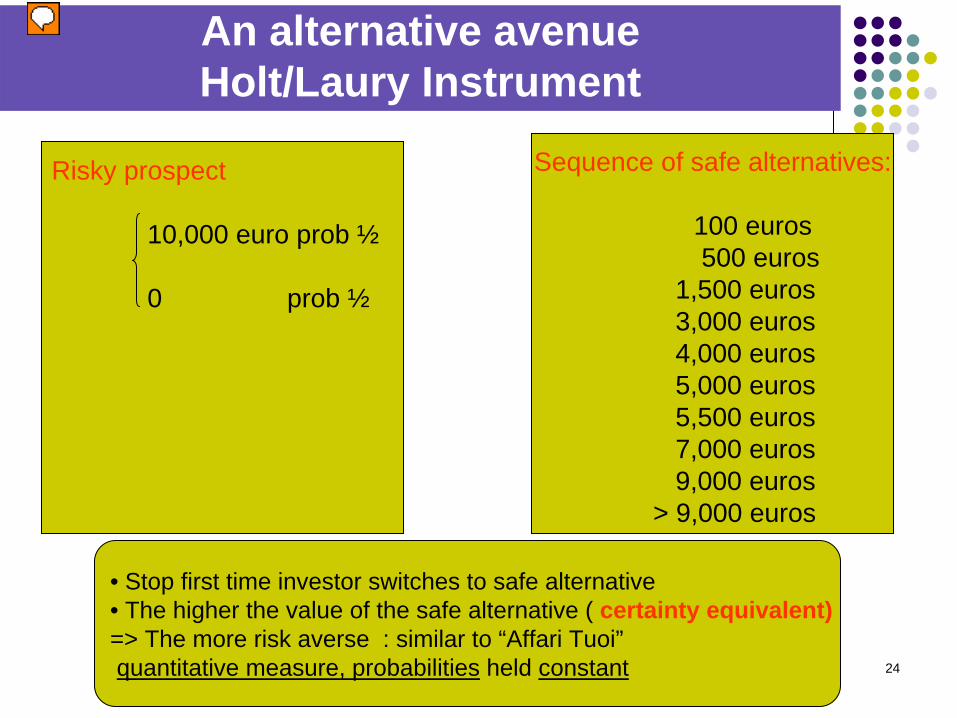
An alternative avenue Holt/Laury Instrument
Sequence of safe alternatives:
100 euros500 euros
1,500 euros3,000 euros4,000 euros5,000 euros5,500 euros7,000 euros9,000 euros
> 9,000 euros
Risky prospect
10,000 euro prob ½
0 prob ½
• Stop first time investor switches to safe alternative• The higher the value of the safe alternative ( certainty equivalent)=> The more risk averse : similar to “Affari Tuoi”quantitative measure, probabilities held constant

25
An alternative avenue: Holt/Laury (2002) Instrument
Distribution of choices in sample of Italians(risk neutral choice decisions 5,500)
0.0
5.1
.15
fract
ion
0 2 4 6 8 10risk aversion indicator : lottery 2007
1005001500300040005000550070009000>9000

26
Several ways to elicit risk aversion: can we compare them? Dohmen et. al. do this.
There is considerable heterogeneity in risk attitudes however measured
The various measures are relatively highly correlated, even when referred to different domains. Consistent with idea that the risk attitude is an individual trait
Differences across individuals are partly explained by observables
These observables have similar effects on the various measures
Measures that involve money and those based on hypothetical questions give similar answers
These measures have predictive power on behavior under risk (portfolio choice, migration, smoking etc.)
The best predictor is the general qualitative question (also easy to ask)
Which strategy is better?
27
Risk aversion and wealth
• Should the rich hold a larger share in risky assets? Should they buy more or less insurance? The answer depends on how risk aversion varies with the endowment
• Common sense, introspection, casual observation and a priori reasoning have all been used to draw conclusions on the nature of the relation
• Shared opinion: • Aversion to absolute risks (ARA) should decline with wealth. • Aversion to proportion risk , not clear, probably constant or even increasing
Evidence: • strong evidence that aversion to absolute risks declines with wealth
• good approximation that the wealthy and the poor are equally averse to proportional risks or the wealthy a bit less averse
28
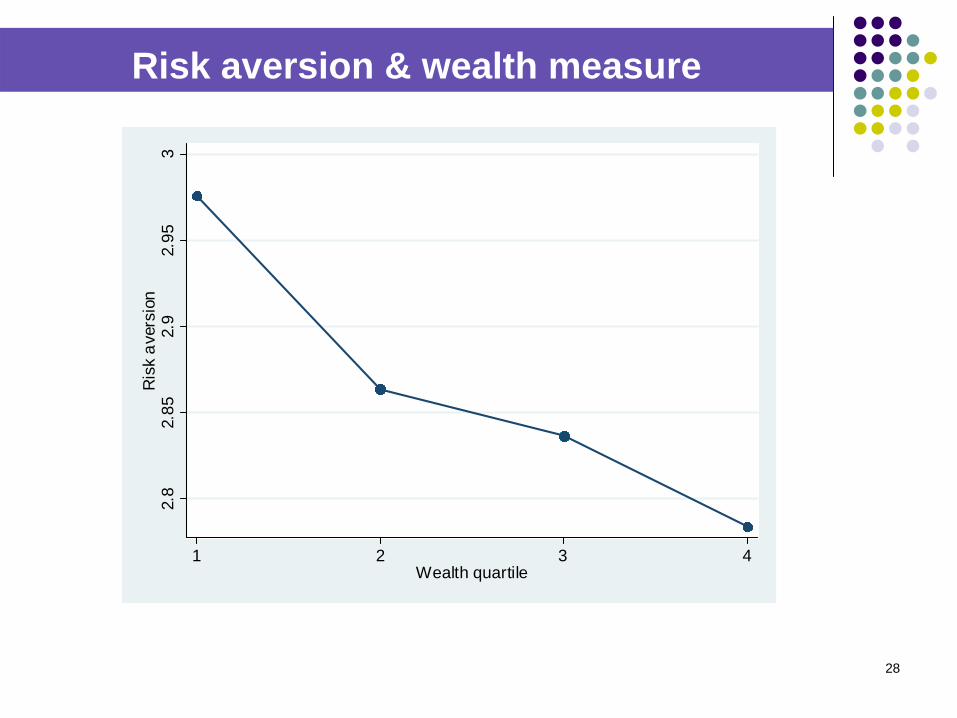
Risk aversion & wealth measure
2.8
2.85
2.9
2.95
3R
isk
aver
sion
1 2 3 4Wealth quartile

29
What determines attitudes towards risk ?
30
What determines risk aversion
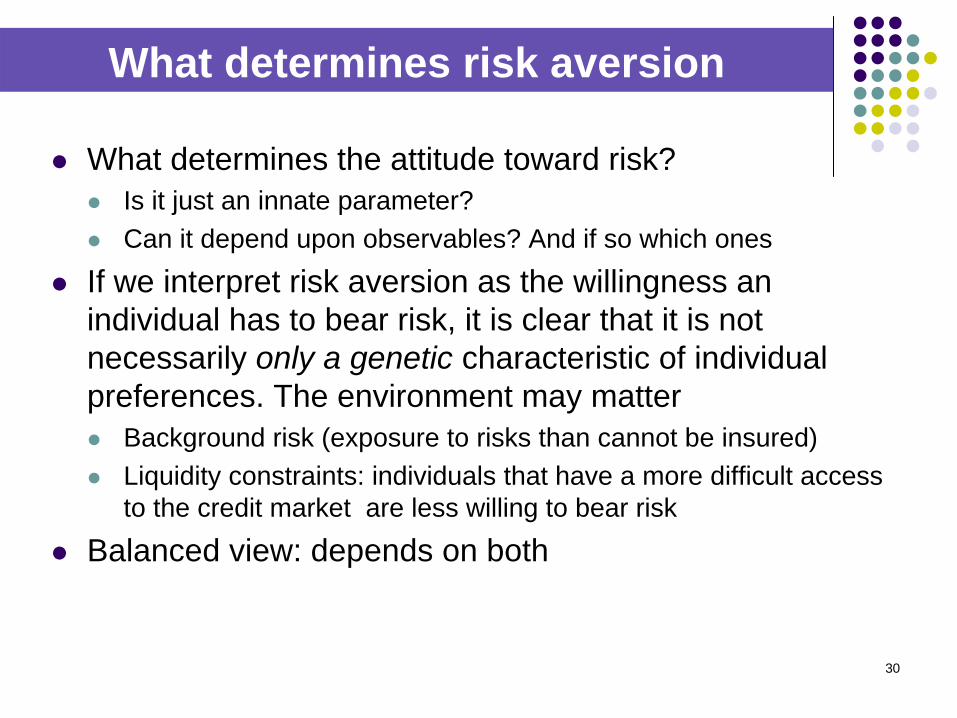
What determines the attitude toward risk?
Is it just an innate parameter?
Can it depend upon observables? And if so which ones
If we interpret risk aversion as the willingness an individual has to bear risk, it is clear that it is not necessarily only a genetic characteristic of individual preferences. The environment may matter
Background risk (exposure to risks than cannot be insured)
Liquidity constraints: individuals that have a more difficult access to the credit market are less willing to bear risk
Balanced view: depends on both

31
Which characteristics matter?
Need to be careful: preferences affect choice! Hence any variable that can be chosen can be correlated with risk attitudes, but causality may go from risk aversion to the characteristic
Pick up exogenous characteristics
Age
Sex
Features of the parents (e.g. their education)
Careful when measuring background risk or Liquidity constraints
32
A summary of evidence
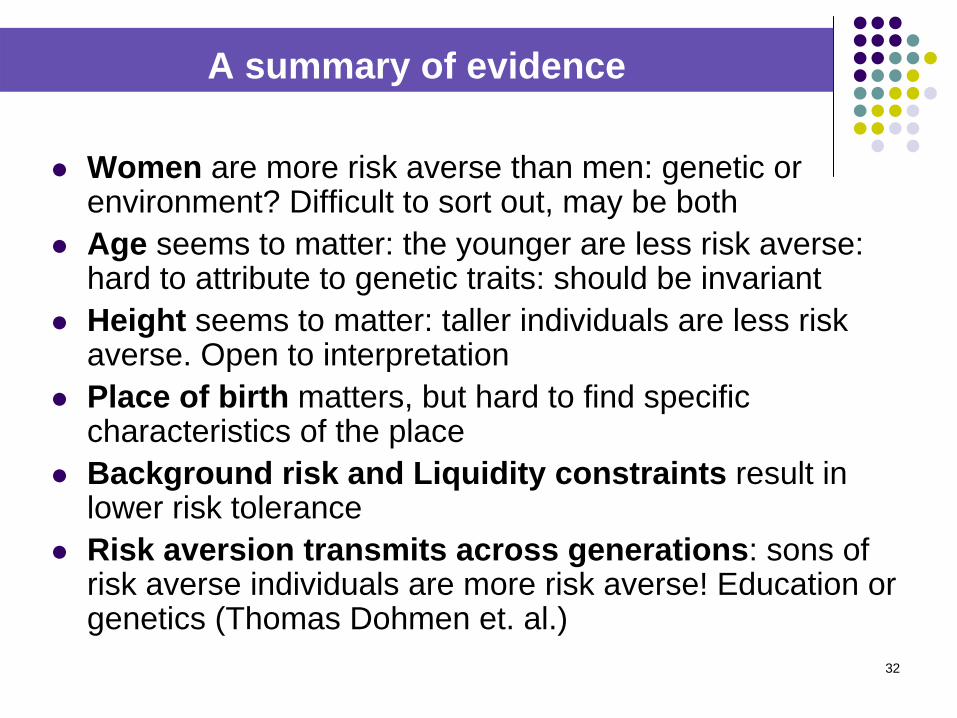
Women are more risk averse than men: genetic or environment? Difficult to sort out, may be both
Age seems to matter: the younger are less risk averse: hard to attribute to genetic traits: should be invariant
Height seems to matter: taller individuals are less risk averse. Open to interpretation
Place of birth matters, but hard to find specific characteristics of the place
Background risk and Liquidity constraints result in lower risk tolerance
Risk aversion transmits across generations: sons of risk averse individuals are more risk averse! Education or genetics (Thomas Dohmen et. al.)

33
Does risk aversion vary over time and across states?
34
Time varying risk aversion ?
Do preferences for risk evolve over time? Or rather is risk version a fixed attribute?
Important to understand varying patterns of demand insurance and portfolio allocations
Important to understand why assets prices vary so much over the cycle.

35
If RA Changes What Explains it?
Changes in wealth ?
Changes in habits?
Changes in preferences (curvature)?
Changes in background risk?
Irrational fear?
At the center of the debate on rationality of markets
Use data on RA from a panel of Italian investors interviewed before and after the crisis

36
Did Risk Aversion Change? Qualitative indicator
.018
.2718
.5511
.1592
0.2
.4.6
prop
ortio
n
0 1 2 3 4risk aversion
.0135
.1231
.4369.4264
0.1
.2.3
.4pr
opor
tion
0 1 2 3 4risk aversion
2007: before crisis 2009: after crisis
No risk
Norisk
High RET & High RIS
i
Medium RET& RIS
Moderate RET &RIS
37
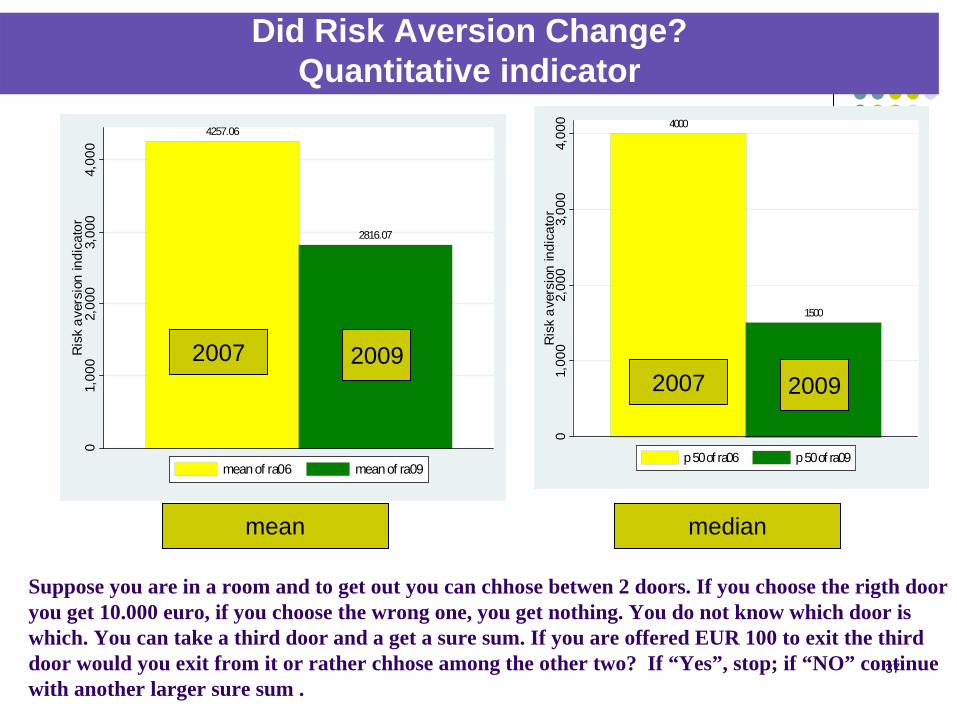
Did Risk Aversion Change? Quantitative indicator
4257.06
2816.07
01,
000
2,00
03,
000
4,00
0R
isk
aver
sion
indi
cato
r
mean of ra06 mean of ra09
4000
1500
01,
000
2,00
03,
000
4,00
0R
isk
aver
sion
indi
cato
r
p 50 of ra06 p 50 of ra09
mean median
2007 200920092007
Suppose you are in a room and to get out you can chhose betwen 2 doors. If you choose the rigth door you get 10.000 euro, if you choose the wrong one, you get nothing. You do not know which door is which. You can take a third door and a get a sure sum. If you are offered EUR 100 to exit the third door would you exit from it or rather chhose among the other two? If “Yes”, stop; if “NO” continue with another larger sure sum .
38
Why did it change?
Substantial increase in risk aversion after the crisis but puzzling why. Its increase is:
Not due to drop in wealth
Not due to change in habits
Not due to increase in background risk not to worsened expectations about the stock market
Can we say that it was driven by irrational panic?
Difficult to tell without an experiment

39
The Experiment
To test whether fear can induce an increase in RA similar to the one observed after the 2008 crisis, we conducted a laboratory experiment with 200 students at Northwestern.
Treat half of participants with an excerpt from the 2005 movie, “The Hostel” (2007 best horror movie)
Face all with the same risk choice questions as in sample of investors

40

41
Results
Consistent with recent studies showing the neurological bases of risk aversion (De Martino et al. (2010); Kuhnen and Knutson (2005))
Sure sum to give up lottery
2415
1778
0
500
1000
1500
2000
2500
3000
non treated treated with movie
Sur
e su
m
Probability of choosing low risk investments
0,39
0,52
0
0,1
0,2
0,3
0,4
0,5
0,6
non treated treated with moviePr
obab
ility
of l
ow ri
sk in
vest
men
t
42
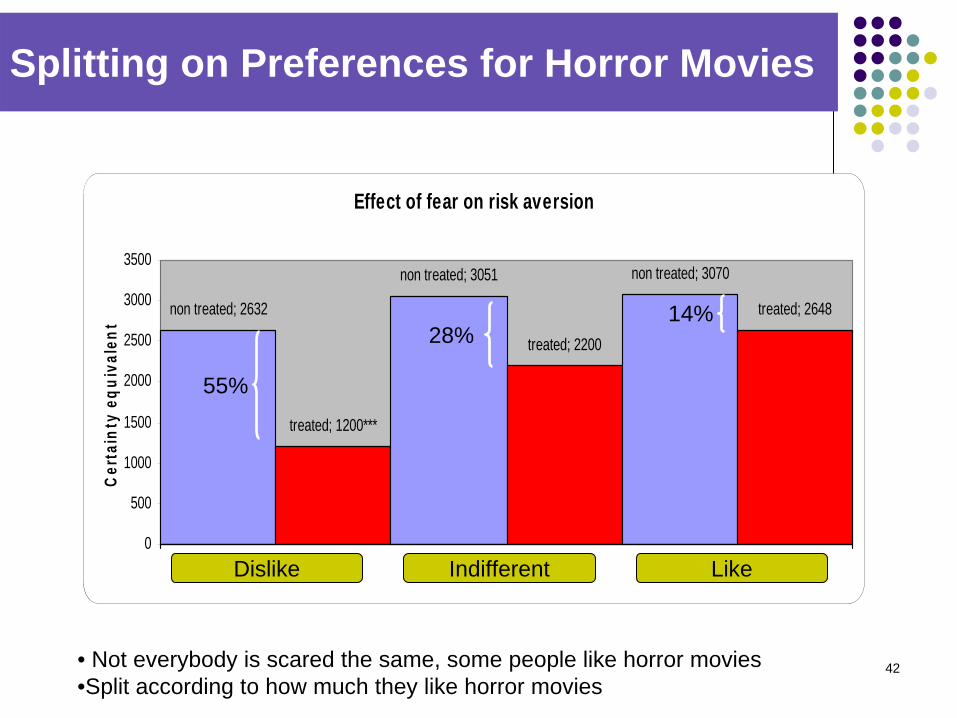
Splitting on Preferences for Horror Movies
• Not everybody is scared the same, some people like horror movies•Split according to how much they like horror movies
Effect of fear on risk aversion
non treated; 2632
non treated; 3051
treated; 2200
non treated; 3070
treated; 2648
treated; 1200***
0
500
1000
1500
2000
2500
3000
3500
1
Cer
tain
ty e
quiv
alen
t
Dislike Indifferent Like
55%
28%14%
43
The Biology of Fear
Kuhnen and Knutson (Neuron, 2005)more activation in the anterior insula is followed by increased risk aversion (subjects less likely to invest in risky assets)
Kuhnen and Knutson (JFQA, forthcoming) when subjects saw visual cues inducing anxiety
(meant to increase activation in the anterior insula),they subsequently were more risk averse (less likely to invest in risky assets).

44
Does risk aversion varies over high-frequency states?
Focus on the weather
Variation in light exposure seems to alter people mood
Does it alter also predisposition to take risk?
Experiment with sample of students eliciting risk aversion under varying whether conditions suggests it does!
45
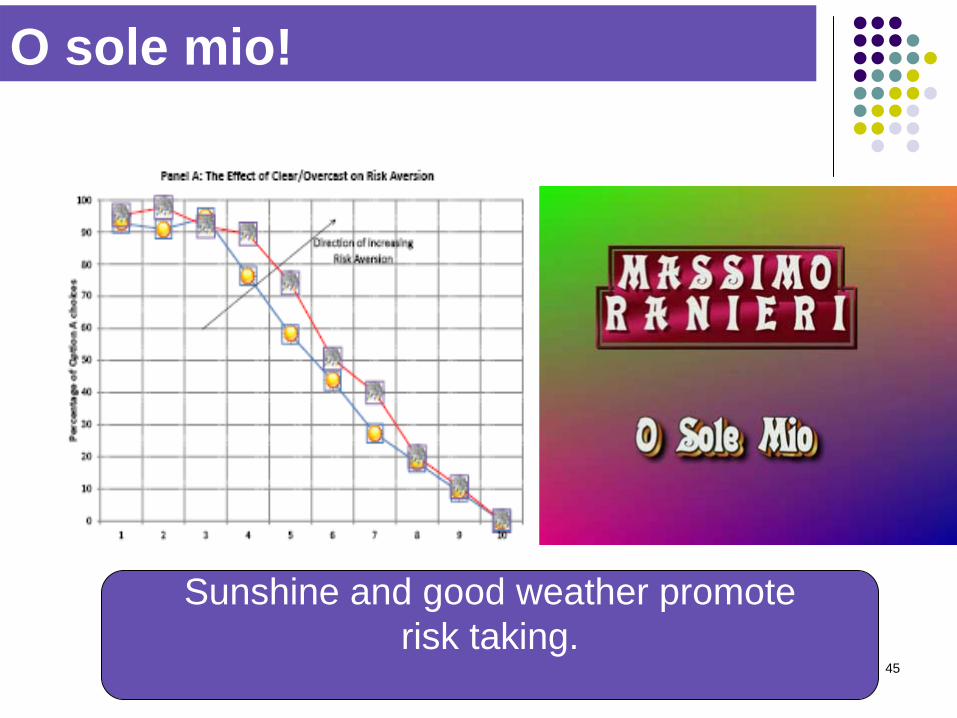
O sole mio!
Sunshine and good weather promoterisk taking.

46
But how large is it?
0,45
0,76
-0,05
0,05
0,15
0,25
0,35
0,45
0,55
0,65
0,75
0,85
1
Whether condition
Ris
k av
ersi
on
Good Bad
70%
Sizeable effect: If in sunny day individual invests 50% ofWealth in risky assets he would invest 29% in rainy days

47
What is still missing?
An experiment in the field with true customers at insurance companies
Does insurance take up increases if policies are offered in rainy days?
Let us try find an answer !
48
Summing up
Eliciting risk aversion is hard
Attempts made are encouraging
Results thus far suggest that available measures are good at sorting individuals on the basis of their willingness to bear risk; harder to measure “the” degree of risk aversion
A parallel line of research attempts at eliciting probability distribution of future events
Systematic information on individual beliefs about risks and their risk tolerance are indispensable to monitor individual financial needs


![ERIE IEF s EIEF WORKING PAPER s (EIEF) · 2019. 5. 14. · Notes: Annual data for Argentina, 1995-2017. ... [11], Schmitt-Grohe and Uribe [12], and others, one approach is to model](https://img.pdfslide.us/doc/110x75/60a8e1d235aa551cb40d7352/erie-ief-s-eief-working-paper-s-eief-2019-5-14-notes-annual-data-for-argentina.jpg)