Embed Size (px)
Citation preview
Coagulation of submicron colloidsby supramicron silica particles
Item Type Thesis-Reproduction (electronic); text
Authors Kebler, David George,1960-
Publisher The University of Arizona.
Rights Copyright © is held by the author. Digital access to this materialis made possible by the University Libraries, University of Arizona.Further transmission, reproduction or presentation (such aspublic display or performance) of protected items is prohibitedexcept with permission of the author.
Download date 14/08/2018 06:20:30
Link to Item http://hdl.handle.net/10150/191969
COAGULATION OF SUBMICRON COLLOIDS BY
SUPRAMICRON SILICA PARTICLES
by
David George Kebler
A Thesis Submitted to the Faculty of the
DEPARTMENT OF HYDROLOGY AND WATER RESOURCES
In Partial Fulfillment of the RequirementsFor the Degree of
MASTER OF SCIENCEWITH A MAJOR IN HYDROLOGY
In the Graduate College
THE UNIVERSITY OF ARIZONA
1
1988
STATEMENT BY AUTHOR
This thesis has been submitted in partialfulfillment of requirements for an advanced degree at theUniversity of Arizona and is deposited in the UniversityLibrary to be made available to borrowers under rules ofthe Library.
Brief quotations from this thesis are allowablewithout special permission, provided that accurateacknowledgment of source is made. Requests for permissionfor extended quotation from or reproduction of thismanuscript in whole or in part may be granted by the headof the major department or the Dean of the Graduate when inhis or her judgement the proposed use of the material is inthe interests of scholarship. In all other instances,however, permission must be obtained from the author.
SIGNED: #A247;10(.i44062.4p2-
APPROVAL BY THESIS DIRECTOR
This thesis has been approved on the date shown below:
/'5 7 9/ gg
Roger C. Bales DateProfessor of Hydrology
2

ACKNOWLEDGEMENTS
The author would like to thank both Dr. Gary L. Amy
and Dr. Roger C. Bales for their input and guidance
concerning my research. In particular, I want to thank Dr.
Bales for initially recognizing my abilities, and finally,
sending me off to the mountains of Wyoming to work.
I am indebted to Zaid Chowdhury for his assistance and
input, and also to Jim Scezcody for running BET samples for
me.
Finally, I want to give my thanks and love to Kathy
who motivated me to finally complete writing this thesis by
relentlessly standing over me with a large ruler.
Financial support for this research was provided by
the U.S. Environmental Protection Agency grant R-812325-
01-0. The contents of this thesis do not necessarily
reflect the views and opinions of the USEPA.
3
TABLE OF CONTENTSPage
LIST OF ILLUSTRATIONS ........ .......... ...... ..... ...6
LIST OF TABLES....... ......... 60 "See" 00604/00"D C8
ABSTRACT 9
INTRODUCTION 10
BACKGROUND 13
Coagulation Model............. ....... ......... 13Surface Chemical Model ............... 0 ....... 19
MATERIALS AND METHODS 23Particles 23
Silica ..... ............ ........ ..... ...... 23Aluminum (Hydr)oxide Colloids ......... 24
Coagulation Experiments Apparatus 28Analytical Techniques 29Procedures 29
Mobility Experiments 32Apparatus 33Procedures 33
Surface Titrations ............ ...... 35
RESULTS..... ....... 000000000 ............... 0 ....... 000037
Blank Experiments............. ....... ........... 37Coagulation Experiments.... ........ 39........ 39Mobility Experiments ...... ......... ....... ...... 44
Bicarbonate 44Silica ......... ......... 44Dissolved Al (III) 48
Enhanced Coagulation Experiment 48Titration Experiments 48
DISCUSSION 59
CONCLUSIONS AND RECOMMENDATIONS ....... ..... ...........64
4
TABLE OF CONTENTS-Continued
APPENDIX ACOAGULATION EXPERIMENTS..... ..... ................66
CoagulationPreliminary Fluid Shear Calculation.........73
APPENDIX BMOBILITY EXPERIMENTS. ..... .......................74
Mobility Data. ...... 0 OOOOOOOOO 00000000.6006. 075
pH Stat Computer Program...... ............76
APPENDIX CTITRATION EXPERIMENTS...................... ..... .84
Titration Data..............................85BET Adsorption OOOOOO .0000000000000000060000088SURFEQL FileS00.6000.00.0000060 OOOOO 4000006089Model Curves OOOOO 0600.000000 OOOOOOOOOO .0.06693
REFERENCES CITEDsoeomosolipeoecooeec0000loyoeose.omegoeeo.96
5
LIST OF ILLUSTRATIONS
figure page
1 SEM photo of a typical aluminum (hydr)oxide 26colloid suspension
2 Mobility of aluminum (hydr)oxide colloids from 27three different preparations.
3 Apparatus of mobility and titration expts. 44
4 SEM photo of self-coagulation of colloids 40in doublets and triplets
5 Results of Coagulation Experiments 1 and 4. 42
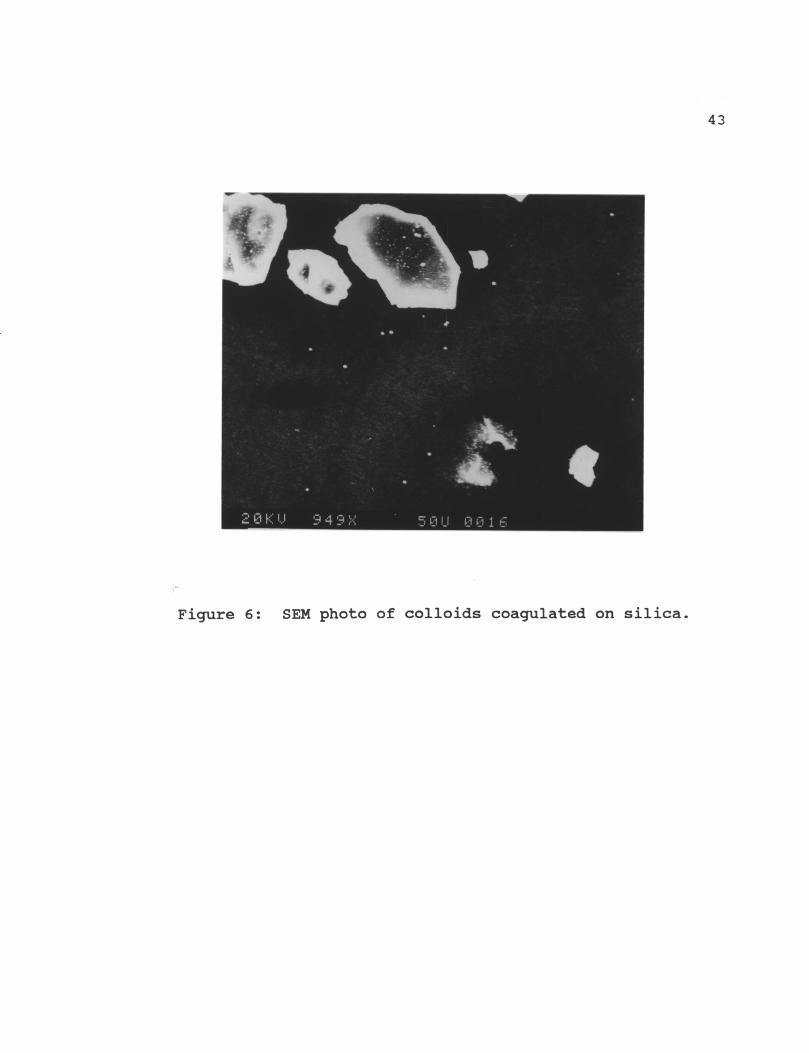
6 SEM photo of colloids coagulated on silica 43
7 Mobility of aluminum (hydr)oxide colloids with 45bicarbonate.
8 Mobility of aluminum (hydr)oxide colloids with 46silica present.
9 Mobility of aluminum (hydr)oxide colloids with 47dissolved silica present
10 Mobility of aluminum (hydr)oxide colloids with 49silica particles (8 x 10 8 L-1 ) and aluminumpresent.
11 Stirred beaker results for experiments 3 and 6. 50
12 Titration of water and 10 -3 M dissolved silica. 52
13 Titration of a-alumina. 53
14 Titration of a-alumina w/10 -5 M Si. 54
15 Titration of a-alumina w/10 -4 M Si. 55
16 Titration of a-alumina w/10 -3 M Si. 56
17 Titration of a-alumina w/10 -3 M Si. 58with adsorption of Si
6
"7
LIST OF ILLUSTRATIONS-Continued
figure page
C-1 Model runs w/variable surface area for Al 2 0 3 93
C-2 Model runs w/variable pK's for Al20 3 94
C-3 Model runs w/variable pK's for ligand exch. 95
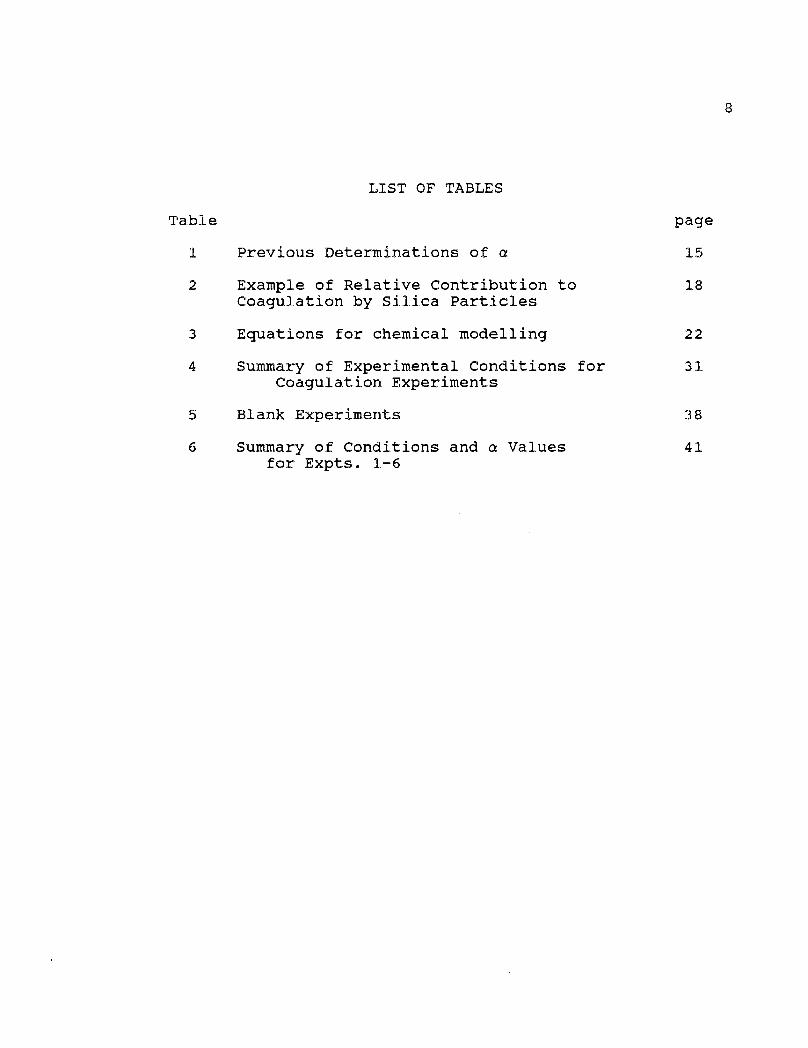
LIST OF TABLES
Table page
1 Previous Determinations of a 15
2 Example of Relative Contribution to 18Coagulation by Silica Particles
3 Equations for chemical modelling 22
4 Summary of Experimental Conditions for 31Coagulation Experiments
5 Blank Experiments 38
6 Summary of Conditions and a Values 41for Expts. 1-6
8
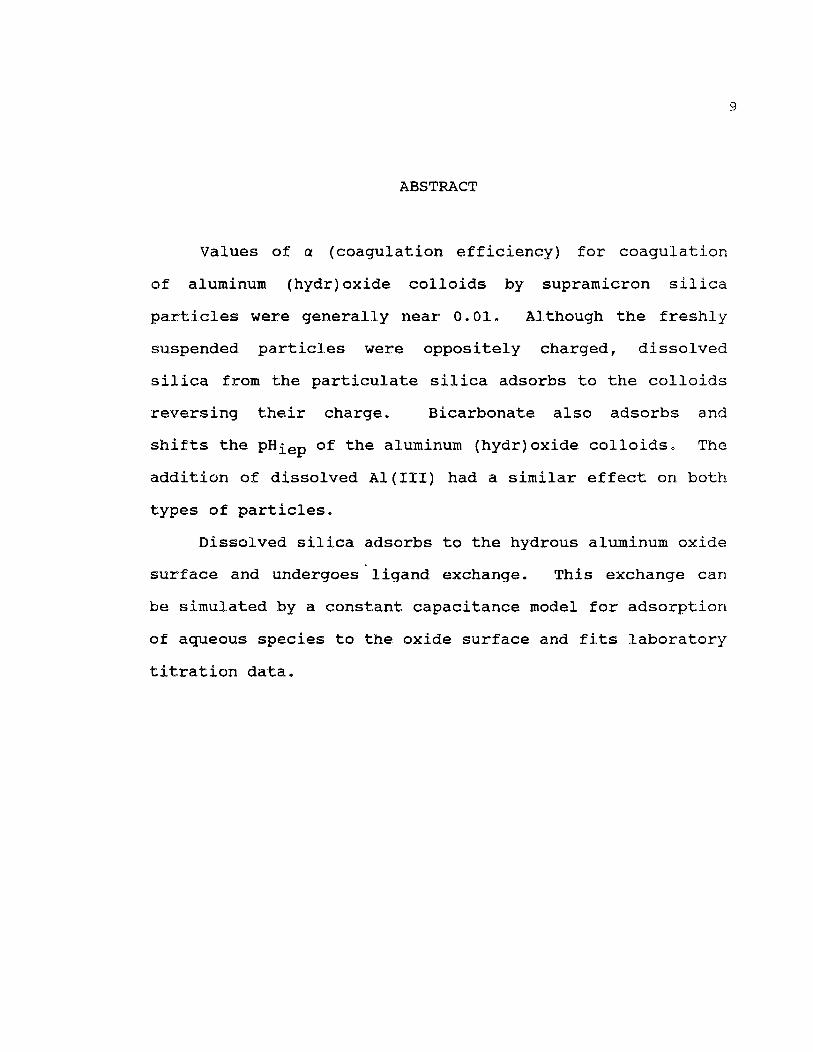
ABSTRACT
Values of a (coagulation efficiency) for coagulation
of aluminum (hydr)oxide colloids by supramicron silica
particles were generally near 0.01. Although the freshly
suspended particles were oppositely charged, dissolved
silica from the particulate silica adsorbs to the colloids
reversing their charge. Bicarbonate also adsorbs and
shifts the pHiep of the aluminum (hydr)oxide colloids. The
addition of dissolved Al(III) had a similar effect on both
types of particles.
Dissolved silica adsorbs to the hydrous aluminum oxide
surface and undergoes ligand exchange. This exchange can
be simulated by a constant capacitance model for adsorption
of aqueous species to the oxide surface and fits laboratory
titration data.
9
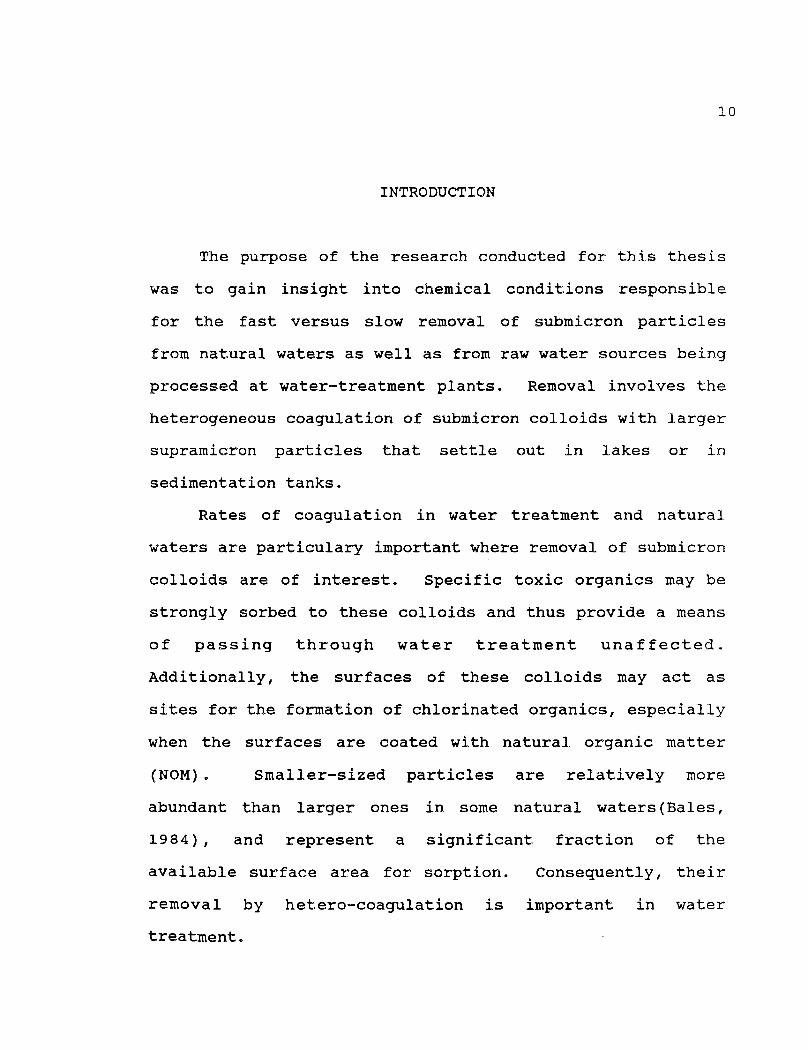
INTRODUCTION
The purpose of the research conducted for this thesis
was to gain insight into chemical conditions responsible
for the fast versus slow removal of submicron particles
from natural waters as well as from raw water sources being
processed at water-treatment plants. Removal involves the
heterogeneous coagulation of submicron colloids with larger
supramicron particles that settle out in lakes or in
sedimentation tanks.
Rates of coagulation in water treatment and natural
waters are particulary important where removal of submicron
colloids are of interest. Specific toxic organics may be
strongly sorbed to these colloids and thus provide a means
of passing through water treatment unaffected.
Additionally, the surfaces of these colloids may act as
sites for the formation of chlorinated organics, especially
when the surfaces are coated with natural organic matter
(NOM). Smaller-sized particles are relatively more
abundant than larger ones in some natural waters(Bales,
1984), and represent a significant fraction of the
available surface area for sorption. Consequently, their
removal by hetero-coagulation is important in water
treatment.
1 0
11
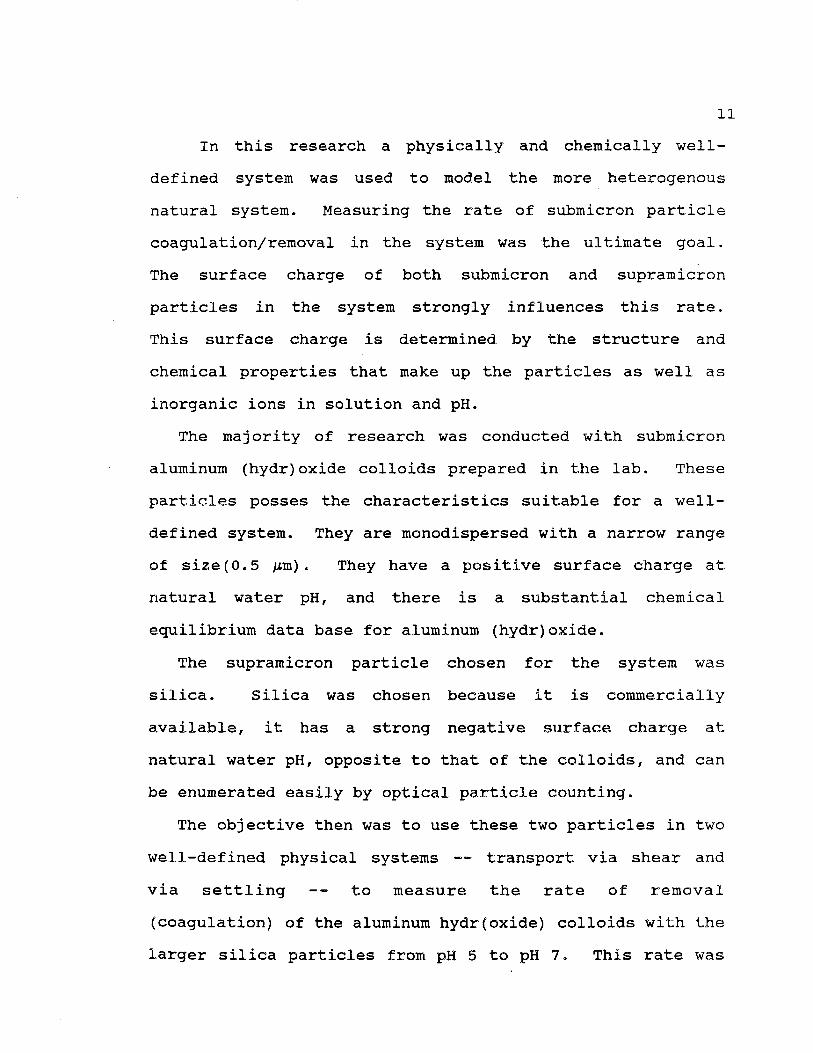
In this research a physically and chemically well-
defined system was used to model the more heterogenous
natural system. Measuring the rate of submicron particle
coagulation/removal in the system was the ultimate goal.
The surface charge of both submicron and supramicron
particles in the system strongly influences this rate.
This surface charge is determined by the structure and
chemical properties that make up the particles as well as
inorganic ions in solution and pH.
The majority of research was conducted with submicron
aluminum (hydr)oxide colloids prepared in the lab. These
particles posses the characteristics suitable for a well-
defined system. They are monodispersed with a narrow range
of size(0.5 Am). They have a positive surface charge at
natural water pH, and there is a substantial chemical
equilibrium data base for aluminum (hydr)oxide.
The supramicron particle chosen for the system was
silica. Silica was chosen because it is commercially
available, it has a strong negative surface charge at
natural water pH, opposite to that of the colloids, and can
be enumerated easily by optical particle counting.
The objective then was to use these two particles in two
well-defined physical systems -- transport via shear and
via settling -- to measure the rate of removal
(coagulation) of the aluminum hydr(oxide) colloids with the
larger silica particles from pH 5 to pH 7. This rate was
12
predicted to be quite high based on the favorable
electrostatic conditions. That is, the coagulation
efficiency or fraction of particle-particle collisions that
result in sticking should be near one. Secondly, the
effect of selected ions on the surface charge of the
colloids, and hence the coagulation efficiency was
investigated as the result of observations made in the
initial experiments. Finally, the surface charge
properties of the colloids were investigated with the aid
of a computer chemical equilibrium model. The model
results were used to interpret results of the experiments
and to further understanding of the surface charge
properties(i.e coagulation rate) in order to give better
predictions of coagulation in natural waters.
BACKGROUND
Coagulation Model
Several current models exist for coagulation. For
slow coagulation, each of these models separates this
process into two steps. One is purely physical
step(particle transport) and the other is a combination of
physical and chemical steps(adhesion).
Model calculations suggest that submicron particles
should be largely removed from lakes due to coagulation
(0'Melia, 1985), provided that the coagulation efficiency
(i.e. a, fraction of particle-particle contacts that result
in sticking) is similar to that measured for larger
particles.
The deterministic model used in this research follows
that by O'Melia(1980). It makes use of an empirical
coagulation efficiency factor(a) which describes the
second, physio-chemical, step of the model. This sticking
or coagulation efficiency is the reciprocal of the
theoretical Fuch's stability ratio W.
The sticking factor or coagulation efficiency is
defined as follows:
Rate of particle attachmenta - (1)
Rate of particle collisions
1:3
14
This factor is dependent on the physio-chemical processes
present which determine the attachment rate. An a of one
indicates a fully destabilized particle(i.e. each collision
results in coagulation).
Initial calculations by Stumm and Ell(1971) suggest a
is in the range of 10-6 in fresh waters. Stumm(1977)
suggests a to be Ps 0.1-1.0 in seawater. Most laboratory
and field data indicate a ranges from 0.007 (Ali et al.,
1984) to 0.8 (Gibbs, 1983) for fresh water. Table 1
presents values of a from several sources, most of which
are for supramicron sized particles. An estimated value
for a for chrysotile-asbestos fibers in four southern
California reservoirs is near 0.001 (Bales et al., 1984).
In the coagulation experiments conducted the
disappearance of only one class of particles was of
interest, the disappearance aluminum hydr(oxide) submicron
colloids. The supramicron particle concentrations were
assumed to be constant, and the colloids were assumed only
to coagulate with the supramicron particles. Both these
assumptions were verified. The resulting pseudo-first
order differential equation used to calculate a (adapted
from O'Melia, 1980) gives the rate of disappearance of the
submicron colloids with time(-dni/dt,
(2)
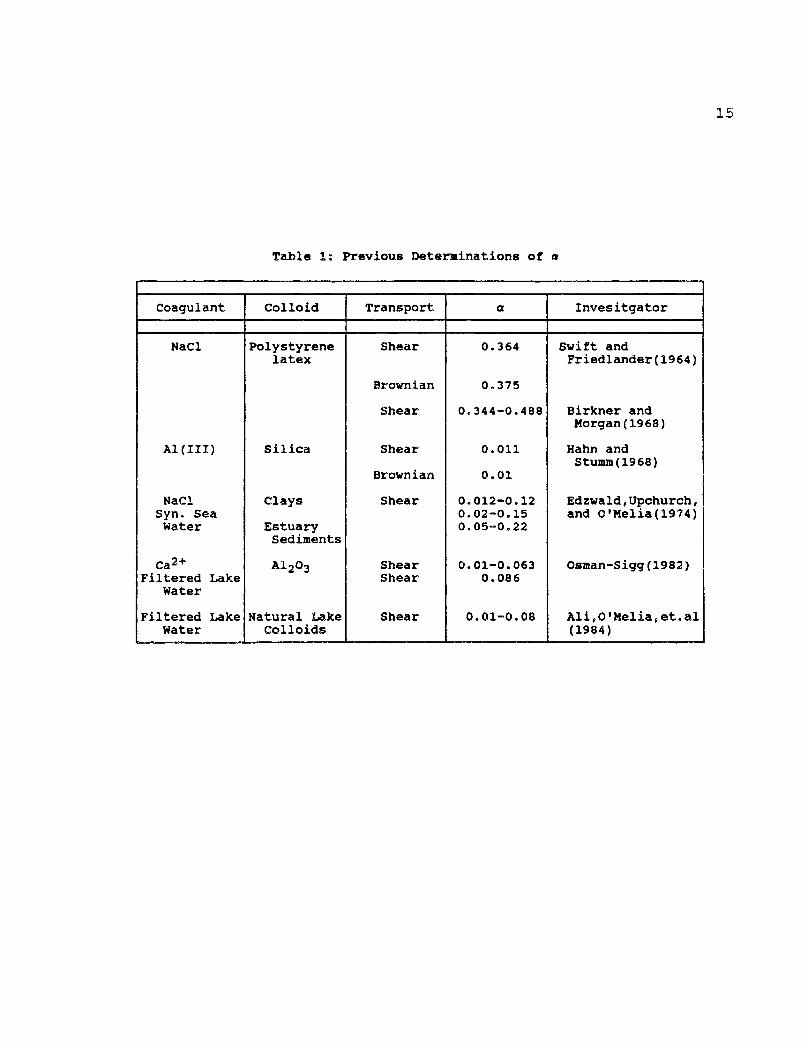
Table 1: Previous Determinations of a
Coagulant Colloid Transport a Invesitgator
NaC1 Polystyrenelatex
Shear 0.364 Swift andFriedlander(1964)
Brownian 0.375
Shear 0.344-0.488 Birkner andMorgan(1968)
Al(III) Silica Shear 0.011 Hahn andStumm(1968)
Brownian 0.01
NaC1 Clays Shear 0.012-0.12 Edzwald,Upchurch,Syn. Sea 0.02-0.15 and O'Melia(1974)Water Estuary 0.05-0.22
Sediments
Ca2+ Al203 Shear 0.01-0.063 Osman-Sigg(1982)Filtered Lake Shear 0.086
Water
Filtered Lake Natural Lake Shear 0.01-0.08 Ali3O1Melia,et.alWater Colloids (1984)
15
16
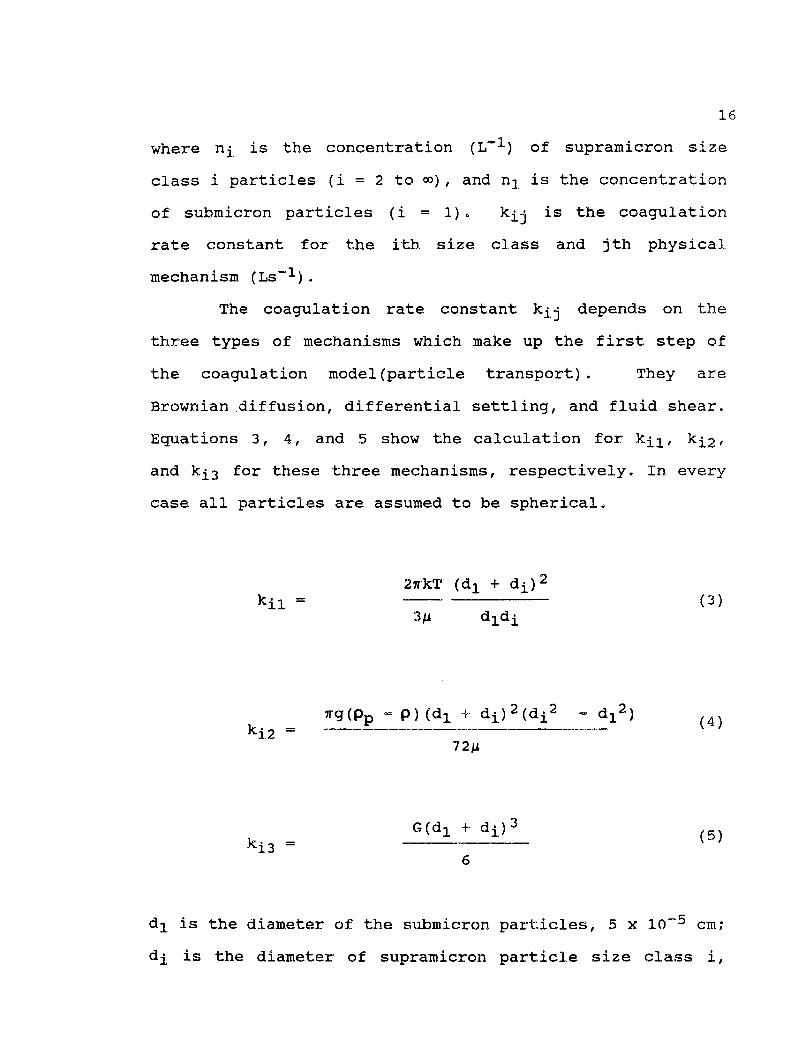
where ni is the concentration (L-1) of supramicron size
class i particles (i = 2 to w), and nl is the concentration
of submicron particles (i = 1). kij is the coagulation
rate constant for the ith size class and jth physical
mechanism (Ls -1 ).
The coagulation rate constant kij depends on the
three types of mechanisms which make up the first step of
the coagulation model(particle transport). They are
Brownian diffusion, differential settling, and fluid shear.
Equations 3, 4, and 5 show the calculation for kil, k1 2,
and ki3 for these three mechanisms, respectively. In every
case all particles are assumed to be spherical.
2rkT (d1 + di) 2kil = (3)
3g didi
ki2 =7g(pp p)(d -4- d1) 2 (d1 2 d1 2) (4)
72g
ki3 -7=
G(di + d 1 ) 3( 5 )
6
d1 is the diameter of the submicron particles, 5 X 10 -5 cm;
di is the diameter of supramicron particle size class i,
17
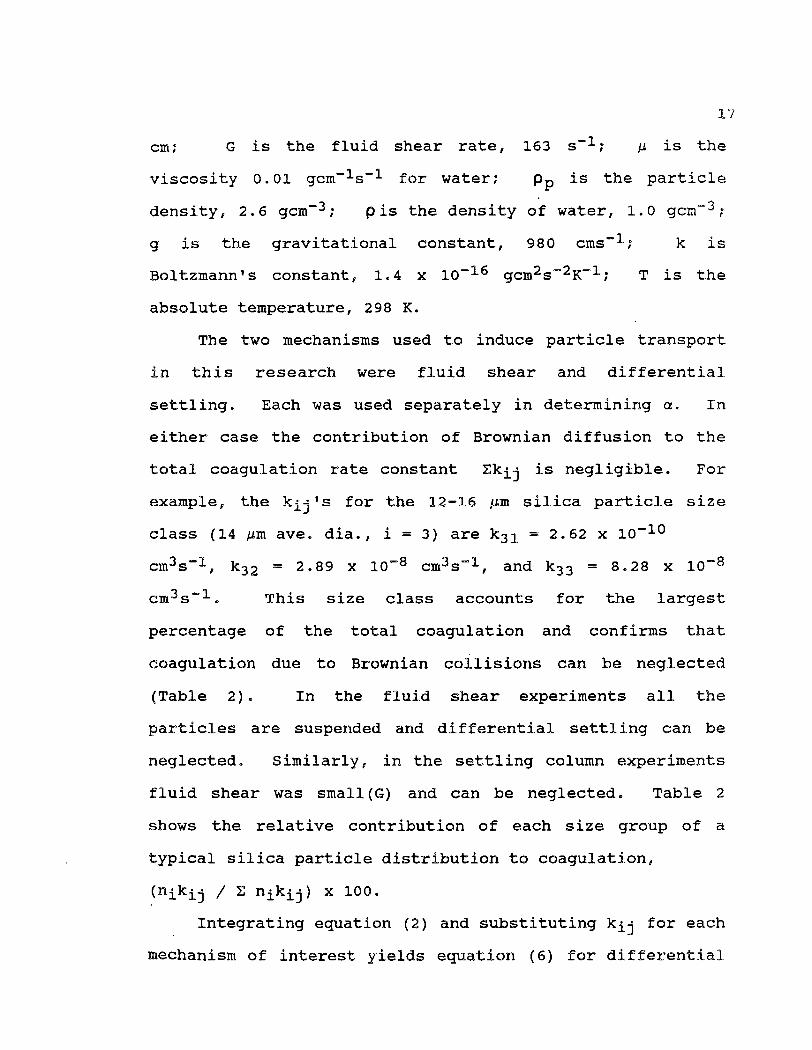
cm; G is the fluid shear rate, 163 s-1 ; g is the
viscosity 0.01 gcm- ls-1 for water;
Pp is the particle
density, 2.6 gcm-3 ; pis the density of water, 1.0 gcm-3 ;
g is the gravitational constant, 980 cms -1 ; k is
Boltzmann's constant, 1.4 x 10 -16 gcm2 s-2K-1 ; T is the
absolute temperature, 298 K.
The two mechanisms used to induce particle transport
in this research were fluid shear and differential
settling. Each was used separately in determining a. In
either case the contribution of Brownian diffusion to the
total coagulation rate constant Ekij is negligible. For
example, the k's for the 12-16 gm silica particle size
class (14 gm ave. dia., i = 3) are k31 = 2.62 x 10⁻¹⁰
cm3 s-1 , k32 = 2.89 x 10 -8 cm3 s-1 , and k33 = 8.28 x 10 -8
3 -cm s 1 This size class accounts for the largest
percentage of the total coagulation and confirms that
coagulation due to Brownian collisions can be neglected
(Table 2). In the fluid shear experiments all the
particles are suspended and differential settling can be
neglected. Similarly, in the settling column experiments
fluid shear was small(G) and can be neglected. Table 2
shows the relative contribution of each size group of a
typical silica particle distribution to coagulation,
(nikij / E nikij) x 100.
Integrating equation (2) and substituting kij for each
mechanism of interest yields equation (6) for differential
18
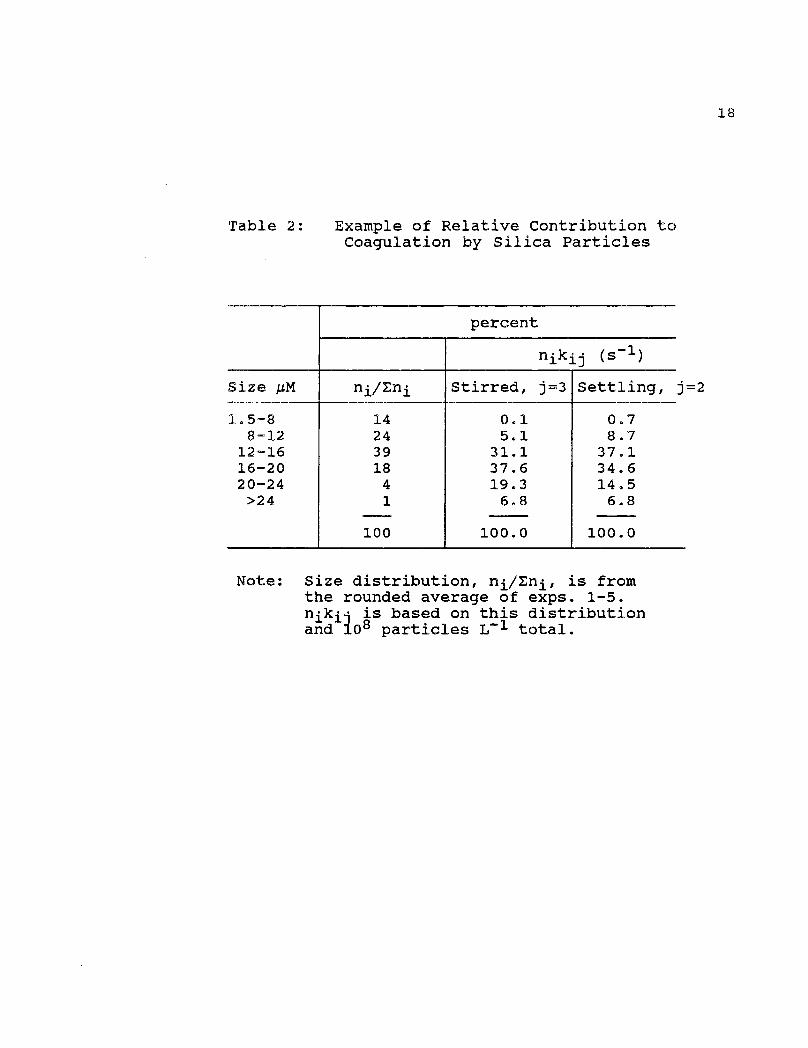
Table 2: Example of Relative Contribution toCoagulation by Silica Particles
percent
nik • (s-1)
Size AM ni/Eni Stirred, j=3 Settling, j=2
1.5-8 14 0.1 0.78-12 24 5.1 8.7
12-16 39 31.1 37.116-20 18 37.6 34.620-24 4 19.3 14.5>24 1 6.8 6.8
100 100.0 100.0
Note: Size distribution, ni/Eni, is fromthe rounded average of exps. 1-5.n.k.j is based on this distributionand 108 particles L-1 total.

19
settling and equation (7) for fluid shear. These
equations can be used to determine a experimentally.
-t Eki2ni , 1=2 to coa = (6)
niin
ni
-t Eki3ni , i=2 to coa = (7)
niin
ni°
To compute a the concentration of submicron particles
remaining at any time t (ni, ni° = conc. at time zero)
needs to be measured. The supramicron particle size
distributions needs to be established to determine the
coagulation rate constants ki2, and ki3. For shear
experiments the rpm of the stirrer must be measured to
calculate G used in equation (5). The supramicron particle
concentration distribution must be measured to determine
values for ni.
Surface Chemical Model
The surface speciation of aluminum (hydr)oxide will
determine its net surface charge and consequently its
mobility and coagulation efficiency. To compare computer
model runs with laboratory titrations, a constant-
20
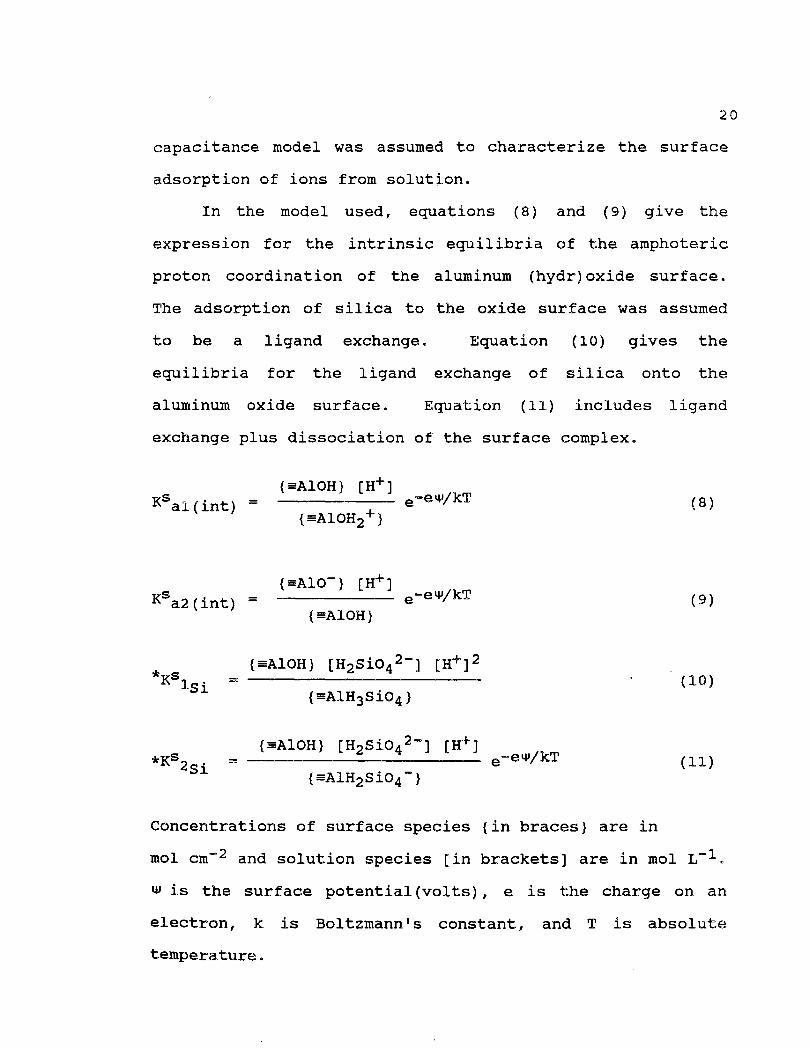
capacitance model was assumed to characterize the surface
adsorption of ions from solution.
In the model used, equations (8) and (9) give the
expression for the intrinsic equilibria of the amphoteric
proton coordination of the aluminum (hydr)oxide surface.
The adsorption of silica to the oxide surface was assumed
to be a ligand exchange. Equation (10) gives the
equilibria for the ligand exchange of silica onto the
aluminum oxide surface. Equation (11) includes ligand
exchange plus dissociation of the surface complex.
Ksal(int)(=A10H) [H+ ] e-ew/kT
(=A10H2 + )(8)
Ksa2(int)(=A10- ) [H+ ]
e-ew/kT ( 9 )(=A10H)
(=A10H) [H2SiO4 2- ] [H+ ] 2*KsK lsi
*Ks2 si(=A10H) [H2SiO4 2- ] [H+ ]
-ew/kT(=A1H2SiO4 - )
Concentrations of surface species (in braces) are in
mol cm-2 and solution species [in brackets] are in mol L-1 .
(1) is the surface potential(volts), e is the charge on an
electron, k is Boltzmann's constant, and T is absolute
temperature.
(1 0)(=A1H3SiO4)
21
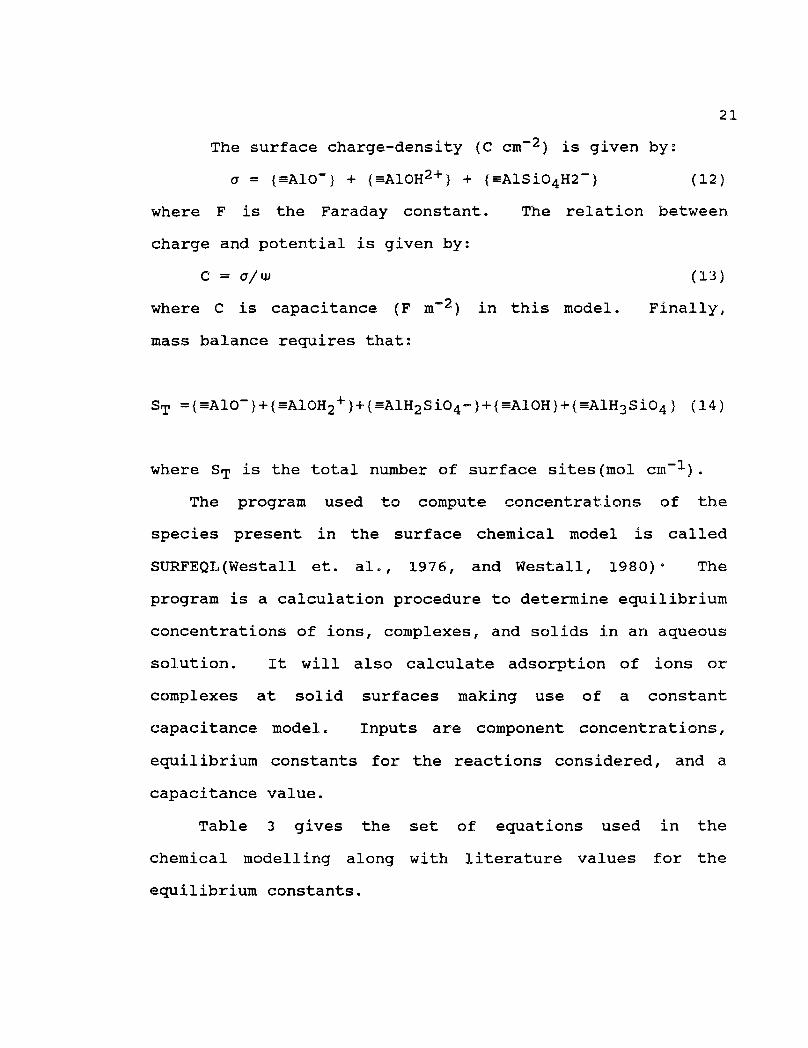
The surface charge-density (C cm-2 ) is given by:
a = (mA10- ) + (mA10H2+ ) + faAlSiO4H2 - ) (12)
where F is the Faraday constant. The relation between
charge and potential is given by:
C = a/w (13)
where C is capacitance (F m-2 ) in this model. Finally,
mass balance requires that:
ST ={-Wil0- }+{-mA1OH2 + )-1-(=A1H2SiO4-)+10H)4.(A1H3SiO4) (14)
where ST is the total number of surface sites(mol cm-1 ).
The program used to compute concentrations of the
species present in the surface chemical model is called
SURFEQL(Westall et. al., 1976, and Westall, 1980)° The
program is a calculation procedure to determine equilibrium
concentrations of ions, complexes, and solids in an aqueous
solution. It will also calculate adsorption of ions or
complexes at solid surfaces making use of a constant
capacitance model. Inputs are component concentrations,
equilibrium constants for the reactions considered, and a
capacitance value.
Table 3 gives the set of equations used in the
chemical modelling along with literature values for the
equilibrium constants.
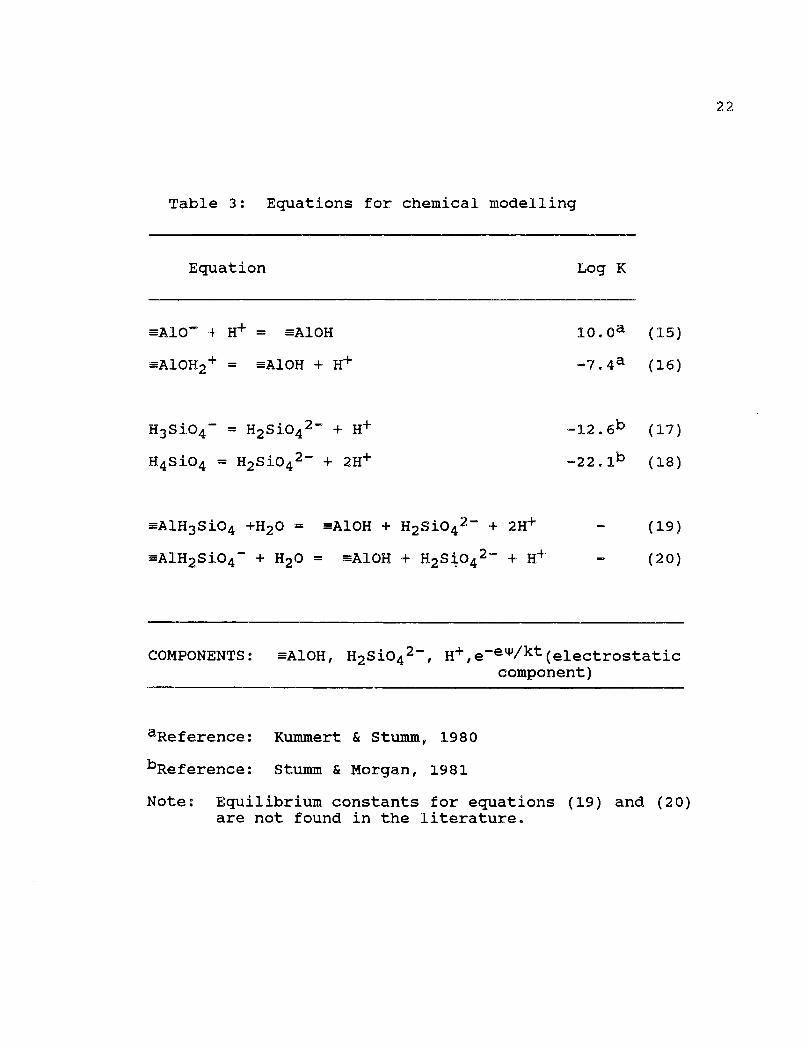
Table 3: Equations for chemical modelling
Equation Log K
mA10- + 114- = mAlOH
I0.0a (15)
mA10H2 + = mAlOH + 114- -7.4a (16)
H3SiO4 - = H2SiO4 2- + 11+ -12.6b (17)
H4S104 = H2SiO4 2- + 2114- -22.1b (18)
mA1H3S104 +H20 = mAlOH + H2S104 2- + 2H+ (19)
mA1H2SiO4 - + H20 = mAlOH + H2SiO4 2- + H+ (20)
-eCOMPONENTS: mA10H, H2SiO42 H+- ,ew/kt, (electrostaticcomponent)
aReference: Kummert & Stumm, 1980
bReference: Stumm & Morgan, 1981
Note: Equilibrium constants for equations (19) and (20)are not found in the literature.
22

MATERIALS AND METHODS
Supramicron silica particles together with submicron
aluminum (hydr)oxide particles were used in this
experimental work. The objective in choosing these
particles was to investigate the coagulation of a submicron
particle with a supramicron particle where the charge of
each at natural water pH conditions is different. This
section will define the preparation of these particles, and
their chemical and physical properties.
Four distinct sets of experiments were conducted:
1. coagulation experiments in a settling column; 2.
coagulation experiments in a stirred beaker; 3. mobility
experiments on the submicron colloids; and 4. titration of
the aluminum hydr(oxide) colloids in the presence of
dissolved silica. The coagulation and mobility experiments
were done with colloid concentrations relevant to natural
waters.
All procedures discussed made use of only reagent
grade water (type I) filtered through a 0.22 gm filter.
Particles
Silica.Silica (Si02) was Min-U-Sil 15 obtained from
Pennsylvania Sand Glass Corp. of Berkeley Springs, West
23

24
Virginia. The manufacturer reports a silica content of
90.7 percent and a specific gravity of 2.65. Silica was
suspended in a 0.5-L glass stoppered bottle and decanted
with water until the remaining particles would settle in
about 10 minutes. The typical volume average diameter
after decanting was 10-11 MM. The reported pHiep (iso-
electric point) for amorphous silica is 2.0 (Stumm and
Morgan, 1981).
The cleaning procedure of just washing and decanting
the silica particles with water was less rigorous than that
of Vuceta(1976) and Young(1981); the latter noted little
difference between cleaned versus uncleaned material.
Later, concern of contamination led us to more rigorous
cleaning as per Young(1981). However, the results of
repeated experiments using the extra-clean silica
demonstrated that the original procedure was adequate.
Aluminum (Hydr)oxide Colloids. Two different aluminum
(hydr)oxide colloids were used. For all but the titration
experiments, the colloids were prepared in the lab as
needed. The preparation was slightly modified from that of
Brace and Matijevic(1973). First, all glassware was
thoroughly cleaned, acid washed(10 percent HNO3), and
rinsed repeatedly with water. A solution of 1 mM aluminum
sulfate(as Al) was prepared and filtered through a 0.1 MM
filter prewashed with 250 mL of water. The filtrate was
25
placed in a 0.5 L glass stopped bottle with teflon tape on
the stopper to insure a tight seal. The bottle was placed
in a 98°C ± 2°C oven for approximately 4 days. The
suspension of aluminum (hydr)oxide colloids was then
transferred to a 500 mL separatory funnel and dripped into
400 ml of water maintaining constant pH 9 with the addition
of 0.01 M NaOH. Finally, the suspension was centrifuged at
2000 rpm for 15, 30, and 45 minutes and decanted after each
spin. A successful preparation resulted in a particle
concentration of approximately 10 11 particles per liter of
a monodispersed colloid with a very tight size distribution
(0.5 AM ± 0.1 AM) (Figure 1). The success of a preparation
was strongly dependent on maintaining a very constant
temperature, and avoiding contamination.
The iso-electric point of the colloids can vary
between preparations. As noted by Brace and
Matijevic(1973), aging time and incomplete removal of
sulfate during hydrolysis and centrifugation are two
possible reasons. The typical preparation would result in
an pHiep of pH 7.5-8. These values agree with
Chowdhury(1988), but not necessarily with Brace and
Matijevic(1973). Figure 2 shows the mobility curves for
aluminum (hydr)oxide colloids prepared by the author,
Chowdhury, and Brace and Matijevic. The variations with
the Chowdhury's curve could be attributed to slight
differences in preparation and electrophoretic mobility

• ••• •
••
• •••
•
•
••• •
••
20KV 1 . 89
II 1.1A0
26
Figure 1: SEN photo of a typical aluminum (hydr)oxidecolloid suspension.

27
Mobility of Al (hydr )oxide colloidsthree different preparations
Figure 2: Mobility of aluminum (hydr)oxide colloids fromthree different preparations. A this work,• Chowdhury(1988), • Brace and Matijevic(1973)
28
measurement procedures.
Further information on the physical and chemical
properties of the aluminum (hydr)oxide colloids can be
found in Brace and Matijevic(1973).
Due to the small amounts of the above colloid that
were able to be produced, a second manufactured aluminum
(hydr)oxide colloid was used in the surface titration
experiments. The product is named "a-alumina" and is
produced by Buehler Ltd. (0.3gm, #40-6305-016). The
a-alumina was first heated overnight in an oven at 250°C,
then placed in 1 M NaOH overnight. The suspension was then
washed with 1 M HC1 for 15 minutes, and decanted several
times with water, saving the supernatant. Decanting took
place 30 minutes after shaking, to remove the larger
(supramicron) particles. The clean, decanted suspension
was filtered and the resultant solid left to dry overnight
in a 1000C oven. The dry powder was then stored in a
desiccator until used.
Coagulation Experiments
Abbaratus. Coagulation experiments were designed to
determine the rate at which aluminum (hydr)oxide colloids
coagulate with larger silica particles in a dilute
suspension. Two different types of coagulation reactors
were used(one for settling, one for fluid shear). A 70 cm
x 8 cm glass settling column mounted on teflon ends was
29
used in the differential settling experiments. Holes were
drilled in the teflon to enable filling and withdrawing
samples. Fluid shear experiments were conducted in a 4-L
pyrex beaker stirred overhead. The beaker was sealed on
top with plexiglass.
Analytical Techniques. Enumeration of silica particles was
done by a Hiac optical particle counter. Typically,
samples of a silica suspension were diluted into the
working range of the machine and the average of three runs
was used. The counter was set to measure concentration (L
-1) in 6 ranges of 1.5-8, 8-12, 12-12, 20-24, and >24 M.
Enumeration of the colloids was done by counting
individual colloids on a photo taken by a Scanning Electron
Microscope(SEM) or when the number was less than 20, on the
SEM video screen. A sample of known volume was diluted and
filtered onto a 0.22 gM, 47 mm polycarbonate filter
(Nuclepore Corp.). The area of filtration was that of the
inside of the Millipore filter holder. A piece of the
filter was then mounted for SEM viewing. Typically 3-4
photos(5-10 if from the screen) of different portions of
the filter were counted and averaged. The concentration of
the colloids was back calculated from this data.
Procedures. The suspension used in reactors consisted of 4
X 10 8 L-1 to 9 x 10 8 L-1 of aluminum (hydr)oxide particles,
30
and 8 x 10 7 L-1 to 1 x 10 8 L-1 of the silica particles in a
0.01 M ionic strength electrolyte of 0.009 M NaC1 and 0.001
M NaHCO3. The suspension was prepared just prior to the
experiment and the pH was adjusted to 5.5. At this pH the
two types of particles are, separately, opposite in charge.
Table 4 summarizes the experimental conditions for both
types of experiments.
Samples were enumerated for both silica particles and
aluminum(hydr)oxide colloids. Samples for colloid
enumeration were allowed to settle for 10 minutes in order
to remove most silica particles before filtering for SEM
mounts. In addition, the mobility of the colloids was
measured with a Rank Brothers particle micro-
electrophoresis apparatus using a flat cell (Mark II,
Cambridge, England). At least 5 colloids were timed with
each polarity setting, and an average mobility and standard
deviation were calculated. When colloids were near their
iso-electric point many more were counted as the variation
of mobility was relatively the greatest.
For differential settling the column was inverted
every 30 minutes to keep the silica particles suspended.
Samples of 20-60 mL were taken 5 minutes after inversion at
a depth of 8 cm at 0, 4.5, 8.5, and 12.5 hours. This
sequence was determined to give the most consistent silica
particle distribution.
31
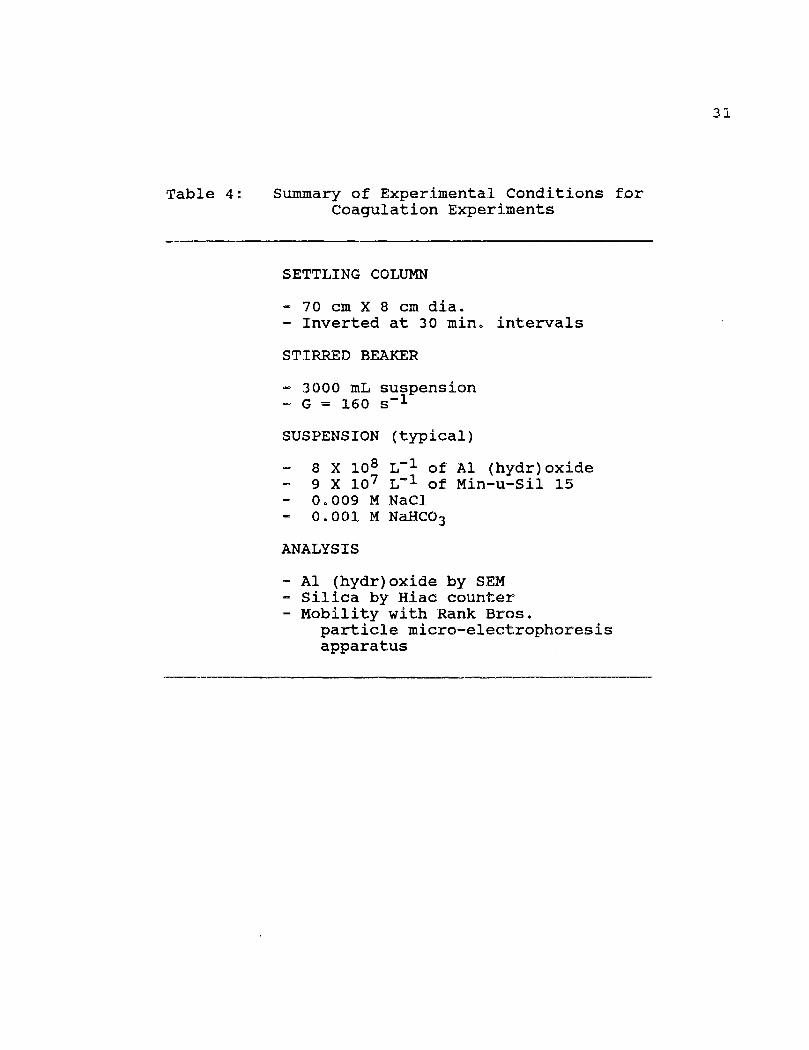
Table 4: Summary of Experimental Conditions forCoagulation Experiments
SETTLING COLUMN
- 70 cm X 8 cm dia.- Inverted at 30 min. intervals
STIRRED BEAKER
- 3000 mL suspension- G = 160 s-1
SUSPENSION (typical)
- 8 X 10 8 L-1 of Al (hydr)oxide- 9 X 10 7 L-1 of Min-u-Sil 15- 0.009 M NaC1- 0.001 M NaHCO3
ANALYSIS
- Al (hydr)oxide by SEN- Silica by Hiac counter- Mobility with Rank Bros.
particle micro-electrophoresisapparatus

32
For the fluid-shear experiments, the suspension in the
beaker reactor was stirred at velocity gradient of 163
sec-1 which was the minimum gradient to keep the silica
particles suspended. This corresponded to 400 rpm for the
configuration and was calculated as per Cornwell and
Bishop(1983). The high velocity gradient increases the
collision frequency and decreases the removal time without
affecting the coagulation efficiency which is independent
of the physical mechanism which causes particle collisions.
20-60 mL samples were taken at 0, 4, 8, 12, and 24
hours. Samples were taken at both the bottom and top of
the beaker for silica enumeration and the results averaged.
Blank experiments were conducted in both reactors with
just the aluminum (hydr)oxide colloids to confirm that
coagulation with silica particles was the only mechanism
for their removal. Similarly, blank experiments were run
with just silica particles to assure that their number and
distribution remained constant. This was necessary to
assure correct use of the pseudo-first-order coagulation
rate equation (2).
Mobility Experiments
A series of mobility experiments using bicarbonate,
dissolved and particulate silica, and aluminum were
conducted to determine the electrostatic properties of the
aluminum (hydr)oxide colloids with these species present.

33
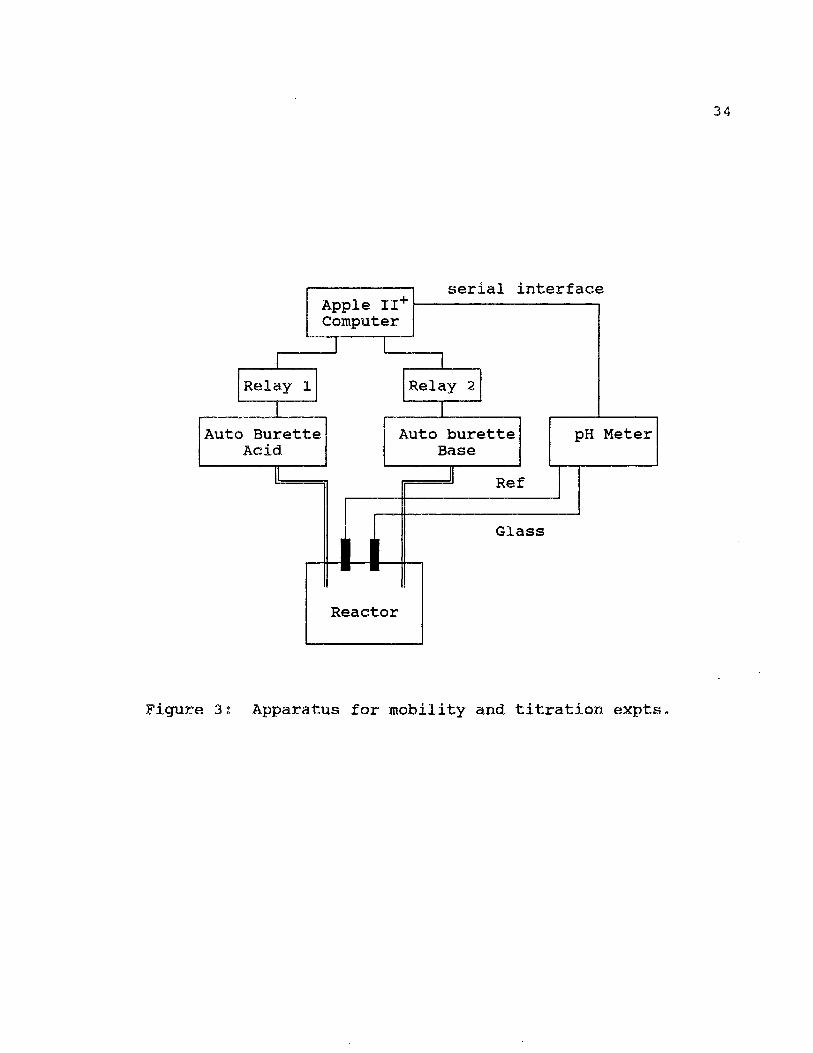
Apparatus. All the experiments were conducted in a
constant pH reactor mixed by a magnetic stirrer. The
reactor consisted of a 200 mL jacketed vessel with a teflon
top. A Fischer 825mp pH meter with Corning glass and
reference electrodes was connected to an Apple II+ computer
through a serial interface. This computer controlled two
stepper motors attached to autoburettes, which added either
acid or base to the reactor(Baker 0.01 M NaOH and HC1
Dilute-it reagents) as necessary to maintain the desired pH
(Figure 3). Nitrogen stripped of CO2 by 1 M NaOH and
humidified was bubbled through the reactor.
Procedures. A suspension of the colloids(200 mL) was
prepared to the same concentration as in the coagulation
experiments and with the same electrolyte. The species of
interest was then added.
Three types of experiments were conducted. In the
first set of experiments, bicarbonate was added in
concentrations of 0.001 M, 0.005 M and 0.01 M and the pH
was varied between 3 and 9. At each step the suspension
was allowed to equilibrate for 45 minutes, after which a
sample was withdrawn and the mobility was measured. The
measurements were made in a Rank Brothers electrophoretic
particle mobility unit using a flat cell and visible light.
At least 10 particles were timed in each polarity setting
and the average mobility and standard deviation were
Relay
Auto BuretteAcid
Relay 2
Auto buretteBase
Ref
serial interfaceApple II+Computer
pH Meter
II
Glass
Reactor
34
Figure 3: Apparatus for mobility and titration expts.
35
calculated. The pH was first raised from 3 to 9 and then
back with a small hysteresis noted between mobilities
measured at identical pH values.
In the second set of experiments both dissolved silica
and Min-u-sil were added in separate experiments and the pH
was held constant at 5.5. The mobility was measured with
time up to 220 minutes.
Finally, both dissolved silica and dissolved aluminum
were added in separate experiments in increasing
concentrations, the suspension was allowed to equilibrate
for 100 minutes and the mobility was measured. The silica
concentrations were varied from 0 to 1 mM and aluminum from
0 to 250 gg/l. In the latter case(addition of Al) Min-u-
sil was also present in the same concentration as in the
coagulation experiments (8 x 10 8 L-1 ).
Surface Titrations
Surface titrations were conducted on the commercial
"a-alumina" in the presence of varying concentrations of
dissolved silica. The same reactor was used as in the
mobility experiments. A 200-mL solution of 0.01 M NaCl and
the dissolved silica concentration of interest were placed
in the reactor. To this was added 2 g of the a-alumina.
The reactor was sealed and the suspension purged overnight
with nitrogen to remove CO2. The titration was also done
under nitrogen. The initial pH was noted and acid added to
36
bring the pH to 3.5. Base was then added to try and
maintain 0.5 pH differences between data points, with the
final point at pH 10.5. The suspension was allowed to
equilibrate 30-45 minutes between each data point before
the pH was read. Obtaining 0.5 pH differences involved
overshooting the intended pH because the suspension pH
would lower as the system came to equilibrium.
a-alumina was titrated in the absence of dissolved
silica and in the presence of 10 -5 M, 10 -4 M, and 10 -3 M
dissolved silica. In addition, a solution of 10-3 M
dissolved silica alone, and a reagent water sample were
titrated.
RESULTS
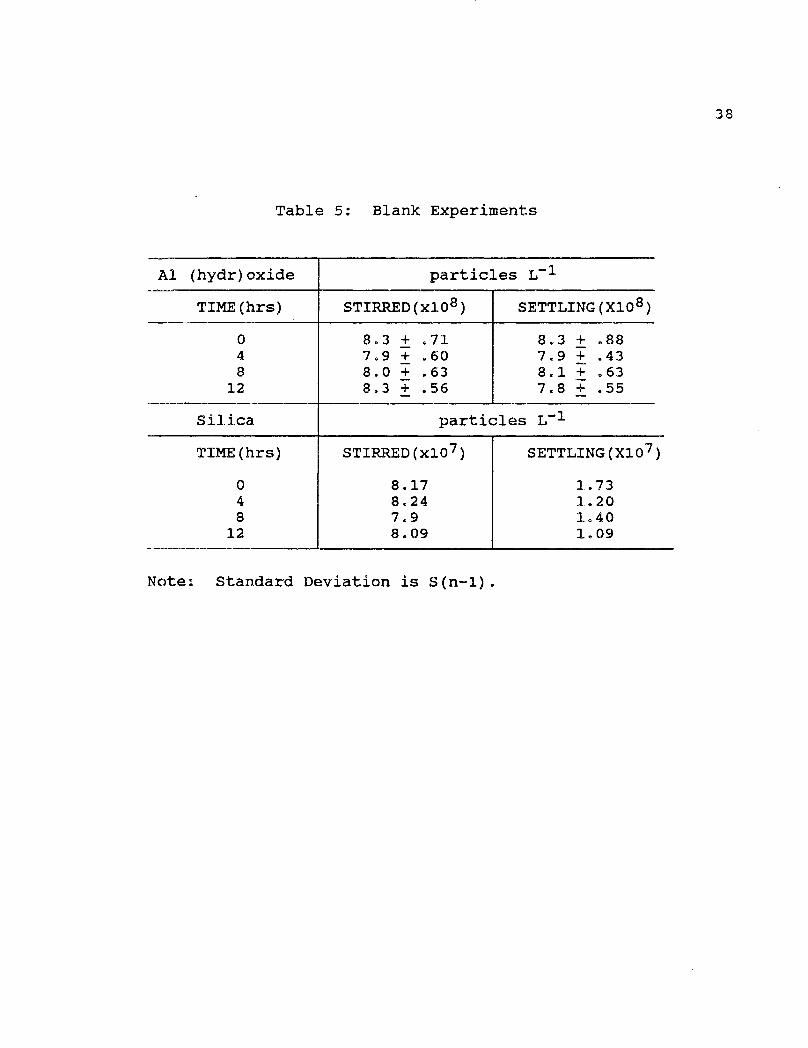
Blank Experiments
Blank experiments with the aluminum (hydr)oxide
colloids or silica alone were conducted to ensure that no
"self-coagulation" occurred. Table 4 summarizes results of
the four blank experiments. Silica concentrations for the
stirred beaker vary less than 2 percent from the average
valve, and less than 20 percent from the average for the
settling column. In both cases the variation with time was
random and not decreasing. Aluminum (hydr)oxide
concentrations did not vary from the average by more than 3
percent for either reactor, and also varied randomly with
time. This supports the assumption that the ni values in
equations (6) and (7) are constant over the time scale of
the experiments, and enables interpreting results using the
pseudo-first order model.
For aluminum (hydr)oxide the "self-coagulation" is
small. This is reflected in equations (2), (6), and (7) in
that the summation does not include nl. Thus, it was
expected that positively charged or near-neutral aluminum
(hydr)oxide colloids would coagulate only with negatively
charged silica particles in the subsequent experiments.
Although self-coagulation did not occur in the blank
37
particles L-1Al (hydr)oxide
048
12
8.3 + .887.9 T • 438.1 T .637.8 T • 55
8.3 + .717.9 T .608.0 T .638.3 T .56
particles L-1Silica
TIME(hrs)
048
12
STIRRED (x10 7 )
8.178.247.98.09
SETTLING (X10
1.731.201.401.09
TIME(hrs) STIRRED(x10 8 ) SETTLING(X10 )
Table 5: Blank Experiments
Note: Standard Deviation is S(n-1).
38
39
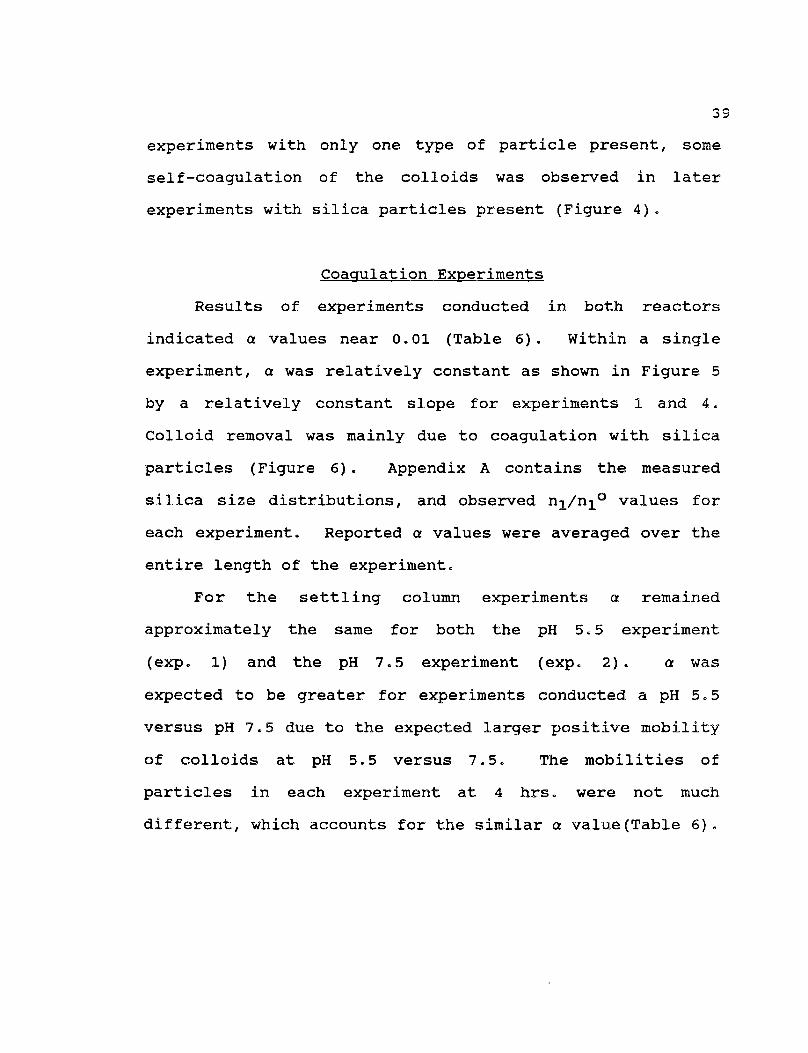
experiments with only one type of particle present, some
self-coagulation of the colloids was observed in later
experiments with silica particles present (Figure 4).
Coagulation Experiments
Results of experiments conducted in both reactors
indicated a values near 0.01 (Table 6). Within a single
experiment, a was relatively constant as shown in Figure 5
by a relatively constant slope for experiments 1 and 4.
Colloid removal was mainly due to coagulation with silica
particles (Figure 6). Appendix A contains the measured
silica size distributions, and observed n1/n1° values for
each experiment. Reported a values were averaged over the
entire length of the experiment.
For the settling column experiments a remained
approximately the same for both the pH 5.5 experiment
(exp. 1) and the pH 7.5 experiment (exp. 2). a was
expected to be greater for experiments conducted a pH 5.5
versus pH 7.5 due to the expected larger positive mobility
of colloids at pH 5.5 versus 7.5. The mobilities of
particles in each experiment at 4 hrs. were not much
different, which accounts for the similar a value(Table 6).
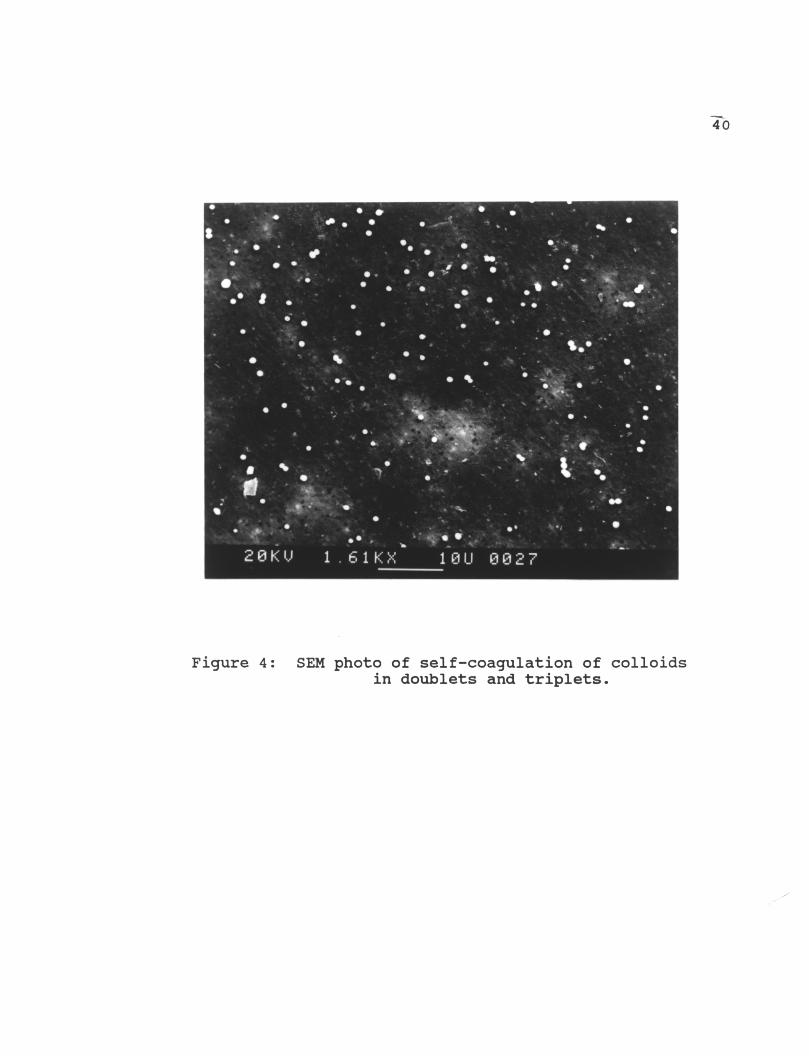
Figure 4: SEM photo of self-coagulation of colloidsin doublets and triplets.
-4-0
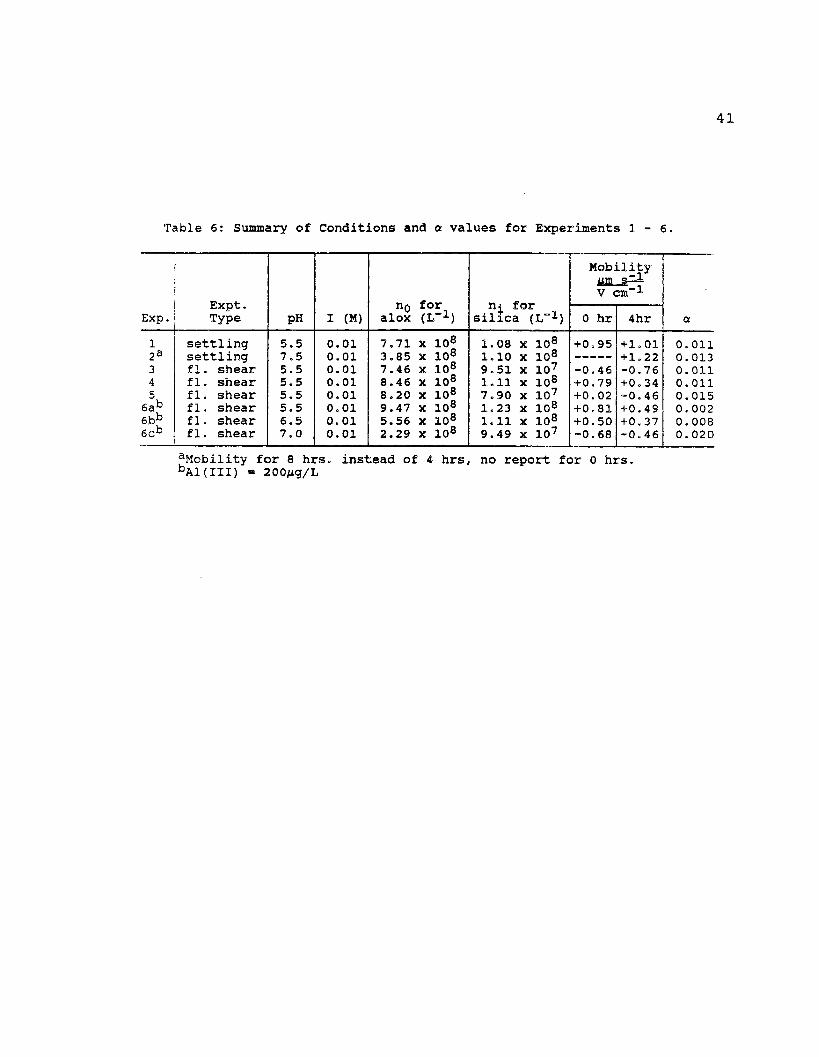
Table 6: Summary of Conditions and a values for Experiments 1 - 6.
Mobility-1gm s--
V cm-1Expt. no for ni for
Exp. Type pH I (M) alox (L-1 ) silica (L-1 ) 0 hr 4hr a
1 settling 5.5 0.01 7.71 x 10⁸ 1.08 x 10⁸ +0.95 +1.01 0.0112a settling 7.5 0.01 3.85 x 10 8 1.10 x 10⁸ +1.22 0.0133 fl. shear 5.5 0.01 7.46 x 10⁸ 9.51 x 10 7 -0.46 -0.76 0.0114 fl. shear 5.5 0.01 8.46 x 10⁸ 1.11 x 10⁸ +0.79 +0.34 0.0115 fl. shear 5.5 0.01 8.20 x 10⁸ 7.90 x 10 7 +0.02 -0.46 0.015
6ab fl. shear 5.5 0.01 9.47 x 10⁸ 1.23 x 10 8 +0.81 +0.49 0.0026bb fl. shear 6.5 0.01 5.56 x 10⁸ 1.11 x 10⁸ +0.50 +0.37 0.0086cb fl. shear 7.0 0.01 2.29 x 10 8 9.49 x 10 7 -0.68 -0.46 0.020
aMobility for 8 hrs. instead of 4 hrs no report for 0 hrs.bAl(III) = 200mg/L
4].
Results of Coagulation Expts. 1 & 4
42
0.1
0
5 10
15
Elapsed Time (hrs)
Figure 5: Results of coagulation experiments 1 and 4.Expt. 1, • Expt. 4
43
Figure 6: SEM photo of colloids coagulated on silica.
44
Mobility Experiments
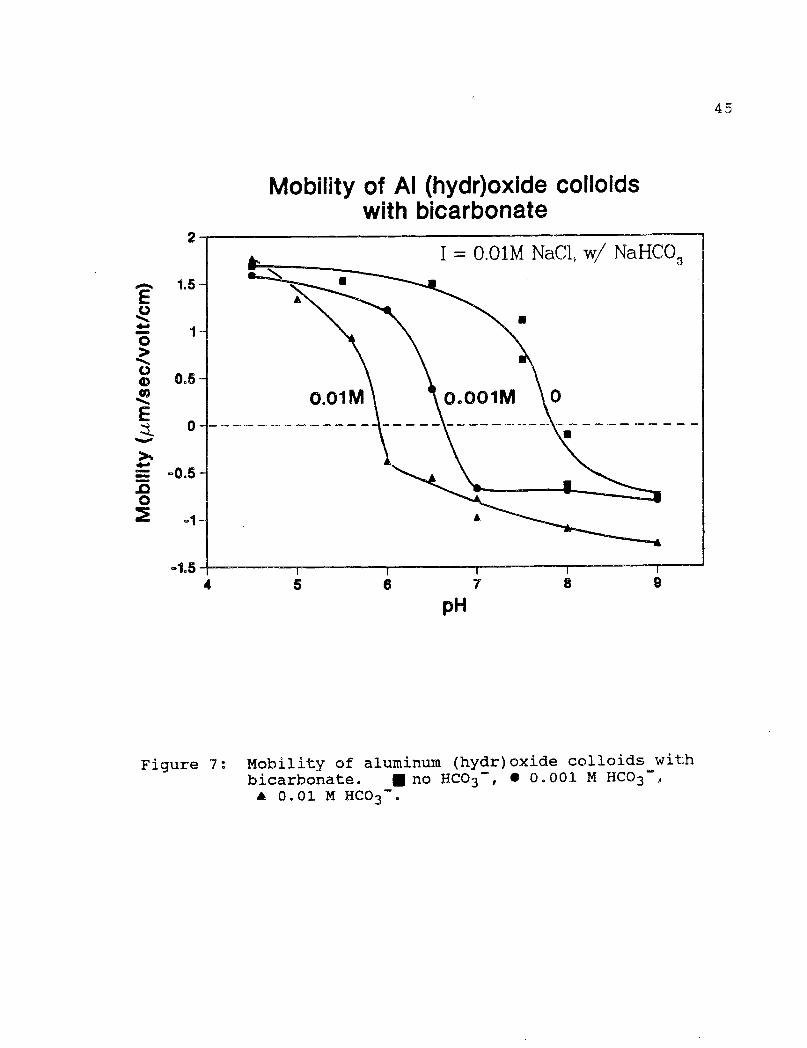
Bicarbonate. Figure 7 shows the mobility curves for
aluminum (hydr)oxide colloids in the presence of
bicarbonate. The iso-electric pH's for the colloids were
7.8, 6.7, and 5.9 in the absence of bicarbonate and in the
presence of 0.0 M, 0.001 M, and 0.01 M bicarbonate
respectively. The pHiep for the colloids shifted 1.2 pH
units lower upon a 0.001 M bicarbonate addition (the
concentration used in the coagulation experiments). Thus
bicarbonate can account for a decrease in the mobility
observed in the coagulation experiments, but not for the
charge reversal observed in the shear experiments.
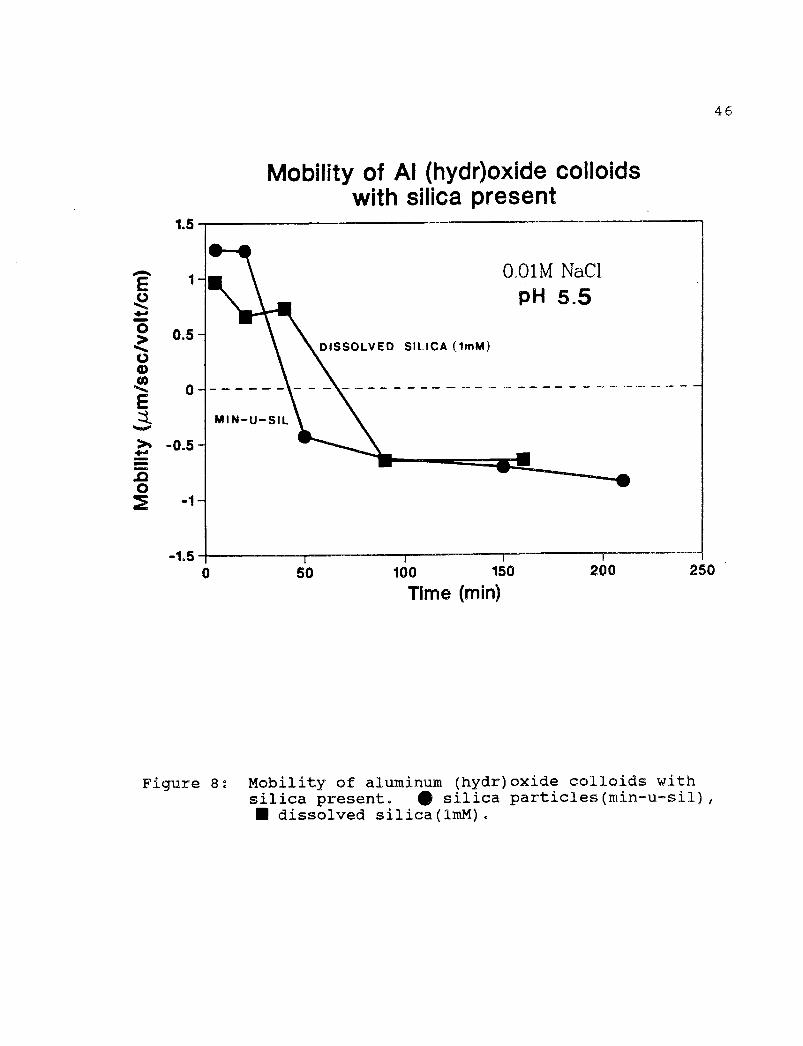
Silica. Figure 8 shows the change in mobility with time of
the aluminum (hydr)oxide colloids in the presence of silica
particles and 1 mM dissolved silica. Silica particles
reversed the mobility(i.e, charge) of the colloids in 50
minutes which came to an equilibrium mobility in 75
minutes.
1mM dissolved silica caused the colloids to reverse
charge in 75 minutes The colloids reached an equilibrium
mobility in 100min.
Figure 9 shows the effect of increasing dissolved
silica concentrations of the mobility of aluminum
(hydr)oxide colloids. Dissolved silica can create charge
reversal at a concentration of 10 -4 M. Above 5.0 x 10 -4 M
4t
5 6 7 8 9
pH
Mobility of Al (hydr)oxide colloidswith bicarbonate
Figure 7: Mobility of aluminum (hydr)oxide colloids withbicarbonate. Olno HCO3 - , • 0.001 M HCO3,A 0.01 M HCO3 - .
45
200 25050
Mobility of Al (hydr)oxide colloidswith silica present
Figure 8: Mobility of aluminum (hydr)oxide colloids withsilica present. • silica particles(min-u-sil),• dissolved silica(1mM).
46

Mobility of Al (hydr )oxide colloidswith dissolved silica present
1.5-
0.01M NaC1pH 5.5
0.2 0.4 0.6 0.8 1
Conc. Silica (mM)
Figure 9: Mobility of aluminum (hydr)oxide colloids withdissolved silica present.
47
48
no additional lowering of the mobility is seen. 10 -4 M is
below the equilibrium saturation concentration attainable
for the dissolution of amorphous silica at 25°C.
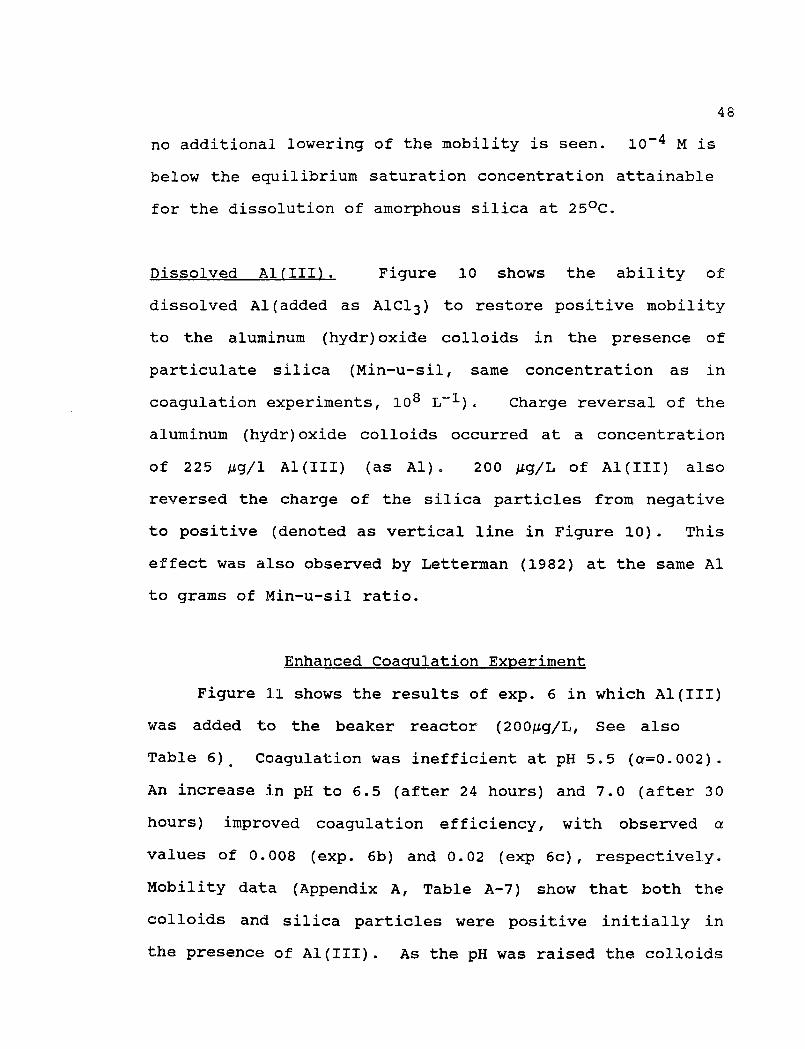
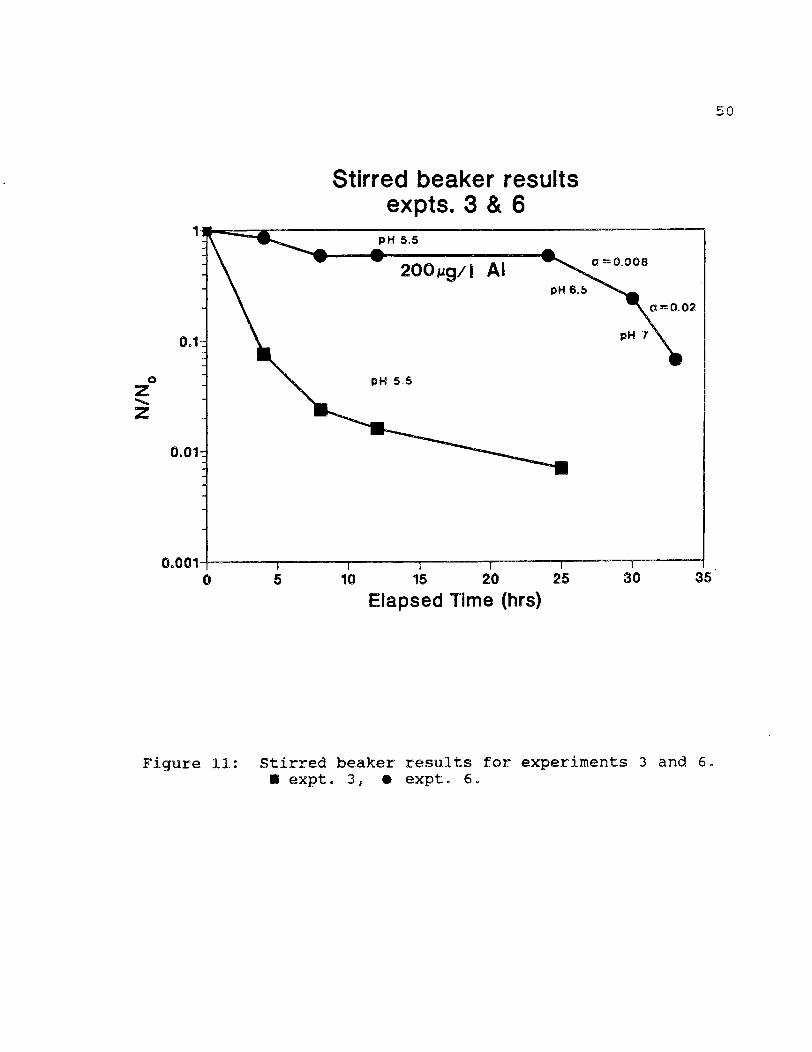
Dissolved Al(III). Figure 10 shows the ability of
dissolved Al(added as AlC13) to restore positive mobility
to the aluminum (hydr)oxide colloids in the presence of
particulate silica (Min-u-sil, same concentration as in
coagulation experiments, 10 8 L-1). Charge reversal of the
aluminum (hydr)oxide colloids occurred at a concentration
of 225 gg/1 Al(III) (as Al). 200 gg/L of Al(III) also
reversed the charge of the silica particles from negative
to positive (denoted as vertical line in Figure 10). This
effect was also observed by Letterman (1982) at the same Al
to grams of Min-u-sil ratio.
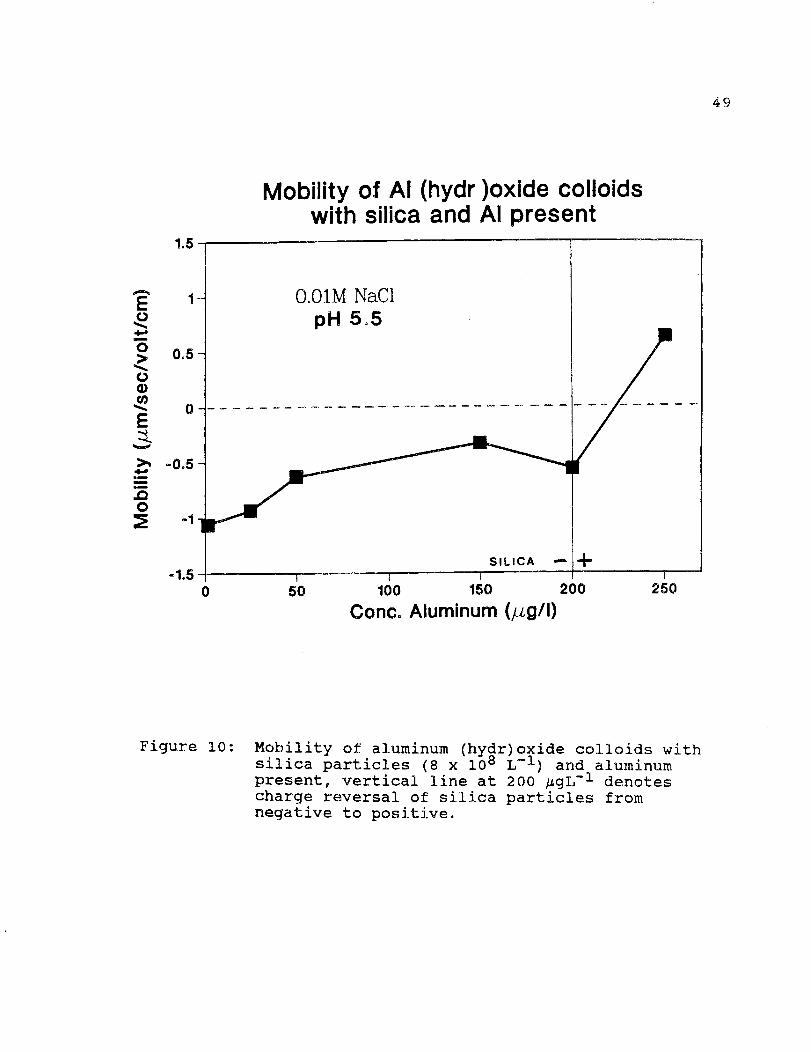
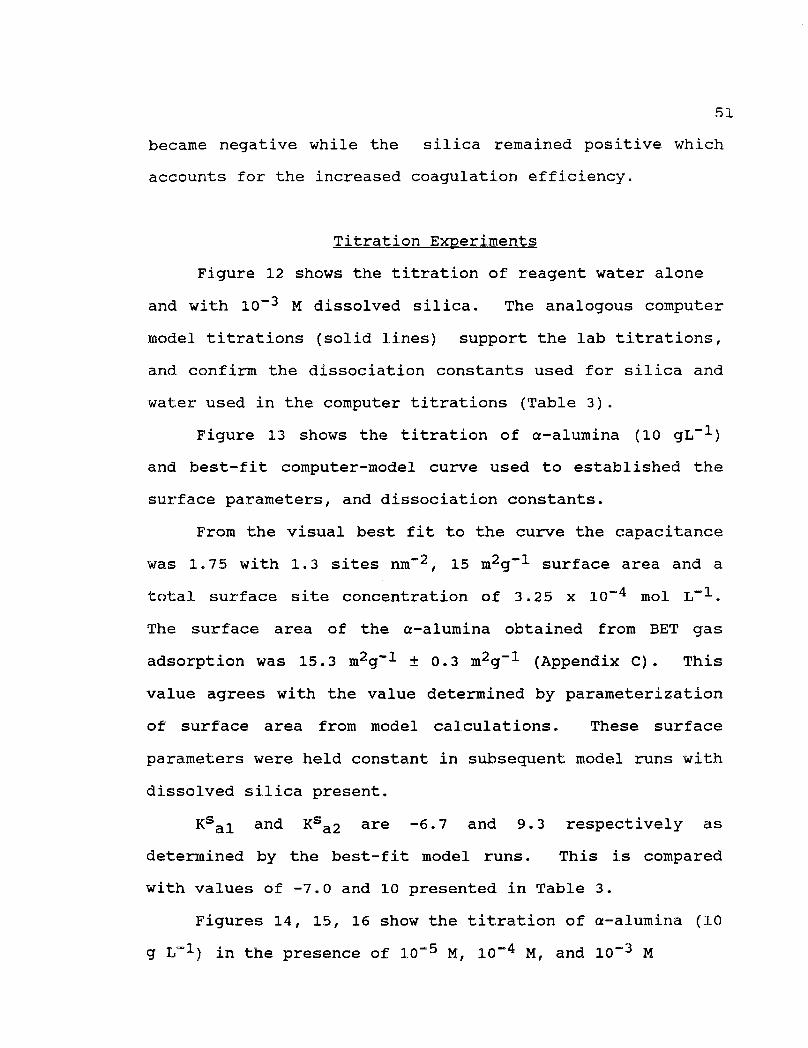
Enhanced Coagulation Experiment
Figure 11 shows the results of exp. 6 in which Al(III)
was added to the beaker reactor (200gg/L, See also
Table 6) . Coagulation was inefficient at pH 5.5 (a=0.002).
An increase in pH to 6.5 (after 24 hours) and 7.0 (after 30
hours) improved coagulation efficiency, with observed a
values of 0.008 (exp. 6b) and 0.02 (exp 6c), respectively.
Mobility data (Appendix A, Table A-7) show that both the
colloids and silica particles were positive initially in
the presence of Al(III). As the pH was raised the colloids
Mobility of Al (hydr )oxide colloidswith silica and Al present
o 50 100 150 200
250
Conc. Aluminum (u,g/1)
Figure 10: Mobility of aluminum (hydr)oxide colloids withsilica particles (8 x 10 8 L-1 ) and aluminumpresent, vertical line at 200 AgL-1 denotescharge reversal of silica particles fromnegative to positive.
49
a =0.008
pH 7
0=0.02
0.001 r f I I I
Stirred beaker resultsexpts. 3 & 6
50
zo
.2
0 5 10 15 20 25
30 35
Elapsed Time (hrs)
Figure 11: Stirred beaker results for experiments 3 and 6.• expt. 3, • expt. 6.
51
became negative while the silica remained positive which
accounts for the increased coagulation efficiency.
Titration Experiments
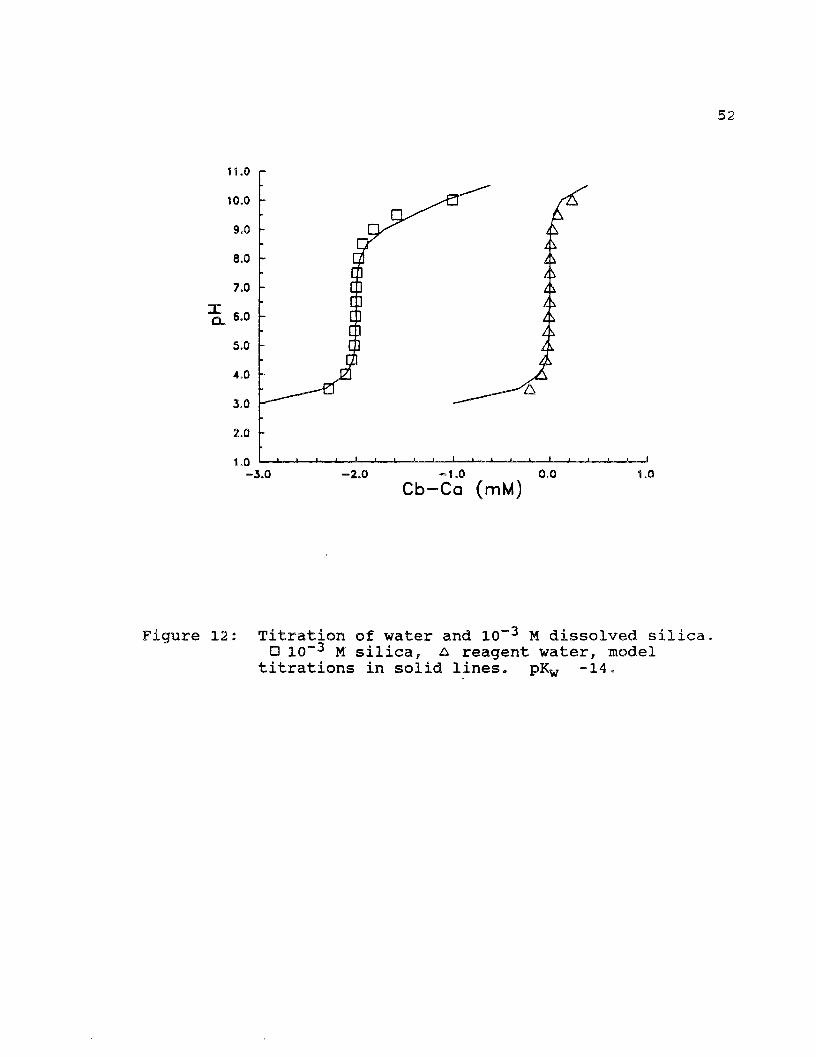
Figure 12 shows the titration of reagent water alone
and with 10 -3 M dissolved silica. The analogous computer
model titrations (solid lines) support the lab titrations,
and confirm the dissociation constants used for silica and
water used in the computer titrations (Table 3).
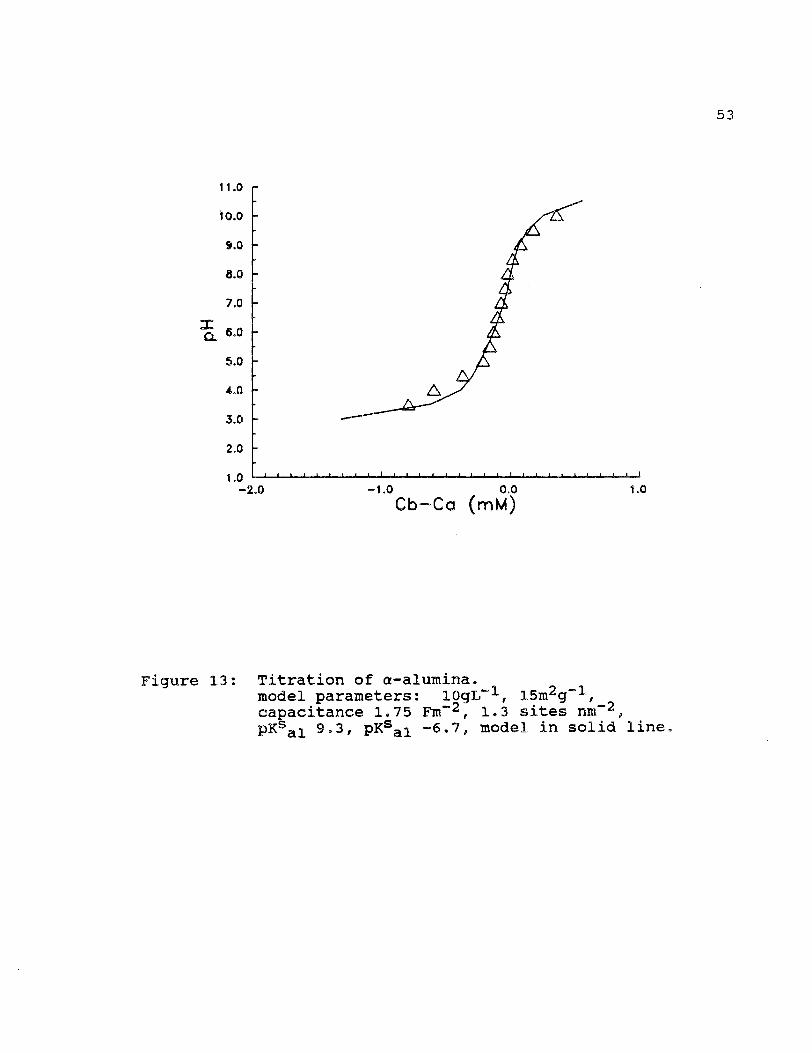
Figure 13 shows the titration of a-alumina (10 gL-1 )
and best-fit computer-model curve used to established the
surface parameters, and dissociation constants.
From the visual best fit to the curve the capacitance
was 1.75 with 1.3 sites nm-2 , 15 m2g-1 surface area and a
total surface site concentration of 3.25 x 10 -4 mol L-1 .
The surface area of the a-alumina obtained from BET gas
adsorption was 15.3 m2g-1 ± 0.3 M2 Og l (Appendix C). This
value agrees with the value determined by parameterization
of surface area from model calculations. These surface
parameters were held constant in subsequent model runs with
dissolved silica present.
KS al and K5a2 are -6.7 and 9.3 respectively as
determined by the best-fit model runs. This is compared
with values of -7.0 and 10 presented in Table 3.
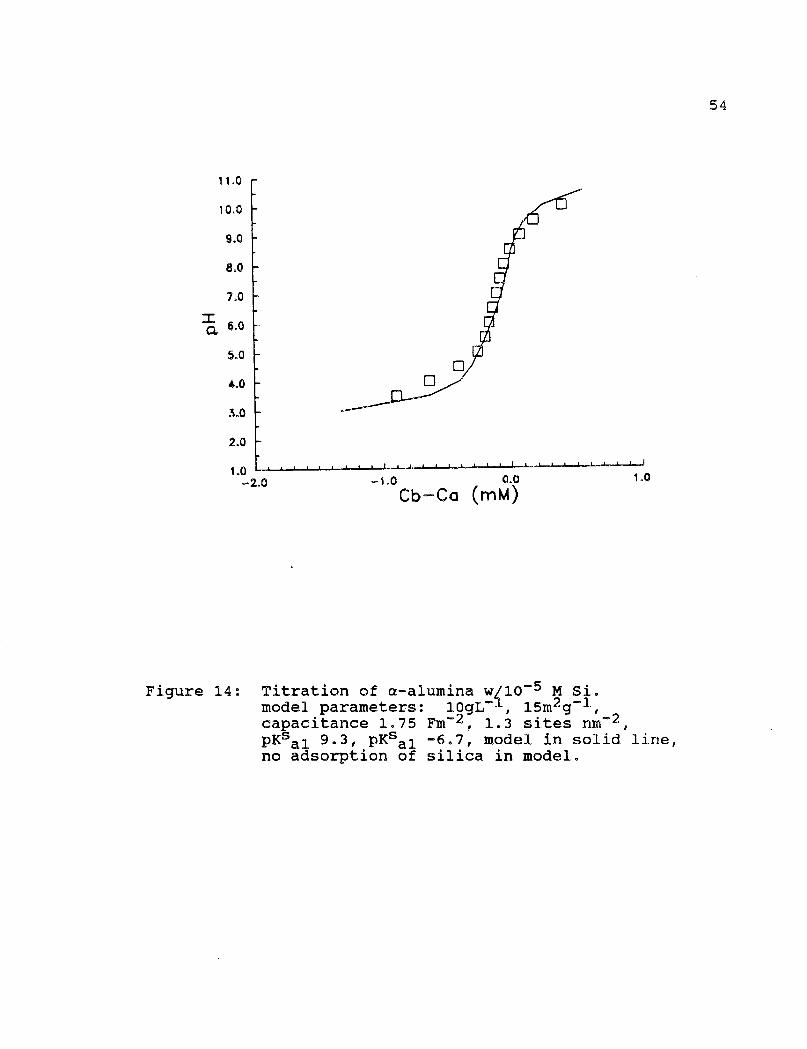
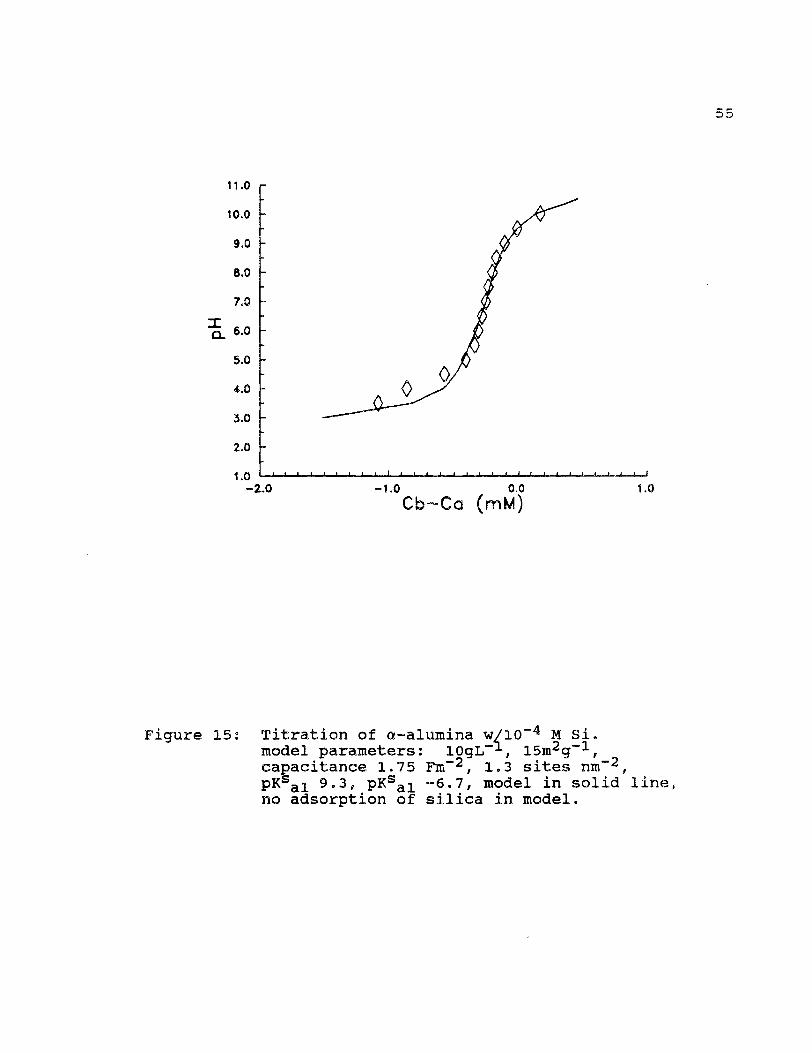
Figures 14, 15, 16 show the titration of a-alumina (10
g L- 1 ) in the presence of 10-5 M, 10 and 10 -3 M
52
11.0
10.0
9.0
8.0
7.0
a. "
5.0
4.0
3.0
2.0
1.0-3.0 1.0-2.0 -1.0 0.0
Cb—Ca (mM)
Figure 12: Titration of water and 10-3 M dissolved silica.0 10 -3 M silica, A reagent water, model
titrations in solid lines. pKw -14.
53
11.0
10.0
9.0
8.0
7.0
a 6.0
5.0
4.0
3.0
2.0
1.0-2.0 1.0om
Cb—Ca (mM)
Figure 13: Titration of a-alumina.model parameters: 10g1,- 1 , 1 5m2g-1 ,
capacitance 1.75 Fm-2 , 1.3 sites nm-2 ,
PKsal 9 . 3, PKsal -6.7, model in solid line.
54
ILO
10.0
9.0
8.0
7.0
a 6.0
5.0
4.0
3.0
2.0
1.0-2.0 1.0-1.0 0.0
Cb-Ca (mM)
Figure 14: Titration of a-alumina w/10 -5 M Si.model parameters: 1OgL-1 , 15m2g-1 ,capacitance 1.75 Fm-2 , 1.3 sites nm-2 ,
PKsal 9 . 3 1 PKsal -6.7, model in solid line,no adsorption of silica in model.
55
11.0
10.0
9.0
7.0
"
5.0
4.0
3.0
2.0
1.0-2.0 1.0-Lo 0.0
Cb—Ca (mM)
Figure 15: Titration of a-alumina 144'10-4 M Si.model parameters: lOgL-1-, 15m2g-1 ,capacitance 1.75 Fm-2 , 1.3 sites nm-2 ,
PKsal 9.3, PKsal -6.7, model in solid line,no adsorption of silica in model.
56
11.0
10.0
9.0
8.0
7.0
a 6.0
5.0
4.0
3.0
2.0
1.0-4.0 0.0-3.0 -2.0 -LO
Cb—Ca (mM)
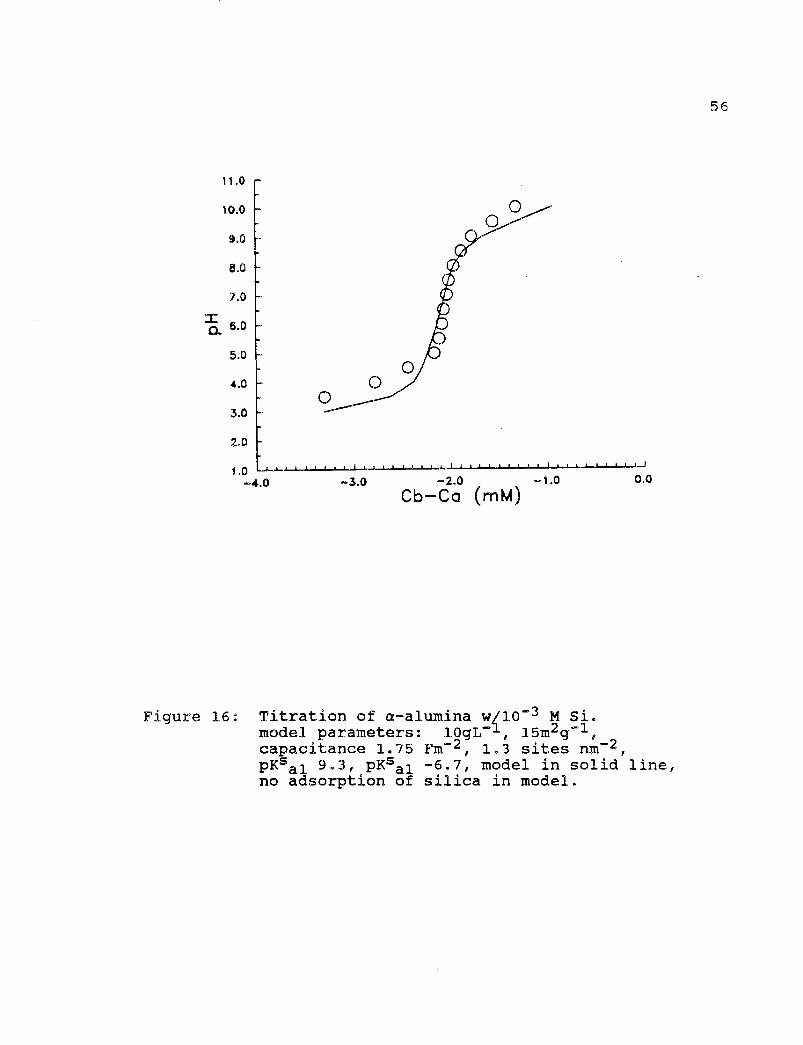
Figure 16: Titration of a-alumina wl10 -3 M Si.model parameters: 1OgL-1 , 15m2g-1 ,capacitance 1.75 Fm-2 , 1.3 sites nm-2 ,PKsal 9 . 3, PKsal -6-7, model in solid line,no adsorption of silica in model.
57
dissolved silica. For the titrations of a-alumina with
lo dissolved silica and a-alumina with 10-4 M silica,
the model curves, without silica adsorption to the oxide
surface, fit the data satisfactorily and suggest that
silica was not adsorbing to the surface.
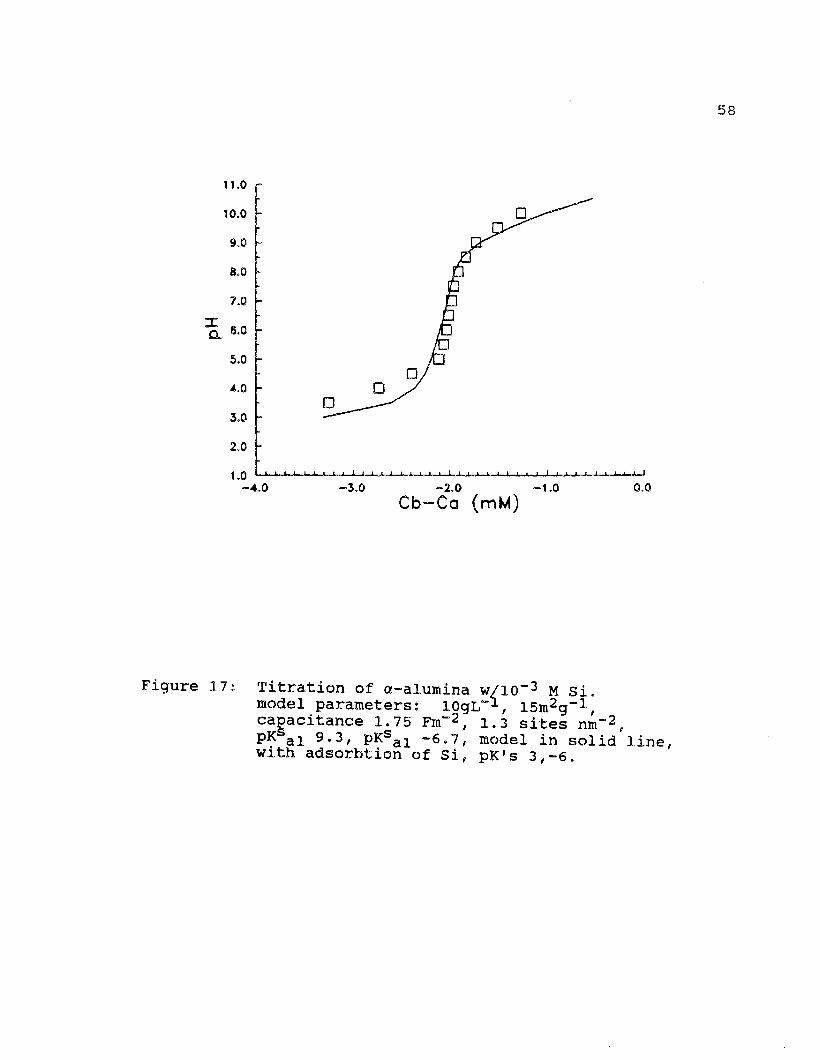
For the titrations of a-alumina with 10-3 M dissolved
silica the model run without adsorption does not fit
(Figure 16). In Figure 17 the model run with adsorption of
silica to the surface fits more satisfactorily and suggests
that adsorption of silica to the surface with ligand
exchange is occurring. Ksisi and Ks2si as determined by
this best-fit model curve in Figure 17 are -25.1 and -16.1,
respectively.
Appendix C contains figures that show the
parameterization of values from computer model runs that
eventually led to the best-fit curves to the titration
data. Appendix C also includes the SURFEQL input files
used.
58
11.0
10.0
9.0
900
7.0
Ici 6.0
5.0
4.0
3.0
2,0
1.0—4.0 -2.0 -1.0
Cb—Ca (mM)0.0
Figure 17: Titration of a-alumina w00 -3 M Si.model parameters: 1OgL-1-, 15m2g-1 ,capacitance 1.75 Fm-2 , 1.3 sites nm-2 ,13 trS n -2 model in solid line,-'• al '..4 1 PKsal -6 . 7 fwith adsorbtion of Si, pK's 3,-6.
DISCUSSION
The observed a values (-0.01) were in the lower range
of those reported the literature cited previous.
For constant a and ni, n1/n1 0 should exhibit a linear
decrease with time (Figure 5). SEM photo (Figure 4).
indicated that some self-coagulation of the aluminum
(hydr)oxide colloids occurred. Triplets and larger
groupings of the particles were observed after four hours
for the stirred beaker experiments. Thus, the average
value of a reported for the fluid-shear experiments
reflects both coagulation of the colloids by silica
particles as well as by other aluminum (hydr)oxide
colloids. The actual a for fluid shear is somewhat lower
than reported in Table 6, because collisions/coagulation
between submicron particles were not considered in the
calculations (eq. 2).
The values of kij for i=1 (self-coagulation, 0.5 Am
colloids) are: k11 = 3.5 x 10 -11 cm3s-1, k12 = 0.0 cm 3 s-1 ,
and k13 = 2.74 x 10 -11 cm3 s-1 . In experiment 1, settling,
kiln' would be 2.7 x 10 -5 s-1 and would account for 1.1
percent of the total coagulation (nl = 7.71 x 10 8 L-1). In
experiment 4, fluid shear, kiln 1 would be 2.98 x 10⁻⁵ s-1
and k13n1 would be 2.33 x 10 -5 s = 8.46 x 10 8 L-1 ,).
59
60
Together these values account for only 0.85 percent of the
total coagulation. Based on the above calculations the
contribution of self-coagulation from Brownian motion,
fluid shear, or differential settling to the overall
coagulation rate should be small.
Mobilities of the submicron colloids measured during
the fluid shear experiments show a charge reversal to
negative within the first four hours apparently due to the
adsorption of dissolved silica and/or carbonate species.
Results showed a decrease in a values with time(Appendix A,
and Figure 5) possibly due to slow silica dissolution
and/or slow silica adsorption.
Results of the mobility experiments are consistent with
observations of others concerning the effect by dissolved
organic and inorganic species on charge reversal
/neutralization and on coagulation efficiency of particles
(e.g. Wiese and Healy, 1975, Ali et al., 1984, Gibbs, 1983,
Letterman, 1982, Furlong et al.,1980, Bowers and Huang,
1984). In particular, the important role of silica
adsorption, even in undersaturated solutions, is suggested.
In some natural waters, silica may be of equal or
greater importance than dissolved natural organic matter in
causing charge reversal and in stabilizing particles.
The observed charge reversal by dissolved aluminum is
also consistent with results of others regarding the effect
of multivalent cations. The common pH for charge reversal
61
of both silica and aluminum (hydr)oxide colloids suggests
that they had like surfaces after a few hours into the
experiment. A similar observation was made by Wiese and
Healy(1975) for Al203 suspensions.
The coagulation of the submicron aluminum (hydr)oxide
colloids by particulate silica in the presence of dissolved
Al(III) became more destabilized with increasing pH (a =
0.002, 0.008, 0.02; for pH = 5.5, 6.5, 7.0 respectively).
This destabilization behavior is probably due to the lower
solubility of Al(OH)3(s) and thus more surface accumulation
of aluminum species at the two higher pH values.
Enmeshment of aluminum (hydr)oxide colloids into an
Al(OH)3(s) precipitate is more significant at higher pH
values (Chowdhury et al., 1987).
To analyze the surface titrations of the a-alumina it
was necessary to run computer simulations of these
titrations. The purpose was to determine if dissolved
silica was adsorbing onto the surface of the a-alumina.
First, the dissociation of reagent water and 10 -3M
aqueous silica were modelled to confirm their equilibrium
constants. The surface amphoteric proton coordination for
the a-alumina was modelled next. Five parameters, surface
area, number of surface sites, capacitance, and intrinsic
equilibrium constants, were varied until a best fit to the
data was achieved (Figure 13). The surface area was also
determined by BET gas adsorption for comparison. See
62
Appendix C for details of the BET calculation.
Dissolved silica in concentrations of 10 -3 M, 10 -4 M,
and 10-5 M were added to the model, keeping constant the
five alumina surface parameters. Finally, the ligand
exchange of silica on the alumina surface was included with
10 -3 M dissolved silica initially present in the system.
The equilibrium constants were varied for the ligand
exchange until a best fit with the alumina with 10 -3 M
silica titration curve was achieved.
For the titration of a-alumina in the presence of
10 -5 M, and 10-4 M silica, curves from computer model runs
with no adsorption fit the data well enough to give
inconclusive results as to whether adsorption/ligand
exchange was occurring. For the titration of a-alumina in
the presence of 10-3 M silica, the curve from the computer
model run with no adsorption does not fit the data. The
curve from the model run with adsorption/ligand exchange
fits the data and suggests that adsorption of silica to the
aluminum oxide surface with ligand exchange is occurring.
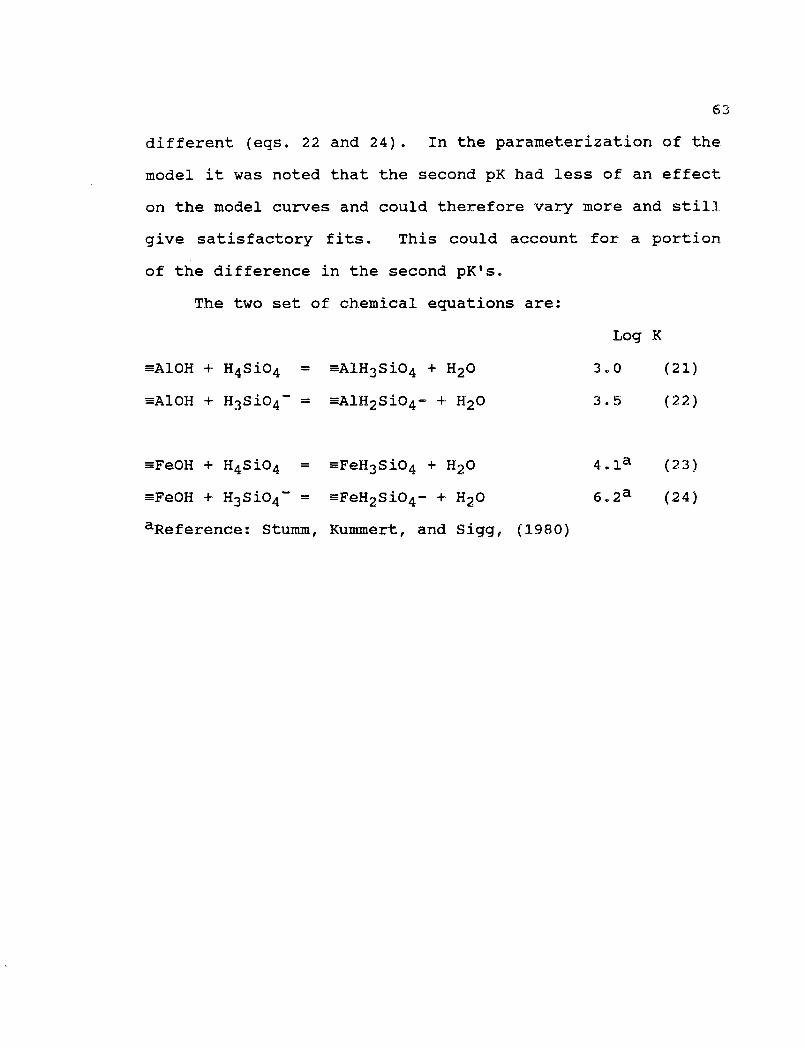
The values for the equilibrium constants for this
ligand exchange from the best-fit model titration curve as
compared to the ligand exchange of silica to an iron oxide
surface are only one order of magnitude different for the
first pK's (eqs. 21 and 23). This difference could be
accounted for by the difference in chemical properties.
Yet, the second pK's are almost 3 orders of magnitude
63
different (eqs. 22 and 24). In the parameterization of the
model it was noted that the second pK had less of an effect
on the model curves and could therefore vary more and still
give satisfactory fits. This could account for a portion
of the difference in the second pK's.
The two set of chemical equations are:
Log K
alk1OH + H4SiO4 = mA1H3SiO4 + H20 3.0 (21)
a-P.10H + H3S104 - = :=111H2SiO4- + H20 3.5 (22)
.4".e0H + H4SiO4 = =FeH3SiO4 + H20 4.1a (23)
mFe0H + H3SiO4 - = mFeH2SiO4- + H20 6.2a (24)
aReference: Stumm, Kummert, and Sigg, (1980)
CONCLUSIONS AND RECOMMENDATIONS
Values of a for coagulation of aluminum (hydr)oxide
colloids by supramicron silica particles were generally
near 0.01. These values are somewhat lower than those that
were expected, considering that the particles were
originally of opposite charge at pH 5.5. This is because
dissolved silica from the particulate silica adsorbs to the
colloids reversing their charge. A similar phenomena is
thought to be important in natural waters. Bicarbonate
also adsorbs and shifts the pHiep of the aluminum
(hydr)oxide colloids. The addition of dissolved Al(III)
had a similar effect on both types of particles.
Dissolved silica adsorbs to the aluminum oxide surface
and undergoes ligand exchange. This exchange can be
simulated by a constant capacitance model for adsorption of
aqueous species to the oxide surface and fits laboratory
titration data to give equilibrium constants.
The fit of the model curve with adsorption was not
perfect (Figure 17) and suggests that more titrations
experiments are necessary to determine dependable values
for the equilibrium constants of ligand exchange. In
these experiments surface parameters should be well
characterized to give the best results.
64

65
In future coagulation experiments if it is desired to
observe a values near one, model particles should be chosen
carefully so that desorption/adsorption of undesired ions
does not change the particle's mobility and affect the
coagulation efficiency. More interestingly, coagulation
experiments which try to determine the importance of
inorganic ions versus organic ions (e.g. NOM) in decreasing
coagulation efficiency of submicron particles would add a
valuable piece of information about coagulation of
particles in natural water and wastewater systems.

APPENDIX ACOAGULATION EXPERIMENTS
66
67
achannel bsize
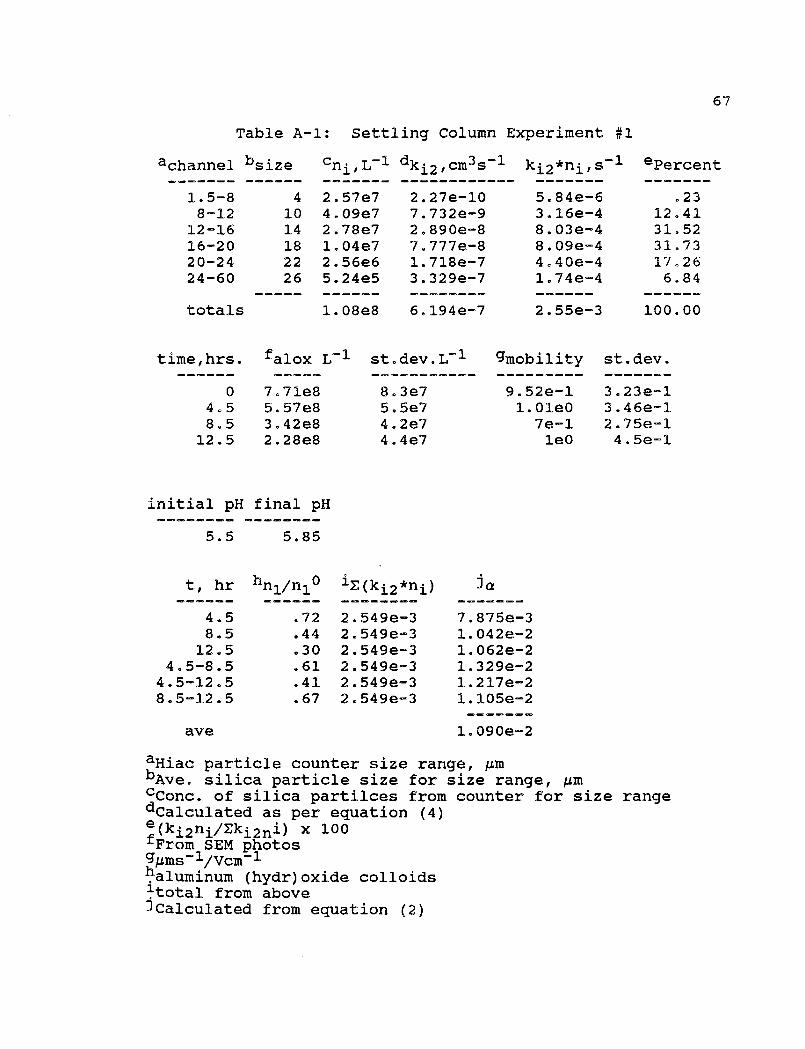
Table A-1: Settling Column Experiment #1
cn . L-1 dk121cm3s-1 ki2*ni,s-1 ePercent
1.5-8 4 2.57e7 2.27e-10 5.84e-6 .238-12 10 4.09e7 7.732e-9 3.16e-4 12.41
12-16 14 2.78e7 2.890e-8 8.03e-4 31.5216-20 18 1.04e7 7.777e-8 8.09e-4 31.7320-24 22 2.56e6 1.718e-7 4.40e-4 17.2624-60 26 5.24e5 3.329e-7 1.74e-4 6.84
totals 1.08e8 6.194e-7 2.55e-3 100.00
time,hrs. falox L-1 st.dev.L-1gmobility st.dev.
0 7.71e8 8.3e7 9.52e-1 3.23e-14.5 5.57e8 5.5e7 1.01e0 3.46e-18.5 3.42e8 4.2e7 7e-1 2.75e-1
12.5 2.28e8 4.4e7 le0 4.5e-1
initial pH final pH
5.5 5.85
t, hr hni/ni° 1-E(ki2*n1) ja
4.5 .72 2.549e-3 7.875e-38.5 .44 2.549e-3 1.042e-2
12.5 .30 2.549e-3 1.062e-24.5-8.5 .61 2.549e-3 1.329e-2
4.5-12.5 .41 2.549e-3 1.217e-28.5-12.5 .67 2.549e-3 1.105e-2
ave 1.090e-2
aHiac particle counter size range, gmbAve, silica particle size for size range, AmcConc. of silica partilces from counter for size rangedCalculated as per equation (4)e (ki2ni/Eki2m1) x 100From SEM photos
gAms-1/Vcm-11a1uminum (hydr)oxide colloids+total from above7 Calculated from equation (2)
68
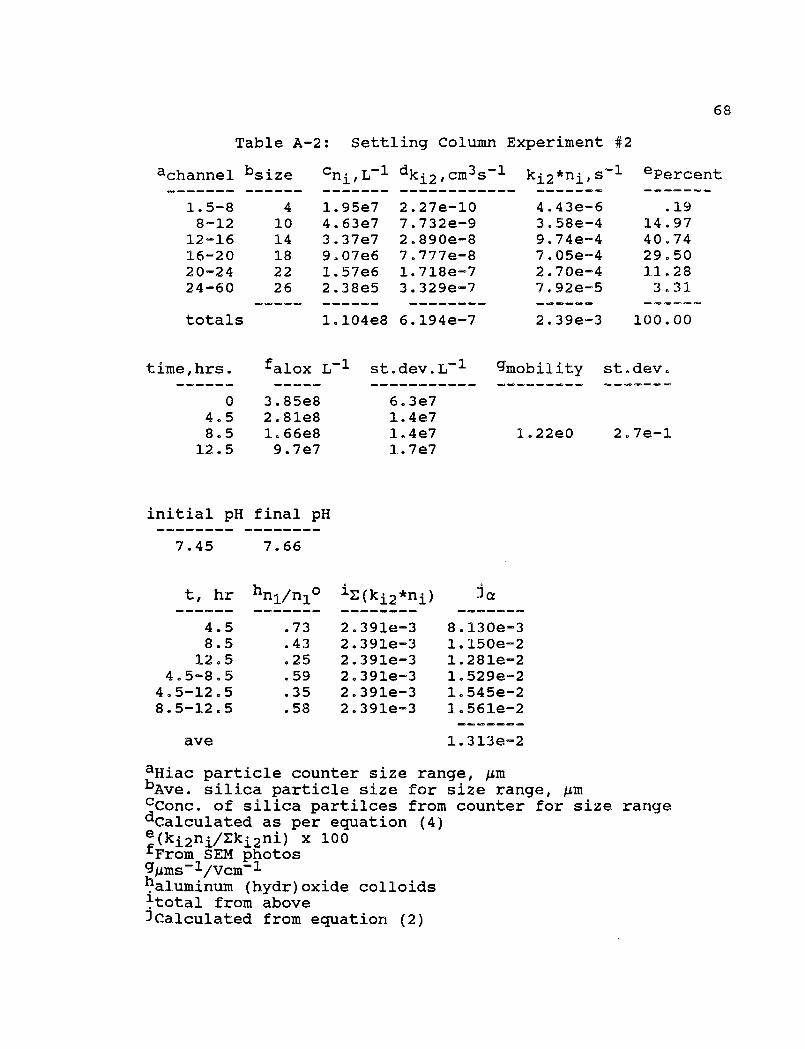
Table A-2: Settling Column Experiment #2
achannel bsize cni,L-1 dki2,cm3 s-1ki2*ni,s-1ePercent
1.5-8 4 1.95e7 2.27e-10 4.43e-6 .198-12 10 4.63e7 7.732e-9 3.58e-4 14.97
12-16 14 3.37e7 2.890e-8 9.74e-4 40.7416-20 18 9.07e6 7.777e-8 7.05e-4 29.5020-24 22 1.57e6 1.718e-7 2.70e-4 11.2824-60 26 2.38e5 3.329e-7 7.92e-5 3.31
totals 1.104e8 6.194e-7 2.39e-3 100.00
time,hrs.
04.58.5
12.5
falox L-1
3.85e82.81e81.66e89.7e7
st.dev.L-1
6.3e71.4e71.4e71.7e7
gmobility
1.22e0
st.dev.
2.7e-1
initial pH final pH
7.45
t, hr
7.66
hni/ni° iE(k12*ni) ja
4.5 .73 2.391e-3 8.130e-38.5 .43 2.391e-3 1.150e-2
12.5 .25 2.391e-3 1.281e-24.5-8.5 .59 2.391e-3 1.529e-2
4.5-12.5 .35 2.391e-3 1.545e-28.5-12.5 .58 2.391e-3 1.561e-2
ave 1.313e-2
aHiac particle counter size range, gmbAve, silica particle size for size range, gmcConc. of silica partilces from counter for size rangedCalculated as per equation (4)e (ki2ni/Eki2ni) x 100From SEM photos
ggms-1/V cm -11aluminum (hydr)oxide colloids}total from above3 Calculated from equation (2)
69
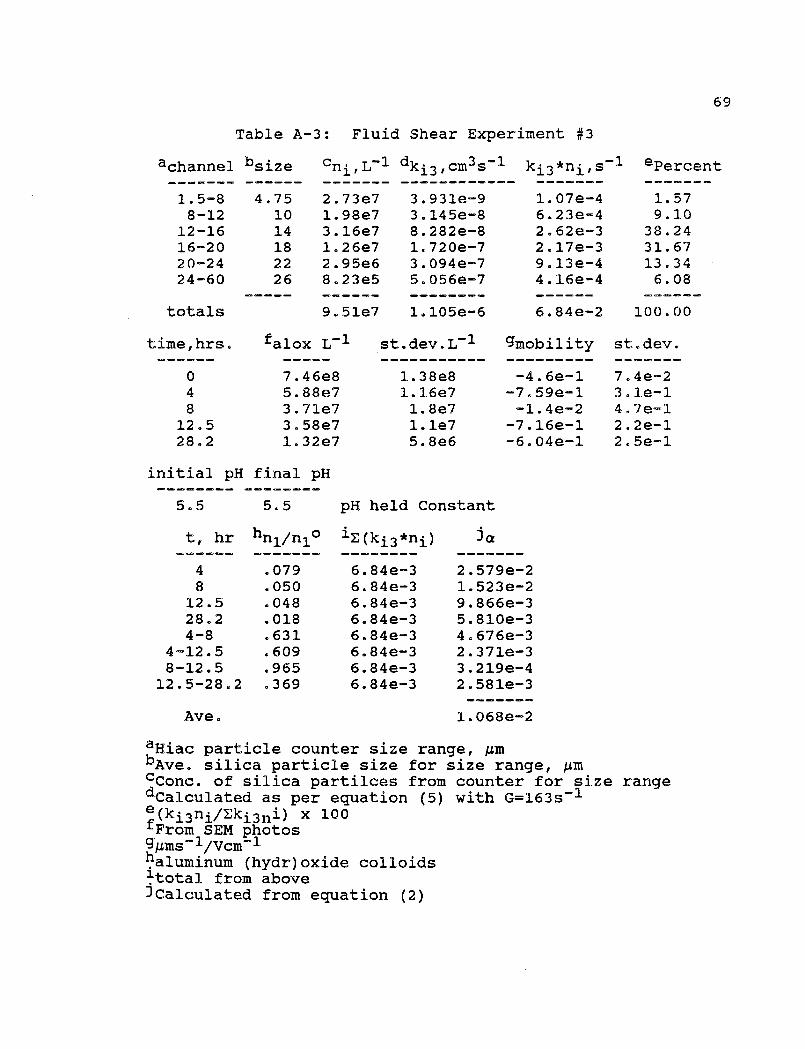
Table A-3: Fluid Shear Experiment #3
achannel bsize cn. L-1 d s-1ki3,cm 3 ki3*ni,s-1 ePercent
1.5-8 4.75 2.73e7 3.931e-9 1.07e-4 1.578-12 10 1.98e7 3.145e-8 6.23e-4 9.10
12-16 14 3.16e7 8.282e-8 2.62e-3 38.2416-20 18 1.26e7 1.720e-7 2.17e-3 31.6720-24 22 2.95e6 3.094e-7 9.13e-4 13.3424-60 26 8.23e5 5.056e-7 4.16e-4 6.08
totals 9.51e7 1.105e-6 6.84e-2 100.00
time,hrs. falox L-1 st.dev.L-1 gmobility st.dev.
0 7.46e8 1.38e8 -4.6e-1 7.4e-24 5.88e7 1.16e7 -7059e-1 3.1e-18 3.71e7 1.8e7 -1.4e-2 4.7e-1
12.5 3.58e7 1.1e7 -7.16e-1 2.2e-128.2 1.32e7 5.8e6 -6.04e-1 2.5e-1
initial pH final pH
5.5
t, hr
5.5
bni/nic
pH held Constant
1E(k13*ni) ja
4 .079 6.84e-3 2.579e-28 .050 6.84e-3 1.523e-2
12.5 .048 6.84e-3 9.866e-328.2 .018 6.84e-3 5.810e-34-8 .631 6.84e-3 4.676e-3
4-12.5 .609 6.84e-3 2.371e-38-12.5 .965 6.84e-3 3.219e-412.5-28.2 .369 6.84e-3 2.581e-3
Ave. 1.068e-2
aHiac particle counter size range, gmbAve, silica particle size for size range, gmcConc. of silica partilces from counter for size rangedCalculated as per equation (5) with G=163s-1e (ki3ni/Eki3 ni) x 100From SEM photos
ggms-1/Vcm-1(hydr)oxide colloids
3.-total from above]Calculated from equation (2)
70
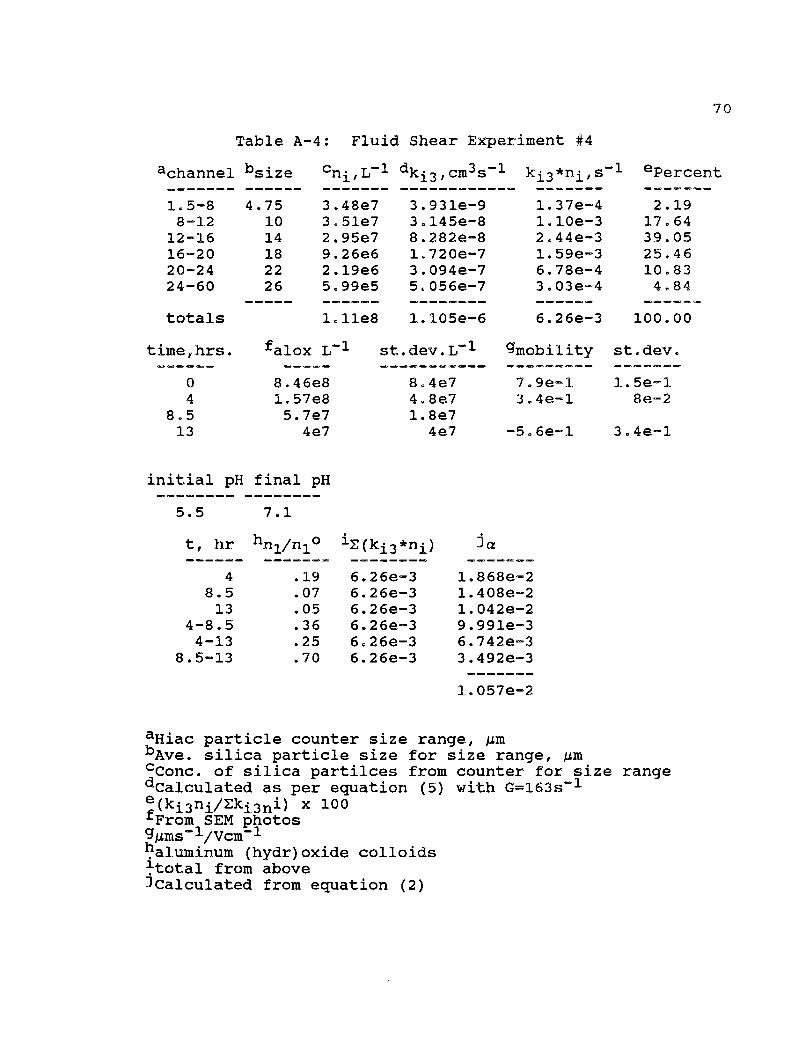
Table A-4: Fluid Shear Experiment #4
achannel bsize cni,L-1--s-1‘"" ki3*ni,s-1'13, 3 ePercent
1.5-8 4.75 3.48e7 3.931e-9 1.37e-4 2.198-12 10 3.51e7 3.145e-8 1.10e-3 17.64
12-16 14 2.95e7 8.282e-8 2.44e-3 39.0516-20 18 9.26e6 1.720e-7 1.59e-3 25.4620-24 22 2.19e6 3.094e-7 6.78e-4 10.8324-60 26 5.99e5 5.056e-7 3.03e-4 4.84
totals 1.11e8 1.105e-6 6.26e-3 100.00
time,hrs. falox L-1 st.dev.L-1 gmobility st.dev.
0 8.46e8 8.4e7 7.9e-1 1.5e-14 1.57e8 4.8e7 3.4e-1 8e-2
8.5 5.7e7 1.8e713 4e7 4e7 -5.6e-I 3.4e-1
initial pH final pH
5.5
t, hr
7.1
bni/nics iE(k13*ni) ja
4 .19 6.26e-3 1.868e-28.5 .07 6.26e-3 1.408e-213 .05 6.26e-3 1.042e-2
4-8.5 .36 6.26e-3 9.991e-34-13 .25 6.26e-3 6.742e-3
8.5-13 .70 6.26e-3 3.492e-3
1.057e-2
aHiac particle counter size range, gmbAve, silica particle size for size range, gmcConc. of silica partilces from counter for size rangedCalculated as per equation (5) with G=163s-1e (ki3ni/Eki3 ni) x 100From SEM photos
ggms-1/Vcm-1'aluminum (hydr)oxide colloidstotal from above3Calculated from equation (2)
71
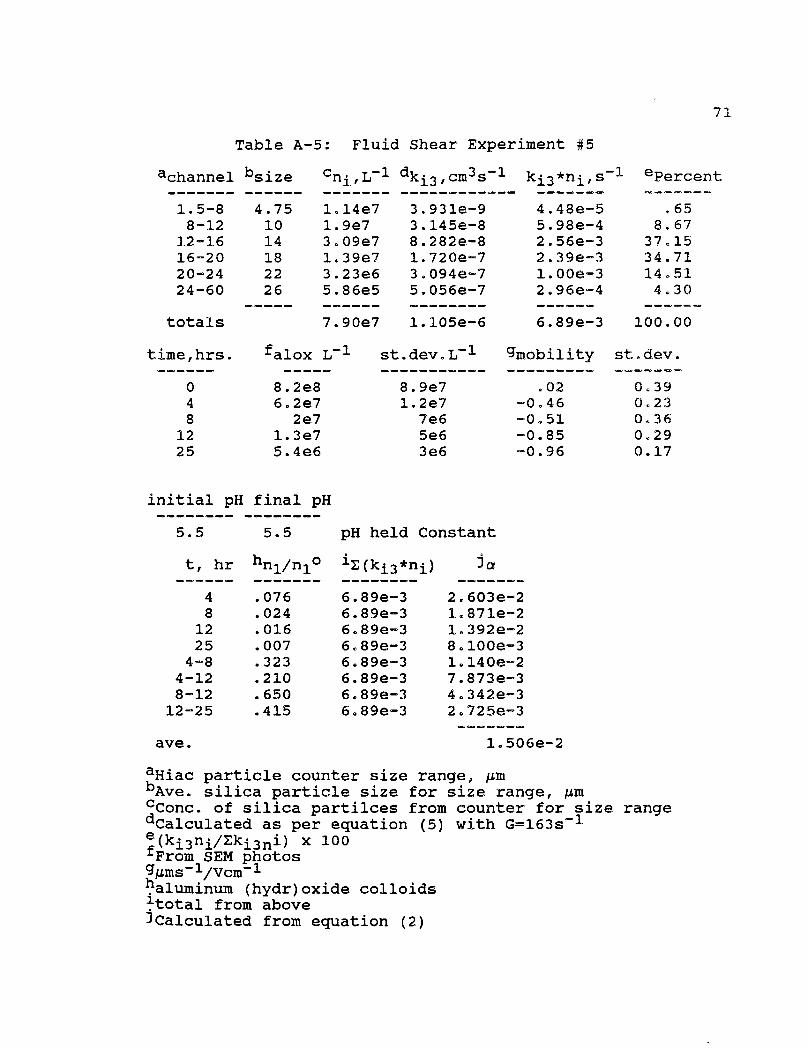
Table A-5: Fluid Shear Experiment #5
achannel bsize cni,L-1 dki3 1 cm3 s-1 ki3*n1,s-1 ePercent
1.5-8 4.75 1.14e7 3.931e-9 4.48e-5 .658-12 10 1.9e7 3.145e-8 5.98e-4 8.67
12-16 14 3.09e7 8.282e-8 2.56e-3 37.1516-20 18 1.39e7 1.720e-7 2.39e-3 34.7120-24 22 3.23e6 3.094e-7 1.00e-3 14.5124-60 26 5.86e5 5.056e-7 2.96e-4 4.30
totals 7.90e7 1.105e-6 6.89e-3 100.00
time,hrs. falox L-1 st.dev.L-1 gmobility st.dev.-------
0 8.2e8 8.9e7 .02 0.394 6 • 2e7 1.2e7 -0.46 0.238 2e7 7e6 -0.51 0.36
12 1.3e7 5e6 -0.85 0.2925 5.4e6 3e6 -0.96 0.17
initial pH final pH
5.5
t, hr
5.5
hni/ni°
pH held Constant
1E(ki3*ni) ja-------
4 .076 6.89e-3 2.603e-28 .024 6.89e-3 1.871e-2
12 .016 6.89e-3 1.392e-225 .007 6.89e-3 8.100e-3
4-8 .323 6.89e-3 1.140e-24-12 .210 6.89e-3 7.873e-38-12 .650 6.89e-3 4.342e-3
12-25 .415 6.89e-3 2.725e-3-------
ave. 1.506e-2
aHiac particle counter size range, gmbAve, silica particle size for size range, gmcConc• of silica partilces from counter for size rangedCalculated as per equation (5) with G=163s-1e (ki3ni/Eki3 ni) x 100From SEM photos
ggms-1/Vcm-11a1uminum (hydr)oxide colloids1.-total from above3 Calculated from equation (2)

72
Table A-6: Fluid Shear Experiment #6
achannel bsize cni,L-1 dki3,cm 3 s-1 ki3*n1,s-1 ePercent
1.5-8 4.75 5.5e7 3.931e-9 2.16e-4 3.968-12 10 2.43e7 3.145e-8 7.64e-4 14.01
12-16 14 2.35e7 8.282e-8 1.95e-3 35.6916-20 18 8.79e6 1.720e-7 1.51e-3 27.7320-24 22 2.13e6 3.094e-7 6.59e-4 12.0924-60 26 7.03e5 5.056e-7 3.55e-4 6.52
totals 1.14e8 1.105e-6 5.45e-3 100.00
time,hrs. falox L gmobility st.dev.
0 9.47e8 8.3e7 .81 .132 .89 .094 7.72e8 1.3e8 .49 .108 5.45e8 4.4e7 .67 .13
12 5.52e8 3.2e7 .77 .1424 5.56e8 3.7e7 .50 .1728 .37 .0330 2.29e8 4.1e7 -.68 .1233 6.39e7 1.03e7 -.46 .13
pH
5.5 (0-24HRS),
t, hr hnl/ni°
6.5 (24-28HRS), 7 (28-33HRS)
Z(ki3*ni) ja
4 .815 5.45e-3 2.603e-38 .583 5.45e-3 3.439e-3
12 .587 5.45e-3 2.262e-324 .587 5.45e-3 1.131e-330 .242 5.45e-3 2.412e-333 .067 5.45e-3 4.164e-3
4-8 .706 5.45e-3 4.437e-38-12 1.013 5.45e-3 -1.63e-4
12-24 1.007 5.45e-3 -3.07e-524-30 .412 5.45e-3 7.535e-330-33 .279 5.45e-3 2.169e-2
•ave 4.498e-3
aHiac particle counter size range, AmbAve, silica particle size for size range, AmcConc. of silica partilces from counter for size rangedCalculated as per equation (5) with G= 163s -1e (k13n1/Eki3 ni) x 100, From SEM.photos, gAms-1/Vcm-1haluminum (hydr)oxide colloids, 3Calculated from equa. (2)
73
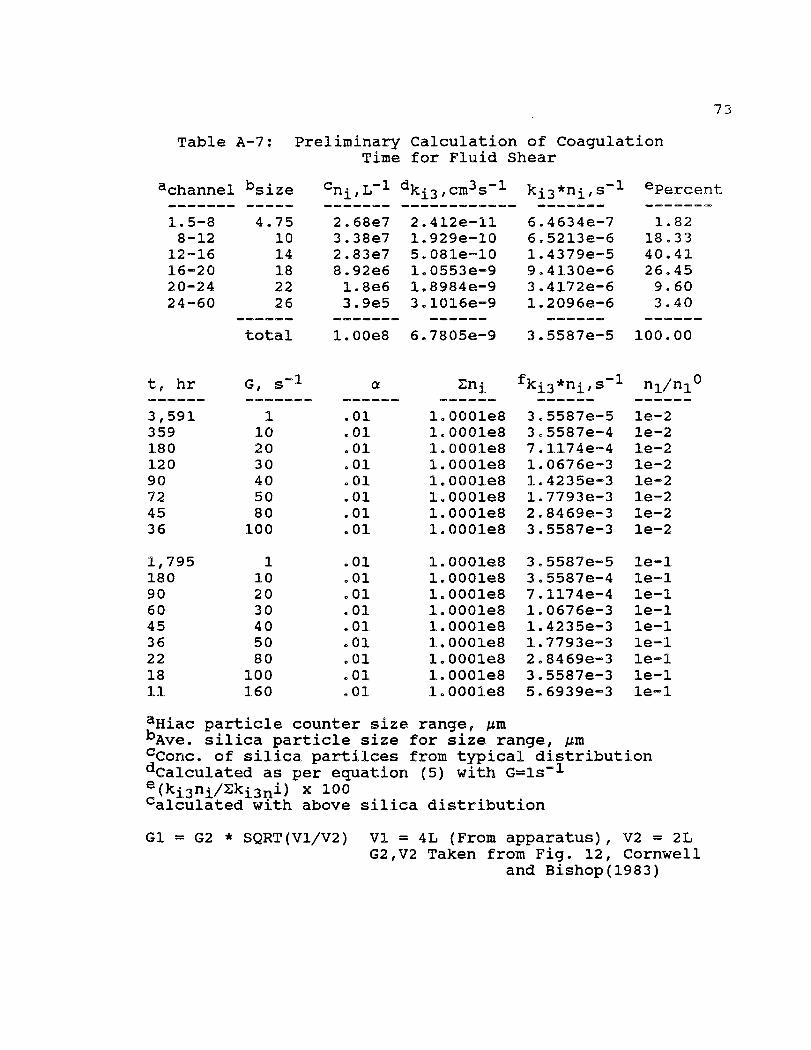
Table A-7: Preliminary Calculation of CoagulationTime for Fluid Shear
achannel bsize ni,L-1 dki3,cm 3 s-1 ki3*ni,s-1 ePercent
1.5-8 4.75 2.68e7 2.412e-11 6.4634e-7 1.828-12 10 3.38e7 1.929e-10 6.5213e-6 18.33
12-16 14 2.83e7 5.081e-10 1.4379e-5 40.4116-20 18 8.92e6 1.0553e-9 9.4130e-6 26.4520-24 22 1.8e6 1.8984e-9 3.4172e-6 9.6024-60 26 3.9e5 3.1016e-9 1.2096e-6 3.40
total 1.00e8 6.7805e-9 3.5587e-5 100.00
t, hr G, s -1 aEni fki3*ni,s -1 ni/ni°
3,591 1 .01 1.0001e8 3.5587e-5 le-2359 10 .01 1.0001e8 3.5587e-4 le-2180 20 .01 1.0001e8 7.1174e-4 le-2120 30 .01 1.0001e8 1.0676e-3 le-290 40 .01 1.0001e8 1.4235e-3 le-272 50 .01 1.0001e8 1.7793e-3 le-245 80 .01 1.0001e8 2.8469e-3 le-236 100 .01 1.0001e8 3.5587e-3 le-2
1,795 1 .01 1.0001e8 3.5587e-5 le-1180 10 .01 1.0001e8 3.5587e-4 le-190 20 .01 1.0001e8 7.1174e-4 le-160 30 .01 1.0001e8 1.0676e-3 le-145 40 .01 1.0001e8 1.4235e-3 le-136 50 .01 1.0001e8 1.7793e-3 le-122 80 .01 1.0001e8 2.8469e-3 le-118 100 .01 1.0001e8 3.5587e-3 le-111 160 .01 1.0001e8 5.6939e-3 le-1
aHiac particle counter size range, gmbAve, silica particle size for size range, gmcConc, of silica partilces from typical distributiondCalculated as per equation (5) with G=ls-1e (ki3ni/Eki3 ni) x 100calculated with above silica distribution
G1 = G2 * SQRT(V1/V2) V1 = 4L (From apparatus), V2 = 2LG2,V2 Taken from Fig. 12, Cornwell
and Bishop(1983)

APPENDIX BMOBILITY EXPERIMENTS
74

75
Table B-1: Mobility of Aluminum Oxide Colloidsin the Presence of Dissolved Silica
RECIPE: 0.001M BICARB, 0.009M NaC1, 6Oppm(1mM) silica
TIME(MIN) MOBILITY ST. DEV.
5 .97 .23
20 .66 .15
40 .73 .19
90
-.65 .17
160
-.65 .17
90 .96 .19 WITHOUT SILICAAS A BLANK
MOBILITY OF ALOX IN THE PRESENCE OF WASHED MIN-U-SIL
CONDITIONS:
pH 5.5NaC1 0.009MNaHCO3 0.001MSES P/L ALOXSE? P/L MS MS HEATED AT 400 C FOR 24 HRS.,
WASHED WITH 4N HNO3 AND 4N NaOH EACH FORFOLLOWED BY MILI-0 WASHES AND DECANTINGS
' UNTIL ALL FINES REMOVED AND PH -7.0.
MOBILITYTIME(MIN)
(UM/SEC)/(VOLT/CM)WTIH MS WITHOUT MS
560
150
.93-.59-.36
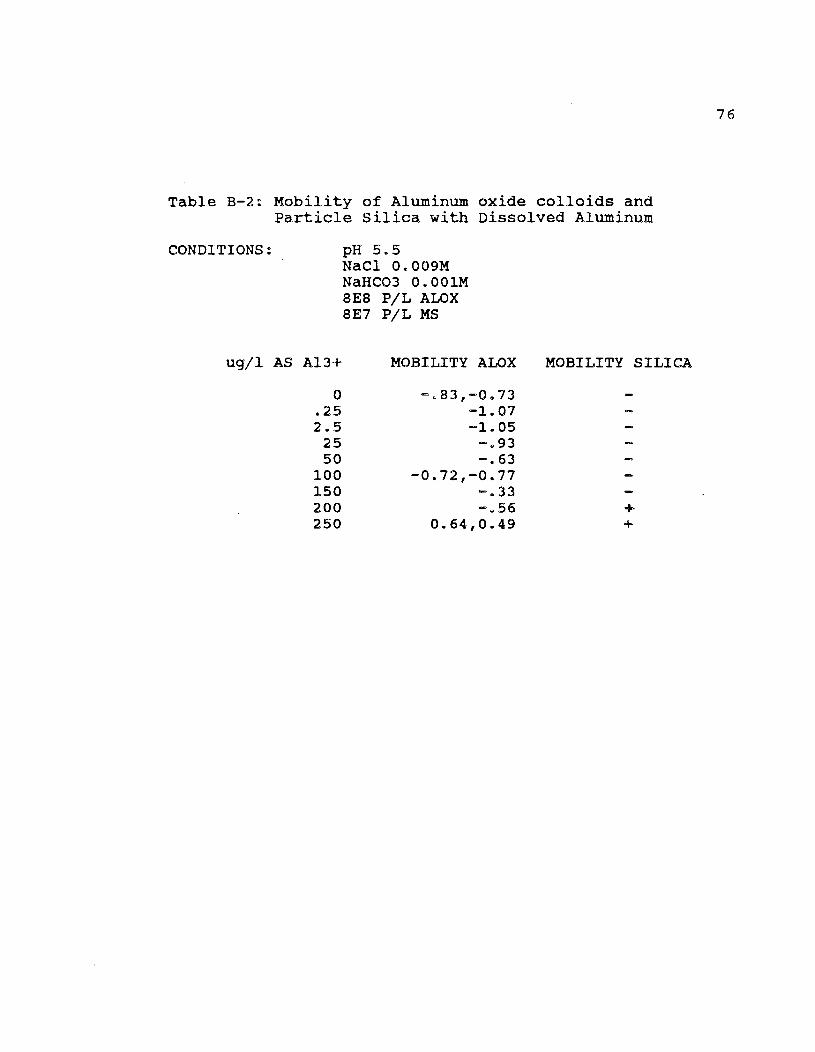
Table B-2: Mobility of Aluminum oxide colloids andParticle Silica with Dissolved Aluminum
CONDITIONS: pH 5.5NaC1 0.009MNaHCO3 0.001M8E88E7
P/L ALOXP/L MS
ug/1 AS A1 3+ MOBILITY ALOX MOBILITY SILICA
0 -.83,-0.73.252.5
-1.07-1.05
/XL
affIa
25 -.9350 -.63 020
100 -0.72,-0.77150 -.33200 -.56250 0.64,0.49
76
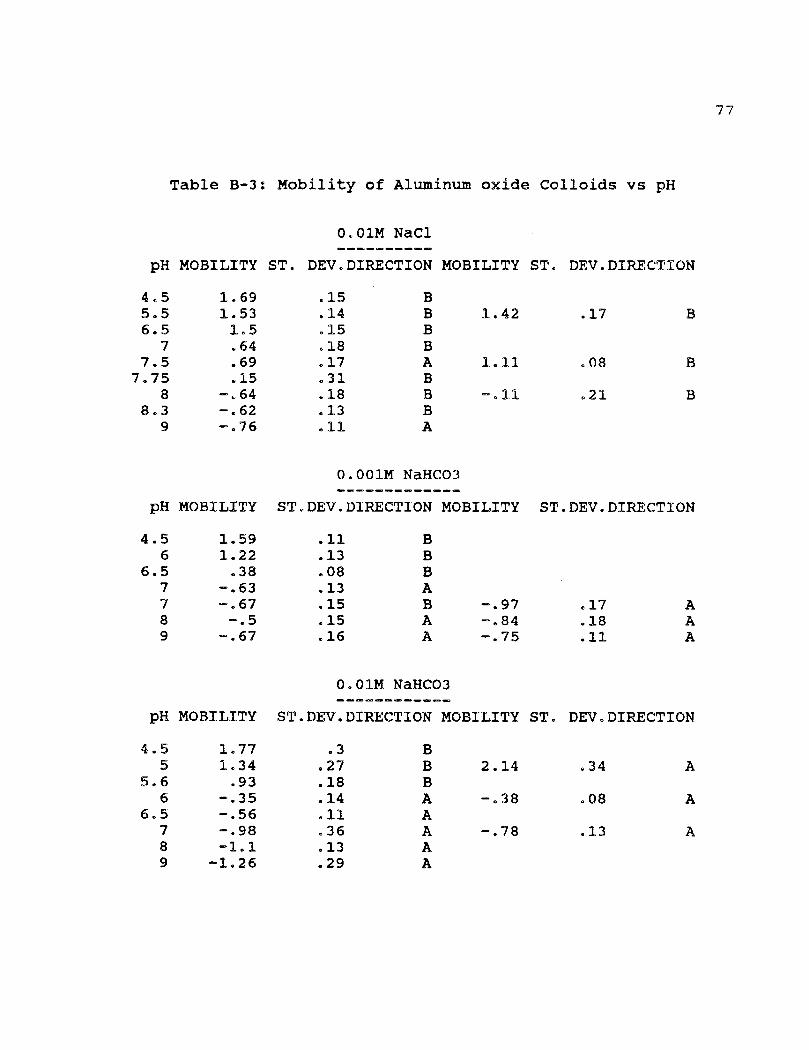
Table B-3: Mobility of Aluminum oxide Colloids vs pH
0.01M NaC1
pH MOBILITY ST. DEV.DIRECTION MOBILITY ST. DEV.DIRECTION
4.5 1.69 .15 B5.5 1.53 .14 B 1.42 .17 B6.5 1.5 .15 B
7 .64 .18 B7.5 .69 .17 A 1.11 .08 B7.75 .15 .31 B
8 -.64 .18 B -.11 .21 B8.3 -.62 .13 B
9 -.76 .11 A
pH MOBILITY
0.001M NaHCO3
ST.DEV.DIRECTION MOBILITY ST.DEV.DIRECTION
4.5 1.59 .11 B6 1.22 .13 B
6.5 .38 .08 B7 -.63 .13 A7 -.67 .15 B -.97 .17 A8 -.5 .15 A -.84 .18 A9 -.67 .16 A -.75 .11 A
0.01M NaHCO3
pH MOBILITY ST.DEV.DIRECTION MOBILITY ST. DEV.DIRECTION
4.5 1.77 .3 B5 1.34 .27 B 2.14 .34 A
5.6 .93 .18 B6 -.35 .14 A -.38 .08 A
6.5 -.56 .11 A7 -.98 .36 A -.78 .13 A8 -1.1 .13 A9 -1.26 .29 A
77
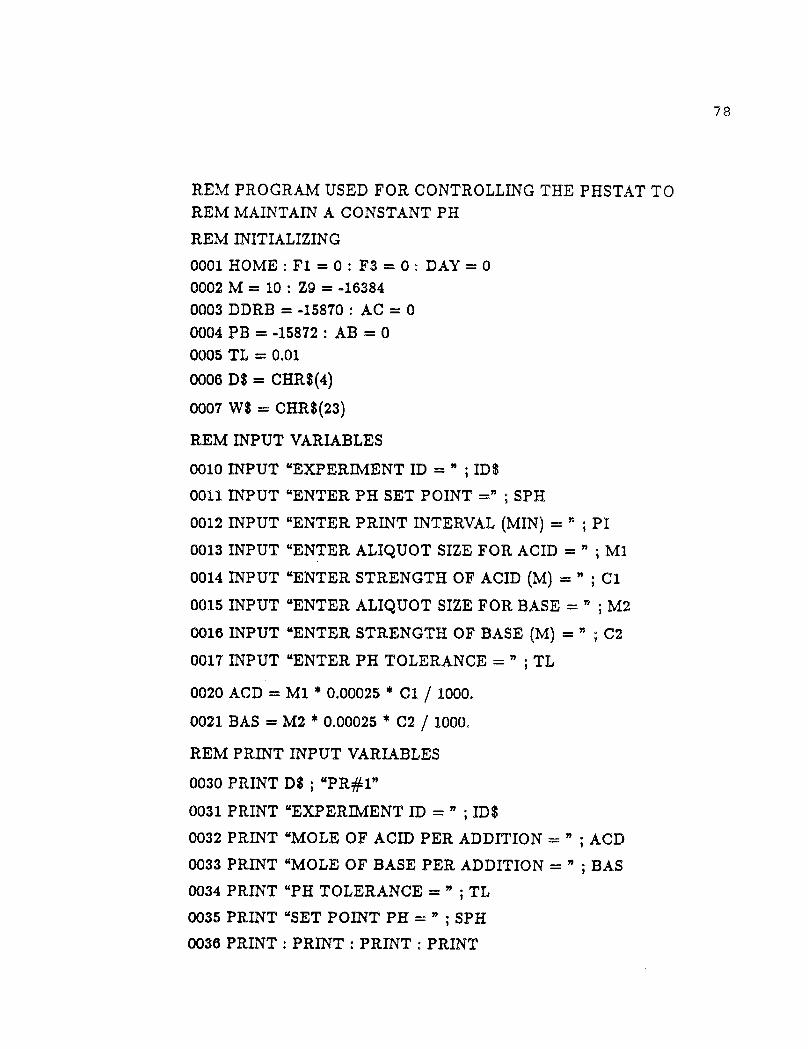
REM PROGRAM USED FOR CONTROLLING THE PHSTAT TOREM MAINTAIN A CONSTANT PH
REM INITIALIZING
0001 HOME : Fl = 0 : F3 = 0 : DAY =00002 M = 10: Z9 = -163840003 DDRB = -15870: AC = 00004 PB = -15872: AB = 00005 TL = 0.01
0006 D$ = CHRS(4)
0007 W$ = CHR$(23)
REM INPUT VARIABLES
0010 INPUT "EXPERIMENT ID =" ; ID$
0011 INPUT "ENTER PH SET POINT =" ; SPH
0012 INPUT "ENTER PRINT INTERVAL (MIN) = " ; PI
0013 INPUT "ENTER ALIQUOT SIZE FOR ACID =" ; MI
0014 INPUT "ENTER STRENGTH OF ACID (M) =" ; Cl
0015 INPUT "ENTER ALIQUOT SIZE FOR BASE =" ; M2
0016 INPUT "ENTER STRENGTH OF BASE (M) =" ; C2
0017 INPUT "ENTER PH TOLERANCE =" ; TL
0020 ACD = M1 * 0.00025 * Cl / 1000.
0021 BAS = M2 * 0.00025 * C2 / 1000.
REM PRINT INPUT VARIABLES
0030 PRINT D$; "PR#1"
0031 PRINT "EXPERIMENT ID =" ; 1D$0032 PRINT "MOLE OF ACID PER ADDITION =" ; ACD
0033 PRINT "MOLE OF BASE PER ADDITION =" ; BAS
0034 PRINT "PH TOLERANCE =" ; TL
0035 PRINT "SET POINT PH =" ; SPH
0036 PRINT : PRINT : PRINT : PRINT
78
79
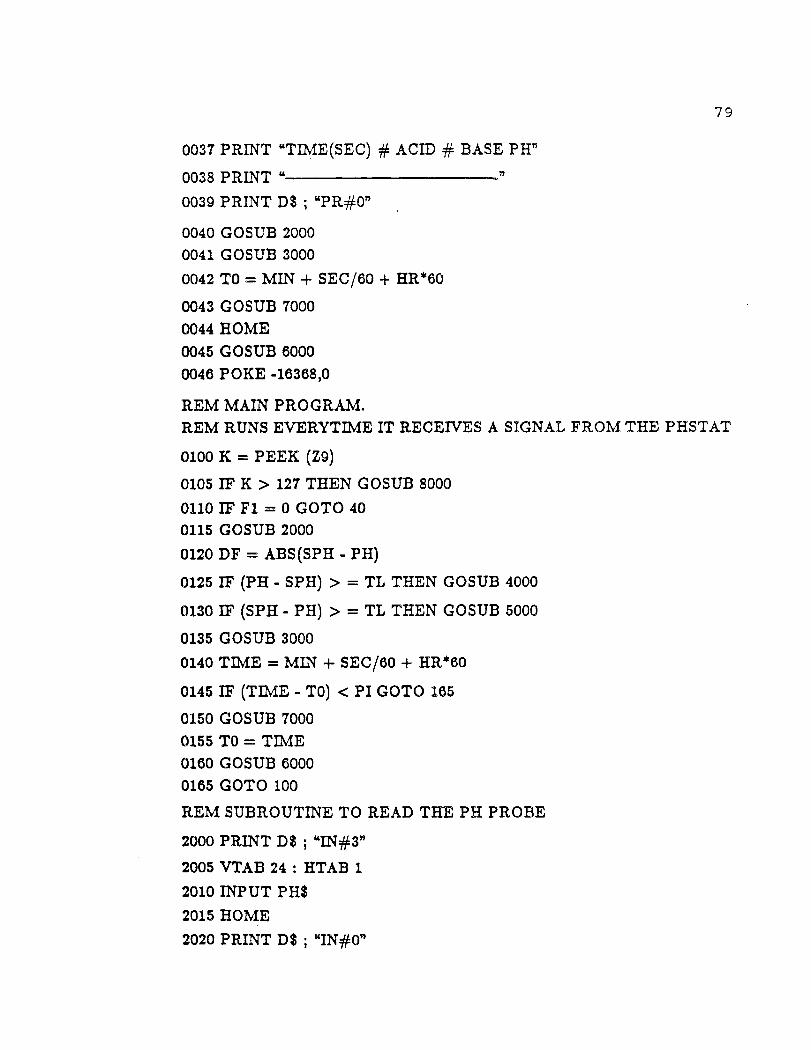
0037 PRINT "TIME(SEC) # ACID # BASE PH"
0038 PRINT "
0039 PRINT D$; "PR#0"
0040 GOSUB 20000041 GOSUB 3000
0042 TO = MIN + SEC/60 + HR*60
0043 GOSUB 70000044 HOME0045 GOSUB 60000046 POKE -16368,0
REM MAIN PROGRAM.REM RUNS EVERYTIME IT RECEIVES A SIGNAL FROM THE PHSTAT
0100 K = PEEK (Z9)
0105 IF K> 127 THEN GOSUB 8000
0110 IF Fl = 0 GOTO 400115 GOSUB 2000
0120 DF = ABS(SPH - PH)
0125 IF (PH - SPH) > = TL THEN GOSUB 4000
0130 IF (SPH - PH) > = TL THEN GOSUB 5000
0135 GOSUB 3000
0140 TIME = MIN + SEC/60 + HR*60
0145 IF (TIME - TO) <Pi GOTO 165
0150 GOSUB 70000155 TO = TIME0160 GOSUB 60000165 GOTO 100
REM SUBROUTINE TO READ THE PH PROBE
2000 PRINT D$; "IN#3"
2005 VTAB 24: HTAB 1
2010 INPUT PH$
2015 HOME2020 PRINT D$ ; "IN#0"

2025 PH = VAL (LEFT$ (PH$ , 7))
2030 PH = INT (PH * 1000 + 0.5)/1000
2035 RETURN
REM SUBROUTINE TO READ THE CLOCK
3000 PRINT D$
3005 PRINT D$ "PR#3"
3010 PRINT W$ ; "C"
3015 INPUT T$
3020 PRINT D$ "IN#0"
3025 PRINT D$ "PR#0"
3030 HR = VAL (MID$ (T$, 12, 2))
3035 MIN = VAL (M1D$ (T$, 15, 2))
3040 SEC = VAL (M1D$ (T$, 18, 2))
3045 IF Fl < > 0 GOTO 3060
3050 IHR = HR : IlviIN = MIN : ISEC = SEC
3055 F1 = 1
3060 IF SEC> = ISEC GOTO 3075 .
3065 MIN = MIN - : SEC = SEC + 60 - ISEC
3070 GOTO 3080
3075 SEC = SEC - ISEC
3080 IF MIN> = Ev1IN GOTO 3095
3090 HR = HR - 1: MIN = MIN +60 - IMIN
3095 GOTO 3105
3100 MIN = MIN -IMIN
3105 GOSUB 9000
3110 0$ = RIGHT$ (T$, 8) : D7$ = LEFT$ (T$, 11)
3115 RETURN
REM SUBROUTINE FOR ACID ADDITION
4000 POKE DDRB, 255
4005 FOR I = 1 TO M1
4010 POKE PB, 1
4015 JJ = 0
80
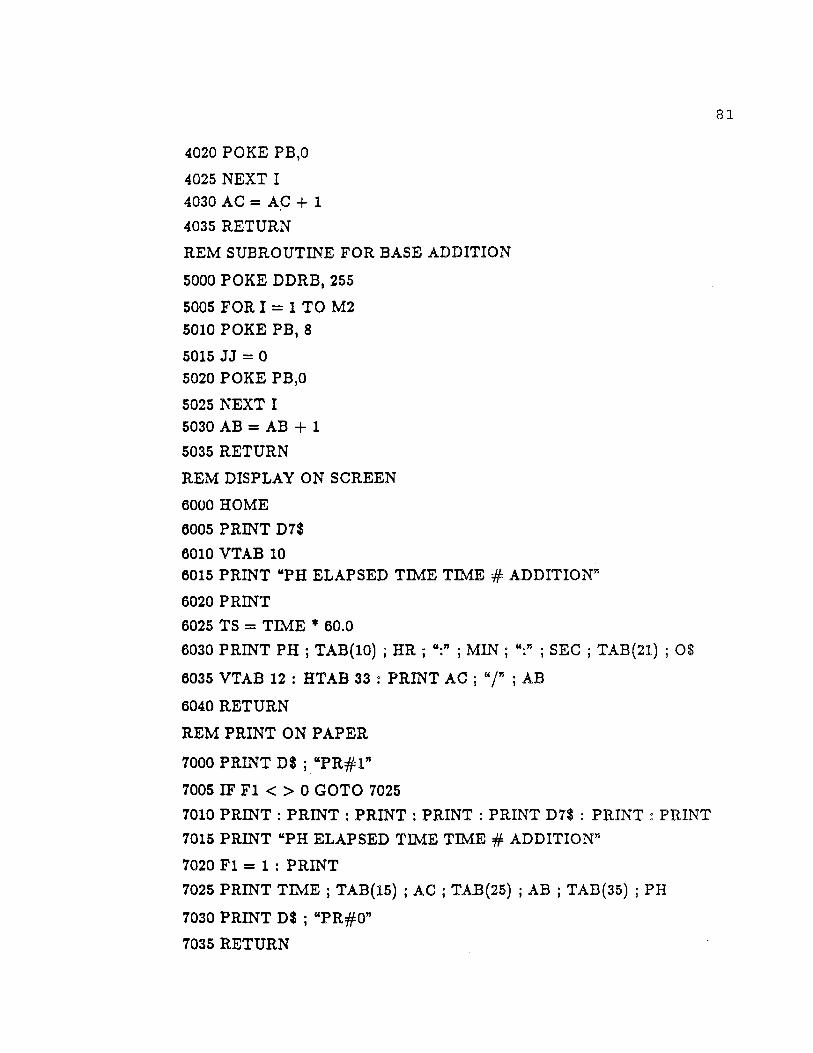
4020 POKE PB 4 O
4025 NEXT I4030 AC = AC + 1
4035 RETURN
REM SUBROUTINE FOR BASE ADDITION
5000 POKE DDRB, 255
5005 FOR I = 1 TO M25010 POKE PB, 8
5015 JJ = 05020 POKE PB 4 O
5025 NEXT I5030 AB = AB + 1
5035 RETURN
REM DISPLAY ON SCREEN
6000 HOME
8005 PRINT D7$
6010 VTAB 106015 PRINT "PH ELAPSED TIME TIME # ADDITION"
6020 PRINT
6025 TS = TIME * 60.0
6030 PRINT PH ; TAB(10) ; HR; ":" ; MIN; ":" ; SEC ; TAB(21) ; 0$
8035 VTAB 12: HTAB 33: PRINT AC; "/" ; AB
6040 RETURN
REM PRINT ON PAPER
7000 PRINT D$; "PR#1”
7005 IF Fl < > 0 GOTO 70257010 PRINT : PRINT : PRINT : PRINT : PRINT D7$ : PRINT : PRINT7015 PRINT "PH ELAPSED TIME TIME # ADDITION"
7020 F1 = 1 : PRINT
7025 PRINT TIME ; TAB(15) ; AC ; TAB(25) ; AB ; TAB(35) ; PH
7030 PRINT D$ ; "PR#On
7035 RETURN
81
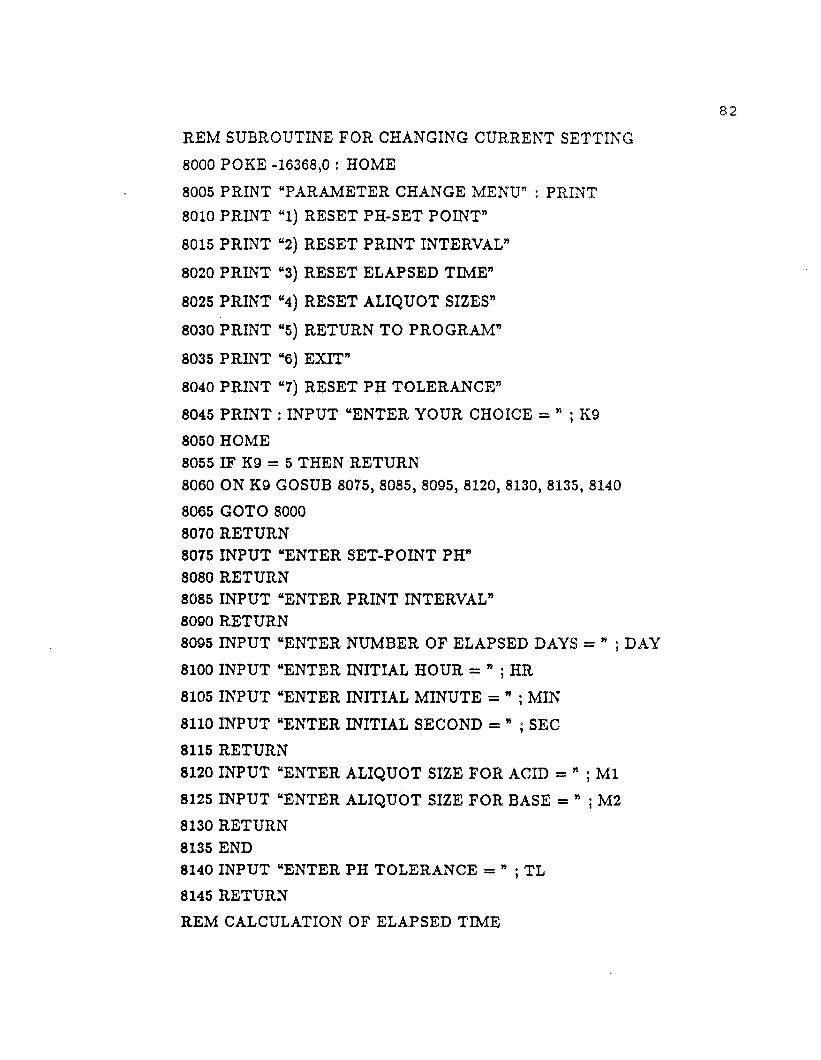
REM SUBROUTINE FOR CHANGING CURRENT SETTING
8000 POKE -16368,0: HOME
8005 PRINT "PARAMETER CHANGE MENU" : PRINT8010 PRINT "1) RESET PH-SET POINT"
8015 PRINT "2) RESET PRINT INTERVAL'
8020 PRINT "3) RESET ELAPSED TIME"
8025 PRINT "4) RESET ALIQUOT SIZES"
8030 PRINT "5) RETURN TO PROGRAM"
8035 PRINT "6) EXIT"
8040 PRINT "7) RESET PH TOLERANCE"
8045 PRINT: INPUT "ENTER YOUR CHOICE =" ; K9
8050 HOME8055 IF K9 = 5 THEN RETURN8060 ON K9 GOSUB 8075, 8085, 8095, 8120, 8130, 8135, 8140
8065 GOTO 80008070 RETURN8075 INPUT "ENTER SET-POINT PH"8080 RETURN8085 INPUT "ENTER PRINT INTERVAL"8090 RETURN8095 INPUT "ENTER NUMBER OF ELAPSED DAYS =" ; DAY
8100 INPUT "ENTER INITIAL HOUR = ; HR
8105 INPUT "ENTER INITIAL MINUTE =" ; MIN
8110 INPUT "ENTER INITIAL SECOND = ; SEC
8115 RETURN8120 INPUT "ENTER ALIQUOT SIZE FOR ACID =" ; M1
8125 INPUT "ENTER ALIQUOT SIZE FOR BASE =" ; M2
8130 RETURN8135 END8140 INPUT "ENTER PH TOLERANCE =" ; TL
8145 RETURN
REM CALCULATION OF ELAPSED TIME
82
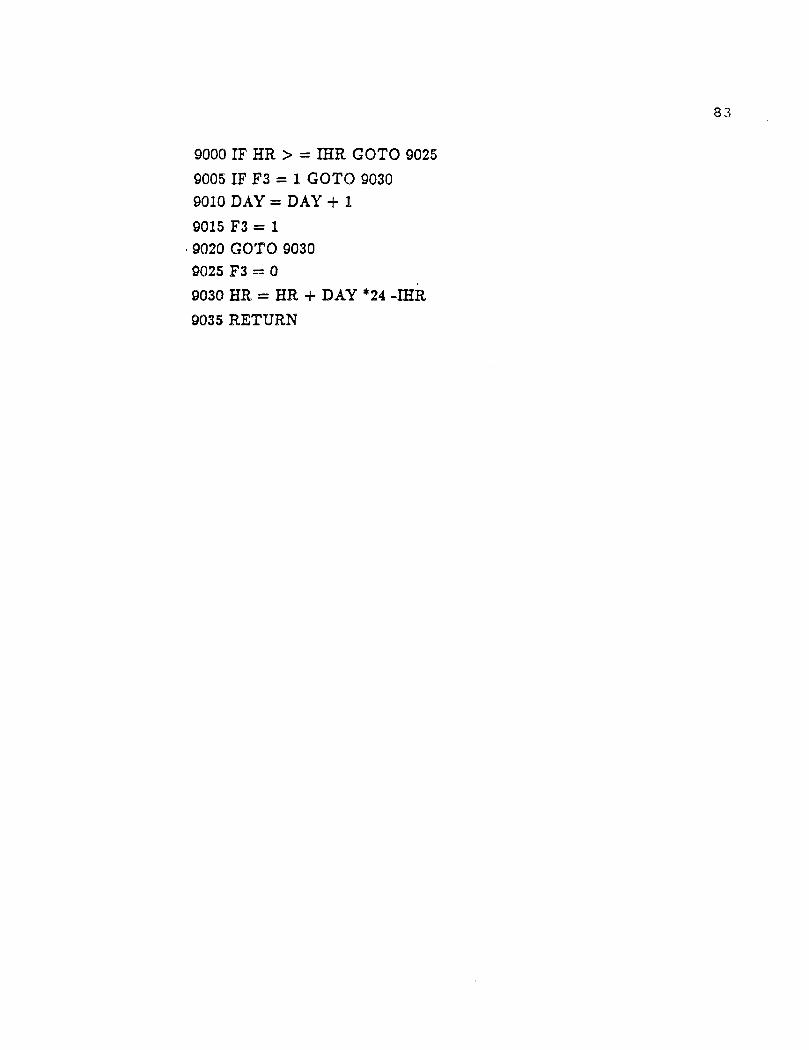
9000 IF HR > = IHR GOTO 9025
9005 IF F3 = 1 GOTO 90309010 DAY = DAY ± 1
9015 F3 = 1• 9020 GOTO 90309025 F3 = 0
9030 HR = HR + DAY *24 -IHR
9035 RETURN
83

APPENDIX CTITRATION EXPERIMENTS
84

8 5
Table C-1: RAW AND REDUCED DATA FOR ALPHA ALUMINATITRATIONS WITH DISSOLVED SILICA
TITRATION OF WATER(0.4ML OF 0.1M HC1 ADDED TO GET TO pH 3.5)
BASE Cb-CaADDED mol/L
(mL 0.114 NaOH)3.5 0 -0.0002
4 0.234 -0.000084.5 0.32 -0.00004
5 0.354 -0.000025.5 0.376 -0.00001
6 0.384 -0.000006.5 0.396 -0.00000
7 0.402 0.0000017.5 0.408 0.000004
8 0.41 0.0000058.5 0.42 0.00001
9 0.452 0.0000269.5 0.564 0.00008210 0.86 0.00023
TITRATION OF 10E-314 SILICA(4.5614L OF 0.114 HC1 ADDED TO GET TO pH 3.5)
BASE Cb-CaADDED mol/L
(mL 0.114 NaOH)3.5 0 -0.00228
4 0.35 -0.002104.5 0.47 -0.00204
5 0.516 -0.002025.5 0.53 -0.00201
6 0.546 -0.002006.5 0.556 -0.00200
7 0.56 -0.0027.5 0.574 -0.00199
8 0.604 -0.001978.5 0.69 -0.00193
9 0.91 -0.001829.5 1.39 -0.0015810 2.54 -0.00101
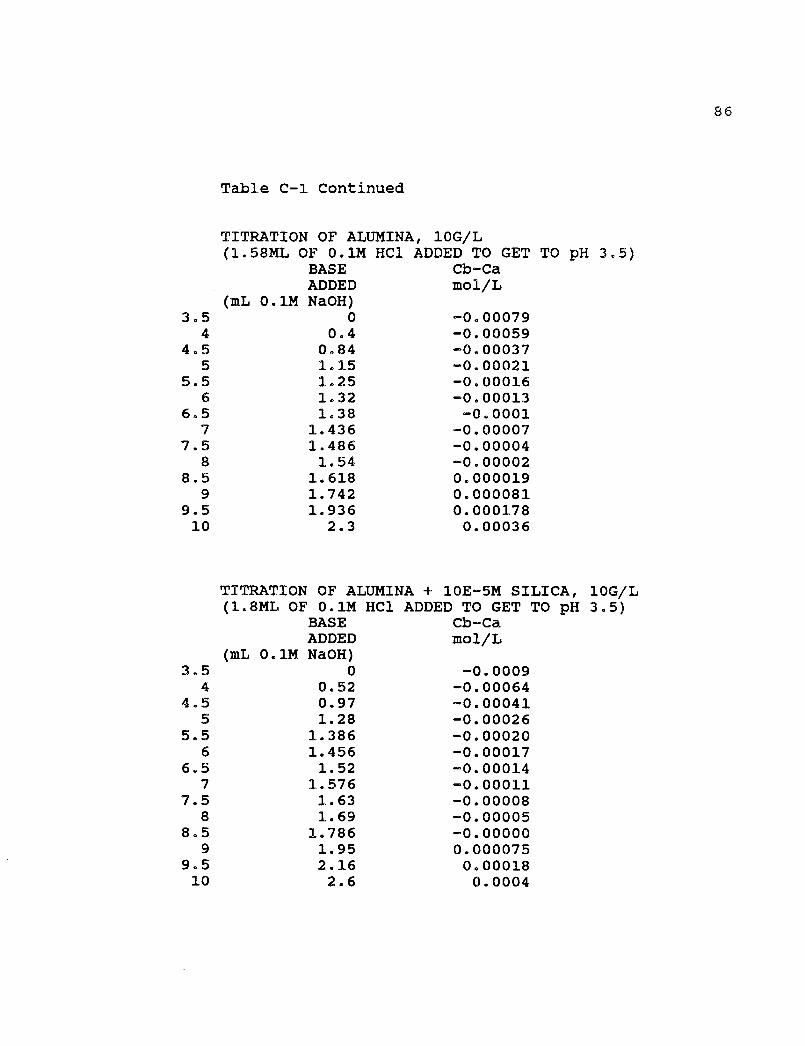
Table C-1 Continued
TITRATION OF ALUMINA, 10G/L(1.58ML OF 0.111 HC1 ADDED TO GET TO pH 3.5)
BASE Cb-CaADDED mol/L
(mL 0.1M NaOH)3.5 0 -0.00079
4 0.4 -0.000594.5 0.84 -0.00037
5 1.15 -0.000215.5 1.25 -0.00016
6 1.32 -0.000136.5 1.38 -0.0001
7 1.436 -0.000077.5 1.486 -0.00004
8 1.54 -0.000028.5 1.618 0.000019
9 1.742 0.0000819.5 1.936 0.00017810 2.3 0.00036
TITRATION OF ALUMINA + 10E-5M SILICA, 10G/L(1.8ML OF 0.1M HC1 ADDED TO GET TO pH 3.5)
BASE Cb-CaADDED mol/L
(mL 0.114 NaOH)3.5 0 -0.0009
4 0.52 -0.000644.5 0.97 -0.00041
5 1.28 -0.000265.5 1.386 -0.00020
6 1.456 -0.000176.5 1.52 -0.00014
7 1.576 -0.000117.5 1.63 -0.00008
8 1.69 -0.000058.5 1.786 -0.00000
9 1.95 0.0000759.5 2.16 0.0001810 2.6 0.0004
86
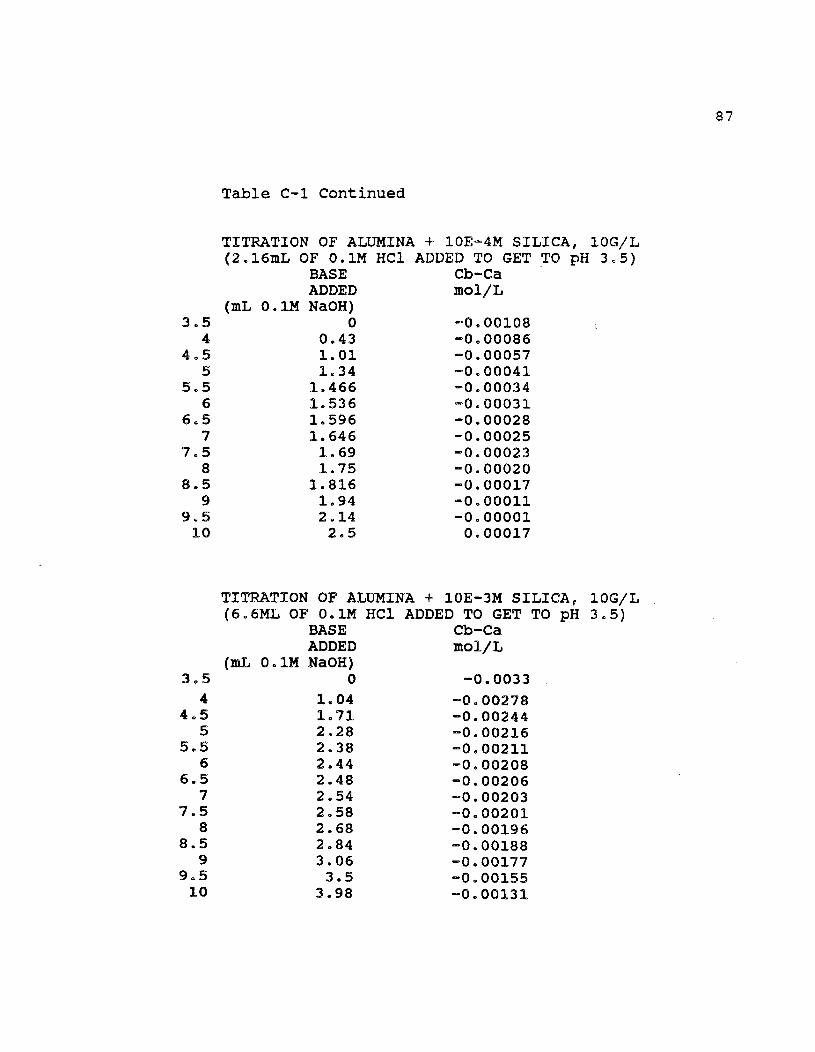
Table C-1 Continued
TITRATION OF ALUMINA + 10E-4M SILICA, 10G/L(2.16mL OF 0.1M HC1 ADDED TO GET TO pH 3.5)
BASE Cb-CaADDED mol/L
(mL 0.1M NaOH)3.5 0 -0.00108
4 0.43 -0.000864.5 1.01 -0.00057
5 1.34 -0.000415.5 1.466 -0.00034
6 1.536 -0.000316.5 1.596 -0.00028
7 1.646 -0.000257.5 1.69 -0.00023
8 1.75 -0.000208.5 1.816 -0.00017
9 1.94 -0.000119.5 2.14 -0.0000110 2.5 0.00017
TITRATION OF ALUMINA + 10E-3M SILICA, 10G/L(6.6ML OF 0.114 HC1 ADDED TO GET TO pH 3.5)
BASE Cb-CaADDED mol/L
(mL 0.114 NaOH)3.5 0 -0.0033
4 1.04 -0.002784.5 1.71 -0.00244
5 2.28 -0.002165.5 2.38 -0.00211
6 2.44 -0.002086.5 2.48 -0.00206
7 2.54 -0.002037.5 2.58 -0.00201
a 2.68 -0.001968.5 2.84 -0.00188
9 3.06 -0.001779.5 3.5 -0.0015510 3.98 -0.00131
87
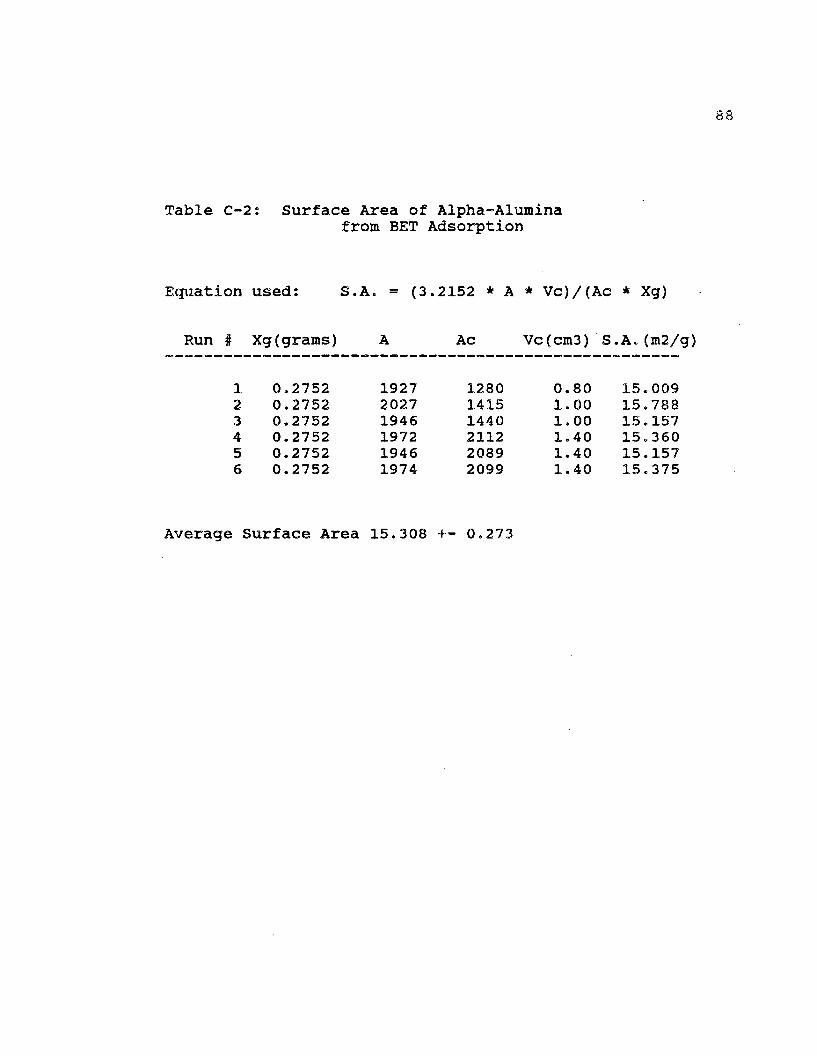
Table C-2: Surface Area of Alpha-Aluminafrom BET Adsorption
Equation used: S.A.
Run # Xg(grams)
= (3.2152 * A * Vc)/(Ac * Xg)
A Ac Vc(cm3)'S.A.(m2/g)
1 0.2752 1927 1280 0.80 15.0092 0.2752 2027 1415 1.00 15.7883 0.2752 1946 1440 1.00 15.1574 0.2752 1972 2112 1.40 15.3605 0.2752 1946 2089 1.40 15.1576 0.2752 1974 2099 1.40 15.375
Average Surface Area 15.308 +- 0.273
88
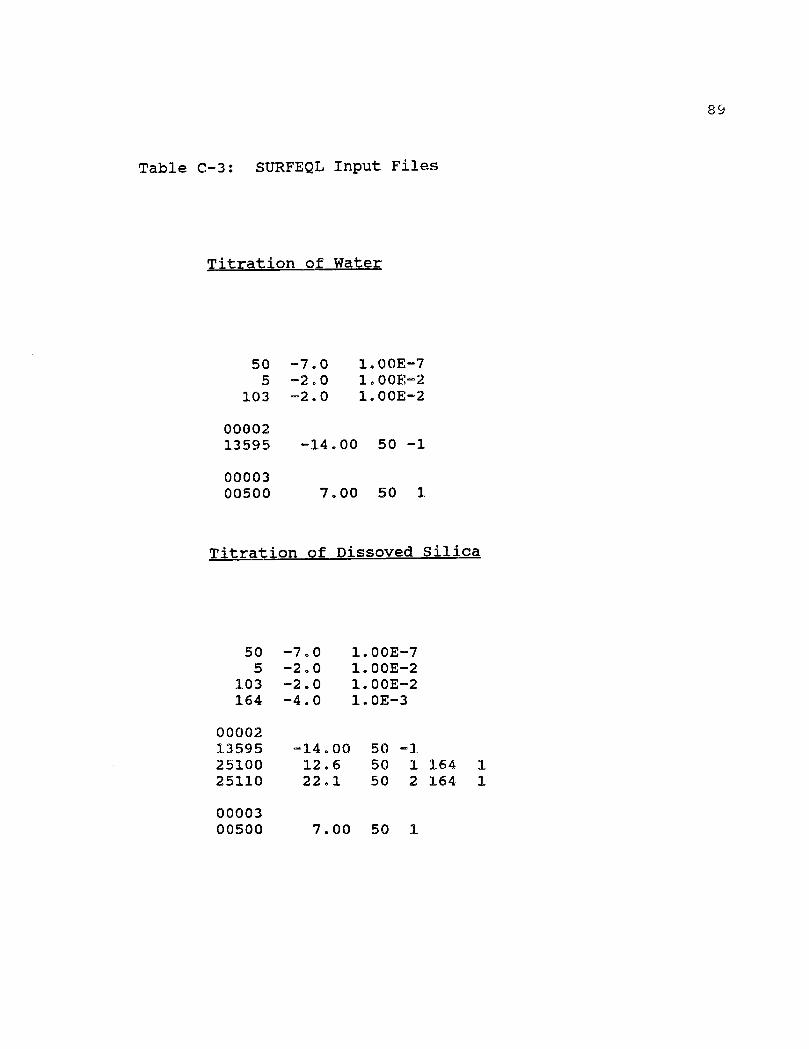
Table C-3: SURFEQL Input Files
Titration of Water
50 -7.0 1.00E-7
5 -2.0 1.00E-2
103 -2.0 1.00E-2
0000213595 -14.00 50 -1
0000300500 7.00 50 1
Titration of Dissoved Silica
50 -7.0 1.00E-75 -2.0 1.00E-2
103 -2.0 1.00E-2164 -4.0 1.0E-3
0000213595 -14.00 50 -125100 12.6 50 1 164 125110 22.1 50 2 164 1
0000300500 7.00 50 1
89

Table C-3 continued
Titration of a-Alumina
50 -7.0 1.00E-7159 -3.0 3.25E-4160 1.0 0.00E-0
5 -2.0 1.00E-2103 -2.0 1.00E-2
0000225020 -9.30 50 -1 159 1 160 -125030 6.70 50 1 159 1 160 113595 -14.00 50 -1
0000300500 7.00 50 1
0000600160
000072502025030
90
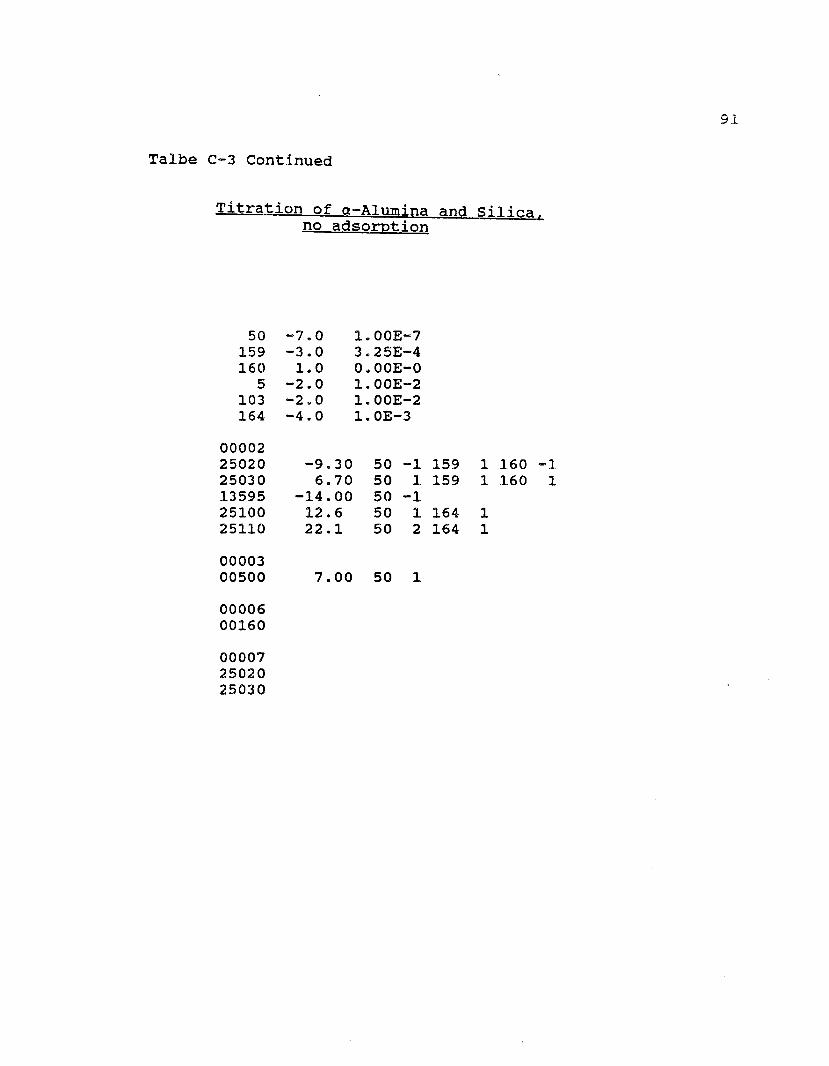
Talbe C-3 Continued
Titration of a-Alumina and Silica, no adsorption
50 -7.0 1.00E-7159 -3.0 3.25E-4160 1.0 0.00E-0
5 -2.0 1.00E-2103 -2.0 1.00E-2164 -4.0 1.0E-3
0000225020 -9.30 50 -1 159 1 160 -125030 6.70 50 1 159 1 160 113595 -14.00 50 -125100 12.6 50 1 164 125110 22.1 50 2 164 1
0000300500 7.00 50 1
0000600160
000072502025030
91
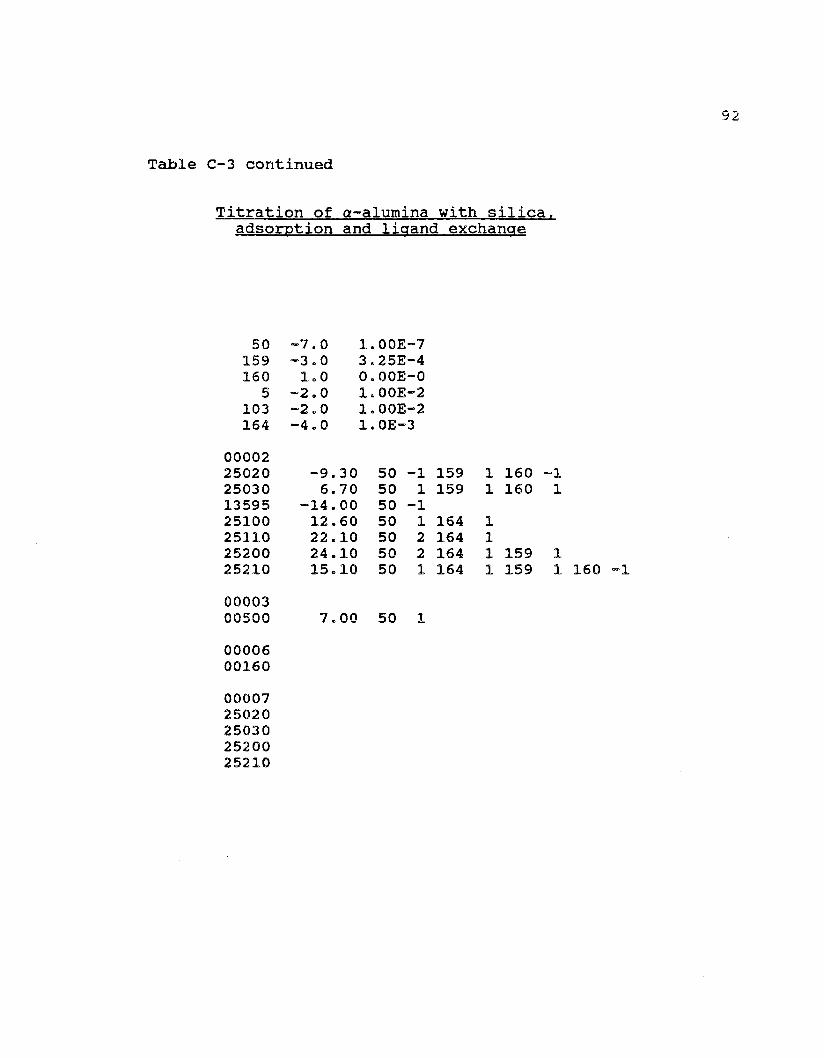
Table C-3 continued
Titration of a-alumina with silica, adso •tion and li and exchan e
50159160
5103164
0000225020250301359525100251102520025210
0000300500
0000600160
0000725020250302520025210
-7.0-3.01.0
-2.0-2.0-4.0
-9.306.70
-14.0012.6022.1024.1015.10
7.00
1.00E-73.25E-40.00E-01.00E-21.00E-21.0E-3
50 -150 150 -150 150 250 250 1
50 1
159159
164164164164
11
1111
160160
159159
-11
11 160 -1
92
1.0-1m omCb—Ca (mM)
11.0
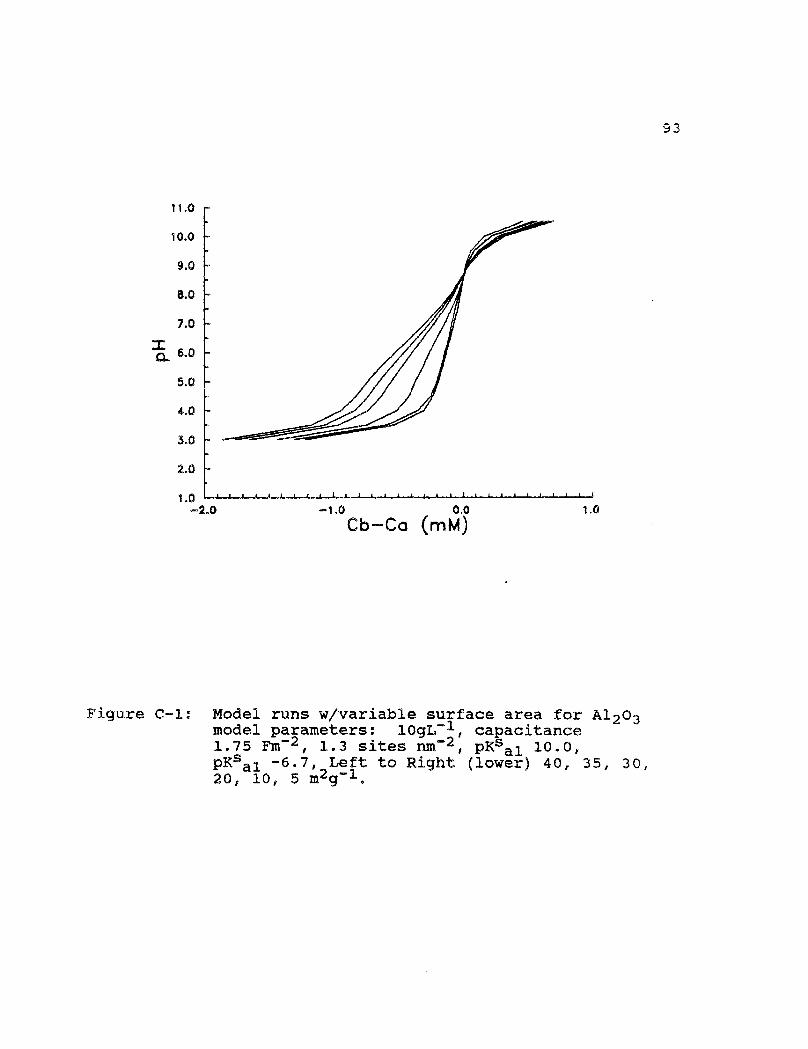
Figure C-1: Model runs w/variable surface area for Al20 3model parameters: lOgL-1 , capacitance1.75 Fm-2 , 1.3 sites nm-2 PKsal 10.0,PKsal -6.7, Left to Right (lower) 40, 35, 30,20, 10, 5 m2g-1 .
93
94
11.0
10.0
9.0
3.0
7.0
0- 6.0
5.0
4.0
3.0
2.0
1.0-2.0 0.0
Cb—Ca (mM)1.0
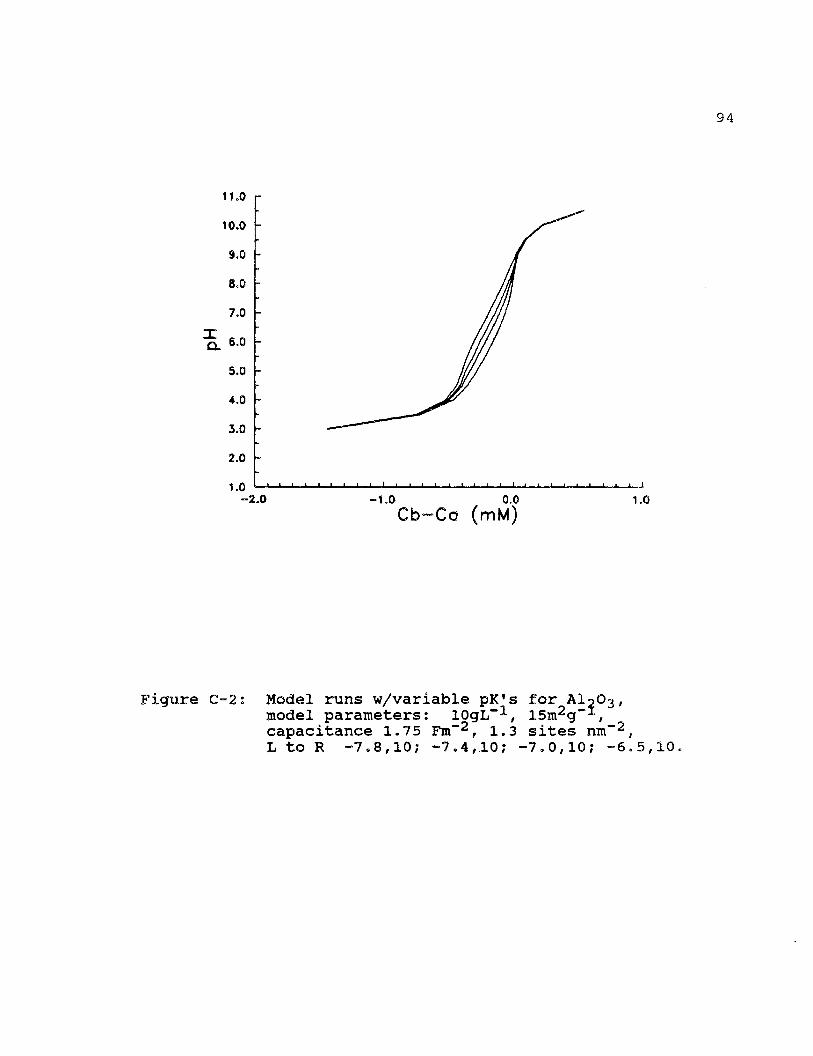
Figure C-2: Model runs w/variable pK's for Al203,model parameters: lOgL-1 , 15m2g- i,capacitance 1.75 Fm-2 , 1.3 sites nm-2 ,L to R -7.8,10; -7.4,10; -7.0,10; -6.5,10.
-3.0 -2.0 -1.0
Cb—Ca (mM)0.0
95
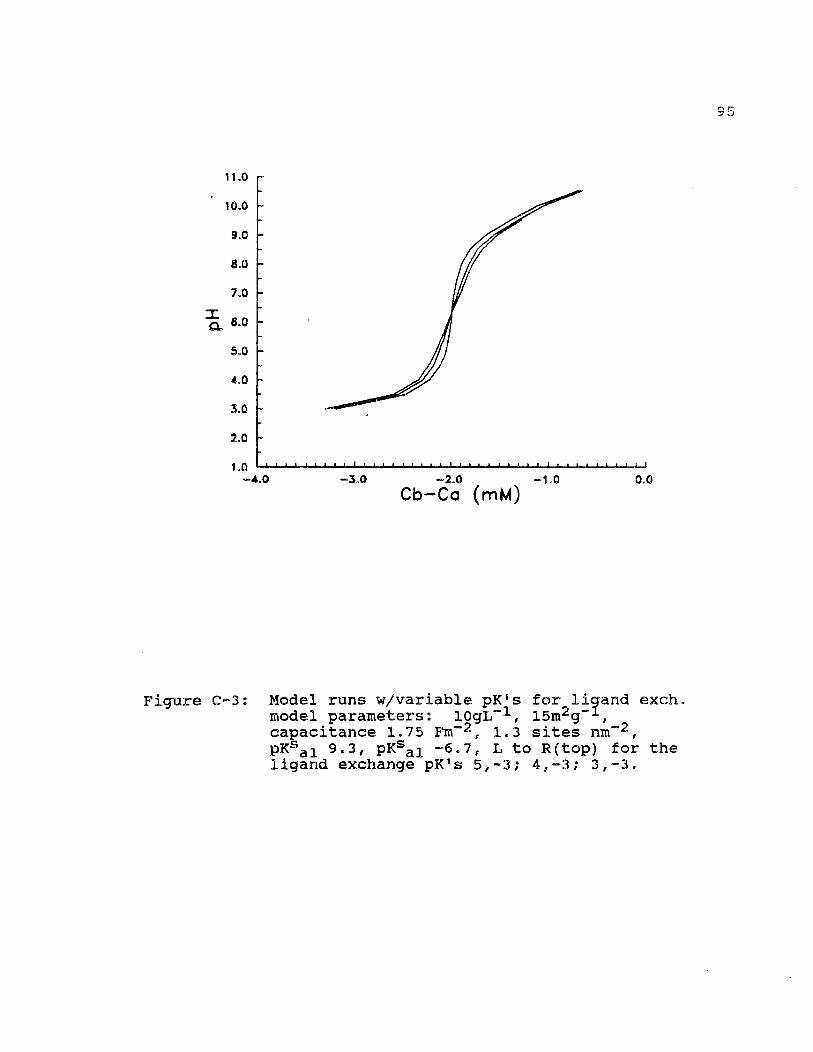
Figure C-3: Model runs w/variable pK's for ligand exch.model parameters: 1OgL-1 , 15m2g-1 ,capacitance 1.75 Fm-2 , 1.3 sites nm-2 ,PK5a1 9 - 3, PKsal -6.7, L to R(top) for theligand exchange pK's 5,-3; 4,-3; 3,-3.
REFERENCES CITED
Ali, W., O'Melia, C.R. and Edzwald (1984). ColloidalStability of Particles in Lakes: Measurement andSignificance. Water Sci. Technol., 17, 701-712.
Bales, R.C, Newkirk, D.D., and Hayward, S.B. (1984).Chrysotile Asbestos in California Surface Waters:From Upstream Rivers Through Water Treatment. J.Amer. Water Works Assn., 76:5, 66-74.
Bales, R.C. Surface Chemical And Physical Behavior ofChrysotile Asbestos in Natural Waters and WaterTreatment. Envir. Enar. Sci. Report AC-8-84, Calif.Inst. Technol., Pasadena, CA.
Birkner F.B. and J.J. Morgan (1968). Polymer flocculationkinetics of dilute colloidal suspensions. J. Amer.
Water Works Assn., 60, 175-191.
Bowers, A.R., and Huang C.P. (1984). AdsorptionCharacteristics of Polyacetic Amino Acid onto Hydrousa-Al203. J. Colloid and Inter. Sci., 105, 197-205.
Brace, R. and Matijevic, E. (1973). Aluminum Hydrous OxideSols I, J. Inorg. Nucl. Chem., 35, 3691-3705.
Chowdhury, Z., Amy, G., and Bales, R., (in press).Chemical Coagulation of Submicron Particles, Proc. Amer. Water Works Assn. 1987 Annual Conf., KansasCity, MO, June 23-28.
Chowdhury (1988). Coagulation of Submicron Colloids inWater Treatment, University of Arizona, Tucson, Ph.D.dissertation.
Cornwall and Bishop (1983). Determining Velocity Gradientsin Laboratory and Full-scale Systems, J. Amer. WaterWorks Assn., 9, 470-475.
Edzwald, J.K., Upchurch, J.D. and O'Melia, C.R. (1974).Coagulation in Estuaries, Envir. Sci. Technol., 8:58-63.
Furlong, D.N., Freeman, P.A., and A.C. Lau, The Adsorptionof Soluble Silica at Solid-Aqueous Solution
Interface. J. Colloid and Interface Sci., 80, 20-31.
96

97
REFERENCES CITED-Continued
Gibbs, R.J. (1983). Effect of Natural Organic Coatings onthe Coagulation of Particles, Envir. Sc!. Technol.,17:237-240.
Hahn, H., and W. Stumm (1968). Kinetics of coagulationwith hydrolyzed Al(III), J. Colloid and Interface
Sc!. 28, 134-144.
Huang, C., and W. Stumm (1972). Specific Adsorption ofCations on Hydrous Al203, J. Colloid and InterfaceSci., 43, 409-433.
Kummert, R. and Stumm, W (1980). The Surface Complexationof Organic Acids on Hydrous Al203, J. ColloidInterface Sc!. 72, 373.
Lai, R. Hudson, H., and J. Singley (1975). VelocityGradient Calibration of Jar-Test Equipment, J. Amer. Water Works Assn., 10, 553-557.
Letterman, R.D., and P. Sricharoenchaikit (1982).Interaction of Hydrolyzed Al and PolyelectrolyteCoagulants, J. Envir. Engr. Div., 5, 883-899.
O'Melia, C.R. (1985). The Influence of Coagulation andSedimentation on the Fate of Particles, Associated
Pollutants, and Nutrients in Lakes, Chemical Processes inLakes, W. Stumm Ed., Wiley, 207-224.
O'Melia, C.R. (1980). Aquasols: Behavior of SmallParticles in Aquatic Systems, Envir. Sci. Technol.,14, 1052-1050.
Osman-Sigg, G.K. (1982). Kolloidale und suspendierteTeilchen in nauturlichen Gewassern:Partikelgrossenverteilung und Naturliche Koagulationin Zurichsee. Eidgenossischen Technischen HochschuleZurich, Ph. D. dissertation number 6986.
Stumm W. and J.J. Morgan (1981). Aquatic Chemistry, 2nded. Wiley, New York.
Stumm. W., Kummert, R., and L. Sigg (1980). A LigandExchange Model for the Adsorption of Inorganic andOrganic Ligands at Hydrous Oxide Interfaces, CroaticaChemica Acta, 53, 291-312.
Stumm, W. (1977). Chemical Interaction in ParticleSeparation, J. Envir. Sci. Technol., 11:1066-1069.

98
REFERENCES CITED-Continued
Swift D.L. and S.K. Friedlander (1964). The coagulation ofhydrosols by Brownian motion and laminar shear flow,
J. Colloid Science, 19, 621-647.
Vuceta, J. (1976). Adsorption of Pb(II) and Cu(II) on a-quartz from Aqueous Solutions: Influence of pH,
Ionic Strength and Complexing Ligands. Ph.D. Thesis,Calif. Inst. of Technol., Pasadena, CA
Westall, J., Zachary, J. L., and F. Morel (1976). MINEQL -A Computer Program for the Calculation of ChemicalEquilibrium Composition of Aqueous Systems, Technical Note No. 18, Ralph M. Parsons Laboratory, M.I.T.,Cambridge MA.
Westall, J. (1980). Chemical Equilibrium IncludingAdsorption on Charged Surfaces, in Adv. Chem. Series 189, M. Kavanaugh and J.O. Leckie, Ed., AmericanChemical Society, Washington.
Wiese, G.R. and T.W. Healy (1975). Coagulation andElectrokinetic Behavior of TiO2 and Al20 ColloidalDispersions, J. Colloid and Interface Sel., 51, 427-433.
Young, J.R. (1981). A Study of the Adsorption of Ni(II)onto an Amorphous Silica Surface by Chemical and NMRMethods, Envir. Engr. Sci. Report AC-8-81, Calif.Inst. Technol., Pasadena, CA.