Embed Size (px)
Citation preview
Draft
LRT Passengers’ Responses to Advanced Passenger
Information System (APIS) in case of Information Inconsistency and Train Crowding
Journal: Canadian Journal of Civil Engineering
Manuscript ID cjce-2017-0559.R1
Manuscript Type: Article
Date Submitted by the Author: 06-Dec-2017
Complete List of Authors: Kattan, Lina; University of Calgary Schulich School of Engineering
Bai, Yuan; University of Calgary Schulich School of Engineering
Is the invited manuscript for consideration in a Special
Issue? : N/A
Keyword: multinomial logistic model, stated preference, realtime transit information, crowded train, inconsistent information
https://mc06.manuscriptcentral.com/cjce-pubs
Canadian Journal of Civil Engineering
Draft
1
1
LRT Passengers’ Responses to Advanced Passenger Information System (APIS) in case of 2
Information Inconsistency and Train Crowding 3
4
Lina Kattan PEng, PhD 5 Professor 6 Urban Alliance Professor in Transportation Systems Optimization 7 Department of Civil Engineering, Schulich School of Engineering 8 University of Calgary 9 e-mail: [email protected] 10 11
12
Yuan Bai, MEng, 13 Department of Civil Engineering, Schulich School of Engineering 14
University of Calgary 15
email: [email protected] 16 17
Abstract: 18
This research explores and attempts to understand transit riders’ behavioural responses towards real-time 19
transit information for two specific situations: the presence of inconsistent information on transit service 20
recovery and the effects of crowded trains during rush hours. A survey was designed and conducted to 21
collect Light Rail Transit (LRT) riders’ behavioural responses in Calgary, Alberta. Multinomial logit 22
models were developed and calibrated to explore the effects of the described scenarios on riders’ 23
responses. The results led to the conclusion that socio-economic attributes, experience with APIS system, 24
familiarity with public transit in general and Calgary’s LRT system in particular, and the characteristics 25
of origin LRT stations had strong influences on travellers’ behavioural responses. It was also determined 26
that travellers’ actions vary significantly depending on the purpose of the trip, time of the trip, and 27
weather conditions. 28
29
30
Page 1 of 34
https://mc06.manuscriptcentral.com/cjce-pubs
Canadian Journal of Civil Engineering
Draft
2
Introduction: 31
Over the past two decades, public transit agencies across North America and Europe have increasingly 32
implemented Advanced Passenger Information Systems (APIS). APIS offers considerable benefits in 33
terms of customer satisfaction in the short term (Gooze et al. 2013) and a possible increase in ridership in 34
the long term (Tang and Thakuriah 2012; and Body 2007). APIS improves overall satisfaction and makes 35
transit service a more attractive option for travellers. For instance, up-to-date transit information 36
decreases the uncertainty in waiting time (Rahman et al. 2013), creates a perception that the system is 37
safer and more secure (Dziekan and Kottenhoff 2007) and helps transit riders productively manage their 38
waiting time (Russell 2012). 39
40
Given the role that APIS can play on a transit system level of service and performance, it is 41
crucial to understand the attributes that influence a transit rider’s decisions in response to real-time transit 42
information. However, passengers’ responses change from situation to another. This paper explores 43
transit riders’ behavioural responses to APIS for two particular situations: crowded trains and the 44
existence of conflicting transit arrival information. There might be adjusting strategies, such as letting a 45
crowded bus go by if the display showed another arriving shortly. In particular, if disseminated 46
information on service recovery is inconsistent, it might lead to different responses from the riders. 47
Further investigations of modelling behavioural riders’ response to APIS is conducted by including the 48
effect of trip type and station characteristics. 49
The paper is organized as follows: In the next section, related studies in the APIS area are 50
reviewed. Section 3 gives a brief description of the study area selected to conduct this research. Section 4 51
discusses the questionnaire design and data collection techniques, and Section 5 summarizes the 52
descriptive statistics. Section 6 discusses the analysis of transit riders’ responses to APIS in the two 53
scenarios and the interpretation of the analysis results. Section 7 presents the concluding remarks based 54
on the analysis, proposes some policy recommendations, and outlines the scope for potential future 55
research. 56
Page 2 of 34
https://mc06.manuscriptcentral.com/cjce-pubs
Canadian Journal of Civil Engineering
Draft
3
57
Literature Review 58
Zhang (2010) proposed a decision tree for a traveller’s change in trip-specific behaviour because of a 59
long expected wait time as indicated by APIS. When APIS notifies a transit rider of a long wait time, 60
he/she may forgo the trip or shift to another mode. For instance, the Stopwatch project in Southampton 61
found that 12.6% of respondents would leave the bus stop because of the delays (Warman 2003). Still, 62
passengers may change from the intended transit path for two reasons. First, long waiting times from 63
APIS might cause passengers to change stops to take a transit route with less total travel time (sum of 64
walking, waiting, and riding time). Second, when there are two transit lines at one stop, passengers may 65
choose the other route if it has less total waiting and riding time. OneBusAway conducted a stated 66
preference survey and found that 78% of respondents reported they were more likely to walk to a 67
different stop if there were delays (Rutherford et al. 2010). The survey also indicated that the most 68
popular choice was to wait at the same stop but for a different bus route, followed by walking to stops 69
further ahead on the current route. In addition, approximately 42% of respondents indicated they walked 70
to another stop for exercise, which is beneficial for health reasons (Ferris et al. 2010). Decisions that 71
transit riders made depended on trip purpose, type and duration of the disruption, trip time, and weather 72
conditions (Bai and Kattan 2014). In addition, socio-economic attributes, experience with APIS, and 73
experience with transit also influenced the passengers’ decisions. 74
While staying on the intended path, productively managing their time around stop is another 75
choice a passenger can make a choice to cope with a long wait. In the literature, 20% to 38.5% of 76
respondents said they would leave the stop and return when the bus is due (Nijkamp et al. 1996; SAIC 77
2003; Caulfield 2004). Undoubtedly, knowing the expected wait time would help riders plan their 78
activities while waiting (Russell 2012). King county metro OneBusAway users routinely comment about 79
their ability to grab a cup of coffee because they know there is a 10-minute late (Rutherford et al. 2010). 80
In general, some transit users keep busy, for example by making phones calls or reading, while waiting. 81
Bai and Kattan (2014) found that while the decision of productively managing their waiting time around 82
Page 3 of 34
https://mc06.manuscriptcentral.com/cjce-pubs
Canadian Journal of Civil Engineering
Draft
4
the stop varies significantly depending on the type and duration of service interruption, it changes only 83
slightly based on trip purpose. In the case of a 10-minutes Light Rail Transit (LRT) delay, 47.57% and 84
49.54% of respondents stated they would use their time more effectively (e.g. reading a newspaper or 85
using the phone) while waiting for commute and non-commute trips, respectively. However, in the case 86
of service interruption with no expected recovery time, only 15.43% and 17.16% of riders said they 87
would wait for the LRT while actively using their time for commute and non-commute trips, 88
respectively. Consequently, psychological and behavioural responses to APIS can differ significantly 89
based on the presented situation. 90
The effect of conflicting information regarding train arrivals on a transit rider’s behavioural and 91
psychological responses is largely ignored in the literature. Mulley et al. (2017) pointed out to need of 92
examining the non-homogeneity of real time passenger transit information. Accurate, consistent 93
information disseminated from two different media sources has a positive effect on behavioural 94
reinforcement and, thus, a driver’s compliance with real-time traffic information (Kattan et al. 2012). 95
However, the effect of conflicting information from different sources is less understood. Gooze et al 96
(2013) highlighted the importance of reliable real-time transit arrival information. They found that riders 97
expected an average margin of error of 4-6 minutes for arrival predictions. However, infrequent riders, 98
compared to frequent riders, expected an even lower margin of error. They found that passengers with a 99
lower tolerance for errors might decide to take public transit less often. Rahman et al (2013) found that 100
the margin of error increases with a longer transit headway. Cat and Gkioulou (2017) pointed out that 101
while the provision of real-time passenger information has the potent to reduce travel uncertainty, its 102
impacts depends on the underlying service reliability and its perceived credibility. Thus, different 103
behavioural responses may be caused by a greater information error gap, especially when the information 104
is communicated from different sources. 105
Cats (2011) suggested the presence of interdependence between crowded trains and APIS. 106
Crowding might result in unrealistic passenger waiting time as passengers need to wait for a complete 107
headway or headways to be able to board. Various studies indicate that crowding is a concern in places 108
Page 4 of 34
https://mc06.manuscriptcentral.com/cjce-pubs
Canadian Journal of Civil Engineering
Draft
5
like Los Angeles (Davidson et al. 2011), London (Wardman and Whelan, 2011), Delft (Pel et al. 2013), 109
and Dhaka (Katz and Garrow 2012). A stated-preference study conducted by Hensher et al. (2011) 110
showed the significant impact of train crowding in increasing travelers’ value of time savings. Research 111
on passengers’ responses to overcrowding often focused on the reaction to the crowded train, the 112
relationship between the level of overcrowding and stress, and incentives to reduce overcrowding. 113
Preston et al (2016) found that the willingness of passengers to change their behavior to avoid crowding. 114
Based on a simulation analysis conducted by Drabicki et al. (2017), the provision of crowding 115
information in real-time was shown to significant impact en-route path choices. These choices were also 116
found to be strongly related with network congestion level, passengers' behavior in terms of sensitivity to 117
crowding and characteristics of information provision. According to the Pel et al. (2013), MVA 118
Consultancy (2007), Maunsell (2007), and Davisdon et al. (2011), a user reaction to overcrowding can be 119
any of the following: changing departure times to avoid crowded conditions; using another departure or 120
arrival station; changing to a different route; switching to another mode; choosing less crowded 121
carriages; standing on the platform in the exact position that the train doors line up; and upgrading to 122
another class In a recent study using smart card data, Kim et al. 2015) found that travelers do take into 123
consideration crowding conditions in their route choices. In light of real time transit information, 124
passengers may choose different alternatives when faced with crowded trains, for example, by letting a 125
crowded train go by or changing routes if the display showed another one arriving shortly. Cats (2011) 126
suggested that the provision of traffic information with crowding situation could have big effects on 127
passenger route choice decisions. In a survey conducted in Korea, Kim et al. (2009) found that 128
information on crowdedness on a bus decreases the probability that a rider will choose to board on the 129
incoming bus. Based on a recent pilot study at a Stockholm metro station, Zhang (2017) found that the 130
provision of real time information on train crowding is successful in reducing the passengers boarding 131
the first, most crowded car by 4.3% points on trains that were crowded on arrival. A stated preference 132
work undertaken in the UK (Pritchard 2017) showed that the provision of improved information could in 133
some cases be effective, in helping passengers make informed decision to avoid train crowding. 134
Page 5 of 34
https://mc06.manuscriptcentral.com/cjce-pubs
Canadian Journal of Civil Engineering
Draft
6
Thus, two situations that affect passengers’ responses to APIS, which are overlooked in the 135
literature and are the focus of this paper are as follows: 136
1. Inconsistent recovery information in the case of transit service interruption 137
2. Interaction between real-time information and train crowding 138
Study Area Profile 139
This research uses the Calgary’s LRT system as a case study. Calgary’s LRT system had an average of 140
285,000 riders per weekday in the fourth quarter of 2012, making it the busiest light rail system in North 141
America (American Public Transportation Association 2012). In a 2012 transit customer satisfaction 142
survey, the crowding level of the LRT system was the only attribute that did not rate well among most 143
respondents. 144
145
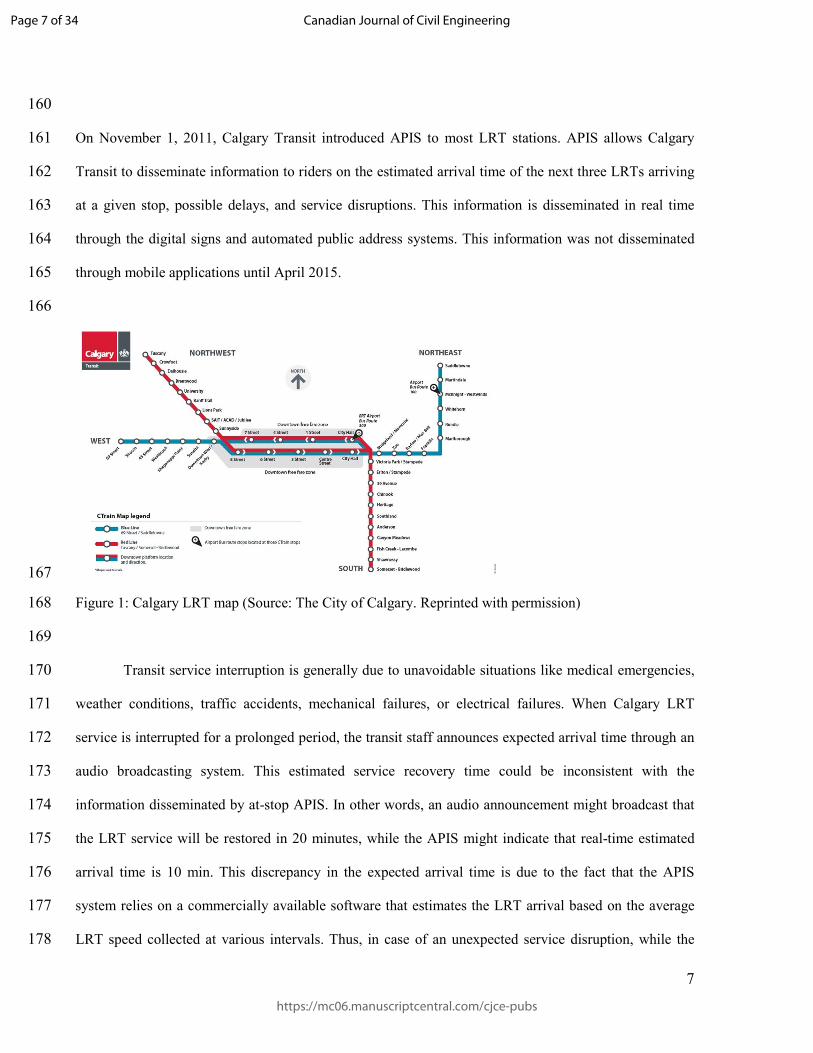
As of August 2014, the Calgary LRT system operates on 59.9 kilometers of track and is organized into 146
two routes: Route 201 Tuscany/Somerset-Bridlewood (red line in Figure 1) and Route 202 147
Saddletowne/69 Street W (blue line in Figure 1). The current average headway is 300 seconds during 148
peak periods and 600 seconds during off-peak periods. 149
150
Calgary and Region Travel and Activity Survey (CARTAS 2012) revealed the total number of transit 151
trips per person is statistically the same as in 2001 (City of Calgary 2012). Overall, most transit users 152
(73%) are still making two transit trips per day. According to 2015 data collected by Calgary Transit, 153
yearly transit ridership reached 110 million customers in 2016. 17% of Calgary transit users reported 154
only using the bus service, 37 % only using the LRT and 46% using both bus and LRT (Calgary Transit 155
2017). The transit mode share for home to work trips located in the city Central Business District (CBD) 156
increased from 36% to 46% from 2001 to 2011. However, the city has the following modal splits: 157
vehicle - 77%, public transit - 8.6%, walking - 12.4%, and bicycle - 2%. The overall low transit usage is 158
explained by the predominance of low-density areas underserved by public transport. 159
Page 6 of 34
https://mc06.manuscriptcentral.com/cjce-pubs
Canadian Journal of Civil Engineering
Draft
7
160
On November 1, 2011, Calgary Transit introduced APIS to most LRT stations. APIS allows Calgary 161
Transit to disseminate information to riders on the estimated arrival time of the next three LRTs arriving 162
at a given stop, possible delays, and service disruptions. This information is disseminated in real time 163
through the digital signs and automated public address systems. This information was not disseminated 164
through mobile applications until April 2015. 165
166
167
Figure 1: Calgary LRT map (Source: The City of Calgary. Reprinted with permission) 168
169
Transit service interruption is generally due to unavoidable situations like medical emergencies, 170
weather conditions, traffic accidents, mechanical failures, or electrical failures. When Calgary LRT 171
service is interrupted for a prolonged period, the transit staff announces expected arrival time through an 172
audio broadcasting system. This estimated service recovery time could be inconsistent with the 173
information disseminated by at-stop APIS. In other words, an audio announcement might broadcast that 174
the LRT service will be restored in 20 minutes, while the APIS might indicate that real-time estimated 175
arrival time is 10 min. This discrepancy in the expected arrival time is due to the fact that the APIS 176
system relies on a commercially available software that estimates the LRT arrival based on the average 177
LRT speed collected at various intervals. Thus, in case of an unexpected service disruption, while the 178
Page 7 of 34
https://mc06.manuscriptcentral.com/cjce-pubs
Canadian Journal of Civil Engineering
Draft
8
train driver would report this incident by calling directly the Transit Control center, the APIS would 179
continue to automatically displaying the expected arrival as the transit staff does not have the ability to 180
override the APIS. 181
182
Data Collection 183
In this study, a questionnaire-based survey was developed to analyze transit riders’ behavioural responses 184
and psychological perceptions to real-time information provided by APIS. The questionnaire took an 185
average of 10 minutes to complete and was approved by the Office of Research Ethics at the University 186
of Calgary. Two major destinations are targeted in the survey, University of Calgary and downtown 187
Calgary, as they are the two major destinations in the city that are well served by LRT/transit. The online 188
survey and face-to-face interview were conduct from February to April 2014, almost one and half year 189
after the implementation of APIS. The full questionnaire includes 29 questions and can be found in Bai 190
(2014). The collected information is divided into four broad categories: 191
− Travel characteristics, such as frequency of trips using LRT, primary mode of travel 192
− Riders’ experience with the LRT and APIS, such as the familiarity with the LRT service frequency, 193
familiarity with APIS, and perceived accuracy of APIS 194
− Demographic information, such as age, gender, income, household vehicle ownership 195
− Transit riders’ behavioural responses to different scenarios for different trip purposes (work/school 196
and other trips) and weather conditions (15℃ to 25℃, no rain expected; and -25 ℃ to -5℃, no snow 197
expected) 198
In addition, information on trip attributes, such as in-vehicle-travel time (IVT), number of transfers, and 199
station characteristics were captured indirectly from the questionnaire by indicating the trip station origin 200
and trip destination. The LRT IVT and number of bus transfers from origin and destination stations were 201
obtained from the Plan A trip tool on the Calgary Transit website for each origin-destination pair. 202
203
Page 8 of 34
https://mc06.manuscriptcentral.com/cjce-pubs
Canadian Journal of Civil Engineering
Draft
9
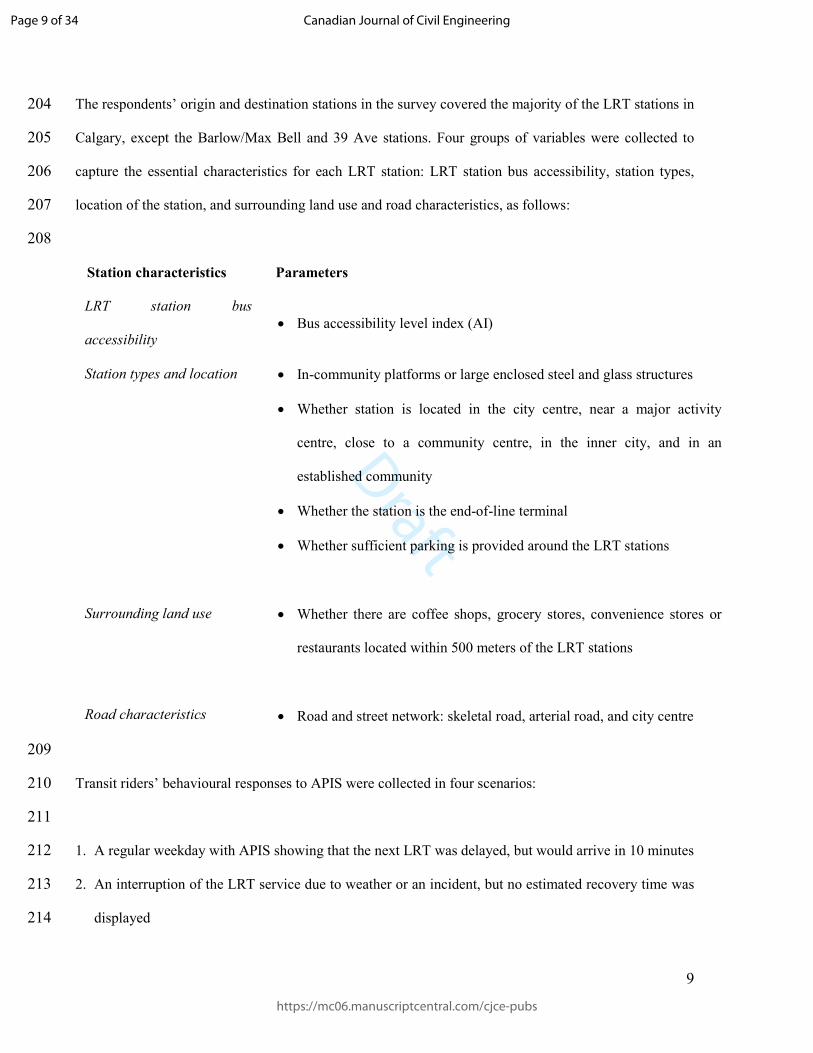
The respondents’ origin and destination stations in the survey covered the majority of the LRT stations in 204
Calgary, except the Barlow/Max Bell and 39 Ave stations. Four groups of variables were collected to 205
capture the essential characteristics for each LRT station: LRT station bus accessibility, station types, 206
location of the station, and surrounding land use and road characteristics, as follows: 207
208
Station characteristics Parameters
LRT station bus
accessibility • Bus accessibility level index (AI)
Station types and location • In-community platforms or large enclosed steel and glass structures
• Whether station is located in the city centre, near a major activity
centre, close to a community centre, in the inner city, and in an
established community
• Whether the station is the end-of-line terminal
Surrounding land use
Road characteristics
• Whether sufficient parking is provided around the LRT stations
• Whether there are coffee shops, grocery stores, convenience stores or
restaurants located within 500 meters of the LRT stations
• Road and street network: skeletal road, arterial road, and city centre
209
Transit riders’ behavioural responses to APIS were collected in four scenarios: 210
211
1. A regular weekday with APIS showing that the next LRT was delayed, but would arrive in 10 minutes 212
2. An interruption of the LRT service due to weather or an incident, but no estimated recovery time was 213
displayed 214
Page 9 of 34
https://mc06.manuscriptcentral.com/cjce-pubs
Canadian Journal of Civil Engineering
Draft
10
3. Riders’ responses to scenarios when conflicting information was presented 215
4. An oncoming crowded LRT with APIS estimated the next LRT arrival time was 5 minutes. 216
217
This paper focuses on analyzing scenarios 3 and 4; analyses of scenarios 1 and 2 were published in a 218
previous paper (Bai and Kattan 2014). Scenarios 3 and 4 were investigated separately for different trip 219
purposes, time, and weather conditions. Calgary’s climate falls under the “humid continental” 220
classification with long, cold winters and short, moderately warm summers. Such weather conditions 221
significantly affect travellers’ attitudes to waiting time. 222
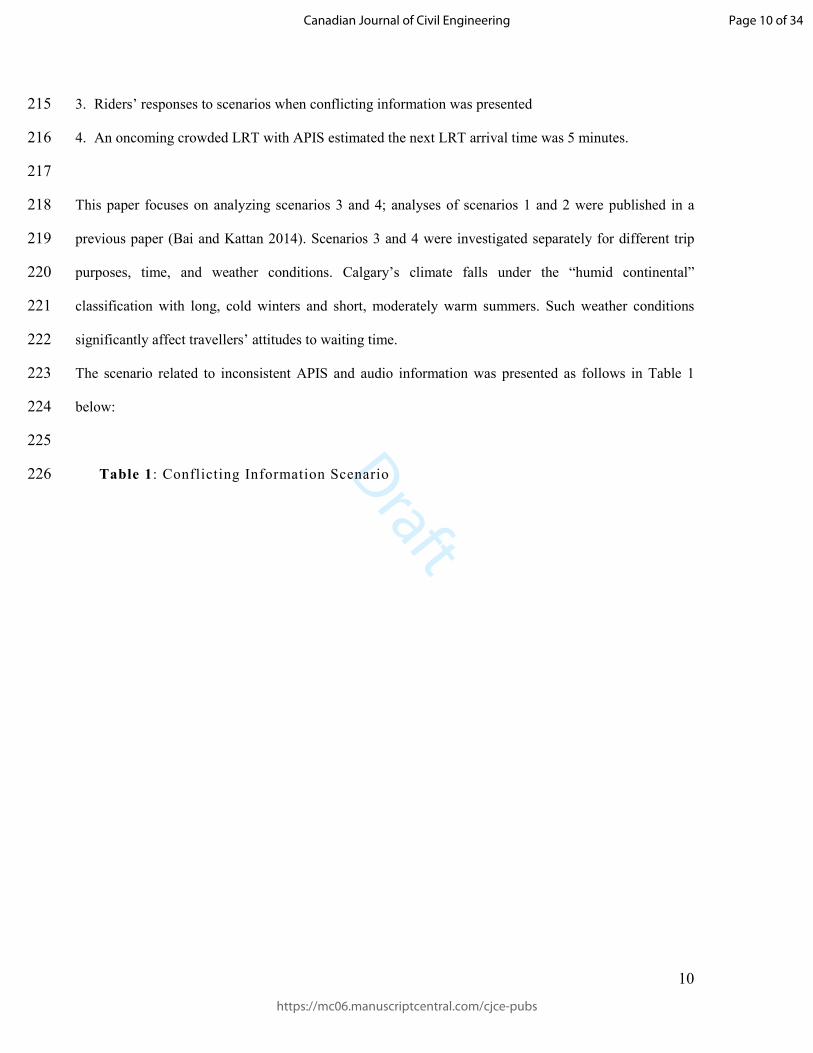
The scenario related to inconsistent APIS and audio information was presented as follows in Table 1 223
below: 224
225
Table 1: Conflicting Information Scenario 226
Page 10 of 34
https://mc06.manuscriptcentral.com/cjce-pubs
Canadian Journal of Civil Engineering
Draft
11
227
228
229
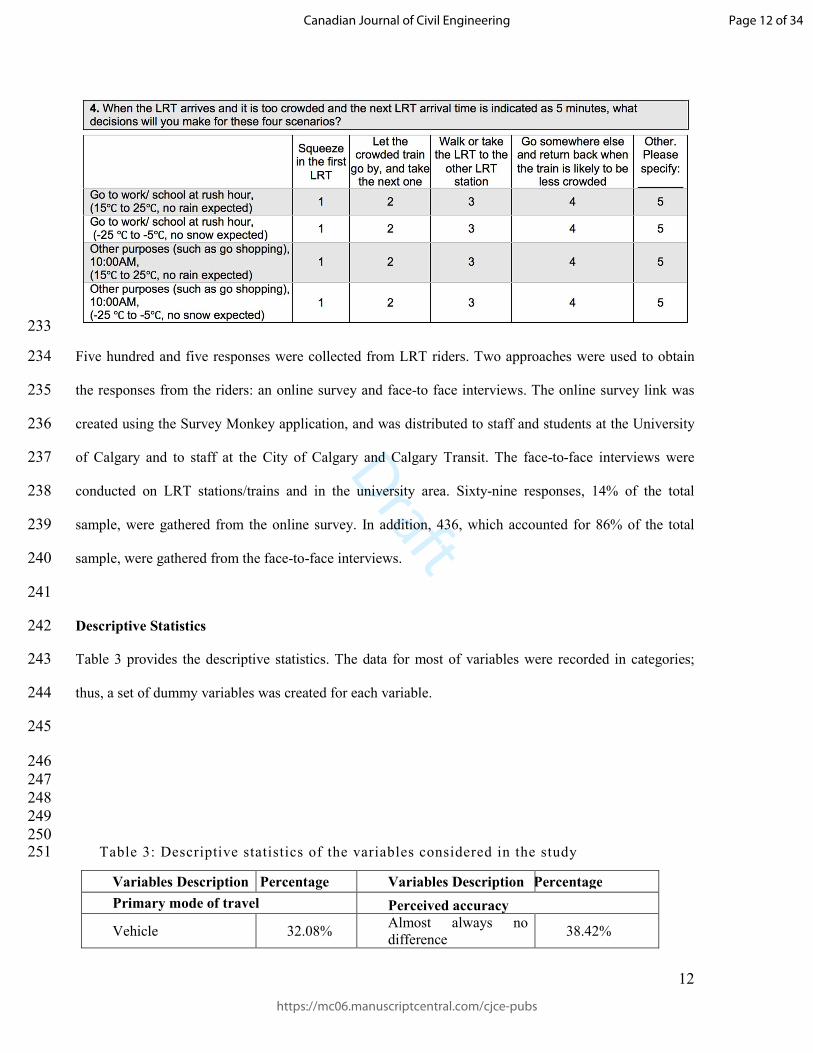
The scenario related to incoming crowded LRT only focuses on peak period when trains are crowded. 230
This scenario was presented as follows in Table 2: 231
Table 2: Scenario related to Crowded LRT 232
Page 11 of 34
https://mc06.manuscriptcentral.com/cjce-pubs
Canadian Journal of Civil Engineering
Draft
12
233
Five hundred and five responses were collected from LRT riders. Two approaches were used to obtain 234
the responses from the riders: an online survey and face-to face interviews. The online survey link was 235
created using the Survey Monkey application, and was distributed to staff and students at the University 236
of Calgary and to staff at the City of Calgary and Calgary Transit. The face-to-face interviews were 237
conducted on LRT stations/trains and in the university area. Sixty-nine responses, 14% of the total 238
sample, were gathered from the online survey. In addition, 436, which accounted for 86% of the total 239
sample, were gathered from the face-to-face interviews. 240
241
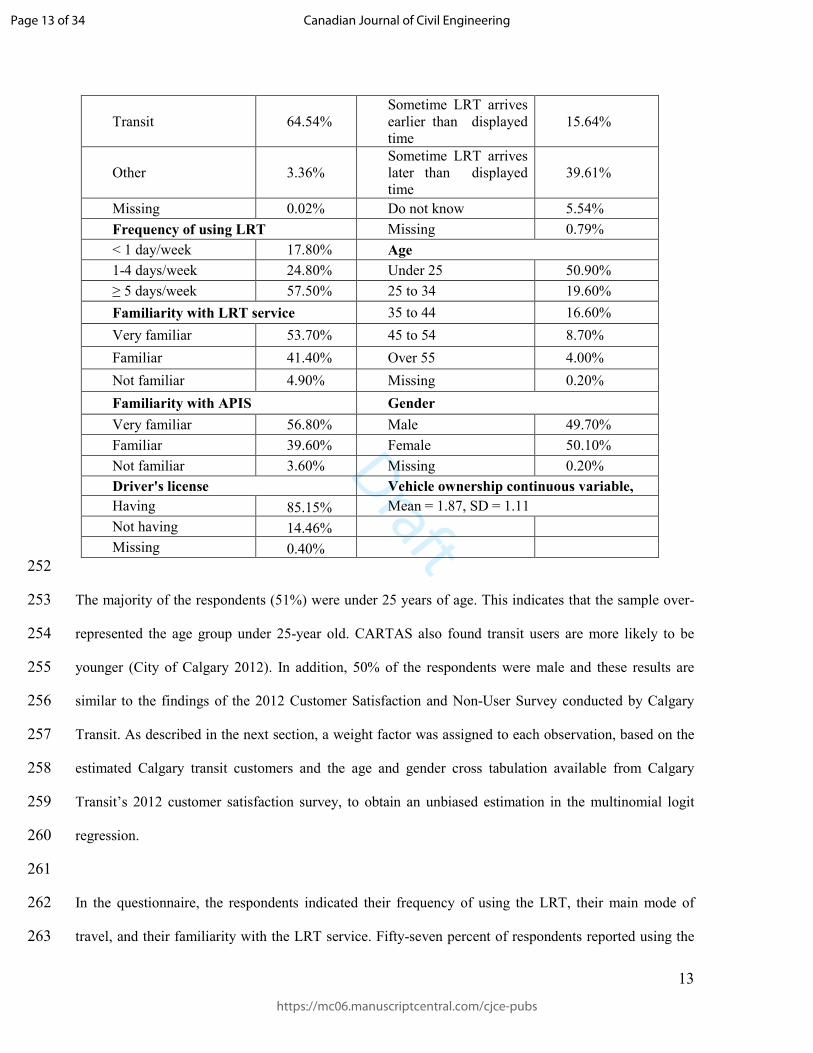
Descriptive Statistics 242
Table 3 provides the descriptive statistics. The data for most of variables were recorded in categories; 243
thus, a set of dummy variables was created for each variable. 244
245
246
247
248
249
250 Table 3: Descriptive statistics of the variables considered in the study 251
Variables Description Percentage Variables Description Percentage
Primary mode of travel Perceived accuracy
Vehicle 32.08% Almost always no
difference 38.42%
Page 12 of 34
https://mc06.manuscriptcentral.com/cjce-pubs
Canadian Journal of Civil Engineering
Draft
13
252
The majority of the respondents (51%) were under 25 years of age. This indicates that the sample over-253
represented the age group under 25-year old. CARTAS also found transit users are more likely to be 254
younger (City of Calgary 2012). In addition, 50% of the respondents were male and these results are 255
similar to the findings of the 2012 Customer Satisfaction and Non-User Survey conducted by Calgary 256
Transit. As described in the next section, a weight factor was assigned to each observation, based on the 257
estimated Calgary transit customers and the age and gender cross tabulation available from Calgary 258
Transit’s 2012 customer satisfaction survey, to obtain an unbiased estimation in the multinomial logit 259
regression. 260
261
In the questionnaire, the respondents indicated their frequency of using the LRT, their main mode of 262
travel, and their familiarity with the LRT service. Fifty-seven percent of respondents reported using the 263
Transit 64.54%
Sometime LRT arrives
earlier than displayed
time
15.64%
Other 3.36%
Sometime LRT arrives
later than displayed
time
39.61%
Missing 0.02% Do not know 5.54%
Frequency of using LRT Missing 0.79%
< 1 day/week 17.80% Age
1-4 days/week 24.80% Under 25 50.90%
≥ 5 days/week 57.50% 25 to 34 19.60%
Familiarity with LRT service 35 to 44 16.60%
Very familiar 53.70% 45 to 54 8.70%
Familiar 41.40% Over 55 4.00%
Not familiar 4.90% Missing 0.20%
Familiarity with APIS Gender
Very familiar 56.80% Male 49.70%
Familiar 39.60% Female 50.10%
Not familiar 3.60% Missing 0.20%
Driver's license Vehicle ownership continuous variable,
Having 85.15% Mean = 1.87, SD = 1.11
Not having 14.46%
Missing 0.40%
Page 13 of 34
https://mc06.manuscriptcentral.com/cjce-pubs
Canadian Journal of Civil Engineering
Draft
14
LRT more than 5 days/week. The results for the main mode of travel showed that a high percentage of 264
respondents use public transit. The results also show that about 32% of respondents used cars as their 265
main mode of travel. This low percentage of vehicle users could be explained by the fact that the survey 266
targeted transit users. The survey also targeted two major destinations, downtown and the University of 267
Calgary campus, which are well served by transit. 96% of respondents indicated being familiar with the 268
real-time information display. 269
270
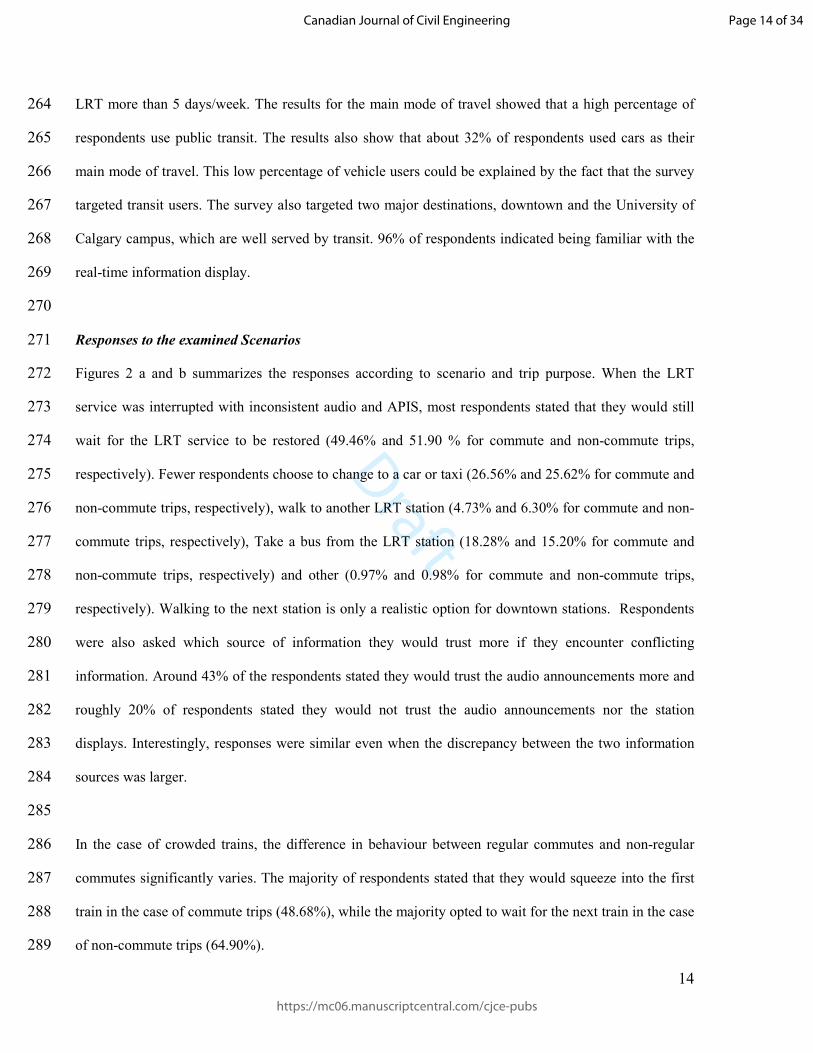
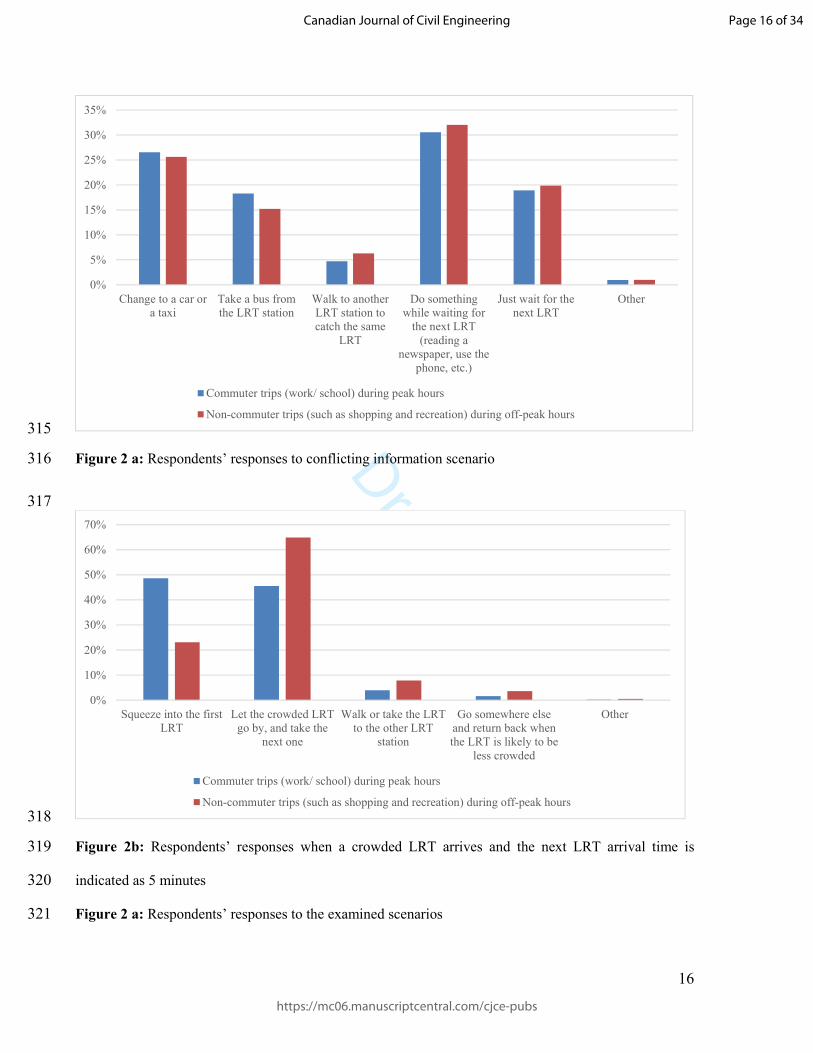
Responses to the examined Scenarios 271
Figures 2 a and b summarizes the responses according to scenario and trip purpose. When the LRT 272
service was interrupted with inconsistent audio and APIS, most respondents stated that they would still 273
wait for the LRT service to be restored (49.46% and 51.90 % for commute and non-commute trips, 274
respectively). Fewer respondents choose to change to a car or taxi (26.56% and 25.62% for commute and 275
non-commute trips, respectively), walk to another LRT station (4.73% and 6.30% for commute and non-276
commute trips, respectively), Take a bus from the LRT station (18.28% and 15.20% for commute and 277
non-commute trips, respectively) and other (0.97% and 0.98% for commute and non-commute trips, 278
respectively). Walking to the next station is only a realistic option for downtown stations. Respondents 279
were also asked which source of information they would trust more if they encounter conflicting 280
information. Around 43% of the respondents stated they would trust the audio announcements more and 281
roughly 20% of respondents stated they would not trust the audio announcements nor the station 282
displays. Interestingly, responses were similar even when the discrepancy between the two information 283
sources was larger. 284
285
In the case of crowded trains, the difference in behaviour between regular commutes and non-regular 286
commutes significantly varies. The majority of respondents stated that they would squeeze into the first 287
train in the case of commute trips (48.68%), while the majority opted to wait for the next train in the case 288
of non-commute trips (64.90%). 289
Page 14 of 34
https://mc06.manuscriptcentral.com/cjce-pubs
Canadian Journal of Civil Engineering
Draft
15
290
Modeling Behavioural Responses using Multinomial Logit Modelling 291
292
Since the actions selected by the travellers in the hypothetical scenarios were nominal in nature, the 293
multinomial logit model was used for statistical modeling. Several multinomial logit models analyzed 294
travellers’ responses for the different trip purposes in each scenario. 295
296
For model formulation, the probability of a respondent, n, being involved in an action, i, can be written 297
as: 298
��� = ����� > �� ⩝ ∈ � (1) 299
300
Where P�� is the probability of a respondent being involved in an action, ; 301
��� is a function of covariates that determines the likelihood of respondent, �, being involved in 302
action ; 303
� is the set of all possible actions that are available to the respondents. 304
The covariate function is linear: 305
306
��� = ���� + ��� (2) 307
308
Where β� is a vector of the estimated coefficients; 309
�� are the measurable characteristics that can determine the categories of the possible actions; 310
� is an error term that is used to address the unobserved factors that influence the actions taken 311
by the individuals. 312
Therefore, the logit function for respondent, �, choosing action, , can be written as: 313
P�� =����� !
∑ ����� !⩝�∈# (3) 314
Page 15 of 34
https://mc06.manuscriptcentral.com/cjce-pubs
Canadian Journal of Civil Engineering
Draft
16
315
Figure 2 a: Respondents’ responses to conflicting information scenario 316
317
318
Figure 2b: Respondents’ responses when a crowded LRT arrives and the next LRT arrival time is 319
indicated as 5 minutes 320
Figure 2 a: Respondents’ responses to the examined scenarios 321
0%
5%
10%
15%
20%
25%
30%
35%
Change to a car or
a taxi
Take a bus from
the LRT station
Walk to another
LRT station to
catch the same
LRT
Do something
while waiting for
the next LRT
(reading a
newspaper, use the
phone, etc.)
Just wait for the
next LRT
Other
Commuter trips (work/ school) during peak hours
Non-commuter trips (such as shopping and recreation) during off-peak hours
0%
10%
20%
30%
40%
50%
60%
70%
Squeeze into the first
LRT
Let the crowded LRT
go by, and take the
next one
Walk or take the LRT
to the other LRT
station
Go somewhere else
and return back when
the LRT is likely to be
less crowded
Other
Commuter trips (work/ school) during peak hours
Non-commuter trips (such as shopping and recreation) during off-peak hours
Page 16 of 34
https://mc06.manuscriptcentral.com/cjce-pubs
Canadian Journal of Civil Engineering

Draft
17
Each observation has an assigned weight to correct sampling bias and to obtain an unbiased estimation. 322
The following formula is implemented in logit software using a weight factor, ω, for each observation to 323
show how the log-likelihood (LL) function is weighted. 324
325
LL = ∑ ω�ln�P���∈( (4) 326
Where ω� is the weight of a respondent, which is the inverse of the probability of the observation. The 327
population used in the analysis was based on the estimated Calgary transit customers and the age and 328
gender cross tabulation available from Calgary Transit’s 2012 customer satisfaction survey. 329
330
Multinomial Logit Model Results and Discussions 331
One of the underlying assumptions in a multinomial logit model is the independence of irrelevant 332
alternatives (IIA). Alternative 4, do something while waiting for the next LRT, and alternative 5, just 333
wait for the next LRT, are interrelated. When the IIA assumption is violated, one of the simplest 334
solutions is grouping the relevant alternatives together. There were few responses for alternatives 2, 335
taking a bus from the LRT station, and 3, walking to another LRT station to catch the same LRT, and 6, 336
other. Since alternatives 2 and 3 were related to transit use, these two options were merged into “other 337
transit” options, and the “other” alternative was removed. 338
The calibrated models summarize the impacts of travel habits, travellers’ experience with the 339
Calgary LRT APIS, demographics, station characteristics, and weather conditions on the selected 340
alternatives. Multinomial logit model estimations are provided in Table 4. 341
Coefficients were estimated for a large number of variables using STATA data analysis and 342
statistical software (www.stata.com). Coefficients with p values greater than 0.1 were insignificant and 343
were not included in the final model. As suggested by Kockelman and Kweon (2002), variables with low 344
statistical significance may be retained in the model if they belong to categorical factors that had some 345
significant effect. Thus, some of the variables that were not significant were still retained in the model, as 346
long as at least one of the variables for the same factor was statistically significant. This approach may 347
Page 17 of 34
https://mc06.manuscriptcentral.com/cjce-pubs
Canadian Journal of Civil Engineering
Draft
18
reduce the efficiency of the estimates, which were adjusted by using a more liberal confidence level of 348
90%, instead of the traditional 95%. In the following sections, the analysis was based on the calibrated 349
multinomial logit model. 350
351
Analysis of riders’ stated responses to inconsistent information 352
The alternatives were as follows: changing to a car or a taxi, waiting for the next LRT, and other transit. 353
Waiting for the next LRT was selected as the reference category (i.e. Alternative 1) for the conflicting 354
information scenario. 355
Keeping the explanatory variables constant at zero, the model showed that, compared to waiting 356
for the next LRT option, there was a decreased preference for changing to a car or a taxi or other transit 357
options for both trip purposes. For both types of trips, the familiarity of APIS, gender, weather 358
condition, LRT travel time, bus transfer time, availability of park and ride lots, and station were not 359
shown to be statistically significant and, thus, were dropped from the model. The impacts of other 360
explanatory variables are provided in Table 4. 361
362
Experience with LRT 363
The model concluded that, with reference to respondents whose primary mode of transport is an 364
automobile, transit users had a higher likelihood of selecting other transit options and a lower likelihood 365
of selecting the vehicle or taxi option for both examined trip purposes, which was expected. 366
367
Frequent riders (over 4 days/week) were less likely to select the vehicle/taxi or other transit options for 368
both commuter and non-commuter trips compared to infrequent LRT users (< 1 day/week). This higher 369
tolerance of frequent riders to wait supports the earlier finding by Gooze et al (2013). 370
371
Page 18 of 34
https://mc06.manuscriptcentral.com/cjce-pubs
Canadian Journal of Civil Engineering
Draft
19
The model demonstrated that, relative to travellers who had an average familiarity with LRT service 372
frequency, travellers with no familiarity with LRT service frequency had a high probability of changing 373
to a vehicle or taxi during their commuter/non-commuter trips. 374
375
Experience with APIS 376
Travellers who viewed APIS as accurate had a low probability of choosing the vehicle or taxi options 377
during their commuter/non-commuter trips, although the results were statistically marginally significant. 378
Respondents who often looked at APIS were likely to choose the vehicle/taxi options during their 379
commute and non-commute trips, although the results were only marginally significant. 380
381
Demographic information 382
With reference to young transit riders (under 25 years), older riders (over 25 years) are more likely to 383
change to a vehicle or taxi during their commuter trips. This finding is mainly associated with the 384
occupation type as younger riders (under 25 years) are mainly students who might not own a car and/or 385
are less willing to pay for a more expensive transport alternative (e.g. taxi). 386
387
With reference to travellers who had two or more vehicles per household, other travellers were shown to 388
be more likely to change to the other transit options for both commuter and non-commuter trips; 389
however, this was only significant for respondents who did not own any vehicles per household. In 390
addition, the model further concluded that travellers with a driver’s license were more likely to change to 391
a vehicle or taxi compared to travellers without a driver’s license for both trip purposes. 392
393
Station characteristics 394
Relative to the stations without park and ride lots, respondent waiting at the other stations were more 395
likely to choose a vehicle or taxi option during their non-commuter trips. It is understandable that the 396
Page 19 of 34
https://mc06.manuscriptcentral.com/cjce-pubs
Canadian Journal of Civil Engineering
Draft
20
access time to a vehicle for those respondents waiting at stations with park and ride lots was lower than 397
for those respondents waiting at stations without available parking. 398
399
Respondents waiting at end-of-line terminal stations were less likely to change to a vehicle or taxi option 400
compared to respondents waiting at other stations. In terms of the bus AI index, with an increasing AI 401
index, the probability of selecting other transit options also increased. This increase was expected as 402
more bus routes or high bus service frequency would attract travellers to choose the bus option when 403
LRT service was interrupted. 404
405
Relative to the respondents waiting at downtown LRT stations, respondents waiting in the LRT stations 406
in an established community were more likely to change to a vehicle or taxi and were less likely to wait 407
for LRT service recovery during their commuter trips. This finding is logical because established 408
communities have higher vehicle accessibility than do downtown communities. 409
410
Experience with conflicting information 411
The model revealed that travellers who had not experienced situations with conflicting information had a 412
high probability of choosing the vehicle or taxi option for both examined trip purposes. It is possible that 413
these respondents do not have a good knowledge of possible service recovery and thus choose to 414
abandon the transit option. This finding highlights the importance of resolving this problem of conflicting 415
information communicated from different sources. 416
417
Analysis of riders’ stated responses to an oncoming crowded LRT 418
This hypothetical scenario involved a regular weekday with an oncoming crowded LRT and APIS 419
displaying the next LRT arrival time as 5 minutes. The alternatives were squeezing in the first LRT, 420
waiting for next LRT, and changing path (i.e. walk or take the LRT to the other LRT station, go 421
somewhere else and return back when the LRT is likely to be less crowded). 422
Page 20 of 34
https://mc06.manuscriptcentral.com/cjce-pubs
Canadian Journal of Civil Engineering
Draft
21
423
Squeezing in the first LRT was selected as the base category (i.e. Alternative 1) in this scenario. Keeping 424
the explanatory variables constant at zero, the model predicted that compared to squeezing in the first 425
LRT, there was a reduced preference for changing path options for both examined trip purposes. 426
427
For both trips, familiarity with the LRT service frequency and having a driver’s license were not 428
statistically significant and, thus, were dropped from the model. In the case of non-regular commutes, 429
vehicle ownership was also not statistically significant and was dropped from the model. 430
431
The impacts of other explanatory variables are provided in Table 4. They are discussed in the following 432
subsections. 433
434
Experience with the LRT 435
The multinomial logit model determined that travellers whose main travel mode was cycling or walking 436
were more likely to select waiting for the next LRT option and were less likely to select the changing 437
path option compared to car users. 438
439
Relative to non-frequent LRT riders (< 1 day/week), frequent LRT riders (1 or more days/week) 440
preferred to change paths during their commuter trips, although the finding was only significant for riders 441
who use the LRT 5 or more days per week. This finding might be explained by the fact that frequent 442
users are usually familiar with other transit routes. 443
444
Experience with APIS 445
Respondents who were familiar with APIS were more likely to change path during their commuter trips 446
when the oncoming LRT was crowded if the estimated LRT arrival time was 5 minutes. However, 447
respondents who were not familiar with APIS were less likely to change path. 448
Page 21 of 34
https://mc06.manuscriptcentral.com/cjce-pubs
Canadian Journal of Civil Engineering
Draft
22
449
Relative to respondents who viewed APIS as accurate, travellers who viewed APIS as unreliable were 450
more likely to wait for the next LRT for both examined trip purposes. This finding seems 451
counterintuitive. Future research needs to examine more closely the interaction between train crowding 452
levels and APIS. 453
454
Demographic information 455
With reference to young transit riders (under 25 years), older riders (over 25 years) preferred to take the 456
next LRT during commuter trips. This result may be because younger riders place lower expectation on 457
comfort level. 458
In terms of gender, male respondents preferred to change their travel plans during their non-commuter 459
trips. 460
461
Weather conditions 462
Travellers were more likely to take the next LRT or change their plans on a typical summer day (15℃ -463
25℃ with no expected rain) than when the temperature was between -25℃ and -5℃ with no expected 464
snow for both examined trip purposes. 465
466
Trip characteristics 467
In terms of the LRT IVT, as IVT increased, the probability of waiting for the next LRT increased. 468
Therefore, travellers with a long travel time have high expectations regarding comfort level and are, thus, 469
less likely to accept crowded trains for long travel times. 470
471
Page 22 of 34
https://mc06.manuscriptcentral.com/cjce-pubs
Canadian Journal of Civil Engineering
Draft
23
Station characteristics 472
The respondents waiting at stations with enclosed steel and glass structures were more likely to choose 473
the next LRT option during their non-commuter trips, compared with the respondents waiting at an in-474
community platform. 475
476
Respondents waiting at end-of-line terminals were less likely to change their path than those waiting at 477
other stations, although the finding was only significant for commute trips. This finding was expected 478
because the LRT to arrive at an end-of-line terminal was expected to be empty. 479
480
Relative to the respondents waiting at the downtown LRT stations, respondents waiting at other LRT 481
stations were less likely to change path, although the finding was only significant for inner city stations; 482
walking distance to a public place, such as a coffee shop, shopping mall and restaurants in the downtown 483
is shorter than that in other areas. 484
Discussion: 485
In this paper, four multinomial logit models were developed and calibrated to explore the factors 486
affecting trip decision-making for commuter and non-commuter trips. 487
In the scenario when inconsistent information was presented: 488
• The following factors were found to have a significant impact on riders’ behavioural choices for 489
changing to a vehicle or taxi for both commuter and non-commuter trips were identified as: 490
vehicle being the primary transportation mode, infrequent LRT riders (< 1 day/week), frequency 491
of looking at the APIS display, no previous experience in encountering conflicting information, 492
having a driver’s license, and waiting at end-of-line terminal stations. 493
• The following factors had positive influences for inducing riders to choose other transit 494
alternatives for both examined trip purposes: the primary mode of transportation being transit, 495
having a household vehicle ownership of 0 and waiting at city centre stations. 496
Page 23 of 34
https://mc06.manuscriptcentral.com/cjce-pubs
Canadian Journal of Civil Engineering
Draft
24
• The following factors were found to be contributing factors in a rider’s choice for waiting for the 497
LRT for both trip purposes: frequent LRT rider (5 or more days/week), not having a driver’s 498
license and waiting at terminal station. 499
For the second scenario, which involved an oncoming crowded LRT, while APIS displayed the next LRT 500
arrival time as 5 minutes: 501
• The following factors had a significant contribution to positively influence riders’ choice for 502
squeezing in the first LRT for both commuter and non-commuter trips: the primary 503
transportation mode being a vehicle, young riders (under 25 years), cold weather, and not waiting 504
at end-of-line terminal stations. 505
• The factors that had positive influences for waiting for the next LRT for both examined trip 506
purposes were: the primary mode of transportation being other, a low perceived APIS accuracy, 507
older adults (over 25 years), warm weather, waiting at end-of-line terminal stations, and a long 508
LRT IVT. 509
• The factors that positively influenced riders’ choices for changing paths for both trip purposes 510
were: having a primary ‘other’ mode of transportation (like a bicycle), warm weather conditions, 511
and station at close proximity to the city centre. 512
Conclusion: 513
Several ATIS studies investigated the underlying factors affecting riders’ trip decision-making. However, 514
the literature has not extensively examined the contributing factors affecting the travellers’ trip-specific 515
behavioural responses to APIS in the case of overcrowded trains or conflicting information with a 516
significant gap in real-time transit arrival. This study focused on examining and understanding the factors 517
that affect transit riders’ behavioural responses to APIS in these specific situations. 518
The outcomes of this study provide useful insights to transit agencies for further development of 519
APIS. In the case of the LRT service interruption with inconsistent real-time information, vehicle 520
availability had a significant impact on travellers’ mode-switch behaviour. The provision of designated 521
Page 24 of 34
https://mc06.manuscriptcentral.com/cjce-pubs
Canadian Journal of Civil Engineering
Draft
25
parking locations around LRT stations for car-sharing programs such as car2go service may further 522
increase the likelihood of using such alternative when LRT service is running late or is disrupted. In 523
addition, in the case of the presence of conflicting information, when audio announcements broadcasted 524
the expected time when LRT service was restored, more riders would choose to wait for the LRT. Thus, 525
the provision of audio information is crucial in reducing the uncertainty of waiting time and convincing 526
riders to wait for LRT. As a significant percentage of respondents (40.82 to 44.84 % for non-commute 527
and commute trips respectively) state that they would change to car or taxi when conflicting information 528
is presence, Calgary Transit should work on treating this situation and avoid that it occurs in the first 529
place. Transit staff in transit control center should find a technical solution to override the APIS software 530
and dissipate service recovery time that is consistent with the information disseminated by audio 531
announcement. 532
533
Waiting for the next LRT to arrive when the train was crowded was less likely to be chosen by 534
respondents in cold weather (-25°C to -5°C, no snow expected) than in warm weather (15°C to 25°C, no 535
rain expected). Calgary’s LRT stations range from simple platforms to large enclosed steel and glass 536
structures. Some of the platforms do not provide a heated waiting area. Calgary Transit might consider 537
having heated waiting areas on LRT platforms to make the waiting time easier for riders who prefer to 538
wait for the next train rather than squeeze into a crowded train. Making waiting time more convenient is 539
especially important for riders who are travelling for relatively long distances on the train and place 540
importance on trip comfort level. In addition, the provision of next train anticipated crowding conditions 541
with train arrival information is vital to help passengers better plan their trip and productively manage 542
their waiting time (e.g. run for some errands, make phone calls, etc.) 543
544
In addition, many respondents showed an interest in other transit alternatives. However, a lack of 545
familiarity with the transit service may deter some riders from taking this option. Thus, providing 546
information on alternative transit routes at LRT stations may help transit riders to access other transit 547
Page 25 of 34
https://mc06.manuscriptcentral.com/cjce-pubs
Canadian Journal of Civil Engineering
Draft
26
choices during their trip. Information can be made more visible by including transit maps in addition to 548
the existing LRT maps at LRT stations. These references would help travellers feel more comfortable in 549
choosing alternatives transit modes. 550
551
This study can be expanded in several ways to better understand transit riders’ responses to APIS. A 552
Stated preference (SP) approach was applied to model discrete behaviour choices. One way to validate 553
the SP survey results is through a revealed preference survey. Furthermore, the travellers’ most frequent 554
origin stations were used in the model. However, the return stations were excluded from this research; 555
including that information in further study would provide more insights. In addition, future studies 556
should also examine passengers’ responses as affected by other factors, such as waiting time uncertainty, 557
acceptable prediction error, train crowding levels and the interaction effect between information 558
inconsistency and the crowding level of trains. 559
560
561
Acknowledgment: 562
This paper was supported by the Urban Alliance professorship funds from the City of Calgary. The 563
authors would like to thank Mr. Scott Hale from Calgary Transit for his help in this research. 564
565
566
567
568
569
570
571
572
573
Page 26 of 34
https://mc06.manuscriptcentral.com/cjce-pubs
Canadian Journal of Civil Engineering

Draft
27
574
575
Page 27 of 34
https://mc06.manuscriptcentral.com/cjce-pubs
Canadian Journal of Civil Engineering
Draft
28
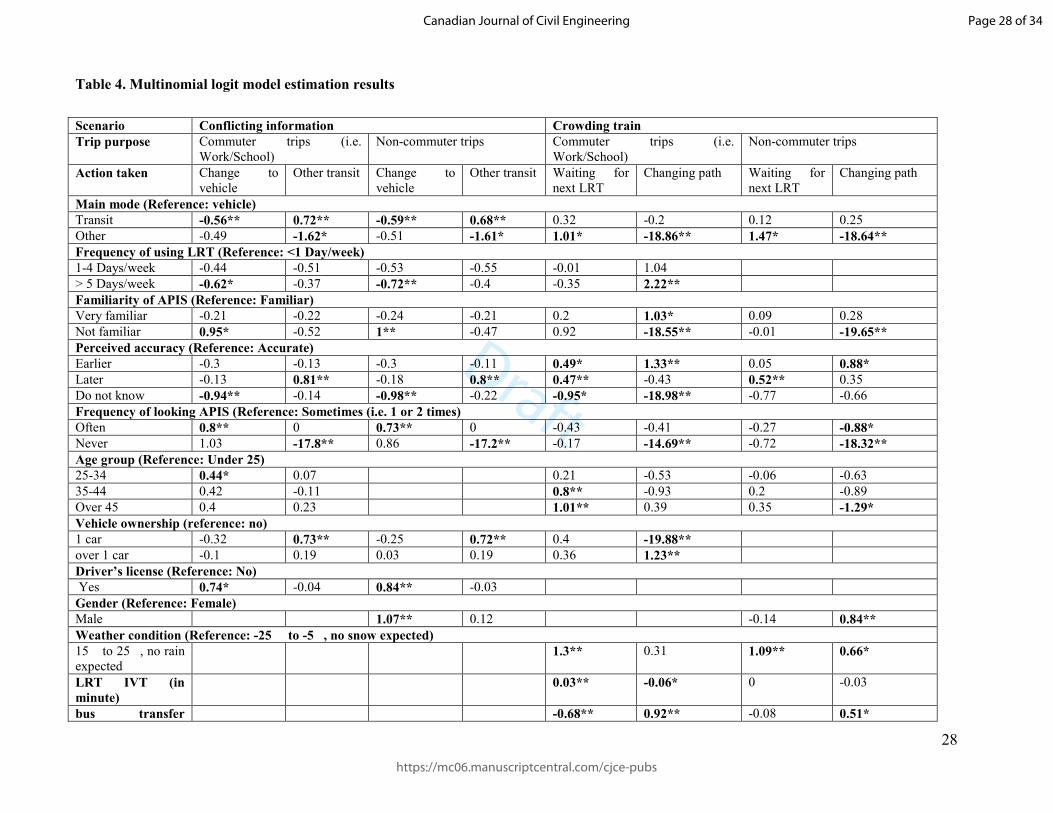
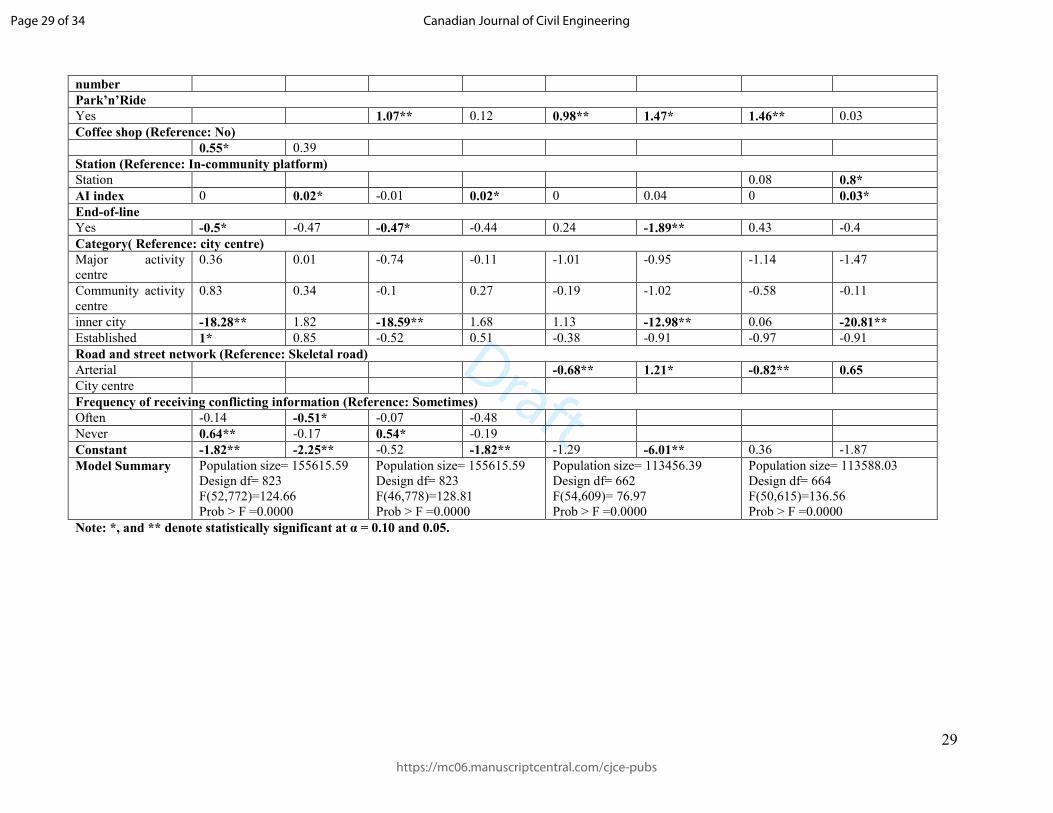
Table 4. Multinomial logit model estimation results
Scenario Conflicting information Crowding train
Trip purpose Commuter trips (i.e.
Work/School)
Non-commuter trips Commuter trips (i.e.
Work/School)
Non-commuter trips
Action taken Change to
vehicle
Other transit Change to
vehicle
Other transit Waiting for
next LRT
Changing path Waiting for
next LRT
Changing path
Main mode (Reference: vehicle)
Transit -0.56** 0.72** -0.59** 0.68** 0.32 -0.2 0.12 0.25
Other -0.49 -1.62* -0.51 -1.61* 1.01* -18.86** 1.47* -18.64**
Frequency of using LRT (Reference: <1 Day/week)
1-4 Days/week -0.44 -0.51 -0.53 -0.55 -0.01 1.04
> 5 Days/week -0.62* -0.37 -0.72** -0.4 -0.35 2.22**
Familiarity of APIS (Reference: Familiar)
Very familiar -0.21 -0.22 -0.24 -0.21 0.2 1.03* 0.09 0.28
Not familiar 0.95* -0.52 1** -0.47 0.92 -18.55** -0.01 -19.65**
Perceived accuracy (Reference: Accurate)
Earlier -0.3 -0.13 -0.3 -0.11 0.49* 1.33** 0.05 0.88*
Later -0.13 0.81** -0.18 0.8** 0.47** -0.43 0.52** 0.35
Do not know -0.94** -0.14 -0.98** -0.22 -0.95* -18.98** -0.77 -0.66
Frequency of looking APIS (Reference: Sometimes (i.e. 1 or 2 times)
Often 0.8** 0 0.73** 0 -0.43 -0.41 -0.27 -0.88*
Never 1.03 -17.8** 0.86 -17.2** -0.17 -14.69** -0.72 -18.32**
Age group (Reference: Under 25)
25-34 0.44* 0.07 0.21 -0.53 -0.06 -0.63
35-44 0.42 -0.11 0.8** -0.93 0.2 -0.89
Over 45 0.4 0.23 1.01** 0.39 0.35 -1.29*
Vehicle ownership (reference: no)
1 car -0.32 0.73** -0.25 0.72** 0.4 -19.88**
over 1 car -0.1 0.19 0.03 0.19 0.36 1.23**
Driver’s license (Reference: No)
Yes 0.74* -0.04 0.84** -0.03
Gender (Reference: Female)
Male 1.07** 0.12 -0.14 0.84**
Weather condition (Reference: -25 to -5, no snow expected)
15 to 25, no rain
expected 1.3** 0.31 1.09** 0.66*
LRT IVT (in
minute)
0.03** -0.06* 0 -0.03
bus transfer -0.68** 0.92** -0.08 0.51*
Page 28 of 34
https://mc06.manuscriptcentral.com/cjce-pubs
Canadian Journal of Civil Engineering
Draft
29
number
Park’n’Ride
Yes 1.07** 0.12 0.98** 1.47* 1.46** 0.03
Coffee shop (Reference: No)
0.55* 0.39
Station (Reference: In-community platform)
Station 0.08 0.8*
AI index 0 0.02* -0.01 0.02* 0 0.04 0 0.03*
End-of-line
Yes -0.5* -0.47 -0.47* -0.44 0.24 -1.89** 0.43 -0.4
Category( Reference: city centre)
Major activity
centre
0.36 0.01 -0.74 -0.11 -1.01 -0.95 -1.14 -1.47
Community activity
centre
0.83 0.34 -0.1 0.27 -0.19 -1.02 -0.58 -0.11
inner city -18.28** 1.82 -18.59** 1.68 1.13 -12.98** 0.06 -20.81**
Established 1* 0.85 -0.52 0.51 -0.38 -0.91 -0.97 -0.91
Road and street network (Reference: Skeletal road)
Arterial -0.68** 1.21* -0.82** 0.65
City centre
Frequency of receiving conflicting information (Reference: Sometimes)
Often -0.14 -0.51* -0.07 -0.48
Never 0.64** -0.17 0.54* -0.19
Constant -1.82** -2.25** -0.52 -1.82** -1.29 -6.01** 0.36 -1.87
Model Summary Population size= 155615.59
Design df= 823
F(52,772)=124.66
Prob > F =0.0000
Population size= 155615.59
Design df= 823
F(46,778)=128.81
Prob > F =0.0000
Population size= 113456.39
Design df= 662
F(54,609)= 76.97
Prob > F =0.0000
Population size= 113588.03
Design df= 664
F(50,615)=136.56
Prob > F =0.0000
Note: *, and ** denote statistically significant at α = 0.10 and 0.05.
Page 29 of 34
https://mc06.manuscriptcentral.com/cjce-pubs
Canadian Journal of Civil Engineering
Draft
30
Reference:
- American Public Transportation Association, 2013. Ridership data 2012.
http://www.apta.com/resources/statistics/Pages/RidershipArchives.aspx. Accessed November 2015.
- Bai Y. and Kattan L. (2014). Modelling Riders’ Behavioral Response to Real-time information on
LRT Stations. Transportation Research Record: Journal of the Transportation Research Board.
Volume 2412 / Travel Behavior 2014, Vol. 1. pp. 82-92.
- Bai Y., 2014. Modelling Riders' Behavioural Responses to Real-Time Information at LRT Stations in
Calgary, Alberta, Master thesis, University of Calgary.
- Body, A. 2007. Regional update: signal pre-emption and improvements to real-time passenger
information are playing a key role in improving passenger transport patronage and reducing road
congestion in the Auckland region. ITS International 13 (1), 33–34.
- Caulfield, B. and M. Mahony, 2009. A Stated Preference Analysis of Real-Time Public Transit Stop
Information. Journal of Public Transportation, Volume 12, Issue Number 3.
- Caulfield, J. and O'Mahony, M. M., 2004. The provision of on street passenger information via real
time passenger. Proceedings of the IEEE Conference on Road Transport Information and Control.
London, UK.
- Cats, O. 2011. Dynamic Modelling of Transit Operations and Passenger decisions. PhD Dissertation.
Stockholm: KTH – Royal Institute of Technology.
- Calgary Transit: www.calgarytransit.com. Accessed December 2017
- Cats, O. and Gkioulou Z., 2017. European Journal of Transportation Logistics. 6: 247.
o https://doi.org/10.1007/s13676-014-0070-4.
- City of Calgary: City of Calgary Calgary and Region: Travel and Activity Survey Final Report,
November 2012.
http://www.calgary.ca/Transportation/TP/Documents/forecasting/CARTAS_FinalReport_112012.pdf
. Accessed December 2017.
Page 30 of 34
https://mc06.manuscriptcentral.com/cjce-pubs
Canadian Journal of Civil Engineering

Draft
31
- Davidson, B., Vovsha, P., Abedini, M., Chu, C., and Garlan, R., 2011. Impact of capacity, crowding,
and vehicle adherence on public transport ridership: Los Angeles and Sydney experience and
forecasting approach. Proceedings of the Australasian Transport Research Forum, Adelaide,
Australia.
- Drabicki A., Kucharski R., Cats O. and Fonzone A., 2017. Proceedings of the 5th IEEE International
Conference on Models and Technologies for Intelligent Transportation Systems (MT-ITS). June
2017. Naples, Italy
- Dziekan, K., Kottenhoff, K., 2007. Dynamic at-stop real-time information displays for public
transport: effects on customers. Transportation Research Part A 41, 489–501.
- Eboli L. and Mazzulla G., 2015. Relationships between rail passengers’ satisfaction and service
quality: a framework for identifying key service factors. Journal of Public Transport, Vol.
7, Issue 2, pp 185–201
- Ferris, B., Watkins, K., and Borning, A., 2010. One bus away: results from providing real-time
arrival information for public transit. Proceedings of CHI 2010. Atlanta, G.A. USA.
- Gooze A., Watkins A. E. and Borning A., 2013. Benefits of Real-Time Transit Information and
Impacts of Data Accuracy on Rider Experience. Transportation Research Record. Vol. 2351, pp. 95–
103.
- Hensher DA, Rose JM, Collins AT, 2011. Identifying commuter preferences for existing modes and
a proposed Metro in Sydney, Australia with special reference to crowding. Public Transport. Vol.3,
pp.109–147
- Kattan L., de Barros, A. G. and Saleemi, H., 2013. Travel behavior changes and responses to
advanced traveler information in prolonged and large-scale network disruptions: a case study of west
LRT line construction in the city of Calgary. Transportation Research, Part F - Traffic Psychology
and Behaviour, Volume 21F, pp. 90 – 102.
- Kattan L., Hurul Habib K. and Islam, T., 2012. Information Provision and Driver Compliance to
ATIS Application: Case Study on the Interaction between Variable Message Sign and Other Sources
Page 31 of 34
https://mc06.manuscriptcentral.com/cjce-pubs
Canadian Journal of Civil Engineering
Draft
32
of Traffic Updates in Calgary, Canada, Canadian Journal of Civil Engineering, 2011, 38(12), pp.
1335-1346.
- Katz, D. and Garrow, L. A., 2012. The impact of bus door crowding on operations and safety.
Journal of Public Transportation, 15(2), 71-93.
- Kockelman K and Kweon Y. J., 2002. Driver Injury Severity: An Application of Ordered Probit
Models. Accident Analysis and Prevention 34 (4) pp: 313-321.
- Kim J-K. Lee B. and Oh S., 2009. Passenger choice models for analysis of impacts of real-
time bus information on crowdedness. Transportation Research Record, 2112, 119-126.
- Kim KM, Hong S-P, Ko S-J, Kim D., 2015. Does crowding affect the path choice of metro
passengers? Transportation Research Part A. Vol 77, pp. 292–304
- Maunsell, F. 2007. Demand management techniques - peak spreading. London, UK: Department for
Transport, Transport for London and Network Rail.
- MVA Consultancy, 2007. Understanding the Passenger, Valuation of Overcrowding on Rail
Services, London, UK: Department of Transport.
- Mulley M., Clifton GT, Balbontin C. and Ma L., 2017. Information for travelling: Awareness and
usage of the various sources of information available to public transport users in NSW.
Transportation Research Part A: Policy and Practice. Volume 101, pp. 111-132.
- Nijkamp, P., Pepping, G., and Banister, D., 1996. Telematics and transport behaviour. Springer-
Verlag, Berlin.
- Pel, A, Bel N.H. and Pieters M (2014). Including passengers’ response to crowding in the Dutch
national train passenger assignment model. Transportation Research Part A: Policy and Practice.,
Vol. 66, pp. 111–126.
- Preston J., Pritchard J., and WatersonB., 2016. Train overcrowding: investigating the use of better
information provision to mitigate the issues Transportation Research Record, 2649, pp. 1-19.
Page 32 of 34
https://mc06.manuscriptcentral.com/cjce-pubs
Canadian Journal of Civil Engineering
Draft
33
- Pritchard J., 2017. Providing Improved Crowding Information to Provide Benefits for Rail
Passengers and Operators. In: Stanton N. (eds) Advances in Human Aspects of Transportation.
AHFE 2017. Advances in Intelligent Systems and Computing, vol 597. Springer, Cham.
- Rahman, MM, Wirasinghe, SC and Kattan, L., 2013. Users' views on current and future real time
bus information systems. Journal of Advanced Transportation Apr/2013, Volume 47, Issue 3, pp. 336
- 54
- Raman, M., Schweiger, C., Shammout, K., and Williams, D., 2003. Guidance for developing and
deploying real-time traveller information systems for transit. Federal Transit Administration, U.S.
Department of Transportation, National Technical Information Service/NTIS, Springfield, Virginia,
USA.
- Russell, M. L., 2012. Travel time use on public transport: what passengers do and how it affects.
Ph.D. Dissertation, Philosophy, University of Otago, Dunedin, New Zealand.
- Rutherford, G., Wang, Y., Watkins, K., and Malinovskiy, Y., 2011. Perceived and actual wait time
measurement at transit stops using Bluetooth (No. TNW2012-09). USA: Transportation Northwest,
Washington State Department of Transportation.
- SAIC: Science Applications International Corporation, 2003. Oregon regional Intelligent
Transportation Systems (ITS) Integration program draft phase III report: transit tracker information
displays (Contract No DTFH61-96-C-00098). USA: Department of Transportation.
- Tang, L., and Thakuriah P., 2012. Ridership effects of real-time bus information system: a case study
in the City of Chicago. Transportation Research Part C, 22, 146-161.
- Wardman, M., and Whelan, G., 2011. Twenty years of rail crowding valuation studies: evidence and
lessons from British experience. Transport Reviews, 31, (3), 379-398.
- Warman, P., 2003. Measured impacts of real-time control and information systems for bus services.
London, UK: Department for Transport.
- Zhang, F., 2010. Traveller responses to real-time transit passenger information systems, Ph.D.
Dissertation, School of Architecture, University of Maryland, M.D. USA.
Page 33 of 34
https://mc06.manuscriptcentral.com/cjce-pubs
Canadian Journal of Civil Engineering

Draft
34
- Zhang Y., Jenelius E. and Kottenhof K., 2017. Impact of real-time crowding information: a
Stockholm metro pilot study. Journal of Public Transport DOI 10.1007/s12469-016-0150.
Page 34 of 34
https://mc06.manuscriptcentral.com/cjce-pubs
Canadian Journal of Civil Engineering