Embed Size (px)
Citation preview
Market Reaction to the Positiveness of Annual Report Narratives
Liafisu Sina Yekini *
Coventry UniversityCoventry Business SchoolWilliam Morris Building
Gosford StreetCoventry, CV1 5DL, UKTel: +44 024 7688 8440
E-mail: [email protected]
Tomasz Piotr WisniewskiUniversity of LeicesterSchool of Management Ken Edwards Building
University RoadLeicester LE1 7RH, UKTel: +44 116 252 3958
E-mail: [email protected]
Yuval MilloUniversity of LeicesterSchool of Management Ken Edwards Building
University RoadLeicester LE1 7RH, UKTel: +44 116 229 7385E-mail: [email protected]
_________________________* Corresponding author
1
Market Reaction to the Positiveness of Annual Report Narratives
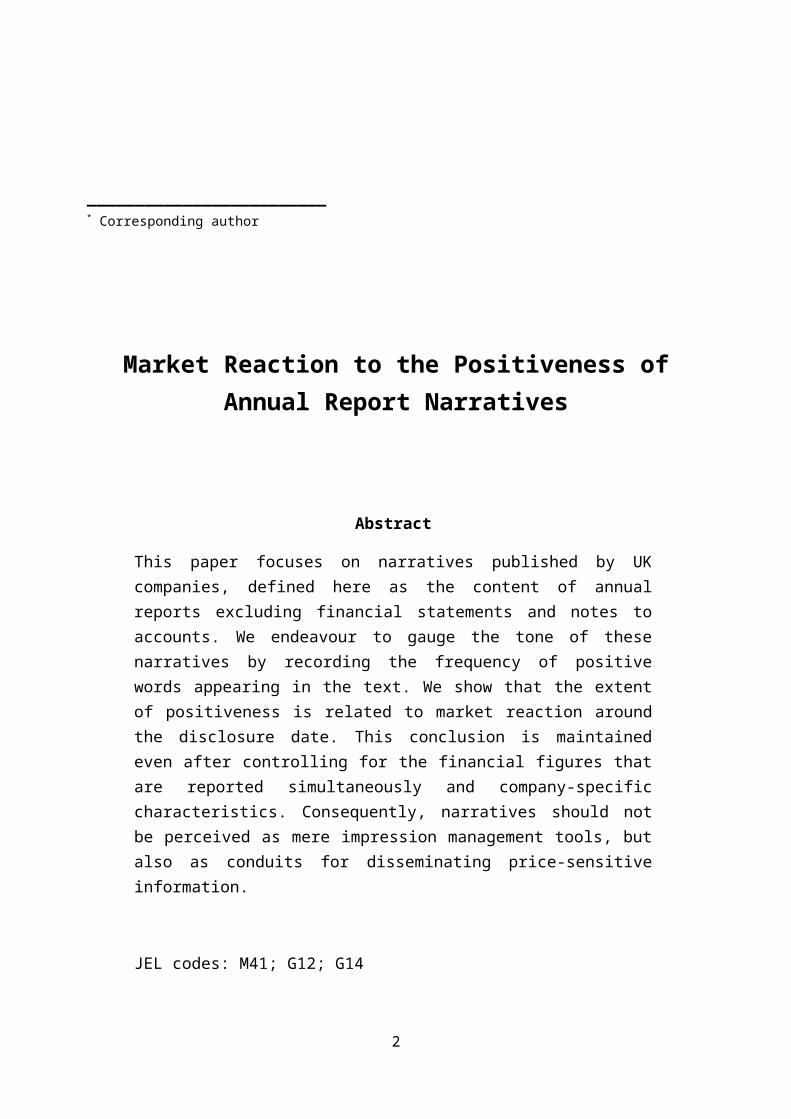
Abstract
This paper focuses on narratives published by UK companies, defined here as the content of annual reports excluding financial statements and notes to accounts. We endeavour to gauge the tone of these narratives by recording the frequency of positive words appearing in the text. We show that the extent of positiveness is related to market reaction around the disclosure date. This conclusion is maintained even after controlling for the financial figures that are reported simultaneously and company-specific characteristics. Consequently, narratives should not be perceived as mere impression management tools, but also as conduits for disseminating price-sensitive information.
JEL codes: M41; G12; G14
Keywords: Annual report narrative, content analysis, stock market reaction
2

1. Introduction
Recent academic studies have paid increasing attention to the market impact of the tone
inherent in corporate narratives (Frankel, Mayew, & Sun, 2010; Davis & Tama-Sweet, 2012;
Huang, Teoh, & Zhang, 2014). Previous literature examined, amongst others, corporate press
releases (Ahern & Sosyura, 2014), quarterly earnings announcements and conference calls
(Francis, Schipper, & Vincent, 2002; Demers & Vega, 2010; Price, Doran, Peterson, & Bliss,
2012; Davis, Piger, & Sedor, 2012). Notwithstanding the advances made in this area of research,
relatively little attention has been paid to the narratives of annual reports as a whole. The extant
content analysis of annual reports has been predominantly restricted to relatively short sub-
sections, such as company presidents’ letters to shareholders (McConnell, Haslem, & Gibson,
1986; Abrahamson & Amir, 1996; Swales, 1988; Smith & Taffler, 2000). A study by Loughran
and McDonald (2011), who linked the tone of full 10-K forms to filling period returns,
constitutes a notable exception. This gap in the literature is significant, as a growing body of
work suggests that the language used in the qualitative part of annual reports plays a role in
framing the quantitative section of the documents (Hoskin, Hughes, & Ricks, 1986; Anilowski,
Feng, & Skinner, 2007). Although both qualitative and quantitative information are often
released concurrently, recent research has employed statistical techniques to separate the
influence of these two different modes of representation (Francis et al., 2002; Demers & Vega,
2010). We use the same methodological approach in this paper. A better understanding of the
potential impact of the narratives in annual reports will not only help us to understand this
aspect of corporate communications, but also shed more light on the overall impact of these
documents on markets.
While we acknowledge the contribution made by Loughran and McDonald (2011), our
research expands their work by examining annual reports published by UK rather than US
companies. Due to the different regulatory frameworks, one should not expect that the results
3
reported in Loughran and McDonald (2011) will be applicable also in the UK context. Notably,
the accuracy and complexity of communications may be dissimilar under principles- and rules-
based standards (Nelson, 2003). Schleicher and Walker (2010) also note that disclosure-related
litigation is significantly less common in the United Kingdom than in the United States, while
Frost and Pownall (1994) and Davies (2009: 311) remark on the SEC’s greater stringency in
monitoring and enforcing annual and interim reporting rules. During the 2005-2014 period,
there were 1,300 SEC enforcement actions related to issuer reporting and disclosure (SEC,
2015). In the UK, on the other hand, the laws against fraudulent misstatements and misleading
reporting do not appear to be sufficiently deterrent (Ferran, 2009: 343) and the definition of
fraud is narrower than in the US (Davies, 2007: 44). If legal considerations were paramount to
reputational issues, one would expect that UK managers would be more inclined to manipulate
the tone of annual report narratives.
It must be acknowledged that a number of previous studies employed content analysis
based on UK data. Smith and Taffler (1995) examined whether their research participants were
able to discriminate between failed and non-failed companies by reading chairmen’s statements.
They also conducted additional investigations inquiring into whether keywords and themes
contained in chairmen’s statements, as well as readability and understandability of these texts,
predict bankruptcy (Smith & Taffler 1992, 2000). Schleicher and Walker (2010) employed a
manual analysis method to scrutinize the tone of the outlook section, which is a part of the
chairman’s statement. They found that firms with impending declines in sales growth and profit
margin bias the tone upwards and that the tone depends on managerial incentive variables.
Clatworthy and Jones (2003) look at how chairmen’s narratives relate to profit before taxation
and find that management tends to report in a way that best serves its own interests, crediting
itself for good news and attributing bad news to the external environment. Finally, Brennan,
4
Guillamon-Saorin, and Pierce (2009) focus on creating a new multi-dimensional impression
management measure.
While these papers make a substantial contribution to our understanding of qualitative
managerial communications, they differ substantially from the current paper. Ours is a study
that, unlike its UK predecessors, examines market reaction (as measured by returns) to the
disclosure of narratives. In doing so, it also focuses on longer documents. This is particularly
helpful, as identification of linguistic style is more reliable for lengthy texts (Grimmer &
Steward, 2013: 272). Such observation has also been made in the field of authorship attribution
analysis, where longer textual samples are considered to have greater discriminatory power in
terms of distinguishing authorship characteristics (Baillie, 1974; Ledger & Merriam, 1994).
Although all these differences between our paper and prior studies are non-trivial, there is one
striking similarity worth mentioning. Namely, we found that narratives disclosed by companies
are indeed an important medium of communication and that they should not be overlooked.
The overarching aim of this paper is to measure the degree of positiveness woven into
annual report narratives of UK companies between January 2006 and June 2013. The
‘narrative’, to which we also refer as the ‘qualitative part of an annual report’, is defined here as
the content of the annual report including independent auditors’ report, but excluding financial
statements and the notes to the accounts. Following the accepted convention, any numbers
appearing in the narrative are not removed from the text. Furthermore, from a definitional
perspective, in this study we use the word ‘tone’ when referring to positiveness or net
positiveness of narratives. We focus on gauging the impact of positiveness because managers
may either be incentivized to send an upbeat message to investors and other users of accounts
or, alternatively, they may simply be expressing their understanding of corporate performance.
An ongoing debate in accounting literature revolves around the question of whether qualitative
disclosure is a vehicle for incremental information content or an element of managerial attempts
5
to carry out impression management (Merkl-Davies, Brennan, & McLeay, 2011). We believe
that our study can contribute to this debate by demonstrating that the tone of narratives indeed
conveys information, which investors find to be material in nature. Consequently, it is
imperative that market participants familiarize themselves with these narratives as soon as they
become available. We also want to note at this stage that measuring market reaction is important
as it allows us to make inferences about investor behaviour.
Our findings show that abnormal returns in short windows surrounding financial report
disclosure dates correlate significantly with the positiveness encapsulated in annual reports.
However, deriving inferences from a simple correlation coefficient can be misleading, due to the
fact that financial figures are disclosed concurrently with narratives. The disentanglement of the
individual influences exerted by the narratives and the quantitative data has been attempted here
in a multivariate regression framework. The results obtained from this analysis indicate that
positiveness remains an important factor explaining market reaction, even after financial
performance and company characteristics have been controlled for.
The remainder of the article is organized as follows. The next section reviews the
literature in the field and provides justification for our study. This is followed by a section on
theoretical considerations and a further one describing the methodological framework. Section 5
elaborates on our data sources and the characteristics of the sample, while Section 6 presents the
results of our empirical analysis. Section 7 offers additional considerations and the paper ends
with some conclusions and a list of implications.
2. Research Context
Our investigation employs content analysis in the context of corporate annual report
narratives. One way to approach this task is to rely on human judgment to evaluate these texts.
6
However exploring this avenue would be extremely time-consuming given that our sample
comprises 1,410 lengthy documents. There are a number of researchers who took this route,
including Bhattacharya, Galpin, Ray, and Yu (2009) who read and evaluated over 171 thousand
news items about Internet IPOs, and Smith and Taffler (1995) who engaged 146 students to
process chairmen’s statements. A second method is to employ statistical evaluation of textual
data – an approach that was introduced in the accounting context by Frazier, Ingram, and
Tennyson (1984) who used a software prototype called Words. Since then, there has been
considerable progress in the software applications available and in quantitative linguistics,
however most of the algorithms rely on computing the frequencies of words falling into a given
category.
In our research we rely on the thesaurus of positive words developed by Henry (2008:
387) that was created specifically for accounting and finance applications. Henry’s wordlist has
already gained some popularity among researchers. For instance, it has been used to measure the
tone of R&D disclosures (Merkley, 2014), transcripts of earnings conference calls (Doran,
Peterson & Price, 2012; Price et al., 2012; Davis, Ge, Matsumoto & Zhang, 2015), discretionary
disclosures prior to restatements (Gordon, Henry, Peytcheva & Sun, 2013) and investment
proposals submitted to business angles (Parhankangas & Ehrlich, 2014). Rogers, Van Buskirk
and Zechman (2011) employ Henry’s library of words to document that the use of overly
optimistic language in earnings announcements increases litigation risk.
Importantly, extant literature suggests that the tone of qualitative corporate reports may
have non-negligible market impact. Kothari and Short’s (2003) findings indicate that positive
disclosure favourably affects cost of capital and price volatility, while Li (2010) shows that the
tone of forward-looking statements has predictive power for the company’s future performance.
Furthermore, Davis et al. (2012), Demers and Vega (2010) and Huang et al. (2014) documented
7
that an optimistic disposition in corporate earnings press releases is associated with abnormal
market returns following the announcements.
Following this trajectory in the literature, we identified two important points that
affected our research design, namely the focus on the qualitative part of annual reports and the
attention to positive tone within the text. In contrast with much of the existing literature - where
a variety of corporate narrative outputs, such as earnings announcements, press releases, as well
as texts from financial mass media (Tetlock, 2007; Tetlock, Saar-Tsechansky, & Macskassy,
2008) are examined - we decided to focus our examination on the qualitative part of companies’
annual reports. In the UK, the Companies Act 2006 and the amendments to this Act introduced
in 2013 require large and medium listed companies to incorporate certain sections in their
annual reports. These include the strategic report/business review section (covering business
description, issues related to performance, principal risks, position, trends and factors, and key
performance indicators), the corporate social responsibility statement (describing environmental,
employee and community issues), the directors’ report, the directors’ remuneration report, and
the statement of directors’ responsibilities. The UK Corporate Governance Code provides
guidance on the directors’ remuneration and directors’ reports, while the Listing Rules require
companies to either comply with the UK Corporate Governance Code or explain why they have
failed to do so. Disclosure and Transparency Rules outline a framework for providing corporate
governance statements. Compliance with regulations is monitored by the Financial Reporting
Council.1 While managers are still afforded significant discretion as to how to frame corporate
performance and how much optimism to inject into the narrative, texts produced by different
companies comprise a relatively structurally homogenous sample, which contributes to more
effective analysis of the examined factor in the text.
1 This obligation arises from the regulatory need to enforce the Companies Act 2006 and the amendments to this act introduced in 2013. This regulatory body also issued guidance on strategic and directors’ reports.
8
Our focus on positiveness follows from the contextual nature of qualitative texts.
Although we acknowledge the issue of inherent context-dependence of qualitative corporate
disclosures, our measurement choice incorporates the assumption that qualitative parts in annual
reports are aimed at communicating an overall positive tone and that they do so by repeatedly
signalling to the reader the positiveness of the firm’s activities, regardless of the immediate
context in which these are presented. In the case of such texts, which are contextually positive, a
measure of the degree of upbeat tone, above and beyond what investors already accept, may
affect investors’ decision-making. In fact, the reaction of market participants is likely to be more
pronounced if they perceive the narrative part of annual reports to be a conduit for new material
information rather than a mere impression management tool.
3. The Influence of Narratives
To gain a better understanding of the association between the positiveness of narratives and
market response, we deploy a theoretical framework that addresses the potential underpinning
mechanisms of this phenomenon. Research focusing on the economic utility that investors
receive from qualitative disclosures finds that tone conveys decision-relevant information. For
example, Li (2010) finds an association between tone and future earnings, while Davis et al.
(2012) show that managers use language to signal expectations about the firm’s performance.
We wish to theorise how this information is incorporated and utilised in the investor’s decision-
making, which we regard in this context to be primarily a cognitive process. That is, although
the environment in which decisions are taken may sometimes be comprised of groups of
investors, the activity of reading the narrative is essentially an individual cognitive process.
Following this, we mobilize theories from cognitive psychology that posit that the tone
incorporated in managerial qualitative disclosures, such as those contained in annual reports,
influences attitude change (Ajzen & Fishbein, 2000; Crano & Prislin, 2006; Perloff, 2010).
9
The influence potential of texts is regarded primarily in psychology as informational
influence, which is seen as cognitive responses to persuasive messages (Petty, Cacioppo, &
Schumann, 1983). According to the Elaboration Likelihood Model (ELM) put forward by Petty
and Cacioppo (1986), when actors are exposed to potentially persuasive communication and
when they are attentive to this message, they engage in a cognitive structure change. This
process encourages the creation of new cognitions that may then be adopted and stored in
memory and, as a result, different responses become more salient than previously (Sussman &
Siegal 2003; Petty & Cacioppo 2011). Put differently, influence is conceptualized as a
cumulative series of signals in the text that, when read by the actor, gradually brings about
cognitive structure change and a change in attitude.
Further findings from experimental psychology and marketing are also relevant. Wilson
and Miller (1968) document that repeated arguments become more persuasive, while Weiss
(1969) finds that repeated exposure to a message is related to a higher degree of opinion
formation. Commenting on the existing literature, Malaviya, Meyers‐Levy, and Sternthal (1999)
note that increasing the number of exposures to commercial advertising affects its
persuasiveness. The literature acknowledges that the association between repetition and
persuasion may be moderated by a number of factors, such as credibility of source or argument
strength.
In the light of ELM, we conceptualize investors reading the narratives in the firms’
reports with the aim of deciding whether or not they should invest in, or alternatively, remove
their investment from the firms in question as a case of engagement in the process of cognitive
structure change. Thus, the relation between repetition and attitude change emphasised in the
literature also motivates us to consider frequency as an important factor in examining the market
impact of annual report narratives. That is, the more often positive tone expressions are
mentioned in the text, the more likely it is that they will be influential. Importantly, we do not
10
theorize directly about the mechanisms that attribute market reaction to the narratives, but our
reading of the literature on informational influence directs our research design. In particular, it
provides justification for choosing a measurement tool that relies on comparing frequencies of
positive tone articulations.
We operationalized our inquiry by programming Henry’s (2008) positiveness thesaurus
into a content analysis software application called Diction.2 By doing so, we were able to
measure the frequency with which positive words are found in each of the annual report
narratives. These frequencies were subsequently linked to abnormal returns around disclosure
dates. We have examined two different event windows and two different statistical models
against which abnormal returns are defined. Our null hypothesis is that market reaction is ceteris
paribus unrelated to the tone inherent in the narratives. A range of control variables has been
collected and incorporated into the regressions in order to more cleanly isolate the influence of
tone.
4. Methodology
Since one of our main objectives is to measure market reaction around a specific event,
that is the publication of an annual report, we employ event-study analysis which is suitable for
the task at hand (Brown and Warner, 1980; 1985). Its aim is to measure abnormal returns (ARs)
that are directly attributable to certain occurrences. An AR is defined as a deviation of the
observed return from the return that would have materialized in absence of the event. Of course,
there is no way of knowing with certainty what would have happened had the event not
2 Diction has become a very popular software package and has found many applications in political science, communication studies, linguistics, business studies, and sociology. Creators of the software track all publications that used it and list them on the following website http://www.dictionsoftware.com/published-studies/ . At the time of writing this paper, Diction was used by the authors of 151 refereed journal articles, 15 books and monographs, 58 book chapters, 68 conference presentations, as well as 49 working papers and proceedings. Notable examples of applications of the Diction software in the field of accounting include Sydserff and Weetman (2002), Yuthas, Rogers and Dillard (2002), Demers and Vega (2010), Rogers et al. (2011), Craig and Brennan (2012), and Davis et al. (2012).
11
occurred. For this reason, instead of relying on an unknown hypothetical construct, ARs
typically gauge returns in excess of some pre-determined statistical benchmark.
As Campbell, Lo, and MacKinley (1997) note, there are two commonly adopted
benchmarks in the context of event-study analysis. The first assumes that, under the null
hypothesis of no market reaction, the returns for a given event i are constant over time and equal
to μi. This implies that, during the period surrounding the event, the mean-adjusted ARs can be
defined as follows:
ARi ,tMA=Ri , t− μ̂i [1]
where Ri,t is the return on the relevant company for event i observed on day t and where μ̂i has
been estimated as an average return on that company during a period preceding the event
window. The second methodological approach accounts for the systematic risk of a security and
overall stock market fluctuation. It estimates a single factor model, where stock returns are
regressed against a stock market index RM, as follows: Ri , t=αi+β i RM ,t +εi , t. The estimation is
based on data recorded immediately prior to the event window and FTSE350 approximates here
the market portfolio. Collecting the parameter estimates, we are able to compute market-model-
adjusted ARs in the temporal proximity of the event:
ARi ,tMM=R i ,t−( α̂i+ β̂ i RM ,t) [2]
The timeframe we select to estimate our event-specific parameters (μi, αi, and βi) begins
201 trading days before the event and ends 2 days before the event. In other words, we use a
200-day estimation window (-201,-2), relative to the first annual report dissemination date (Day
0). Had this window been any longer, one would run the risk of the previous year’s report
disclosure being incorporated within it. Consequently, its usefulness as an event-neutral
benchmark would have been invalidated. On the other hand, shortening the estimation span
would lead to less precise statistical inferences. With regard to examination of the impact of the
report release itself, we choose to focus on two short periods, namely (-1,1) and (-1,5). Since the
12
windows are relatively narrow, the probability that major confounding events will occur during
these ephemeral timeframes is minute, thereby reducing the likelihood of contaminated results.
It is worth noting that prior studies focusing on earnings announcements used event windows of
comparable length (see for instance Francis et al. (2002: 519), Scharnd & Walther (2000: 169)).
In the next step of our analysis, we cumulate the abnormal returns over time for each
event within the relevant period to arrive at the cumulative abnormal return:
CARX i (t1 , t2 )=∑j=t 1
t2
ARi , jX [3]
where X can take the value of either MA or MM depending on whether the ARs are mean- or
market-model-adjusted. The parameter t1 denotes the beginning of the event window, or Day -1
in our case, while t2 can take a value of either +1 or +5 depending on the specification. CAR_X
can be simply interpreted as the totality of market reaction associated with publication of a
particular annual report. In other words, CARs capture the response of investors to the
information contained in both the annual financial statements and the narratives.
To disentangle the impact of qualitative information from that of quantitative data and
company characteristics, we perform regression analysis. More specifically, our estimate of
market response is linked to the positiveness of the descriptive part of the report and other
control variables. More formally, we try to fit the following regression to our data:
CARX i (t1 , t2 )=α+ β1 Positivenessi+ β2 ¿¿ i+ β3 Book¿ i+¿¿
+β4 EarningsSurprisei+β5 ∆ %Salesi+β6 ∆ Leveragei+εi [4]
Detailed definitions of the explanatory variables are provided in Table 1. In our empirical
inquiry we try different values of X and t2. Furthermore, in some of the specifications we restrict
some of the β coefficients to be equal to zero.
[Table 1 about here]
13
The key regressor in equation [4] is Positiveness, which is defined as the fraction of
positive words in the text of an annual report narrative. A large number of studies have utilized
variables constructed by dividing the number of words falling into a given tone category by the
total number of words in the documents. Examples of papers that operationalized measures of
positiveness/optimism constructed in that manner include Feldman, Govindaraj, Livnat, and
Segal (2008), Kothari, Li, and Short (2009), Henry (2006), Cicon, Clarke, Ferris, and Jayaraman
(2014), Wisniewski and Moro (2014), Ferguson, Philip, Lam, & Guo (2015). Cho, Roertd, and
Patten (2010) use the optimism score as a dependent variable to model the biases in corporate
environmental disclosures. At this stage it must be mentioned that a number of studies also
employ a tone variable, which is typically defined as an unadjusted or scaled difference between
positive and negative words (see for instance Henry, 2008; Henry & Leone, 2009; Frankel et al.,
2010). We construct our own version of the tone variable and report the results based on it in the
Further Considerations section.
The text considered in our study runs from the beginning of the document up to and
including the independent auditors’ report. Inclusion of auditors’ reports is justified on the basis
that they include new important information published concurrently with the rest of the annual
report and, just like the remainder of the narratives, express opinions that are not subject to a
rigorous audit. Financial statements and notes to the accounts are omitted from the calculation of
our tone measure, as the contents of these sections has to comply with regulatory requirements
and is carefully audited, leaving little scope for linguistic manoeuvring. In our study, we use
Henry’s (2008: 387) thesaurus of 105 positive words (see Appendix I) that has been developed
with the purpose of analyzing texts residing in the domain of accounting and financial reporting.
Following Henry (2008) and Henry and Leone (2009), we calculate the frequencies of positive
words based on a user-defined dictionary in the computer-aided text analysis program called
Diction.
14
As this wordlist is context-specific and uses specialized language, the problem created
by polysemy (words with several different meanings) is partially mitigated.3 Henry and Leone
(2009) document empirically that, when analyzing earnings press releases, this particular word
corpus is more powerful than the more general alternatives. This is because it does not include
words that are irrelevant in the context of financial disclosure and does not misclassify domain-
specific terms. Although the thesaurus has been developed by a US researcher, we believe that it
is applicable to the UK market, as it does not include words related to culture or regulations.
Furthermore, some British companies may be cross-listed in the US or be willing to attract
American capital, which would induce a large degree of language compatibility on both sides of
the Atlantic. If the market reacts favourably to positive words printed in reports, one would
expect the β1 coefficient in regression [4] to be positive and statistically significant. Further
details on the remaining variables appearing in equation [4] are given in the section that follows.
5. Data
The companies included in our sample are constituents of the FTSE350 stock market index.
From the complete list, we have eliminated 72 companies whose operations fell within the
financial services domain.4 Firms that were merged during our sample period were also
excluded, as were those with an insufficient number of annual reports or information on
financial performance. Our final sample consists of 209 companies listed on the London Stock
Exchange. For this group of companies, we manually downloaded available annual reports
3 The mitigation of the problem of polysemy can be nicely illustrated with the word “beat”. In everyday language this word would be associated with violence, while in the context of financial reporting which often refers to beating forecasts or expectations this word may have positive connotations. 4 Banks and other financial institutions have a different mode of operation compared to other businesses and the financial reporting of these entities is specialized in nature. They have to comply, for instance, with IAS 30 or the Basel Accord and are regulated by the Financial Conduct Authority and Prudential Regulation Authority at the Bank of England. The institutions are subjected to stress testing, have to comply with minimum capital requirements and focus a lot of attention on liquidity and risk management. As a result, the structure of their annual report narratives differs significantly from that of a typical listed company. Some of the other content analysis studies performed for the UK market also concentrate exclusively on non-financial firms (see Clatworthy and Jones, 2003; Schleicher and Walker, 2010).
15
published between January 2006 and June 2013 from corporate web pages, Morningstar and
Bloomberg. At the end of this process we had 1,410 observations, on which more detail is
provided in Appendix II to this paper. The publication date for a given report is assumed to be
the date on which the report appeared either on Bloomberg or Morningstar, whichever occurred
earlier. It should be noted that UK annual reports are almost invariably disseminated as pdf files,
which necessitates conversion to the plain text format required for content analysis. The
converted files were checked manually to ensure consistency. Finally, we obtained data on
company stock prices, market capitalization, book-to-market ratios, and financial indicators
from Datastream.
[Table 1 about here]
In addition to cumulative abnormal returns and the Positiveness measure, which have
already been described in some detail above, this study employs a range of other variables
which act as controls (see Table 1). Firstly, the extant literature documents that small companies
tend to generate higher returns (Banz, 1981; Fama and French, 1992). Secondly, the seminal
work of Rosenberg, Reid, and Lanstein (1985) has discovered a robust relationship between
companies’ book-to-market ratios and rewards earned by investors. We consequently
incorporate the natural logarithm of market capitalization and book-to-market ratios of
companies in our set of regressors, which aligns with the argument of Fama and French (1993),
who argue that these two can be considered the most important risk factors for stocks. The beta
of security is not taken to be an explanatory factor, as the CAR_MM dependent variable has
already been purged of the influences of the general market.
Furthermore, we try to account for financial figures which are released concurrently with
the narrative. Our earnings surprise measure is based on an increase of earnings over a simple
random walk forecast. This definition is dictated primarily by data availability and is similar to
that used in Wisniewski (2004) and Sponholtz (2008). It should be noted that Hughes and Ricks
16
(1987) report that an earnings surprise based on a simplistic seasonal random walk benchmark
outperforms that derived from analyst forecasts, in that it is more closely linked to abnormal
returns around the dissemination date. The numerator of Earnings_Surprise is divided by stock
price, which coheres with the approach used in Easton and Zmijewski (1989), DeFond and Park
(2001), Bartov, Givoly, and Hayn (2002) and Brown and Caylor (2005). We also control for an
increase in financial leverage, which according to Bhandari (1988) is ceteris paribus positively
related to stock returns. Finally, we include the percentage change in sales in our set of
regressors. This inclusion is motivated by the findings of Jordan, Waldron, and Clark (2007)
who show that sales predict stock prices and Barbee, Mukherji, and Raines (1996) who found
that sales yield is one of the strongest determinants of returns.
[Table 2 about here]
Table 2 presents summary statistics for the variables used in our study. The magnitude of
CARs is, on average, close to zero. This is not entirely unexpected, as some disclosures will be
perceived as good news and others as bad news, cancelling each other out in the averaging
process. The mean of our linguistic variable indicates that one in every 209 words appears in our
positive tone thesaurus. Furthermore, companies were confronted with falling earnings per
share, which can be linked to the occurrence of deep recession during our sample period. The
severe impact of the credit crunch is also mirrored in falling financial leverage, as enterprises
struggled to access credit due to the banking sector’s distress. Even in these difficult
circumstances, our sample companies managed to increase their sales volumes, perhaps at the
expense of falling profit margins.
[Table 3 about here]
The correlation matrix between variables is reported in Table 3. Most importantly, the
Pearson correlation coefficients between positiveness of text and magnitude of market reaction
17
are positive and statistically significant. This preliminary result attests to the fact that the manner
in which annual report narratives are written is not immaterial to stock market participants and
that it could possibly convey valuable information. Secondly, correlations between explanatory
variables are relatively low, indicating that multicollinearity is not likely to be a problem in the
empirical models that follow. In cases where association between the regressors is strong,
standard errors of the regression parameter estimates are inflated. Chatterjee and Price (1991)
argue that Variance Inflation Factors (VIFs) in excess of 10 are symptomatic of estimation
problems. We find that the highest VIF in the regressions reported in this paper is 1.27,
dispelling any apprehensions about this potential issue.
6. Empirical Results
In what follows, we analyze different variations of the regression specified in equation
[4]. Table 4 reports the results where the dependent variable is defined as the cumulative
abnormal return calculated using the mean-adjusted model, while Table 5 focuses on market-
model-adjusted CARs. Each of the tables consists of two panels, as two different lengths of the
event window are examined. For each panel, three regressions are presented – one with no
control variables, one which takes into account company characteristics and one which also
incorporates financial performance measures.
[Table 4 about here]
[Table 5 about here]
The most notable finding arising from these tables is that the Positiveness measure
carries a positive coefficient and is statistically significant in all regression specifications. This
has several important ramifications. Firstly, the narrative of annual reports is to some extent
flexible and could potentially be manipulated by management. Shin (1994) considers a
18
theoretical model in which firms that operate in an informationally asymmetric environment
could manage the disclosure of facts by suppressing negative news. By the same token,
Hildebrandt and Snyder (1981), Rutherford (2005) and Henry (2008) allude to the possible
existence of the “Pollyanna effect” (positivity bias) in parts of annual reports. It is conceivable
that management will use a report as a marketing tool and suffer from overconfidence when
writing their own reviews. The unjustified overuse of optimistic language could undermine the
usefulness of information extracted from linguistic features. However, our results indicate that,
despite all these real-life complications, the tone of annual reports can still be viewed as price-
sensitive in nature.
It is helpful to consider the implications of our findings from the investors’ and market’s
perspectives. According to the Efficient Market Hypothesis proposed by Fama (1970), stock
prices already reflect all available information and change only in response to disclosure of
previously unknown facts. Consequently, if markets were efficient and the positiveness
expressed in narratives was perceived to merely capture different degrees of impression
management, rational investors would dismiss it as being uninformative. If, on the other hand,
the tone conveyed new important information, discerning market participants would revise their
assessment of the company’s fundamental value. The discrepancy between fundamental value
and market price will induce them to trade. In cases in which the positiveness level turned out to
be above expectations, the revised fundamental value would surpass the pre-disclosure market
price, leading to a simultaneous lack of supply and excess demand for the company’s stocks.
The price will need to rise immediately until demand and supply are equalized. In a scenario
where the positiveness level was below expectations, the excess of sellers relative to buyers
would cause a stock price decline. Several caveats need to be mentioned at this stage. Firstly, for
the abovementioned mechanism to work, market participants need to have a general
understanding of managerial behaviour and motives, in order to rationally formulate their
19

expectations of narrative positiveness levels. Secondly, one may argue that the reaction
observed can be attributed to noise traders who trade on irrelevant information. However, if this
was the case, one would expect smart money to swiftly correct the mispricing that arises as a
result. Since the effect of positiveness is not eliminated in our longer event windows, we are
inclined to conclude that it is indeed material in nature.
It should also be mentioned that our findings are of interest from the point of view of the
UK’s regulatory framework. As we have alluded to earlier, UK regulations against potentially
misleading disclosure do not appear to be adequately deterrent from the point of view of
management, partially due to issuer-only liability (Ferran, 2009). Furthermore, in the US, SEC
(1998) provides more detailed guidance on word usage and writing style. Despite this, our
finding that the tone of disclosure determines market response is mirrored by those obtained for
US earnings press releases (Henry, 2008; Demers & Vega, 2010; Davis et al., 2012). This
observation leads us to believe that reluctance to put excessive spin on facts may not be rooted
solely in regulatory boundaries, but also in fear of potentially costly reputational loss.
The coefficients on the Size variable are always negative and statistically significant for
longer event windows, which is consistent with the effect propounded by Banz (1981). There
are several reasons why investors may demand higher compensation when committing to low
capitalization stocks. Firstly, less information is available on these firms (Atiase, 1985;
Freeman, 1987) and analysts are reluctant to follow them (Arbel, Carvell, & Strebel, 1983;
Gilbert, Tourani-Rad, & Wisniewski, 2006). Secondly, size is an important determinant of the
likelihood of bankruptcy (Shumway, 2001), with large multinationals being more diversified
and less risky. Finally, small caps are associated with higher transaction costs (Lesmond, Ogden,
& Trzcinka, 1999) and are more strongly affected by the illiquidity problem (Amihud, 2002).
Book-to-market ratios, on the other hand, have almost no explanatory power in our regressions,
possibly due to the short span of our event windows.
20
Our findings for Earnings_Surprise are in line with those of Lev (1989) who argued that
the relationship between accounting earnings and stock market returns is weak and unstable over
time. Most likely, financial figures from annual reports do not engender a strong market
response because they are merely an aggregation of the interim results that firms have published
earlier. This explanation would be in line with Ball and Brown (1968), who observe that about
85 to 90 percent of the information contained in annual report income statements has been
captured by reports released beforehand.
One caveat that needs to be mentioned here is that although up to 2007 preliminary
statements of annual results announcements were mandatory, they became voluntary due to
changes in Listing Rules. We have tested whether this regulatory change had implications for
the stability of coefficients on the variables derived from financial statements data
(Earnings_Surprise, %Sales, and Leverage). Our tests [not reported] revealed that the null
hypothesis of coefficient constancy could not be rejected.5 Even though disclosure of
preliminary statements may have, at least in the latter part of our sample, an element of
voluntariness, Disclosure and Transparency Rules (DTR 4.2.2) required companies to disclose
half-yearly reports. Many issuers also published quarterly results. Consequently, annual
financial statements (unlike narratives) could be viewed as stale news, which should be
irrelevant to the price formation process in informationally efficient markets. Perhaps this is also
the reason why increases in sales and leverage are invariably statistically insignificant in our
model specifications.
The F-statistics for the regressions indicate that the factors considered are jointly
important from a statistical point of view. However, this observation must be tempered by the
fact that the R-squared coefficients are relatively low. It is a well-established empirical finding
that stock markets are excessively volatile compared to underlying fundamentals. Shiller (1981)
5 Detailed results can be obtained from the authors upon request.
21
argues that price volatility is about five to thirteen times higher than that justified by a dividend-
based valuation model. Returns are often a manifestation of the fickle sentiments of the
investing public and can be orthogonal to the economic performance of companies. As a result,
the impact of genuine fundamental drivers is intertwined with and obscured by noise, resulting
in low values of the goodness of fit measures. This problem transcends our study and is a more
general issue that has troubled financial economists since time immemorial.
7. Further Considerations
One possible extension of this study could be to investigate the market impact of words
with negative connotations. To probe this issue, we use Henry’s (2008:387) negativity thesaurus
incorporating 85 words and measure the frequency with which these words appear in the
qualitative parts of annual reports. We discover that most of our market reaction measures are
negatively correlated with this frequency; however, these correlations are statistically
insignificant. This clearly shows that positive words have greater explanatory power.
Perhaps investors do not believe that managers would voluntarily disclose bad news in
narrative text, unless forced to do so by regulators. Managers are often remunerated by share or
call option compensation schemes, which gives them incentives to suppress unfavourable
information. These motivations are likely to be weakened during option granting periods when
the desire to negotiate the lowest strike on the calls may dominate. However, it is safe to assume
that managerial compensation increases with the stock price during the majority of periods. Due
to the existence of this incentive, it is likely that the influence of bad news would be more
apparent in financial statements rather than in the narrative. Davis and Tama-Sweet (2012)
argue that managers tend to publish pessimistic narratives in outlets with the lowest impact and
it is doubtful whether an annual report is such an outlet.
22
We are also not the first to claim that positive statements in UK annual reports are more
informative compared to negative ones. Schleicher and Walker (2010), who examined the
outlook section in chairmen’s statements in conjunction with managerial incentives, found that
tone is biased primarily by manipulating the number of negative statements (p. 388). Therefore
the fact that negative words have less impact on the market attests to investors’ rationality.
There are also some parallels to the world of politics – Wisniewski and Moro (2014) find that
policy makers are unlikely to draft pessimistic communiqués related to meetings in which they
themselves have participated. As a result of these considerations, we believe that tone is more
accurately measured by different shades of optimism rather than pessimism.
On an intuitive level, some may argue that positive words may be overrated, since
managers have the proclivity to get involved in ‘sugar-coating rituals’. However, rational
investors are expected to fully anticipate such behaviour. Whenever managers fail to engage in
such rituals, it may be a very strong signal to shareholders that there may be serious problems on
the horizon. Consequently, this can give rise to a strong correlation between the degree of
positiveness and market reaction.
Notwithstanding some of the aforementioned problems, we proceeded to construct an
index which aggregates the frequencies of both positive and negative words. The practical issue
is that the two thesauruses considered have different word counts, which unavoidably leads to
the measured positive and negative word frequencies having different sample means and
standard deviations. In order to make sure that both carry the same weight in the aggregation,
we convert these frequencies into z-scores.6 Consequently, we construct the following index:
Tonei=Positivity zi−Negativity zi
6 As a matter of convention, Diction software converts frequencies into z-scores before aggregating them.
23
Subsequently, we use the Tone variable in our market impact regressions instead of the
Positivity indicator. The results presented in Table 6 reassure us that the statistical significance
of the tone conveyed by a narrative is maintained, regardless of how this sentiment is defined.
[Table 6 about here]
Another potential problem is that our sample incorporates both a period of expansion and
a subsequent recession sparked by the banking crisis. In order to control for this fact, we have
constructed a dummy variable which takes a value of 1 if the annual report was published after
15th September 2008 (collapse of Lehman Brothers) and a value of 0 otherwise. This variable,
however, proved insignificant in our regressions and does not alter the strength of the
relationship between Positiveness and CARs. Furthermore, we note that the correlations between
different measures of market reaction and upbeat tone are always positive, irrespective of
whether we look at the boom or bust sub-sample.
8. Conclusions
Our results indicate that the positiveness inherent in qualitative parts of annual reports,
has a statistically significant association with abnormal returns around disclosure dates. More
specifically, an upbeat tone typically induces statistically significant stock price increases. These
results, that join a growing body of empirical evidence about the impact of narrative-based
elements on markets, call for further and more detailed examination of qualitative parts of
annual reports by both academics and practitioners. In particular, our findings affirm the
usefulness of text-analysis software in revealing hidden characteristics of texts and thus suggest
that such software tools may be fruitfully employed by investors and regulators alike.
Computerized computational linguistic approaches to analyzing annual report narratives can be
particularly helpful considering how voluminous these documents are. Previous studies focused
24
on shorter items, however reliable assessment of linguistic style in short documents is a rather
problematic undertaking.
There are several facts that can be gleaned from our empirical observations. Firstly,
although many claim that annual report narratives may have the tendency to suffer from
subjective optimism, investors clearly believe that they also convey material information. In
fact, they seem to rebalance their portfolios in response to the tone of the qualitative part of
annual reports, which becomes apparent when examining the distribution of returns. While
narratives may be partially used to build brands and manage impressions, they also appear to
contribute to the reduction of informational asymmetries. Secondly, our study invites a
reflection on the extent to which managers can exaggerate an optimistic message under the
principles-based system operating in the UK. Most of the research on qualitative corporate
outputs used US documents, which are produced under a rules-based regulatory framework. Our
results, which record market reactions similar to those observed in the US, point to a similar set
of general phenomena. We can therefore conclude that what restrains managers from injecting
excessive positiveness bias into narratives is not only the litigation risk, but also potential
reputational loss or other non-regulatory factors. The third lesson that can be drawn from our
findings is that a thorough perusal of the narrative should be recommended. Whilst a number of
previous studies performed content analysis of specific sections of annual reports, such as
chairmen’s statements, in our view it would be imprudent to advise investors to read parts of the
annual report narratives selectively. This is not to say that some parts cannot contain more
informational content than others, however, deliberately dismissing selected sections may be a
misguided strategy. Fourthly, it appears that resources committed to drafting these documents
are well spent. Companies typically involve many departments, accountants, lawyers, directors
and external agencies to carefully design the message they wish to convey in their annual
reports. This message is heard by market participants, who act accordingly. Lastly, we can infer
25
that the use of a semantic software package could, at least to a certain extent, be useful in
predicting market reactions to annual report disclosures.
There are many avenues that further research could explore. Our computerized approach
to text analysis is analytically elegant and convenient, however it is unable to assess the veracity
of statements made or to evaluate whether managers are playing strategic disclosure games with
investors and regulators. Further research needs to be conducted to answer these questions,
which are outside the scope of the current paper. Secondly, the algorithm to measure
positiveness employed here relies on computing frequencies from a user-specified thesaurus in
the text. As such, it does not recognize sentence structures, subjunctive clauses or the context in
which a given word occurs, even though all of these can modify or even negate the meaning of a
particular word. Future research should endeavour to address these methodological deficiencies.
Thirdly, we discover that narrative positiveness significantly correlates with announcement
cumulative abnormal returns that measure the overall market response. However, this particular
indicator is able to explain only a small proportion of the return variance. Inability to model
price increases precisely is a well-known problem in finance, after Shiller (1981) pointed out
that stock prices are substantially more volatile than underlying fundamentals. It is quite
possible that much of the return variation is driven by non-fundamental, irrational factors which
are difficult to capture in an empirical model. Our study points to only one incremental variable
that may be useful to further explicate stock price fluctuations.
26
References
Abrahamson, E., Amir, E. (1996). The information content of the president’s letter to shareholders. Journal of Business Finance & Accounting, 23(8), 1157-1182.
Ahern, K.R., Sosyura, D. (2014). Who writes the news? Corporate press releases during merger negotiations. Journal of Finance, 69(1), 241-291.
Ajzen, I., Fishbein, M. (2000). Attitudes and the attitude-behaviour relation: reasoned and automatic processes. European Review of Social Psychology, 11(1), 1-33.
Amihud, Y. (2002). Illiquidity and stock returns: cross-section and time-series effects. Journal of Financial Markets, 5(1), 31-56.
Anilowski, C., Feng, M., Skinner, D.J. (2007). Does earnings guidance affect market returns? The nature and information content of aggregate earnings guidance. Journal of Accounting and Economics, 44(1), 36-63.
Arbel, A., Carvell, S., Strebel, P. (1983). Giraffes, institutions and neglected firms. Financial Analysts Journal, 39(3), 57-63.
Atiase, R.K. (1985). Predisclosure information, firm capitalization, and security price behavior around earnings announcements. Journal of Accounting Research, 23(1), 21-36.
Baillie, W.M. (1974). Authorship attribution in Jacobean dramatic texts. In J.L. Mitchell (Ed.), Computers in the Humanities (pp. 73-81), Edinburgh: Edinburgh University Press.
Barbee, W.C., Mukherji, S. Jr., Raines, G.A. (1996). Do sales-price and debt-equity explain stock returns better than book-market and firm size? Financial Analysts Journal , 52(2), 56-60.
Ball, R., Brown, P. (1968). An empirical evaluation of accounting income numbers. Journal of Accounting Research, 6(2), 159-78.
Banz, R.W. (1981). The relationship between return and market value of common stocks. Journal of Financial Economics, 9(1), 3-18.
Bartov, E., Givoly, D., Hayn, C. (2002). The rewards to meeting or beating earnings expectations. Journal of Accounting and Economics, 33(2), 173-204.
Bhandari, L.C. (1988). Debt/equity ratio and expected common stock returns: empirical evidence. Journal of Finance, 43(2), 507-528.
Bhattacharya, U., Galpin, N., Ray, R., Yu, X. (2009). The role of the media in the internet IPO bubble. Journal of Financial and Quantitative Analysis, 44(2), 657-682.
Brennan, N.M., Guillamon-Saorin, E., Pierce, A. (2009). Methodological insights. Accounting, Auditing & Accountability Journal, 22(5), 789-832.
Brown, L.D., Caylor, M.L. (2005). A temporal analysis of quarterly earnings thresholds: propensities and valuation consequences. Accounting Review, 80(2), 423-440.
Brown, S.J., Warner, J.B. (1980). Measuring security price performance. Journal of Financial Economics, 8(3), 205-258.
Brown, S.J., Warner, J.B. (1985). Using daily stock returns: the case of event studies. Journal of Financial Economics, 14(1), 3-31.
27
Campbell, J.Y., Lo, A.W., MacKinley, A.C. (1997). The Econometrics of Financial Markets. Princeton: Princeton University Press.
Chatterjee, S., Price, B. (1991). Regression Diagnostics. New York: John Wiley.
Cho, C.H., Roertd, R.W., Patten, D.M. (2010). The language of us corporate environmental disclosure. Accounting, Organizations and Society, 35(4), 431-443.
Cicon, J., Clarke, J., Ferris, P.F., Jayaraman, N. (2014). Managerial expectations of synergy and the performance of acquiring firms: the contribution of soft data. Journal of Behavioral Finance, 15(3), 161-174.
Clatworthy, M., Jones, M.J. (2003). Financial reporting of good news and bad news: evidence from accounting narratives. Accounting and Business Research, 33(3), 171-185.
Craig, R.J., Brennan. N.M. (2012). An exploration of the relationship between language choice in CEO letters to shareholders and corporate reputation. Accounting Forum, 36(3), 166-177.
Crano, W.D., Prislin, R. (2006). Attitudes and persuasion. Annual Review of Psychology, 57, 345-374.
Davies, P. (2007). Davies review of issuer liability: liability for misstatements to the market, available on the internet at http://webarchive.nationalarchives.gov.uk/20100407010852/http:/www.hm-treasury.gov.uk/d/davies_discussionpaper_260307.pdf, Accessed 28.07.2015.
Davies, P. (2009). Liability for misstatements in the market: some reflections. Journal of Corporate Law Studies, 9(2), 295-313.
Davis, A.K., Ge, W., Matsumoto, D., Zhang, J.L. (2015). The effect of manager-specific optimism on the tone of earnings conference calls. Review of Accounting Studies, 20(2), 639-673.
Davis, A.K., Piger, J.M., Sedor, L.M. (2012). Beyond the numbers: measuring the information content of earnings press release language. Contemporary Accounting Research, 29(3), 845-868.
Davis, A.K., Tama-Sweet, I. (2012). Managers’ use of language across alternative disclosure outlets: earnings press releases versus MD&A. Contemporary Accounting Research, 29(3), 804-837.
DeFond, M.L., Park, C.W. (2001). The reversal of abnormal accruals and the market valuation of earnings surprises. Accounting Review, 76(3), 375-404.
Demers, E., Vega, C. (2010). Soft Information in Earnings Announcements: News or Noise? (INSEAD Faculty & Research Working Paper 2010/33/AC), available on the internet at http://www.insead.edu/facultyresearch/faculty/personal/edemers/documents/SoftInformationinEarningsAnnouncementsNewsorNoise-INSEADWP.pdf Accessed 08.07.15.
Doran, J.S., Peterson, D.R., Price, S.M. (2012). Earnings conference call content and stock price: the case of REITs. Journal of Real Estate Finance and Economics, 45(2), 402-434.
28
Easton, P.D., Zmijewski, M.E. (1989). Cross-sectional variation in the stock market response to accounting earnings announcements. Journal of Accounting and Economics, 11(2-3), 117-141.
Fama, E.F. (1970). Efficient capital markets: a review of theory and empirical work. Journal of Finance, 25(2), 383-417.
Fama, E.F., French, K.R. (1992). The cross-section of expected returns. Journal of Finance , 47(2), 427-465.
Fama, E.F., French, K.R. (1993). Common risk factors in the returns on stocks and bonds. Journal of Financial Economics, 33(1), 3-56.
Feldman, R., Govindaraj, S., Livnat, J., Segal, B. (2008). The Incremental Information Content of Tone Change in Management Discussion and Analysis (SSRN Working Paper), available on the internet at http://ssrn.com/abstract=1126962 Accessed 08.07.15.
Ferguson, N.J., Philip, D., Lam, H.Y.T., Guo, J.M. (2015). Media content and stock returns: the predictive power of press. Multinational Finance Journal, 19(1), 1-31.
Ferran, E. (2009). Are the US-style investor suits coming to the UK? Journal of Corporate Finance Law Studies, 9(2), 315-348.
Francis, J., Schipper, K., Vincent, L. (2002). Disclosures and the increased usefulness of earnings announcements. Accounting Review, 77(3), 515-546.
Frankel, R., Mayew, W., Sun, Y. (2010). Do pennies matter? Investor relations consequences of small negative earnings surprises. Review of Accounting Studies, 15(1), 220-242.
Frazier, K.B., Ingram, R.W., Tennyson, B.M. (1984). A methodology for the analysis of narrative accounting disclosures. Journal of Accounting Research, 22(1), 318-331.
Freeman, R.N. (1987). The association between accounting earnings and security returns for large and small firms. Journal of Accounting and Economics, 9(2), 195-228.
Frost, C.A., Pownall, G. (1994). Accounting disclosure practices in the United States and the United Kingdom. Journal of Accounting Research, 32(1), 75-102.
Gilbert, A., Tourani-Rad, A., Wisniewski, T.P. (2006). Do insiders crowd out analysts? Finance Research Letters, 3(1), 40-48.
Gordon, E.A., Henry, E., Peytcheva, M., Sun, L. (2013). Discretionary disclosure and the market reaction to restatements. Review of Quantitative Finance and Accounting, 41(1), 75-110.
Grimmer, J., Stewart, B. M. (2013). Text as data: the promise and pitfalls of automatic content analysis methods for political texts. Political Analysis, 21(3), 267-297.
Henry, E. (2006). Market reaction to verbal components of earnings press releases: event study using a predictive algorithm. Journal of Emerging Technologies in Accounting, 3, 1-19.
Henry, E. (2008). Are investors influenced by how earnings press releases are written? Journal of Business Communication, 45(4), 363-407.
29
Henry, E., Leone, A.J. (2009). Measuring Qualitative Information in Capital Markets Research (SSRN Working Paper), available on the internet at http://ssrn.com/abstract=1470807 Accessed 08.07.15.
Hildebrandt, H.W., Snyder, R.D. (1981). The Pollyanna hypothesis in business writing: initial results, suggestions for research. International Journal of Business Communication, 18(1), 5-15.
Hoskin, R., Hughes, J., Ricks, W. (1986). Evidence on the incremental information content of additional firm disclosures made concurrently with earnings. Journal of Accounting Research, 24(Supplement), 1–32.
Huang, X., Teoh, S.H., Zhang, Y. (2014). Tone management. Accounting Review, 89(3), 1083-1113.
Hughes, J.S., Ricks, W.E. (1987). Associations between forecast errors and excess returns near to earnings announcement. Accounting Review, 62(1), 158-175.
Jordan, C.E., Waldron, M.A., Clark, S.J. (2007). An analysis of the comparative predictive abilities of operating cash flows, earnings, and sales. Journal of Applied Business Research, 23(3), 53-60.
Kothari, S.P., Li, X., Short, J.E. (2009). The effect of disclosures by management, analysts, and business press on cost of capital, return volatility, and analyst forecasts: a study using content analysis. Accounting Review, 84(5), 1639-1670.
Kothari, S.P., Short, J. (2003). The Effect of Disclosures by Management, Analysts, and Financial Press on the Equity Cost of Capital, available on the internet at: http://ebusiness.mit.edu/research/papers/195__shortkothari_disclosures.pdf Accessed 15.12.2014.
Ledger, G., Merriam, T. (1994). Shakespeare, Fletcher, and the two noble kinsmen. Literary and Linguistic Computing, 9(3), 235-248.
Lesmond, D.A, Ogden, J.P., Trzcinka, C.A. (1999). A new estimate of transaction costs. Review of Financial Studies, 12(5), 1113-1141.
Lev, B. (1989). On the usefulness of earnings and earnings research: lessons and directions from two decades of empirical research. Journal of Accounting Research, 27, 153-192.
Li, F. (2010). The information content of forward-looking statements in corporate filings – a naïve machine learning approach. Journal of Accounting Research, 48(5), 1049-1102.
Loughran, T., McDonald, B. (2011). When is a liability not a liability? Textual analysis, dictionaries, and 10-Ks. Journal of Finance, 66(1), 35-65.
Malaviya, P., Meyers‐Levy, J., Sternthal, B. (1999). Ad repetition in a cluttered environment: the influence of type of processing. Psychology & Marketing, 16(2), 99-118.
McConnell, D., Haslem, J.A. & Gibson, V.R. (1986). The president’s letter to shareholders: a new look. Financial Analysts Journal, 42(5), Sep-Oct, 66-70.
Merkl-Davies, D.M., Brennan, N.M., McLeay, S.J. (2011). Impression management and retrospective sense-making in corporate narratives: a social psychology perspective. Accounting, Auditing & Accountability Journal, 24(3), 315-344.
30
Merkley, K.J. (2014). Narrative disclosure and earnings performance: evidence from R&D disclosures. Accounting Review, 89(2), 725-757.
Nelson, M.W. (2003). Behavioral evidence on the effects of principles- and rules-based standards. Accounting Horizons, 17(1), 91-104.
Parhankangas, A., Ehrlich, M. (2014). How entrepreneurs seduce business angles: an impression management approach. Journal of Business Venturing, 29(4), 543-564.
Perloff, R.M. (2010). The Dynamics of Persuasion: Communication and Attitudes in the Twenty-First Century. New York: Routledge.
Petty, R.E., Cacioppo, J.T. (1986). The elaboration likelihood model of persuasion. Advances in Experimental Social Psychology, 19, 123-205.
Petty, R.E., Cacioppo, J.T., Schumann, D. (1983). Central and peripheral routes to advertising effectiveness: the moderating role of involvement. Journal of Consumer Research, 10(2), 135-146.
Petty, R., Cacioppo, J.T. (2011). Communication and Persuasion: Central and Peripheral Routes to Attitude Change. New York: Springer-Verlag.
Price, S., Doran, J., Peterson, D., Bliss, B. (2012). Earnings conference calls and stock returns: the incremental informativeness of textual tone. Journal of Banking and Finance, 36(4), 992-1011.
Rogers, J.L., Van Buskirk, A., Zechman, S.L.C. (2011). Disclosure tone and shareholder litigation. Accounting Review, 86(6), 2155-2183.
Rosenberg, B., Reid, K., Lanstein, R. (1985). Persuasive evidence of market inefficiency. Journal of Portfolio Management, 11(3), 9-16.
Rutherford, B.A. (2005). A corpus linguistics-based approach. International Journal of Business Communication, 42(4), 349-378.
Scharnd, C.M., Walther, B.R. (2000). Strategic benchmarks in earnings announcements: the selective disclosure of prior-period earnings components. Accounting Review, 75(2), 151-177.
Schleicher, T., Walker, M. (2010). Bias in the tone of forward-looking narratives. Accounting and Business Research, 40(4), 371-390.
SEC (1998). A plain English handbook: how to create clear SEC disclosure documents, available on the internet at http://www.sec.gov/pdf/handbook.pdf. Accessed 28.07.15.
SEC (2015). Year-by-year SEC enforcement statistics. Available on the internet at https://www.sec.gov/news/newsroom/images/enfstats.pdf, Accessed 28.07.15.
Shiller, R. J. (1981). Do stock prices move too much to be justified by subsequent changes in dividends? American Economic Review, 76(3), 483–98.
Shumway, T. (2001). Forecasting bankruptcy more accurately: a simple hazard model. Journal of Business, 74(1), 101-124.
Shin, H.S. (1994). News management and the value of firms. RAND Journal of Economics, 25(1), 58-71.
31
Smith, M., Taffler, R.J. (1992). The chairman’s statement and corporate financial performance. Accounting and Finance, 32(2), 75-90.
Smith, M., Taffler, R.J. (1995). The incremental effect of narrative accounting information in corporate annual reports. Journal of Business Finance & Accounting, 22(8), 1195-1210.
Smith, M., Taffler, R.J. (2000). The chairman’s statement: a content analysis of discretionary narrative disclosures. Accounting, Auditing & Accountability Journal, 13(5), 624-646.
Sponholtz, C. (2008). The information content of earnings announcements in Denmark. International Journal of Managerial Finance, 4(1), 4-36.
Sussman, S.W., Siegal, W.S. (2003). Informational influence in organizations: an integrated approach to knowledge adoption. Information Systems Research, 14(1), 47-65.
Swales, G.S. Jr. (1988). Another look at the president’s letter to stockholders. Financial Analysts Journal, 44(2), Mar.–Apr., 71-73.
Sydserff, R., Weetman, P. (2002). Developments in content analysis: a transitivity index and scores. Accounting, Auditing & Accountability Journal, 15(4), 523-545.
Tetlock, P.C. (2007). Giving content to investor sentiment: the role of media in the stock market. Journal of Finance, 62(3), 1139-68.
Tetlock, P.C., Saar-Tsechansky, M., Macskassy, S. (2008). More than words: quantifying language to measure firms’ fundamentals. Journal of Finance, 63(3), 1437-67.
Weiss, R.F. (1969). Repetition of Persuasion. Psychological Reports, 25(2), 669-670.Wilson, W., Miller, H. (1968). Repetition, order of presentation, and timing of arguments and
measures as determinants of opinion change. Journal of Personality and Social Psychology, 9(2), 184-188.
Wisniewski, T.P. (2004). Reexamination of the link between insider trading and price efficiency. Economic Systems, 28(2), 209-228.
Wisniewski, T.P., Moro, A. (2014). When the leaders speak, the markets listen. European Accounting Review, 23(4), 519-551.
Yuthas, K., Rogers, R., Dillard, J.F. (2002). Communicative action and corporate annual reports. Journal of Business Ethics, 41(1-2), 141-157.
32
Table 1Definitions of Explanatory Variables
Panel A. Explanatory Variables Used in the ‘Empirical Results’ Section Variable DefinitionPositiveness Frequency with which the positive words listed in Henry’s
(2008) tone thesaurus appear in the narrative of the annual report. For the complete list of these words see Appendix I. The frequency is defined as the number of positive words divided by the number of total words in the document
Size Natural logarithm of company’s capitalization at the end of fiscal year to which the annual report refers
Book_to_Market Ratio of book value per share to share price at the end of fiscal year covered by the report
Earnings_Surprise Increase in earnings per share from the previous year scaled by the share price measured at the end of fiscal year
%Sales Percentage increase in sales relative to the previous yearLeverage Increase in leverage, where leverage is defined as total
liabilities over total assets Panel B. Explanatory Variable Used in the ‘Further Considerations’ SectionVariable DefinitionTone To construct this variable, we measured the frequencies with
which the positive and negative words listed in Henry’s (2008) tone thesauruses appear in the narrative of the annual reports. These frequencies have been subsequently converted into z-scores by deducting their individual sample means and dividing by standard deviation. Tone for a particular report is measured as its positive word frequency z-score minus the negative word frequency z-score
33
Table 2Summary Statistics
Variable Mean Standard Deviation 25th Percentile Median 75th PercentileCAR_MA(-1,1) 0.0671% 3.9994% -1.7751% 0.0086% 1.9135%CAR_MA(-1,5) 0.2502% 5.9793% -2.5880% -0.0988% 2.8867%CAR_MM(-1,1) 0.0207% 3.5317% -1.5615% -0.0795% 1.4735%CAR_MM(-1,5) 0.0450% 5.2468% -2.4810% -0.1416% 2.3364%Positiveness 0.4778%*** 0.4071% 0.2180% 0.3960% 0.5960%Size 14.3314*** 1.4504 13.3439 14.0619 15.0463Book_to_Market 0.5897*** 0.7472 0.2323 0.4024 0.7566Earnings_Surprise -0.0168 0.4404 -0.0115 0.0076 0.0258%Sales 8.3288%*** 26.1616% 0.3921% 7.3865% 15.6980%Leverage -0.0046* 0.0979 -0.0401 -0.0046 0.0280Note: CAR_MA denotes cumulative abnormal return from a constant-mean-adjusted model and the parameters in the parentheses denote the length of the event window. CAR_MM are cumulative returns in excess of a market model benchmark. The remaining variables are defined in Table 1. A two-tailed test for the hypothesis that the mean of a variable is equal to zero has been performed. *, **, *** reported in the ‘Mean’ column denote rejection at 90%, 95% and 99% confidence level, respectively.
34
Table 3Pearson Correlation Table
CAR_MA(-1,1)
CAR_MA(-1,5)
CAR_MM(-1,1)
CAR_MM(-1,5) Positiveness Size
Book_to_Market
EarningsSurprise %Sales Leverage
CAR_MA(-1,1) 1.0000CAR_MA(-1,5) 0.6645*** 1.0000CAR_MM(-1,1) 0.8761*** 0.5806*** 1.0000CAR_MM(-1,5) 0.5947*** 0.8744*** 0.6780*** 1.0000Positiveness 0.0547** 0.0515* 0.0647** 0.0771*** 1.0000Size -0.0467* -0.0742*** -0.0316 -0.0550** -0.0077 1.0000Book_to_Market 0.0348 0.0367 0.0089 -0.0050 -0.0120 -0.1378*** 1.0000Earnings_Surprise 0.0265 -0.0498* 0.0145 -0.0502* 0.0220 0.0824*** -0.4344*** 1.0000%Sales 0.0204 0.0143 -0.0047 -0.0257 -0.0266 0.0080 -0.0342 0.0420 1.0000Leverage 0.0149 0.0390 0.0075 0.0079 0.0237 -0.0302 0.0144 -0.1536*** -0.0497* 1.0000
Note: The first four variables in the table measure the cumulative abnormal returns computed using a constant-mean adjustment (MA) and market-model adjustment (MM). For definitions of the remaining variables please refer to Table 1. A two-tailed test for the hypothesis that the correlation coefficient is equal to zero has been performed. *, **, *** denote rejection at 90%, 95% and 99% confidence level, respectively.
35
Table 4Determinants of Constant-Mean-Adjusted Cumulative Abnormal Returns
Panel A. Regressions on CAR_MA(-1,1)(1) (2) (3)
Intercept -0.0019(0.0016)
0.0139(0.0109)
0.0134(0.0111)
Positiveness 0.5286**
(0.2614)0.5278**
(0.2619)0.5341**
(0.2660)Size -0.0012
(0.0007)-0.0012(0.0008)
Book_to_Market 0.0017(0.0014)
0.0029*
(0.0016)Earnings_Surprise 0.0050*
%Sales(0.0028)0.0035
(0.0041)Leverage 0.0089
(0.0115)R-squared 0.2895% 0.6013% 0.9046%F-stat 4.0880 2.8252 2.0966Prob (F-stat) 0.0434 0.0375 0.0509No. obs. 1410 1405 1385Panel B. Regressions on CAR_MA(-1,5)
(1) (2) (3)Intercept -0.0013
(0.0025)0.0380
(0.0163) 0.0385**
(0.0165)Positiveness 0.7865**
(0.3909) 0.7756**
(0.3907) 0.7640*
(0.3963)Size -0.0028**
(0.0011) -0.0028**
(0.0011)Book_to_Market 0.0021
(0.0022) 0.0010
(0.0024)Earnings_Surprise -0.0049
(0.0041)%Sales 0.0045
(0.0062)Leverage 0.0195
(0.0171)R-squared 0.2868% 0.8689% 1.1473%F-stat 4.0492 4.0933 2.6654Prob (F-stat) 0.0444 0.0066 0.0142No. obs. 1410 1405 1385Note: This table reports regressions where the constant-mean-adjusted cumulative returns are taken to act as a dependent variable. Panel A models the CAR measured in the (-1,1) event window, while Panel B extends the window to (-1,5). All of the explanatory variables are defined in Table 1. The table presents coefficient estimates with the corresponding standard errors in parentheses, coefficient of determination, the F-test for the null hypothesis that the regressors are jointly statistically insignificant and the number of observations. *, **, ***
denote statistical significance at 10%, 5% and 1%, respectively.
36
Table 5Determinants of Market-Model-Adjusted Cumulative Abnormal Returns
Panel A. Regressions on CAR_MM(-1,1)(1) (2) (3)
Intercept
Positiveness
-0.0024*
(0.0014)0.5456**
(0.2307)
0.0082(0.0097)0.5438**
(0.2314)
0.0080(0.0098)0.5586**
(0.2353)Size -0.0008
(0.0007) -0.0008 (0.0007)
Book_to_Market 0.0004(0.0013)
0.0007(0.0014)
Earnings_Surprise 0.0019(0.0024)
%Sales -0.0004(0.0037)
Leverage 0.0031(0.0102)
R-squared 0.3955% 0.5007% 0.5655%F-stat 5.5911 2.3501 1.3062Prob (F-stat) 0.0182 0.0708 0.2511No. obs. 1410 1405 1385Panel B. Regressions on CAR_MM(-1,5)
(1) (2) (3)Intercept
Positiveness
-0.0042*
(0.0022)0.9759***
(0.3425)
0.0249*
(0.0143)0.9613***
(0.3428)
0.0262*
(0.0145)1.0017***
(0.3477)Size -0.0020**
(0.0010)-0.0020**
(0.0010)Book_to_Market -0.0010
(0.0019)-0.0029(0.0021)
Earnings_Surprise -0.0078**
(0.0036)%Sales -0.0045
(0.0054)Leverage -0.0034
(0.0150)R-squared 0.5733% 0.8603% 1.2954%F-stat 8.1189 4.0527 3.0142Prob (F-stat) 0.0044 0.0070 0.0062No. obs. 1410 1405 1385Note: This table reports the estimates of regressions where the market-model-adjusted cumulative abnormal return is the dependent variable. The results in Panel A refer to the CAR computed in the (-1,1) window, whereas Panel B is based on the (-1,5) window. Standard errors are given in parentheses below the parameter estimates. R-square, F-statistic for the joint significance of explanatory variables and the number of observations are presented at the bottom of each panel. *, **, *** denote statistical significance at 10%, 5% and 1%, respectively.
37
Table 6Market Reaction and the Tone of Annual Report Narrative
Determinants of Constant-Mean-Adjusted Returns
Determinants of Market-Model-Adjusted Returns
(1) (2) (3) (4)Intercept 0.0007
(0.0011)0.0164
(0.0110)0.0002
(0.0009)0.0112
(0.0097)Tone 0.0013*
(0.0008)0.0015*
(0.0008)0.0015**
(0.0007)0.0016**
(0.0007)Size -0.0012
(0.0008)-0.0008(0.0007)
Book_to_Market 0.0031*
(0.0016)0.0009
(0.0014)Earnings_Surprise 0.0051*
(0.0028)0.0021
(0.0024)%Sales 0.0032
(0.0041)-0.0007(0.0037)
Leverage 0.0091(0.0115)
0.0033(0.0102)
R-squared 0.2100% 0.8624% 0.3413% 0.5364%F-stat 2.9630 1.9978 4.8213 1.2387Prob (F-stat) 0.0854 0.0630 0.0283 0.2835No. obs. 1410 1385 1410 1385
Note: This table reports the estimates of regressions where the abnormal returns in the (-1,1) event window act as the dependent variable. Standard errors are given in parentheses below the parameter estimates. R-square, F-statistic for the joint significance of explanatory variables and the number of observations are presented at the bottom of the table. *, **, *** denote statistical significance at 10%, 5% and 1%, respectively.
38
Appendix I
Thesaurus of Positive Words
positive, positives, success, successes, successful, succeed, succeeds, succeeding, succeeded, accomplish, accomplishes, accomplishing, accomplished, accomplishment, accomplishments, strong, strength, strengths, certain, certainty, definite, solid, excellent, good, leading, achieve, achieves, achieved, achieving, achievement, achievements, progress, progressing, deliver, delivers, delivered, delivering, leader, leading, pleased, reward, rewards, rewarding, rewarded, opportunity, opportunities, enjoy, enjoys, enjoying, enjoyed, encouraged, encouraging, up, increase, increases, increasing, increased, rise, rises, rising, rose, risen, improve, improves, improving, improved, improvement, improvements, strengthen, strengthens, strengthening, strengthened, stronger, strongest, better, best, more, most, above, record, high, higher, highest, greater, greatest, larger, largest, grow, grows, growing, grew, grown, growth, expand, expands, expanding, expanded, expansion, exceed, exceeds, exceeded, exceeding, beat, beats, beating
39
Appendix II
Companies and Number of Annual Reports Included in the Sample
3i Group 7 Capita 73i Infrastructure 5 Carillion 7Admiral Group 7 Carnival 7Amec 7 Carpetright 7Amlin 7 Catlin Group 7Anglo American 7 Centrica 7Antofagasta 7 Close Brothers Group 7Arm Holdings 7 Cobham 7Ashmore Group 6 Colt Group 7Ashtead Group 7 Compass Group 7Associated Brit.Foods 7 Computacenter 7Astrazeneca 7 CRH 7Aveva Group 7 Croda International 7Aviva 7 CSR 7Babcock Intl. 7 Daejan Holdings 7BAE Systems 7 Dairy Crest 7Balfour Beatty 7 De La Rue 7Barratt Developments 7 Debenhams 6BBA Aviation 7 Dechra Pharmaceuticals 7Beazley 7 Diageo 6Bellway 7 Dialight 7Berendsen 7 Diploma 6Berkeley Group Hdg.(The) 7 Dixons Retail 7BG Group 7 Domino Printing Sciences 7BHP Billiton 7 Drax Group 7Big Yellow Group 7 Dunelm Group 6Blackrock World Mng. 5 Electrocomp. 7Bodycote 7 Elementis 7Booker Group 6 Eurasian Natres.Corp. 5Bovis Homes Group 7 Experian 5BP 7 Fenner 7Brewin Dolphin 7 Ferrexpo 6British American Tobacco 7 Fidessa Group 7British Land 7 First Group 7British Sky Bcast.Group 7 Fresnillo 5Britvic 7 G4S 6BT Group 7 Galliford Try 7BTG 7 Genus 7Bunzl 7 GKN 7Burberry Group 7 Glaxosmithkline 7Bwin Party Digital Entm. 7 Glencore Xstrata 2Cable & Wireless Comms. 7 Go-Ahead Group 6
40
Companies and Number of Annual Reports Included in the Sample (Continued)
Grainger 7 Millennium & Cpth.Htls. 7Great Portland Estates 7 Mitchells & Butlers 7Greene King 7 MITIE Group 7Greggs 7 Mondi 5Halfords Group 7 National Express 7Halma 7 National Grid 7Hammerson 7 Next 7Hansteen Holdings 7 Oxford Instruments 7Hargreaves Lansdown 5 Paragon Gp.Of Cos. 7Hays 7 Paypoint 6Henderson Group 7 Pearson 7HICL Infrastructure 6 Pennon Group 7Hikma Pharmaceuticals 7 Persimmon 6Hiscox 7 Petrofac 7Hochschild Mining 6 Phoenix Group Hdg. (Lon) 3Home Retail Group 6 Polar Capital Tech.Tst. 7Homeserve 7 Premier Farnell 7Howden Joinery Gp. 7 PZ Cussons 7Hunting 7 Qinetiq Group 6ICAP 7 Randgold Resources 7Ictl.Htls.Gp. 7 Rank Group 6IG Group Holdings 7 Rathbone Brothers 7IMI 7 Reckitt Benckiser Group 7Imperial Tobacco Gp. 7 Redrow 7Inchcape 7 Reed Elsevier 7Informa 7 Regus 7Inmarsat 7 Renishaw 7Intermediate Capital Gp. 7 Rentokil Initial 7Interserve 7 Resolution 4Intertek Group 7 Restaurant Group 7Invensys 7 Rexam 7IP Group 7 Rightmove 7ITE Group 7 Rio Tinto 7ITV 6 RIT Capital Partners 7Jardine Lloyd Thompson 7 Rotork 7Kazakhmys 7 RPC Group 7Kcom Group 7 RPS Group 7Kenmare Res. (Lon) 7 Sabmiller 7Kier Group 7 Sage Group 7Kingfisher 7 Salamander Energy 6Ladbrokes 7 Savills 7Lonmin 7 Schroders 7Man Group 7 Segro 7Marks & Spencer Group 7 Senior 7Meggitt 7 Serco Group 7Menzies (John) 7 Severn Trent 7Michael Page Intl. 7 Shaftesbury 7
41
Companies and Number of Annual Reports Included in the Sample (Continued)
SIG 7 Tesco 7Smith & Nephew 7 Travis Perkins 7Smiths Group 7 Tullett Prebon 6SOCO International 7 Tullow Oil 7Spectris 7 UBM 7Spirax-Sarco 7 Ultra Electronics Hdg. 7Spirent Communications 7 Unilever (UK) 7Sports Direct Intl. 5 Vedanta Resources 7SSE 7 Victrex 7SVG Capital 7 Vodafone Group 7Synergy Health 7 Weir Group 7Tate & Lyle 5 WH Smith 7Taylor Wimpey 6 Whitbread 7Ted Baker 6 William Hill 7Telecity Group 5 WPP 7Telecom Plus 7
Note: This table presents a list of companies included in the sample and the number of annual reports used for each of the companies. The number of reports sums to 1410, which is our sample size.
42