Embed Size (px)
Citation preview

DISLAIMER
The Department for Water and its employees do not warrant or make any representation regarding the use, or results of use of the information contained herein as to its correctness, accuracy, reliability, currency or otherwise. The Department for Water and its employees expressly disclaim all liability or responsibility to any person using the information or advice
TECHNICAL REPORT LOWER SOUTH EAST WATER BALANCE PROJECT PHASE 1 – REVIEW OF THE CONCEPTUAL MODEL AND RECOMMENDATIONS FOR A MODELLING APPROACH
2011/12


REPORT LOWER SOUTH EAST WATER BALANCE PROJECT PHASE 1 – REVIEW OF THE CONCEPTUAL MODEL AND RECOMMENDATIONS FOR A MODELLING APPROACH
Nikki Harrington, Cameron Wood and Wei Yan
Science, Monitoring and Information Division Department for Water
February 2011
Technical Report DFW 2011/12

Department for Water | Technical Report DFW 2011/12 ii Lower South East Water Balance Project Phase 1 – Review of the conceptual model and recommendations for a Modelling Approach
Science, Monitoring and Information Division
Department for Water
25 Grenfell Street, Adelaide
GPO Box 2834, Adelaide SA 5001
Telephone National (08) 8463 6946
International +61 8 8463 6946
Fax National (08) 8463 6999
International +61 8 8463 6999
Website www.waterforgood.sa.gov.au
Disclaimer
The Department for Water and its employees do not warrant or make any representation regarding the use, or
results of the use, of the information contained herein as regards to its correctness, accuracy, reliability, currency
or otherwise. The Department for Water and its employees expressly disclaims all liability or responsibility to any
person using the information or advice. Information contained in this document is correct at the time of writing.
© Government of South Australia, through the Department for Water 2010
This work is Copyright. Apart from any use permitted under the Copyright Act 1968 (Cwlth), no part may be
reproduced by any process without prior written permission obtained from the Department for Water. Requests
and enquiries concerning reproduction and rights should be directed to the Chief Executive, Department for
Water, GPO Box 2834, Adelaide SA 5001.
ISBN 978-1-921923-02-9
Preferred way to cite this publication
Harrington, N, Wood, C. And Yan, W., 2011. Lower South East Water Balance Project Phase 1 – Review of the
conceptual model and recommendations for a Modelling Approach. Department for Water. DFW Technical Report
2011/12.
Download this document at: http://www.waterconnect.sa.gov.au/TechnicalPublications/Pages/default.aspx

Department for Water | Technical Report DFW 2011/12 iii Lower South East Water Balance Project Phase 1 – Review of the conceptual model and recommendations for a Modelling Approach
FOREWORD
South Australia’s Department for Water leads the management of our most valuable resource—water.
Water is fundamental to our health, our way of life and our environment. It underpins growth in
population and our economy—and these are critical to South Australia’s future prosperity.
High quality science and monitoring of our State’s natural water resources is central to the work that we
do. This will ensure we have a better understanding of our surface and groundwater resources so that
there is sustainable allocation of water between communities, industry and the environment.
Department for Water scientific and technical staff continue to expand their knowledge of our water
resources through undertaking investigations, technical reviews and resource modelling.
Scott Ashby CHIEF EXECUTIVE DEPARTMENT FOR WATER

Department for Water | Technical Report DFW 2011/12 iv Lower South East Water Balance Project Phase 1 – Review of the conceptual model and recommendations for a Modelling Approach

Department for Water | Technical Report DFW 2011/12 v Lower South East Water Balance Project Phase 1 – Review of the conceptual model and recommendations for a Modelling Approach
ACKNOWLEDGEMENTS
The authors would like to acknowledge the contributions to this study from the following:
The Technical Reference Group, whose input was instrumental in shaping the recommendations
from Phase 1 - Keith Brown (Parsons Brinckerhoff), Glenn Harrington (CSIRO), Hugh Middlemis
and Milo Simonic (Aquaterra).
Project Stakeholder and Policy Reference Group Representatives, who were invaluable in
clarifying the needs of the Water Allocation Planning Process – David Williamson and Daniela
Conesa (South East Natural Resources Management Board), Andrew Johnson, Glyn Ashman, Ann
Aldersey, Darryl Harvey, Cathy Cox (Department for Water).
Attendees of the Technical Workshop, who made the event a great success, provided valuable
feedback on the project approach and highlighted the volume of work that has been done and is
underway on water resources in the South East.

Department for Water | Technical Report DFW 2011/12 vi Lower South East Water Balance Project Phase 1 – Review of the conceptual model and recommendations for a Modelling Approach

Department for Water | Technical Report DFW 2011/12 vii Lower South East Water Balance Project Phase 1 – Review of the conceptual model and recommendations for a Modelling Approach
CONTENTS
FOREWORD ...................................................................................................................................... III
ACKNOWLEDGEMENTS ...................................................................................................................... V
SUMMARY ........................................................................................................................................ 1
BACKGROUND ..................................................................................................................................... 1
IDENTIFICATION OF SCOPE AND OBJECTIVES FOR WATER BALANCE MODELLING IN THE
LOWER SOUTH EAST .............................................................................................................. 2
PROPOSED THREE-STEP MODELLING APPROACH ............................................................................... 3
ADDRESSING SURFACE WATER – GROUNDWATER INTERACTIONS ................................................... 5
LIMITATIONS AND KNOWLEDGE GAPS IN THE CONCEPTUAL MODEL................................................ 5
RECOMMENDATIONS FROM PHASE 1 ................................................................................................ 6
1. INTRODUCTION ....................................................................................................................... 7
1.1. BACKGROUND ........................................................................................................................ 7
1.2. TERMINOLOGY ....................................................................................................................... 8
1.3. OBJECTIVES ............................................................................................................................. 9
1.4. METHODOLOGY ..................................................................................................................... 9
2. PREVIOUS REVIEWS OF THE WATER BALANCE ........................................................................ 11
2.1. SOUTH EAST WATER SCIENCE REVIEW (BROOKES (ED.), 2010) ........................................... 11
2.2. A REVIEW OF SCIENTIFIC ASSESSMENTS UNDERPINNING THE WORK-IN-PROGRESS
WATER ALLOCATION PLAN FOR THE LOWER LIMESTONE COAST PRESCRIBED WELLS
AREA (SMERDON, 2009). ...................................................................................................... 12
2.3. CURRENT UNDERSTANDING OF THE WATER CYCLE IN THE LIMESTONE COAST
REGION (PAYDAR ET AL., 2009) ............................................................................................ 12
3. OBJECTIVES FOR SHORT- AND LONG-TERM GROUNDWATER MODELLING IN THE LOWER
SOUTH EAST .......................................................................................................................... 14
3.1. CONSULTATION APPROACH ................................................................................................. 14
3.2. KEY REGIONAL ISSUES .......................................................................................................... 14
3.3. CONSIDERATIONS FOR INTERFACING THE (SHORT- AND LONG-TERM) MODEL
APPROACH WITH THE WATER ALLOCATION PLANNING PROCESS ...................................... 15
3.4. OTHER RECOMMENDATIONS FROM THE STAKEHOLDERS .................................................. 15
3.5. GUIDING FUTURE RESEARCH AND DATA COLLECTION EFFORTS ......................................... 15
4. PREVIOUS MODELLING STUDIES IN THE LLC REGION ............................................................... 17
4.1. OVERVIEW ............................................................................................................................ 17
4.2. MODEL SUMMARIES ............................................................................................................ 21
4.2.1. Compartmental Mixing Cell Model ...................................................................................... 21
4.2.2. Tertiary Confined Sand Aquifer (TCSA) Model .................................................................... 22
4.2.3. Wattle Range (Coles-Short) Model ...................................................................................... 26
4.2.4. Coonawarra (Zone 3A) Model ............................................................................................. 28
4.2.5. Zone 1A Model .................................................................................................................... 32
4.2.6. South of Mt Gambier Model ................................................................................................ 34

CONTENTS
Department for Water | Technical Report DFW 2011/12 viii Lower South East Water Balance Project Phase 1 – Review of the conceptual model and recommendations for a Modelling Approach
4.2.7. Padthaway Model (PADMOD1 and PADMOD2) .................................................................. 36
4.3. CONCLUSIONS AND RECOMMENDATIONS .......................................................................... 38
5. OUTCOMES FROM A TECHNICAL WORKSHOP REVIEWING THE STATUS OF THE
CONCEPTUAL MODEL ............................................................................................................. 39
5.1. BACKGROUND ...................................................................................................................... 39
5.2. SUMMARY ............................................................................................................................ 39
6. DETAILED REVIEW OF CONCEPTUAL MODEL AND INPUT DATA AVAILABILITY .......................... 41
6.1. PHYSICAL CHARACTERISTICS OF THE LLC REGION ............................................................... 41
6.1.1. Topography .......................................................................................................................... 41
6.1.2. Climate ................................................................................................................................. 42
6.1.3. Land Use .............................................................................................................................. 43
6.1.4. Surface water ....................................................................................................................... 45
6.2. GEOLOGY AND HYDROGEOLOGY OF THE LOWER LIMESTONE COAST ................................ 47
6.2.1. Geological Setting ................................................................................................................ 47
6.2.2. Overview and Hydrostratigraphic Model of the Lower Limestone Coast ........................... 50
6.2.3. Groundwater Flow and Aquifer Properties ......................................................................... 51
6.3. INPUTS TO THE UNCONFINED AQUIFER (TLA) ..................................................................... 57
6.3.1. Rainfall recharge .................................................................................................................. 57
6.3.2. Lateral Groundwater Inflow ................................................................................................ 61
6.3.3. Upward Leakage .................................................................................................................. 62
6.3.4. Drainage of Stormwater ...................................................................................................... 62
6.3.5. Irrigation Drainage ............................................................................................................... 62
6.3.6. Surface Water Inflow ........................................................................................................... 63
6.3.7. Rainfall on surface water bodies ......................................................................................... 63
6.4. OUTPUTS FROM THE UNCONFINED AQUIFER (TLA) ............................................................ 63
6.4.1. Groundwater Extraction ...................................................................................................... 63
6.4.2. Downward Leakage ............................................................................................................. 67
6.4.3. Evapotranspiration (ET) ....................................................................................................... 67
6.4.4. Surface water – groundwater interactions Around Wetlands ............................................ 68
6.4.5. Groundwater Discharge at the Coast .................................................................................. 70
6.4.6. Surface water outflows ........................................................................................................ 71
6.5. INPUTS TO THE CONFINED AQUIFER .................................................................................... 71
6.5.1. Recharge (Downward Leakage) ........................................................................................... 71
6.6. CONFINED AQUIFER OUTPUTS ............................................................................................. 71
6.6.1. Groundwater extraction ...................................................................................................... 71
6.6.2. Offshore discharge............................................................................................................... 71
7. STATUS OF THE CONCEPTUAL MODEL: KNOWLEDGE GAPS AND LIMITATIONS IDENTIFIED
THROUGH PHASE 1 ................................................................................................................ 72
8. PROPOSED OVERALL (LONG-TERM) MODELLING APPROACH ................................................... 80
8.1. BACKGROUND ...................................................................................................................... 80
8.2. THREE-STEP MODELLING APPROACH .................................................................................. 81
8.3. METHODOLOGY FOR ALLOWING FEEDBACK BETWEEN REGIONAL AND LOCAL SCALE
MODELS ................................................................................................................................ 82
8.4. ADDRESSING SURFACE WATER – GROUNDWATER INTERACTIONS ..................................... 83

CONTENTS
Department for Water | Technical Report DFW 2011/12 ix Lower South East Water Balance Project Phase 1 – Review of the conceptual model and recommendations for a Modelling Approach
8.5. USING NUMERICAL MODELS TO GUIDE FUTURE RESEARCH AND WORK PLANS FOR
THE LOWER SOUTH EAST ..................................................................................................... 84
9. REGIONAL WATER BALANCE MODELLING APPROACH ............................................................. 85
9.1. MODELLING CODE AND PLATFORM ..................................................................................... 85
9.2. MODEL DOMAIN, LAYERS AND GRID ................................................................................... 85
9.3. AQUIFER PROPERTIES ........................................................................................................... 86
9.4. MODEL BOUNDARIES ........................................................................................................... 86
9.5. RECHARGE ............................................................................................................................ 86
9.6. EVAPOTRANSPIRATION (NON-FORESTRY) ........................................................................... 89
9.7. GROUNDWATER EXTRACTION ............................................................................................. 90
9.8. IMPACTS OF PLANTATION FORESTRY .................................................................................. 91
9.9. GROUNDWATER-SURFACE WATER INTERACTIONS ............................................................. 93
9.9.1. Drains And Creeks ................................................................................................................ 93
9.9.2. Wetlands .............................................................................................................................. 93
9.10. MODEL CALIBRATION ........................................................................................................... 93
10. CONCLUSIONS AND RECOMMENDATIONS .............................................................................. 94
APPENDICES .................................................................................................................................... 96
A. CURRENT ADMINISTRATIVE BOUNDARIES FOR THE SOUTH EAST, INCLUDING
CONFINED AND UNCONFINED AQUIFER MANAGEMENT ZONES ........................................ 96
UNITS OF MEASUREMENT ............................................................................................................... 99
GLOSSARY ......................................................................................................................................100
REFERENCES ...................................................................................................................................103

CONTENTS
Department for Water | Technical Report DFW 2011/12 x Lower South East Water Balance Project Phase 1 – Review of the conceptual model and recommendations for a Modelling Approach
LIST OF FIGURES
Figure 1. Model domains for existing Lower South East numerical groundwater flow models (where available; after Groundwater Model Warehouse project, June 2010 Milestone Report). Cross section AA represents approximate location of cross section for Compartmental Mixing Cell Model (Harrington et al., 1999) ................................................. 21
Figure 2. Tertiary Confined Sand Aquifer model domain, showing major geological features (Brown, 2000) ......................................................................................................................... 24
Figure 3. Representative conceptual cross-section for the TCSA model (Brown, 2000) ............................ 25
Figure 4. Modelled plantation forestry groundwater uptake ..................................................................... 28
Figure 5. Geological cross-section showing the area south of Mount Gambier ......................................... 35
Figure 6. Digital elevation model for the South East................................................................................... 42
Figure 7. Long term average (1971 – 2000) annual rainfall for the South East of South Australia (taken from Fawcett et al., 2006) ........................................................................................... 43
Figure 8. Land use in the South East (based on 2008 land use mapping) ................................................... 45
Figure 9. Surface water features in the South East ..................................................................................... 47
Figure 10. Location of stratigraphic faults in the South East (note: faults have only been mapped for the Otway Basin) ............................................................................................................... 49
Figure 11. Stratigraphic model for the South East (from Lawson et al., 2009) ........................................... 51
Figure 12. Map of Otway Basin, showing unconfined aquifer potentiometric surface and location of zero-head difference (ZHD) line ......................................................................................... 53
Figure 13. Geological cross section showing significant aquifer displacement around confirmed fault locations ......................................................................................................................... 55
Figure 14. Summary of recharge investigations in the Lower Limestone Coast (excluding Brown et al. (2006)) ................................................................................................................................ 60
Figure 15. Estimates of recharge for each groundwater management area, taken from Brown et al. (2006) ...................................................................................................................................... 61
Figure 16. Groundwater use in the LLC PWA in 2008-09 ............................................................................ 64
Figure 17. Irrigation use in the Lower Limestone Coast Prescribed Wells Area (based on estimates from 2001-2007, and metered data from 2007-2009) ........................................................... 64
Figure 18. Historical estimates of groundwater use for irrigation in the Lower Limestone Coast (data not available for 2000–01) ............................................................................................ 65
Figure 19. Groundwater extraction by users other than the irrigation industry in the LLC PWA ............... 65
Figure 20. Ratio of groundwater inflow (Ig) to surface water inflow (Is) for wetlands assessed by Fass and Cook (2006). Relatively high values of Ig/Is suggest higher groundwater dependence ............................................................................................................................ 69
Figure 21. Potential groundwater dependent ecosystems in the South East ............................................. 70
Figure 22. Proposed initial recharge zones for regional scale model based on locations of SILO weather stations and recharge zones of Brown et al. (2006). Further sub-zoning may be conducted if required based on results of Wood (2010a) ................................................. 88
Figure 23. Expansion in estimated irrigation use in the LLC PWA ............................................................... 91
LIST OF TABLES
Table 1. Summary of existing numerical groundwater flow models for the Lower South East (after Groundwater Model Warehouse project, June 2010 Milestone Report). ............................. 18
Table 2. Recharge studies in the Lower Limestone Coast Prescribed Wells Area ...................................... 58
Table 3. Town water supply volumes in the Lower Limestone Coast (* indicates Confined Aquifer management area) ................................................................................................................. 66

CONTENTS
Department for Water | Technical Report DFW 2011/12 xi Lower South East Water Balance Project Phase 1 – Review of the conceptual model and recommendations for a Modelling Approach
Table 4. Prioritised list of knowledge gaps in the conceptual model of the groundwater system in the Lower South East .............................................................................................................. 73
Table 5. Proposed methodology for applying recharge to different land uses in model ........................... 89
Table 6. Groundwater extraction model for blue gum plantations in Wattle Range model (Aquaterra, 2010).................................................................................................................... 92
Table 7. Groundwater recharge model for blue gum plantations in Wattle Range model (Aquaterra, 2010).................................................................................................................... 92

Department for Water | Technical Report DFW 2011/12 1 Lower South East Water Balance Project Phase 1 – Review of the conceptual model and recommendations for a Modelling Approach
SUMMARY
BACKGROUND
Overview and Objectives The Establishing Total Water Balance for Water Planning in the (Lower) South East Project was initiated
under the New Knowledge for the Future sub-program of the Department For Water’s (DFW)
Groundwater Program. The objectives of the project are to:
provide an improved technical base, in the form of a water balance model, for water resources management in the Lower South East
provide recommendations for how the water balance modelling approach may evolve in response to new knowledge gained over the next 5-10 yrs
provide recommendations for future studies, data collection and data management to improve the conceptual model and ensure availability and quality of key data in the future
promote collaboration between organisations working on water-related projects in the Lower South East (e.g. DFW, CSIRO, SARDI, state agencies, universities, industry and private consultants).
Phase 1 of the project has involved:
consultation with key stakeholders to understand the policy issues, policy context and
framework into which the water balance model should provide input and determine the model
objectives (see Section 3 of this report)
review of available data and knowledge of the hydrologic system in the Lower South East for
input to numerical models
consultation with technical experts on a short and long-term modelling approach that addresses
the management needs of the region.
This summary provides an overview of the main outcomes from Phase 1, including objectives for future
models developed to support the development Lower Limestone Coast Water Allocation Plan (LLC
WAP), and recommendations for a long term modelling approach. The details of the conceptual model
review are included in the main body of the report but not summarised here, with the exception of the
knowledge gaps that were identified through this exercise.
Terminology This project involves the development of a range of types of models and hence the term “model’ is used
throughout this report in a few different contexts. The types of models to be discussed are:
Conceptual model – Conceptual models are simplified representations of the essential features of a
physical hydrogeological system, and its hydrological behaviour, to an adequate degree of detail
(Middlemis et al., 2000)
Numerical model –Numerical models use numerical methods within a computer program to solve a
series of equations. Numerical models use an iterative process to reach an approximate solution to the

SUMMARY
Department for Water | Technical Report DFW 2011/12 2 Lower South East Water Balance Project Phase 1 – Review of the conceptual model and recommendations for a Modelling Approach
set of equations and are powerful tools in that they can solve large numbers of equations quickly, hence
being able to represent large or complex systems. The results from numerical models are often
approximations, as opposed to analytic models, which produce exact solutions. Numerical models are
developed based on conceptual models of real systems. The numerical models referred to in this report
are predominantly three dimensional numerical groundwater flow models, unless otherwise specified,
i.e. there may also be reference to two dimensional numerical groundwater flow models or numerical
surface water flow models.
Regional scale numerical model –A numerical model developed to represent a system at a regional
scale, i.e. representing regional flow systems, regional water balances and larger scale features. The
model grid is comprised of cells with dimensions of the order of kilometres to tens of kilometres. This is
required to represent large areas, where using smaller cells would result in an excessive number of cells,
requiring prohibitively large computer run-times and memory. Regional models are also useful to
represent large scale processes where knowledge of smaller scale details and processes is sparse.
Smaller scale local processes that operate at scales of the order of hundreds of metres or less are not
well represented by these models.
Local scale numerical model - A numerical model developed to represent smaller scale local flow
systems where sufficiently detailed data and knowledge of processes is available. Local scale numerical
models are developed for areas where knowledge of local impacts of something is required and where
small scale features are expected to have an influence. For example the local impacts (within tens of
kilometres or less) on water tables and salinities of a groundwater extraction or forestry development,
and representation of small scale process such as surface water-groundwater interactions. The model
grid is comprised of cells with dimensions of the order of metres to kilometres. Regional scale processes
need to be carefully represented as boundary conditions for these models and hence processes
operating outside the boundaries of the model may not be well represented.
Numerical modelling framework – the modelling framework proposed here includes a suite of different
numerical (groundwater flow) models at both regional and local scales, as well as the conceptual model,
an agreed set of modelling objectives and a methodology for translating the conceptual model into the
numerical models.
Coupled surface water – groundwater flow model – A numerical surface water model and a numerical
groundwater model are set up in a computer model framework so that the outputs from one provides
input to the other and vice versa, hence fully representing a connected surface water and groundwater
system.
IDENTIFICATION OF SCOPE AND OBJECTIVES FOR WATER BALANCE MODELLING IN THE LOWER SOUTH EAST
Based on the Phase 1 consultation and review process, the following general issues / needs for a future
modelling strategy for the Lower South East have been highlighted.
Three-dimensional numerical groundwater flow models are essential to underpin the
management of groundwater resources in the Lower South East through testing of our
understanding of the resource and simulation of outcomes of proposed management scenarios.
Previous approaches to groundwater modelling have focused on specific issues and have not
been coordinated in any way. As a result, a number of models exist in various stages of
development, with varied objectives and hence varied input data and conceptual models. The
outputs of such models are not necessarily comparable or relevant for addressing the
management questions that have been identified through this project.

SUMMARY
Department for Water | Technical Report DFW 2011/12 3 Lower South East Water Balance Project Phase 1 – Review of the conceptual model and recommendations for a Modelling Approach
A suite of numerical models is required, with consistent conceptual models and input data,
designed to address at both regional and local scales specific management questions / issues
important to the WAP process. Such a product should be able to identify emerging and likely
risks through simulation of specific climate and management scenarios.
There is a preference amongst a number of stakeholders to move towards a fully-coupled
surface water – groundwater modelling approach. However, the specific objectives of such an
exercise, the data / knowledge requirements and hence feasibility (cost/benefit) of such an
exercise have not been explored.
There is an urgent need for a tool to assist with identifying and prioritising the research / data
needs that are critical to water resources management in the (Lower) South East and to provide
a link between current and proposed management scenarios and observed / modelled
ecosystem responses.
PROPOSED THREE-STEP MODELLING APPROACH
In consultation with the Technical Reference Group, the following three-step modelling approach has
been developed to address the objectives identified through the stakeholder consultation.
1. Construct a regional three-dimensional numerical model (current project), with a domain
targeting the Lower Limestone Coast Prescribed Wells Area but otherwise governed by aquifer
extents where possible, with the following objectives:
identify and prioritise critical knowledge / data gaps at a regional scale
assess / improve our knowledge of the regional water balance, including recharge,
groundwater extraction, groundwater inflows from Victoria and outflows at the coast
quantify available water (surface water and groundwater) at a regional scale
provide first-pass assessments of current allocation approach – e.g. what are the
implications at a regional scale of allocating 90% of recharge?
provide broad-scale information on likely locations and types of surface water - groundwater
interactions and identify those groundwater-dependent ecosystems (GDEs) likely to be
impacted by up-stream activities
identify areas of interaction between the confined/unconfined aquifers or areas where this
is likely, but requires further investigation
assist stakeholders with visualising the system and provide an educational tool
provide a basis / boundary conditions for more detailed localised models and
recommendations for a consistent modelling approach for these models (i.e.
recommendations for step 2).

SUMMARY
Department for Water | Technical Report DFW 2011/12 4 Lower South East Water Balance Project Phase 1 – Review of the conceptual model and recommendations for a Modelling Approach
The broad details of the proposed regional water balance model, based on the detailed review
of the conceptual model and the outcomes of consultation with the Technical Reference Group,
have been provided in Section 8 of this report.
2. Develop a consistent framework for numerical groundwater flow modelling in the (Lower) South
East, including:
the regional numerical model to provide boundary conditions and regional conceptual
framework for smaller scale models (step 1)
documentation of the possible approaches for translating the conceptual model into
numerical models, i.e. approaches for representing key processes, e.g. historical recharge,
groundwater extraction, evapotranspiration (ET), forestry impacts, surface water –
groundwater interactions, etc, including their benefits and limitations to different modelling
applications
a clear set of objectives for a suite of local-scale “hotspot” numerical models to be
developed specifically to support the WAP. It is important to consider here (and to
emphasise to stakeholders) that one size does not necessarily fit all in modelling, and that
not all potential objectives may be able to be addressed by one model (see below)
a consistent methodology for constructing local-scale numerical models to meet the above
objectives
a mechanism for reviewing the framework and the numerical models to incorporate new
knowledge.
3. Develop a suite of local-scale “hotspot” numerical models to address known and emerging risks
that should be considered in any WAP review, using the framework proposed in step 2. Possible
objectives of these models include:
identify and prioritise critical knowledge / data gaps at local scales
assess validity of current resource condition triggers
quantify water balances of individual management areas (current and proposed)
provide a better understanding of localised processes, e.g. confined-unconfined aquifer
interactions, surface water-groundwater interactions (including GDEs) and the role of
preferential recharge
detailed (quantitative) assessment of impacts of potential future climate scenarios and
proposed management scenarios or developments (e.g. irrigation, forestry and industry)
contaminant transport modelling or investigation of groundwater salinity issues.
The different methodologies for allowing feedback to occur between the regional numerical model
developed during the current project (Step 1) and the smaller scale models developed during Step 3
have been investigated.

SUMMARY
Department for Water | Technical Report DFW 2011/12 5 Lower South East Water Balance Project Phase 1 – Review of the conceptual model and recommendations for a Modelling Approach
Numerical models are emerging as critical tools in water resources management and hence the quality
of the conceptual models upon which these are based should be considered of high importance to
water resource managers. It is usually the numerical models themselves that provide the best
indication of the areas of the conceptual model that require improvement. Therefore, modelling is an
iterative process and requires a long-term commitment if the best outcomes are to be achieved.
ADDRESSING SURFACE WATER – GROUNDWATER INTERACTIONS
The following issues regarding a “fully-coupled” surface water – groundwater model for the (Lower)
South East have been identified in consultation with the Technical Reference Group.
The objectives of such a modelling exercise must be clearly identified in order to determine
whether a fully coupled model is likely to or necessary to address these objectives.
MODFLOW (the proposed groundwater modelling platform for this project) incorporates surface
water interactions through the drain, river and stream-routing packages in a way that is
probably adequate for most needs based on likely objectives and available data.
In order to provide more accuracy than the above approach, a fully coupled model would
require much more detailed data than is currently available.
For these reasons, a “fully-coupled” surface water – groundwater model has not been proposed for the
long-term modelling approach. However, if the desire for such a model remains amongst the
stakeholders, it is recommended that a cost-benefit and feasibility analysis be carried out as soon as the
groundwater flow modelling has clarified what the key knowledge and data gaps are.
LIMITATIONS AND KNOWLEDGE GAPS IN THE CONCEPTUAL MODEL
A number of gaps in knowledge of the water balance of the Lower South East have been identified
through the Technical Workshop (Section 5) and the detailed review of the conceptual model (Section
6). These are presented in Table 4 of Section 9 and prioritised as areas of future work based on (a) the
current level of understanding and (b) the likely impacts of the knowledge gap on regional and local
scale groundwater models for the region. Based on this method of prioritisation, the following areas
were identified as priority areas for improvement of the conceptual model:
groundwater flow around numerous faults in the region (i.e. impacts of faults on aquifer geometry, properties and preferential vertical flow)
occurrence and magnitude of vertical leakage between unconfined and confined aquifers
spatial and temporal variability of SW-GW interactions around drains
evapotranspiration from shallow water tables
spatial and temporal variability in recharge interception and direct extraction of groundwater by
forest plantations
coastal and offshore groundwater discharge (includes understanding of seawater intrusion).

SUMMARY
Department for Water | Technical Report DFW 2011/12 6 Lower South East Water Balance Project Phase 1 – Review of the conceptual model and recommendations for a Modelling Approach
This list will be revised based on outcomes of the regional water balance model (Phase 2 of this
project) and it is also anticipated that Phase 2 will allow us to be more specific about the work
required in these general areas.
RECOMMENDATIONS FROM PHASE 1
The recommendations from Phase 1 of the Lower South East Water Balance Modelling Project can
be summarised as follows:
to address the needs of the Water Allocation Process, identified through consultation with
stakeholders, and through consultation with the Technical Reference Group, a three-stage
process should be carried out, involving:
o development of a regional scale numerical groundwater flow model to address
regional scale objectives (Phase 2 of this project)
o development of a numerical modelling framework, which would include the
regional numerical model itself, guidelines for the development of consistent and
relevant local scale models, a methodology for allowing feedback between the two
scales of model and a mechanism for reviewing the framework and the numerical
models to incorporate new knowledge
o development of the local scale models described above to address local scale
objectives
a groundwater flow model is the appropriate platform for the numerical modelling, given
that the system is groundwater dominated and that groundwater models have facilities for
including surface water-groundwater interactions at the level that is required and justified
by the data available
feasibility of fully coupled surface water – groundwater modelling should be investigated as
soon as possible if this is still considered to be a desirable option
outcomes from the regional numerical model should be used to guide future research and
work plans for the Lower South East.

Department for Water | Technical Report DFW 2011/12 7 Lower South East Water Balance Project Phase 1 – Review of the conceptual model and recommendations for a Modelling Approach
1. INTRODUCTION
1.1. BACKGROUND
The South East of South Australia, particularly the region south of Naracoorte (the Lower South East),
has been identified as a priority region for improvement of the technical base for groundwater
management because:
the conceptual model for the water balance of the aquifer system is complex and unresolved.
However, there have been a large number of technical investigations and groundwater
modelling projects carried out across the region over the past 30 years, many of which had
independent objectives and scopes, and whose outcomes could be incorporated into a regional
conceptual model or used to refine management policies and identify critical gaps.
the recent National Water Commission (NWC) funded projects on hydrogeology and inter-
aquifer leakage in the Lower South East, for example, are expected to dramatically improve the
understanding of the groundwater system in the region and then to be incorporated into a
regional conceptual model
the region is an important economic zone that is highly dependent on groundwater as its water
resource and, in some areas, groundwater levels are declining and salinities are increasing
beyond what could be expected from climatic influences alone
there are growing demands for development of the water resource in the South East due to
many factors, including its perceived robustness
in some areas, groundwater is currently allocated based on a percentage of total available
recharge. The understanding of rainfall recharge is fairly good for the Lower South East and has
been improved by the results of the South East National Water Initiative (NWI) project.
However, further refinement of this major component of the water balance is still required,
particularly how it may vary in response to climate.
there is a growing demand for a whole water balance approach to managing groundwater in the
Lower South East. The application of this approach has partly been investigated by the South
East Water Science Review (see Section 2.1). However, the current project recognises that it is
not just knowledge of the global water balance that can provide a sound basis for effective
groundwater management but how the different components of the water budget interact with
each other and respond to external stresses at a range of scales. An example is the
establishment of a new forest plantation, which would have an impact on the regional balance
through evapotranspiration and groundwater extraction (interception of throughflow).
However, the significance of this impact may not be as great as the local impacts on water
tables and throughflow to local groundwater dependent assets, the magnitude of which could
be governed by local scale variations in topography and aquifer geometry / properties. Taking a
whole water balance approach alone could underestimate such risks.
Although the South East (and particularly the Lower South East) is a region for which there is a great
deal of data and technical knowledge relating to water resources, the current situation is that:
this information is not integrated into a whole system water balance model, and

INTRODUCTION
Department for Water | Technical Report DFW 2011/12 8 Lower South East Water Balance Project Phase 1 – Review of the conceptual model and recommendations for a Modelling Approach
there has been a lack of co-ordination of projects across disciplines, regions and between
scientific organisations.
As a result of this lack of integration and co-ordination, the outcomes of individual projects are not
optimised and the water allocation planning process is not able to take full advantage of the extensive
work that has been carried out.
Appendix A shows the current administrative boundaries for the South East, including confined and
unconfined aquifer management zones.
1.2. TERMINOLOGY
This project involves the development of a range of types of models and hence the term “model’ is used
throughout this report in a few different contexts. The types of models to be discussed are:
Conceptual model – Conceptual models are simplified representations of the essential features of a
physical hydrogeological system, and its hydrological behaviour, to an adequate degree of detail
(Middlemis et al., 2000)
Numerical model –Numerical models use numerical methods within a computer program to solve a
series of equations. Numerical models use an iterative process to reach an approximate solution to the
set of equations and are powerful tools in that they can solve large numbers of equations quickly, hence
being able to represent large or complex systems. The results from numerical models are often
approximations, as opposed to analytic models, which produce exact solutions. Numerical models are
developed based on conceptual models of real systems. The numerical models referred to in this report
are predominantly three dimensional numerical groundwater flow models, unless otherwise specified,
i.e. there may also be reference to two dimensional numerical groundwater flow models or numerical
surface water flow models.
Regional scale numerical model –A numerical model developed to represent a system at a regional
scale, i.e. representing regional flow systems, regional water balances and larger scale features. The
model grid is comprised of cells with dimensions of the order of kilometres to tens of kilometres. This is
required to represent large areas, where using smaller cells would result in an excessive number of cells,
requiring prohibitively large computer run-times and memory. Regional models are also useful to
represent large scale processes where knowledge of smaller scale details and processes is sparse.
Smaller scale local processes that operate at scales of the order of hundreds of metres or less are not
well represented by these models.
Local scale numerical model - A numerical model developed to represent smaller scale local flow
systems where sufficiently detailed data and knowledge of processes is available. Local scale numerical
models are developed for areas where knowledge of local impacts of something is required and where
small scale features are expected to have an influence. E.g. the local impacts (within tens of kilometres
or less) on water tables and salinities of a groundwater extraction or forestry development, and
representation of small scale processes such as surface water-groundwater interactions. The model grid
is comprised of cells with dimensions of the order of metres to kilometres. Regional scale processes
need to be carefully represented as boundary conditions for these models and hence processes
operating outside the boundaries of the model may not be well represented.

INTRODUCTION
Department for Water | Technical Report DFW 2011/12 9 Lower South East Water Balance Project Phase 1 – Review of the conceptual model and recommendations for a Modelling Approach
Numerical modelling framework – the modelling framework proposed here includes a suite of different
numerical (groundwater flow) models at both regional and local scales, as well as the conceptual model,
an agreed set of modelling objectives and a methodology for translating the conceptual model into the
numerical models.
Coupled surface water – groundwater flow model – A numerical surface water model and a numerical
groundwater model are set up in a computer model framework so that the outputs from one provides
input to the other and vice versa, hence fully representing a connected surface water and groundwater
system.
1.3. OBJECTIVES
The Establishing Total Water Balance for Water Planning in the (Lower) South East project was
developed with the following objectives:
provide an improved technical base, in the form of a water balance model, for water resources
management in the Lower South East
provide recommendations for how the water balance modelling approach may evolve in
response to new knowledge gained over the next 5-10 yrs
provide recommendations for future studies, data collection and data management to improve
the conceptual model and ensure availability and quality of key data in the future
promote collaboration between organisations working on water-related projects in the Lower
South East (e.g. DFW, CSIRO, SARDI, universities and private consultants).
1.4. METHODOLOGY
The project is being carried out in two phases:
Phase 1: Review and consultation (i.e. assessment of capability vs need), followed by
development of scope and approach for Phase 2.
Phase 2: A proposed modelling phase.
Phase 1 has been carried out in the following stages:
review all existing numerical groundwater models for the Lower South East
organise and hold a technical workshop to review projects and data related to the water balance
in the Lower South East and facilitate collaboration between projects within the region
review the availability and quality of water balance data (both measured and modelled /
calculated) for use in a numerical model
organise and hold a workshop with key stakeholders to identify and prioritize objectives for any
future numerical models in the Lower South East region
In consultation with the Project Reference Group, (i) develop the modelling approach for Phase 2
of the project and (ii) make recommendations for work over the next 5-10 yrs to achieve the
wider objectives of the stakeholders.
It is proposed that Phase 2 will be carried out in the following four broad stages:
development of a detailed conceptual model

INTRODUCTION
Department for Water | Technical Report DFW 2011/12 10 Lower South East Water Balance Project Phase 1 – Review of the conceptual model and recommendations for a Modelling Approach
development of the groundwater flow model
calibration and assessment of the groundwater flow model
Reporting.
This report provides details of the outcomes of Phase 1.

Department for Water | Technical Report DFW 2011/12 11 Lower South East Water Balance Project Phase 1 – Review of the conceptual model and recommendations for a Modelling Approach
2. PREVIOUS REVIEWS OF THE WATER BALANCE
2.1. SOUTH EAST WATER SCIENCE REVIEW (BROOKES (ED.), 2010)
The South East Water Science Review (Brookes (ed.), 2010) was commissioned by the Lower Limestone
Coast Taskforce to examine the science behind the Water Allocation Planning process in the South East
region of South Australia (South East). The Review was conducted by the Environment Institute at
Adelaide University, and focused on the hydrological science, hydrogeological science, ecological
science, and aspects of the geographic information systems behind decision-making in the South East. It
also commissioned hydrogeological and economic modelling, and conducted a land capability
assessment and a review of water availability in the drainage system.
The objectives of the Review were to:
develop a global water budget for the region
assess the assumptions in current science and policy pertaining to forestry water use
predict future water availability
determine the implications of falling groundwater levels on groundwater-dependent
ecosystems.
The review revealed several areas of limited understanding, including:
The water balance in the South East and the water balance hundred by hundred
The relationship between groundwater and surface water
Determination of losses in the stream and drain system so that sub-catchment flows can be
properly accounted for
The impacts of irrigation and forestry development in Victoria on groundwater flows in South
Australia
Lack of a method for allocation that considers ecological requirements
How landholders value their water allocations
How the identified high value wetlands can be maintained if groundwater quality and quantity
decline. This includes a more detailed understanding of how priority wetlands will respond to
changes to groundwater depth, and a systematic approach to the protection of adequately
connected remnant habitat.
Appropriate approaches to modelling the South East short of a full 3-D groundwater and surface
water model.
The most appropriate governance, public participation and trust-building, knowledge sharing
and capacity-building, and social and economic impact assessment of water management
processes.

PREVIOUS REVIEWS OF THE WATER BALANCE
Department for Water | Technical Report DFW 2011/12 12 Lower South East Water Balance Project Phase 1 – Review of the conceptual model and recommendations for a Modelling Approach
The current project builds on the outcomes of the Science Review by focusing on the need for an
appropriate approach to modelling in the Lower South East. Here, we review the conceptual model for
the water balance of the Lower South East and identify the knowledge gaps that are relevant to such a
modelling exercise.
2.2. A REVIEW OF SCIENTIFIC ASSESSMENTS UNDERPINNING THE WORK-IN-PROGRESS WATER ALLOCATION PLAN FOR THE LOWER LIMESTONE COAST PRESCRIBED WELLS AREA (SMERDON, 2009).
Smerdon (2009) carried out a review of (i) the methods used to quantify fundamental hydrogeological
processes underpinning the WAP, i.e. the water balance components and associated data, (ii) the
potential impacts of climate change, (iii) evidence of stress to groundwater resources caused by use,
climate variability and long-term climate change. The review led to the following recommendations:
Take a precautionary approach to water allocation due to the lack of knowledge of
environmental water requirements and individual components of the water budget.
Determine environmental water requirements.
Re-assessment and estimation of recharge values in the context of the most recent decade of
climate data. If the water-table fluctuation method continues to be applicable for the majority
of the region, acquisition of actual specific yield values was recommended.
Field assessment of groundwater discharge. Using recently installed instrumentation at case
study GDE sites, develop complete wetland water budgets and gain a better understanding of
groundwater discharge processes.
Develop a three-dimensional regional-scale groundwater model to (i) represent whole-of-system
groundwater flow, (ii) determine realistic water budget components at management area
scales, (iii) understand the connection between potential causes of resource decline and impact
to water dependent assets and (iv) assist in determining environmental water requirements.
The recommendation was for a transient three-dimensional flow model, similar to the Coles-
Short model (WR2010) but with the extent of the Tertiary Confined Sands Aquifer model
2.3. CURRENT UNDERSTANDING OF THE WATER CYCLE IN THE LIMESTONE COAST REGION (PAYDAR ET AL., 2009)
This study was conducted under the CRC for Irrigation Futures System Harmonisation program, which
aims to provide a framework to improve regional production and environmental outcomes through
improved understanding and management of a region’s water resources. The study presented a
literature review, a simple conceptual model and water balance calculations for the Limestone Coast
region. Recommendations that arose from the study were:

PREVIOUS REVIEWS OF THE WATER BALANCE
Department for Water | Technical Report DFW 2011/12 13 Lower South East Water Balance Project Phase 1 – Review of the conceptual model and recommendations for a Modelling Approach
Future hydrological studies should consider spatial variability in the water balance and water
quality issues as these affect the placement of agricultural development.
More accurate estimates of regional evapotranspiration. Remote sensing was suggested for
capturing spatial variability in ET.
A fully dynamic model of the surface and groundwater system in the Limestone Coast.

Department for Water | Technical Report DFW 2011/12 14 Lower South East Water Balance Project Phase 1 – Review of the conceptual model and recommendations for a Modelling Approach
3. OBJECTIVES FOR SHORT- AND LONG-TERM GROUNDWATER MODELLING IN THE LOWER SOUTH EAST
3.1. CONSULTATION APPROACH
In order to clarify what the main objectives of numerical models in the Lower South East should be and
hence to assist with developing the modelling approach for this project, two consultation meetings were
held with the key stakeholders for the project, the Policy Division of the Department for Water and the
South East Natural Resources Management Board. Although there are many stakeholders for the
project, these two groups were considered to have the greatest understanding of the science needed to
inform policy development in the Lower South East and to have a general understanding of the positions
of other stakeholder groups. These focused meetings were considered to be the best way to develop a
series of short- and long-term objectives for numerical modelling projects in the Lower South East. The
main points from these meetings are summarised below.
3.2. KEY REGIONAL ISSUES
validation of resource condition triggers.
the risk of double accounting of surface water and groundwater and unconfined and confined
groundwater
accurately accounting for forestry impacts
quantifying available water and identifying location of available water
quantifying groundwater inflows from Victoria and outflows at the coast
water balances for current individual management areas and also for possible hydrogeology-
based management areas
appropriateness of management area boundaries with respect to hydrogeological boundaries
and how future unconfined, confined and surface water management area boundaries could
line up
areas of high recharge / interaction between the confined/unconfined possibly to assist with
revising management area boundaries.
validating estimates of recharge under different land uses and different soil types and methods
used to scale up these estimates.
having a regional tool that can be used to assess issues in non-hotspot areas in the future.

OBJECTIVES FOR SHORT- AND LONG-TERM GROUNDWATER MODELLING IN THE LOWER SOUTH EAST
Department for Water | Technical Report DFW 2011/12 15 Lower South East Water Balance Project Phase 1 – Review of the conceptual model and recommendations for a Modelling Approach
future management of sub-units of the confined and unconfined aquifers.
3.3. CONSIDERATIONS FOR INTERFACING THE (SHORT- AND LONG-TERM) MODEL APPROACH WITH THE WATER ALLOCATION PLANNING PROCESS
The following considerations for interfacing the short- and long-term model approach with the Water
Allocation Planning process were highlighted by the South East Natural Resources Management Board:
The timing of this project will not allow it to influence the development of the current WAP (to
be finalised July 2011) with the exception that some of the outputs from the Conceptual
Modelling (pictures / diagrams, etc) may be useful as educational tools.
The lifetime of the WAP is five years, with provisions for revisions to management settings to be
made after three years or more frequently if the science supports it.
3.4. OTHER RECOMMENDATIONS FROM THE STAKEHOLDERS
Other recommendations from the stakeholders were:
Ensure that people have realistic expectations about what the current (and future) modelling is
expected to achieve (i.e. understand its limitations).
That this model be set in a consistent framework so that it becomes a tool for the whole
Department and results are consistent with other models and other products (e.g. water
accounting, BoM).
A highly desirable outcome from this project would not just be a model, but a modelling
infrastructure for the region that guides how future models are set up – i.e. what input data is
used, how the data is quality controlled, and how it is manipulated for use as input parameters
in models.
An example of this is: How do we obtain /estimate historical recharge data for use in
groundwater models? This would probably involve deciding on accepted average recharge
estimates for different regions and manipulating these using a combination of land-use and
rainfall data to obtain a spatial and temporal (historical) dataset. There should be a standard
methodology for this so that results from different models can be assessed equally.
A regional model can also be a part of this outcome, providing boundary inputs for smaller scale
models.
3.5. GUIDING FUTURE RESEARCH AND DATA COLLECTION EFFORTS
A common theme throughout the consultation process for this project, as well as a number of separate
meetings and workshops attended by the project team, was an urgent need for a tool to help identify

OBJECTIVES FOR SHORT- AND LONG-TERM GROUNDWATER MODELLING IN THE LOWER SOUTH EAST
Department for Water | Technical Report DFW 2011/12 16 Lower South East Water Balance Project Phase 1 – Review of the conceptual model and recommendations for a Modelling Approach
and prioritise future knowledge and data collection projects. The list of proposed research projects is
long and, despite a great deal of consultation, how these projects should be prioritised is still unclear.

Department for Water | Technical Report DFW 2011/12 17 Lower South East Water Balance Project Phase 1 – Review of the conceptual model and recommendations for a Modelling Approach
4. PREVIOUS MODELLING STUDIES IN THE LLC REGION
4.1. OVERVIEW
Several numerical groundwater flow models already exist for various regions of the Lower South East.
These are summarised in Table 1 below, along with some of the major features of their input datasets,
and their model domains are shown in Figure 1. All numerical groundwater models for South Australia
are being archived and catalogued as part of the Groundwater Model Warehouse Project, another sub-
project of the Groundwater Program. Some of the following general descriptions are based on
information presented in the June 2010 Milestone Report for that project.

PREVIOUS MODELLING STUDIES IN THE LLC REGION
Department for Water | Technical Report DFW 2011/12 18 Lower South East Water Balance Project Phase 1 – Review of the conceptual model and recommendations for a Modelling Approach
Table 1. Summary of existing numerical groundwater flow models for the Lower South East (after Groundwater Model Warehouse project, June 2010 Milestone
Report).
Model Name
Sub-zones/ Project
area
Package and
Version
Model Status
Purpose Reports Model
Availability GIS
Domain
Gambier Basin Compartmental
Mixing Cell Model
East-West
transect
through
Gambier
Basin
MODFLOW
(flow
model),
Analytical
CMC Model
(solute
transport)
Completed Estimate leakage
between confined
/ unconfined
aquifers.
Investigate
advantages of
using integrated
MODFLOW and
CMC approach to
improve model
calibration and
confidence in
estimates of
aquifer
parameters.
Harrington,
G.A., Walker,
G.R., Love, A.J
and Narayan,
K.A., 1999, A
compartmental
Mixing-cell
approach for
the
quantitative
assessment of
groundwater
dynamics in
the Otway
Basin, South
Australia., J.
Hydrol., 214:
49-63.
No No

PREVIOUS MODELLING STUDIES IN THE LLC REGION
Department for Water | Technical Report DFW 2011/12 19 Lower South East Water Balance Project Phase 1 – Review of the conceptual model and recommendations for a Modelling Approach
Model Name
Sub-zones/ Project
area
Package and
Version
Model Status
Purpose Reports Model
Availability GIS
Domain
Tertiary
Confined Sand Aquifer Model
South East
of South
Australia
Visual
MODFLOW
(Flow
Model)
Completed in
2000
Impact assessment
and to assist with
Water Allocation
Planning
PIRSA Report
Book 2000/16 No
Yes (to be
updated)
Wattle Range (Coles - Short)
GW Vistas
(Flow
Model)
Completed in
2010
Forestry impact
assessment/policy
and potentially for
assisting Water
Allocation
Planning
Final Report
(Aquaterra,
2010)
Yes Yes
Coonawarra
Zone 3A
and 3B of
Border
Designated
Area, parts
of Zones
2A, 2B, 4A,
4B.
Visual
MODFLOW
(Flow
Model)
Preliminary
model.
Calibration
questionable.
May be
updated in
the future
1. Proposed to
assist with Water
Allocation
Planning (WAP).
2. Constructed to
model nitrate (etc)
pathways for
Diffuse Impacts
Project.
Calibration not
good enough.
Conceptual
model report
(REM, 2007).
Draft model
report in
progress.
Yes Yes

PREVIOUS MODELLING STUDIES IN THE LLC REGION
Department for Water | Technical Report DFW 2011/12 20 Lower South East Water Balance Project Phase 1 – Review of the conceptual model and recommendations for a Modelling Approach
Model Name
Sub-zones/ Project
area
Package and
Version
Model Status
Purpose Reports Model
Availability GIS
Domain
Zone 1A
Zone 1A of
the Border
Designated
Area.
Includes
Mount
Gambier
and
surrounds,
south to
the coast.
Visual
MODFLOW
(Flow
Model)
Preliminary
model
May be
updated in
the future
Constructed to
model nitrate (etc)
pathways for
Diffuse Impacts
Project.
Conceptual
model report
(DWLBC
Report
2008/12)
Draft model
report in
progress
Yes Yes
South of Mount
Gambier
South of
Mount
Gambier.
Visual
MODFLOW
(Flow
Model)
Model
completed in
2000
Impact assessment
and to assist with
Water Allocation
Planning
DWR
Report
2000/40
Yes Yes
Border Zone Inter-aquifer
leakage model(s)
Border
Zone
Proposed
(not included
in summary
below)
Model inter-
aquifer leakage in
the Border Zone NA NA NA

Department for Water | Technical Report DFW 2011/12 21 Lower South East Water Balance Project Phase 1 – Review of the conceptual model and recommendations for a Modelling Approach
Figure 1. Model domains for existing Lower South East numerical groundwater flow models (where available;
after Groundwater Model Warehouse project, June 2010 Milestone Report). Cross section AA
represents approximate location of cross section for Compartmental Mixing Cell Model
(Harrington et al., 1999)
4.2. MODEL SUMMARIES
4.2.1. COMPARTMENTAL MIXING CELL MODEL
4.2.1.1. Purpose
The objective of the Compartmental Mixing Cell study was to investigate the advantages and
disadvantages of using an integrated transient groundwater flow and solute transport modelling
approach to improve confidence in estimating aquifer parameters.
4.2.1.2. Background
A number of regional hydrogeological investigations had recently been carried out in the Gambier Basin,
including the use of environmental isotopes and hydrochemical techniques to determine recharge and
groundwater flow patterns within the aquifers (Love, 1991; Love et al., 1993), the palaeohydrology of
A
A

PREVIOUS MODELLING STUDIES IN THE LLC REGION
Department for Water | Technical Report DFW 2011/12 22 Lower South East Water Balance Project Phase 1 – Review of the conceptual model and recommendations for a Modelling Approach
the basin (Love et al., 1994) and to investigate diffuse leakage between the unconfined and confined
aquifers (Love et al., 1996). The latter study concluded that diffuse leakage between the aquifers was
minimal throughout the basin and hence that water and solutes must be transported between the
aquifers via preferential pathways. The process of inter-aquifer leakage to the Dilwyn Confined aquifer
was still yet to be quantified.
The compartmental mixing cell (CMC) approach is a modelling methodology that has been used
extensively over the past 25 yrs to interpret environmental tracer data inversely through estimating
hydraulic fluxes. An iterative procedure between obtaining a calibrated MODFLOW model and using this
as input to the CMC model to attempt to accurately simulate observed isotope distributions was carried
out.
4.2.1.3. Location
The model was set along an east-west transect in the northern portion of the Gambier Basin (transect
AA’; Figure 1). This transect was perpendicular to the potentiometric contours for both the unconfined
and confined aquifers.
4.2.1.4. Model Structure
The 2-D vertical slice model included both the confined Dilwyn and the unconfined Gambier aquifer
systems. The slice was divided into 30 columns and model simulations were carried out for the period
between 27 000 yrs before present (BP) until present. The long simulation period was required due to
the long residence times of the tracers being investigated.
4.2.1.5. Model Outcomes and Limitations
It was considered to be questionable that any model could be expected to accurately simulate a
groundwater system over such long time scales due to the unknown input functions for most tracers
and the unknown details of the groundwater flow system. However, with a good understanding of the
model limitations and assumptions, the recharge to the confined aquifer, via leakage from the
unconfined aquifer, was estimated to be 2 – 9 mm/yr with greater confidence than previous estimates.
This was considered to be a worthwhile improvement to the understanding of the aquifer system.
4.2.1.6. Report
Harrington, G.A., Walker, G.R., Love, A.J., and Narayan, K.A., 1999, A compartmental mixing-cell approach for the quantitative assessment of groundwater dynamics in the Otway Basin, South Australia., J. Hydrol., 214: 49-63.
4.2.2. TERTIARY CONFINED SAND AQUIFER (TCSA) MODEL
4.2.2.1. Purpose
To assist in the understanding of the mechanisms that control flow into, and through the TCSA, and to
assess the long term impact of various extraction scenarios. Determine appropriate Permissible Annual
Volumes (PAVs) for extraction from the TCSA.
4.2.2.2. Background
The large contrasts in groundwater use from the Tertiary Confined Sand Aquifer between the Border
Designated Area (low use) and the main artesian area, approximately 15 km east of Robe (high use),
coupled with the sensitivity of water levels in confined aquifers to groundwater extraction, meant that it
was considered important to manage the Tertiary Confined Sand Aquifer in the South East of SA as a

PREVIOUS MODELLING STUDIES IN THE LLC REGION
Department for Water | Technical Report DFW 2011/12 23 Lower South East Water Balance Project Phase 1 – Review of the conceptual model and recommendations for a Modelling Approach
whole. A groundwater flow model was constructed to be used as a predictive tool to provide both
seasonal and long-term changes in the potentiometric head of the aquifer under different extraction
scenarios and determine the appropriate volume of extraction from the Tertiary Sand Confined Aquifer
(Brown, 2000).
The objectives of the model were to:
organise and evaluate hydrogeological information in order to construct a conceptual model of
the Tertiary Confined Sand Aquifer within the study area
develop a transient, numerical three dimensional regional groundwater flow model for the
Tertiary Confined Sand Aquifer
assess the likely impacts of extracting the volumes of groundwater from the Tertiary Confined
Sand Aquifer as determined by the Department of Natural Resources and Environment in
Victoria (1998).
examine the possible impacts of the long term extraction in the main artesian area in the South
East of Australia.
4.2.2.3. Location
The location of the model domain is shown in Figures 1 and 2.
4.2.2.4. Model structure
Model domain and grid size The model domain covers an area of approximately 45,000 km2 (Figure 2). The entire groundwater flow
path was modelled. The model grid is divided into 57 rows and 49 columns. The grid has a uniform cell
size of 4,000 m × 4,000 m. The model grid is applied to three layers, resulting in 8,379 finite difference
cells.

PREVIOUS MODELLING STUDIES IN THE LLC REGION
Department for Water | Technical Report DFW 2011/12 24 Lower South East Water Balance Project Phase 1 – Review of the conceptual model and recommendations for a Modelling Approach
Figure 2. Tertiary Confined Sand Aquifer model domain, showing major geological features (Brown, 2000)
Model layers The regional aquifer system is conceptualised as three layers, including two aquifer layers and one
aquitard layer (Error! Reference source not found.3). Topography was computer generated based on
easured values at observation wells.

PREVIOUS MODELLING STUDIES IN THE LLC REGION
Department for Water | Technical Report DFW 2011/12 25 Lower South East Water Balance Project Phase 1 – Review of the conceptual model and recommendations for a Modelling Approach
Figure 3. Representative conceptual cross-section for the TCSA model (Brown, 2000)
Groundwater extraction
When the model was constructed, extraction data was only available for the 1996-97 irrigation season.
The extraction data was based on estimates of irrigated crop requirements, rather than metered
volumes. Extraction from each well in the model was applied based on the date the well was drilled (i.e.
for a well drilled in 1990, extraction from that well was implemented from 1990 onwards, and extraction
volumes based on the 1996-97 data). Extraction was also only applied from October to March in each
year, representing a summer irrigation season. The application of extraction in this way assumed there
was little change in irrigation practices over the model period, which was recognised as a model
limitation.
In addition to this, extraction for town water supply was included in the model, with extraction volumes
based on data provided by SA Water. Leakage from poorly constructed wells in areas where the
confined aquifer is artesian was also modelled, by applying a further 10% of extraction volumes in
artesian areas.
4.2.2.5. Model Outcomes and Limitations
Model calibration was achieved by matching the observed head distribution for September 1997 and
from observed long term hydrographic information for more than 30 observation wells. Despite the
simplification of the conceptual model, good matches were achieved between modelled and observed
potentiometric head contours for September 1997, as well as seasonal and long term trends in
observation well hydrographs.
There were a few areas, particularly adjacent the Tartwaup and Kanawinka Faults, where good
calibration could not be achieved due to the regional scale of the model and the coarse grid size applied.
The seasonal drawdown in the cone of depression was reasonably well simulated. The model was
considered to be reasonably well calibrated against the available hydraulic head data for the TCSA.
The major limitations of the model were:
The assumptions made in the application of groundwater extraction data.
The unconfined aquifer was not modelled accurately.
The model does not take into account structural complexities.

PREVIOUS MODELLING STUDIES IN THE LLC REGION
Department for Water | Technical Report DFW 2011/12 26 Lower South East Water Balance Project Phase 1 – Review of the conceptual model and recommendations for a Modelling Approach
The discharge process from the TCSA along the western model boundary is not well understood
The magnitude of losses from leaking wells in the main artesian irrigation area is unknown and was therefore estimated.
Results from the modelling showed a long-term decline in the potentiometric head of the TCSA of
between 2m and 6m under the scenario of the recommended PAVs. Scenario modelling also suggested
that an increase in extraction from the TCSA would result in an increase in vertical leakage to the TCSA
from the overlying unconfined aquifer.
The model was updated in 2005 to reflect current licensed allocations, provide improved treatment of
leaky wells and allow possible recalculation of PAVs (Harrington and Brown, 2007). The updated model
provided reasonable agreement between observed and modelled groundwater levels, including the
recovery of water levels around recently rehabilitated wells. Modelled drawdown was generally
underestimated in all areas of high density irrigation, possibly due to averaging of groundwater
extraction values across grid cells or using allocations rather than actual use.
4.2.2.6. Report
Brown K, 2000, A groundwater flow model of the Tertiary confined sand aquifer in south east South
Australia and south west Victoria, Report PIRSA 2000/00016, Primary Industries and Resources South
Australia, Adelaide.
Harrington, G. And Brown, K., 2007, South East Confined Aquifer Groundwater Resource Assessment: A
review of the condition of the resource and estimates of Permissible Annual Volume., DWLBC Draft
Report.
4.2.3. WATTLE RANGE (COLES-SHORT) MODEL
4.2.3.1. Purpose
The Wattle Range (WR2010) model was developed to estimate the effects of forestry plantations on the
water balance and groundwater levels of the Wattle Range region (including the groundwater
management areas of Coles, Joyce, Killanoola, Monbulla, Short and Spence) and to undertake selected
scenario modelling to inform future management of the forestry areas in the South East. It also
provided input to the South East Science Review (Brookes (ed.), 2010).
4.2.3.2. Background
The modelling work supported work by DWLBC (now DFW) to quantify the effects of existing forestry
plantations in the groundwater management areas of Coles, Joyce, Killanoola, Monbulla, Short and
Spence in the South East of South Australia. DWLBC (now DFW), in collaboration with other
organisations, had undertaken several studies and monitoring initiatives to investigate the effects of
plantations on groundwater systems (Mustafa et al., 2006). In 2006, DWLBC developed a groundwater
numerical model covering the area of interest to simulate the groundwater system responses to
hydrological processes (Osei-Bonsu, 2009). That model, referred to as the Bakers Range model, was
considered inadequate in its existing form for the objectives of the modelling study. It was upgraded,
mainly by expanding boundaries to reduce potential boundary effects, and including revised information
on groundwater abstraction, revised layer elevations and other improvements to the conceptual model
(Aquaterra, 2010).
4.2.3.3. Location
The location of the model domain is shown on Figure 1.

PREVIOUS MODELLING STUDIES IN THE LLC REGION
Department for Water | Technical Report DFW 2011/12 27 Lower South East Water Balance Project Phase 1 – Review of the conceptual model and recommendations for a Modelling Approach
4.2.3.4. Model Structure
The model was constructed as a one layer model.
Recharge
The initial model for this project used a uniform annual recharge rate of 200 mm/y, however these were
reduced and set to the rates reported in Brown et al. (2006) for individual groundwater management
areas in the model domain. For areas under plantation forestry, different annual recharge rates were
used. Areas under blue gum plantations had recharge reduced incrementally to 0 mm/y four years after
modelled planting date (representing canopy closure). Under pine plantations, recharge was reduced
incrementally to 0 mm/y seven years after plantation date (canopy closure). Areas under pine plantation
received 50% of mean annual recharge (MAR) in the eleventh year after planting to simulate crop
thinning, before recharge rates returned to 0 mm/y. Crop thinning was then modelled every five years
after the eleventh year of plantation establishment (i.e. 50% MAR under pine plantations every 5th year
after the 11th year, 0 mm/y recharge for all other years).
Groundwater Extraction
The Aquaterra model for the Wattle Range area (referred to as WR2010) is an updated version of a
model previously constructed by DWLBC (Mustafa et al, 2006). The initial model (Osei-Bonsu, 2009) was
based on information available at the time, and groundwater extraction was set at 81% of estimated
recharge. Locations of extraction were set as the centre of licensed irrigation land parcels. The model
was updated by Aquaterra in 2010. This included updating extraction well pumping rates to reflect
metered data collected in 2009. Also, the location of extraction was updated by assigning extraction
points either to the same locations as meters, or to the specific location of a known irrigation well
(where the data was available). The model domain was extended to include part of Zone 3A, however
no extraction in this area was modelled.
Impacts of Plantation Forestry
In the original model, water use by plantation forestry was set as 435 mm/y in areas where the depth to
groundwater was <6m. Groundwater use was assumed to start 3 years after plantation, and increase to
435 mm/y after five years. Use was varied seasonally, with more plantation extraction in summer
months (see Figure 4).

PREVIOUS MODELLING STUDIES IN THE LLC REGION
Department for Water | Technical Report DFW 2011/12 28 Lower South East Water Balance Project Phase 1 – Review of the conceptual model and recommendations for a Modelling Approach
Figure 4. Modelled plantation forestry groundwater uptake
In the updated version, direct extraction by plantation forestry was modelled as ‘negative recharge’, and
hence independent of depth. Extraction rates ranged from 0 ML/ha (directly after plantation) to 3.64
ML/ha (seven years after plantation) for both blue gums and pine plantations, with extraction rates
varying as a result of plantation management (coppicing and rotation) to give an annualised extraction
rate of 1.82 ML/ha/y under blue gums and 1.663 ML/ha/y under pine plantations.
4.2.3.5. Model Outcomes and Limitations
A good match between measured and modelled groundwater levels was obtained for the forestry
development period (1999-2009).
The model had a number of key findings in the areas of:
The maximum drawdown induced by the current forest plantations and the extent of this drawdown.
The relative effects of recharge interception and direct extraction by the forests.
The importance of the forestry management scenario selected.
Potential impacts of forestry on Bool Lagoon and the application of the model to determine relative impacts of different groundwater affecting practices on Bool Lagoon.
Potential impacts on other groundwater dependent ecosystems.
The main limitations of the model are:
Average annual recharge rates are applied to areas outside the forestry developments. The effects of varying recharge in these areas have not been investigated.
4.2.3.6. Report
Aquaterra, 2010, Modelling forestry effects on groundwater resources in the Southeast of SA.
Osei Bonsu, K., 2009, Bakers Range 2006 Groundwater Flow Model, DWLBC Report 2009/28 (in prep.)
4.2.4. COONAWARRA (ZONE 3A) MODEL
4.2.4.1. Purpose
The Coonawarra (Zone 3A) model was developed to:

PREVIOUS MODELLING STUDIES IN THE LLC REGION
Department for Water | Technical Report DFW 2011/12 29 Lower South East Water Balance Project Phase 1 – Review of the conceptual model and recommendations for a Modelling Approach
adequately represent groundwater flow in the unconfined aquifer in the Coonawarra (Zone 3A)
region,
be used to assess the effects on groundwater levels of activities such as plantation forestry and
groundwater abstraction for irrigation and other purposes.
assist future land-use planning and water resource management.
form a base for a salt transport model.
The model was also intended to be used as a base for modelling the movement of diffuse source
contaminants, such as nitrate, through the aquifer system as part of the Diffuse Impacts Project.
4.2.4.2. Background
Groundwater resource condition has been observed to be declining in various parts of the South East
over the past two decades, mainly due to a high incidence of below average rainfall and increased
groundwater abstraction. However, there are several areas in the region where plantation forestry is
also believed to be impacting on shallow groundwater levels. In the Zone 3A Management Area of the
Border Designated area, intensive viticultural development competes with relatively large areas of
plantation forestry for groundwater resources. To investigate the relative impacts of the two types of
development, the project titled “Estimating Regional Impacts of Plantation Forestry and Intensive
Irrigation Development on Groundwater Resources in the Lower South East” commenced in 2006. The
project was carried out in two phases, both of which were funded by the Natural Heritage Trust through
the South East Natural Resources Management Board’s Regional Investment Strategy. Phase 1 received
funding in 2006/2007 and involved the development of a conceptual model for groundwater flow and
solute transport in Zone 3A of the Border Designated Area. This was done through (i) collation of
existing data, (ii) preliminary field sampling of existing observation wells and (iii) a drilling program in
February 2007 resulting in the establishment of 10 new research sites, some of which were cored and
instrumented with piezometers. Details of the Phase 1 work and conceptual model were provided in a
separate consultants’ report (Resource and Environmental Management (REM), 2007). Phase 2 of the
project involved the construction of the numerical groundwater flow and solute transport model for the
region including and surrounding Zone 3A in the lower South East.
As well as being a valuable management tool, the numerical model was intended to be used as a
framework to model the groundwater impacts of diffuse source pollutants in the Zone 3A area through
the “Primary Production to Mitigate Water Quality Threats” project, also known as the “Diffuse Impacts
Project”. The “Primary Production to Mitigate Water Quality Threats” project was a collaborative study
between the South Australian Research and Development Institute (SARDI), the Flinders University of
South Australia (FUSA) and the Department of Water, Land and Biodiversity Conservation (DWLBC). The
specific objectives of that project were to:
Assess the risk of contamination of water resources in the South East from primary production.
Quantify the sources of diffuse pollution from primary production.
Decrease the risk of contamination of water resources from primary production within the South East.
The Zone 3A area represented one of the selected key regions to be studied intensively through the
“Primary Production to Mitigate Water Quality Threats” project. The other regions included the Zone
1A area surrounding and to the south of Mount Gambier and the Padthaway Prescribed Wells Area.
4.2.4.3. Location
The location of the model domain is shown in Figure 1.

PREVIOUS MODELLING STUDIES IN THE LLC REGION
Department for Water | Technical Report DFW 2011/12 30 Lower South East Water Balance Project Phase 1 – Review of the conceptual model and recommendations for a Modelling Approach
4.2.4.4. Model Structure
Model Domain and Grid
Due to the presence of significant plantation forestry developments upgradient (east) of Zone 3A, and
the need to minimise boundary effects on the model results in the area of interest, the model domain
was extended beyond the boundaries of Zone 3A, to include Zone 3B, parts of Zone 2A and 4A and a 10
km buffer zone to the west of the Zone 3A boundary. The model domain therefore encompassed a 50
km x 61 km area (Figure 1). The model domain was discretised using a grid with cells of dimensions 250
m x 250 m.
Model Layers
Three model layers were used to represent the following components of the unconfined aquifer:
Bridgewater Formation
Green Point Member, Units 1-5 (Gambier Limestone)
Camelback Member (Gambier Limestone)
The top of Layer 1 (ground surface) was contoured from the Digital Elevation Model (DEM) for the South
East. The bottom of Layer 3 (base of unconfined aquifer) was contoured using all available drillhole
data, including that from a recent drilling program. The base of the model, which is a no-flow boundary,
represents the top of the aquitard that separates the confined Dilwyn Sand aquifer from the overlying
unconfined Gambier Limestone. The aquitard comprises the low permeability Greenways member of
the Gambier Limestone, the Narrawaturk Clay, Mepunga Formation and Dilwyn Clay.
Three model layers were used to allow some vertical flow to be simulated within the unconfined
aquifer. Some data exists for the elevations of the boundaries between the various units of the
unconfined aquifer, including data from the recent drilling program. However, the boundaries between
the three model layers were assigned to divide the model domain into three layers of equal thickness
rather than being based on real data. The reasons for this were:
1) Despite the recent work, the relevant dataset is sparse in a geologically complicated area, where
there are sharp changes in layer elevations due to faulting and some units are missing in some
areas. Creating layers based on this is misleading in its accuracy and introduces instability and grid
complications that may be unnecessary and impossible to rectify due to a lack of data.
2) There is very little data available on the hydraulic properties of the individual units in the
unconfined aquifer, meaning that defining them accurately is meaningless to the model outcomes.
Recharge
The steady state model used recharge rates based on the recharge zones reported in Bradley et al.
(1995), with areas under pine plantation having recharge rates reduced by 83%. For the transient
numerical model, recharge rates were varied annually based on rainfall records.
The majority of recharge is considered to occur in winter, and hence the annual recharge to the aquifer
depends on winter rainfall rather than annual rainfall. Based on this, an annual correction was applied to
the average recharge rates using the following approach:
1) “Winter” rainfall was calculated for each year by summing daily rainfall between 1 May and 31
October.
2) An average winter rainfall for the time period 1889 to 2008 was calculated from this data.

PREVIOUS MODELLING STUDIES IN THE LLC REGION
Department for Water | Technical Report DFW 2011/12 31 Lower South East Water Balance Project Phase 1 – Review of the conceptual model and recommendations for a Modelling Approach
3) For each recharge zone, the difference between the average winter rainfall and the average
recharge was calculated. This was deemed to be the “wetting amount” for each recharge zone
(i.e. the amount of winter rainfall required to wet up the soil before recharge occurs):
Wx = WRainav – Ravx
Where Wx is the wetting amount for recharge zone x, WRainav is the average winter rainfall (1889-2008)
and Ravx is the average annual recharge rate for recharge zone x.
4) Annual recharge amounts for each zone were calculated according to the following formula:
Rx,i = WRaini – Wx
Where Rx,I is the recharge rate for recharge zone x in year i and WRaini is the winter rainfall in year i.”
The transient model also used a reduced recharge rate under plantation forestry areas. The influence of
the Ash Wednesday bushfires was modelled by having forestry recharge zones returning to pasture
recharge zones (i.e. zones receiving 100% winter rainfall recharge) after 1983, to simulate the
destruction of plantations and higher recharge following the change in land use. These areas were
replanted following the bushfires, and so modelled recharge was reduced again by 83% in 1993 in the
bushfire affected areas. The same method of applying temporal changes in recharge was used in a
numerical model of the Zone 1A region (Harrington, in prep.). In both cases, recharge was applied over
the entire year (a 365 day stress period) but trends in groundwater levels were reasonably well
simulated compared with observation well hydrographs. It was considered that dividing the year into
one recharge and one non-recharge stress period, with these being opposite to groundwater extraction
stress periods, would provide a better representation of groundwater level fluctuations.
Groundwater extraction
Metered groundwater extraction data from 2007-08 was available for many of the licenses in the area of
the model. For licenses without metered data, groundwater extraction was based on estimates of use.
All extraction wells present in the 2007-08 data set were implemented in the model in 1980. Between
1960 and 1980, only a selection of the 2007-08 set of extraction wells were present, based on locations
of irrigation determined from aerial photography. No extraction was modelled prior to 1960.
4.2.4.5. Model Outcomes and Limitations
The model area is complex in terms of its structural geology, and this project was carried out in parallel
with a separate project being undertaken by DWLBC, that aimed to better characterise the structural
geology and related hydrogeology for the region (Lawson et al., 2009). Information from the
comprehensive drilling and coring program associated with this project was used in the construction of
the model grid. The model also included the most recently available groundwater abstraction
information collected through meters recently installed as part of the Volumetric Conversion Project,
and a representation of the temporal variation in plantation forestry coverage and groundwater use,
interpreted from a series of aerial photos. Consequently the numerical model represented the most up-
to-date conceptual model available at the time. Despite this, model calibration statistics were poorer
than those recommended by the Murray Darling Basin Groundwater Modelling Guidelines, with model
RMS values around 15-20%. Trends in groundwater levels, particularly groundwater level rises in
response to removal of plantation forestry by the Ash Wednesday bushfires, were largely well
simulated, suggesting that the conceptual model may be a reasonable representation of the system.
However, due to this poor calibration and project resourcing issues, the model has not yet been
finalized.

PREVIOUS MODELLING STUDIES IN THE LLC REGION
Department for Water | Technical Report DFW 2011/12 32 Lower South East Water Balance Project Phase 1 – Review of the conceptual model and recommendations for a Modelling Approach
4.2.4.6. Report
The preliminary conceptual model was developed in the following report:
Resource and Environmental Management Pty Ltd (REM), 2007, Estimating Regional Impacts of
Plantation Forestry and Intensive Irrigation Development on Groundwater Resources in the Lower South
East. Phase 1 (2006/2007) Final Research Report.
The draft model report is in preparation (Harrington et al., in prep.).
4.2.5. ZONE 1A MODEL
4.2.5.1. Purpose
The Zone 1A Model was constructed to assess the current understanding of the conceptual model of
groundwater flow in the Zone 1A region and model nitrate (etc) pathways for the “Primary Production
to Mitigate Water Quality Threats” or “Diffuse Impacts” project.
4.2.5.2. Background
The “Primary Production to Mitigate Water Quality Threats” Project commenced in March 2006 as a
collaborative study between the South Australian Research and Development Institute (SARDI), the
Flinders University of South Australia (FUSA) and the Department of Water, Land and Biodiversity
Conservation (DWLBC). The project aimed to mitigate the impacts of primary production on water
quality throughout the South East of South Australia. The specific objectives of the project were to:
Assess the risk of contamination of water resources in the South East from primary production.
Quantify the sources of diffuse pollution from primary production.
Decrease the risk of contamination of water resources from primary production within the South East.
The methodology was to include a combination of unsaturated zone and saturated zone modelling of
contaminant movement through the landscape. This methodology could then be used to investigate the
likely outcomes of a range of scenarios, for example:
Climate change.
Changing groundwater extraction regime.
Changes in land use.
For the purpose of the study, the South East was divided into a number of regions to be modelled
separately. The first region to be used as a trial for the methodology was Zone 1A of the Border
Designated Area, located in the south eastern corner of the study area, around and to the south of
Mount Gambier (Figure1).
4.2.5.3. Location
The location of the model domain is shown in Figure 1.
4.2.5.4. Model Structure
Model Domain
The entire Zone 1A model domain covers an area of 50 km x 50 km, with an active domain of 20 km x 35
km (Figure 1). The boundaries of the current active domain are defined by the Zone 1A Management

PREVIOUS MODELLING STUDIES IN THE LLC REGION
Department for Water | Technical Report DFW 2011/12 33 Lower South East Water Balance Project Phase 1 – Review of the conceptual model and recommendations for a Modelling Approach
Area boundaries. Whilst it was recognised that having the model boundary at the edge of the area of
interest may introduce undesirable boundary effects, this approach was taken to keep the model
sufficiently simple (i.e. extending the model domain would involve incorporating a number of complex
geological features that are currently not well understood). A surrounding area of inactive cells was
included to allow the model domain to be easily extended in the future if a) the influence of boundary
effects was considered to be unsatisfactory in relation to the objectives of the current project, b)
additional knowledge of the surrounding hydrogeology was obtained, improving the confidence in a
model with a larger domain, and/or c) expansion of the objectives of the project, or requirements of
some other project required that the model domain be expanded.
Model Grid
The model domain is discretised using a grid with cells ranging from 62.5 m to 125 m in the x- and y-
directions. This relatively fine grid was required due to the large slopes in layer boundary elevations and
resulting problems with cells not overlapping when a coarser grid was used. This was particularly
important in the north-west of the model domain where the finest grid cells were required.
Model Layers
Three layers were used to represent the following hydrogeologic units of the unconfined aquifer:
Layer 1: Bridgewater Formation and Unit 1 of Green Point Member (Gambier Limestone)
Layer 2: Units 2-5 of Green Point Member (Gambier Limestone)
Layer 3: Camelback Member (Gambier Limestone)
The tops and thicknesses of the layers were derived from selected bore logs. The database used for this
was more extensive than that used by Harrington et al. (2007) to create the stratigraphy model of Zone
1A. The base of the model, which is a no-flow boundary, represents the top of the aquitard that
separates the confined Dilwyn Sand aquifer and the unconfined Gambier Limestone. Due to the complex
nature of the geology, some manual modifications to the grid were required following importation of
the layer boundary elevations.
4.2.5.5. Model Outcomes and Limitations
Although the model was considered to be the best possible representation of the conceptual model at
the time, calibration results suggest that it does not currently represent the complexities in the system
adequately to allow it to be used for either quantitative or qualitative analysis. The steady state
calibration results were relatively good, with an overall RMS error of 8%. Removing one particularly
problematic well from the calibration results reduced the RMS error to 6%. However, the model did not
adequately simulate transient groundwater level trends. This may be due either to (a) error(s) or
oversimplication of the conceptual model, or (b) misrepresentation of the impacts of recharge and
groundwater extraction in annual time steps. It is hoped that this can be explored further in the future.
4.2.5.6. Report
The conceptual model report is:
Harrington, N, Chambers, K & Lawson, J 2007, Primary Production to Mitigate Water Quality Threats
Project. Zone 1A Numerical Modelling Study: Conceptual Model Development, DWLBC Report 2008/12,
PREVIOUS MODELLING STUDIES IN THE LLC REGION
Department for Water | Technical Report DFW 2011/12 34 Lower South East Water Balance Project Phase 1 – Review of the conceptual model and recommendations for a Modelling Approach
Government of South Australia, through Department of Water, Land and Biodiversity Conservation, GPO
Box 2834, Adelaide SA 5001.
The draft model report is in progress.
4.2.6. SOUTH OF MT GAMBIER MODEL
4.2.6.1. Purpose
To assess the potential use of the groundwater resources from the unconfined aquifer in the area south
of Mount Gambier.
4.2.6.2. Background
The South East of South Australia is almost totally reliant on its extensive groundwater resources which
predominantly occur in two regional aquifer systems – an upper unconfined aquifer and a deeper
confined aquifer. Over the previous few years, particularly following the prescription of the Lacepede-
Kongorong Prescribed Wells Area in 1997, the potential to use some of the lateral throughflow of
groundwater in the unconfined aquifer in addition to the vertical recharge had been raised as a
management issue for areas south of Mount Gambier. Partially funded by the South East Catchment
Water management Board, a groundwater flow model was developed to provide technical input for the
water allocation plans being developed for the Comaum – Caroline and Lacepede – Kongorong
Prescribed Wells Areas.
4.2.6.3. Location
The location of the model domain is shown in Figure 1.
4.2.6.4. Model structure
The MODFLOW model domain simulates an area 52 km (east to west) by 28 km (north to south) (Figure
1). The rectangular model grid is divided into 100 rows and 200 columns. The grid has a uniform cell size
of 260 m × 280 m. The regional aquifer system was conceptualised as three layers, including two aquifer
layers (the Gambier Limestone and Dilwyn Sand (Tertiary Confined Sand Aquifer) and one aquitard layer
separating them (Error! Reference source not found.5). The model covered the period between 1970
nd 2030, with modelling of predictive scenarios beginning in 2000.

PREVIOUS MODELLING STUDIES IN THE LLC REGION
Department for Water | Technical Report DFW 2011/12 35 Lower South East Water Balance Project Phase 1 – Review of the conceptual model and recommendations for a Modelling Approach
Figure 5. Geological cross-section showing the area south of Mount Gambier
Recharge
Recharge rates for this model were applied based on soil type and land use (using recharge rates
reported by Bradley et al., 1995) for Zone 1A, and based on the recharge rates used to determine
Permissible Annual Volumes (PAVs) of groundwater extraction at that point in time. Recharge rates
varied between 0 – 90 mm/y, and were applied over a 185 day period between April and September,
simulating the influence of winter rainfall. Recharge rates were held constant from year to year (i.e.
there was no temporal variation in recharge). The remainder of the simulation period (October to
March), no recharge was applied and groundwater extraction was implemented.
Groundwater extraction
Data on allocation and use from 1999, combined with local knowledge about irrigation activity and well
location, was used to model groundwater extraction. Estimated extraction volumes (based on crop
water requirement estimates) were applied to irrigation wells based on their construction date, with the
extraction volume from each well remaining constant thereafter. Extraction was applied over a 180 day
summer irrigation season.

PREVIOUS MODELLING STUDIES IN THE LLC REGION
Department for Water | Technical Report DFW 2011/12 36 Lower South East Water Balance Project Phase 1 – Review of the conceptual model and recommendations for a Modelling Approach
The lack of detailed extraction data was an acknowledged limitation, however the method for applying
irrigation did allow for the expansion in irrigation over time to be captured in the model, with a large
increase in irrigation activity following prescription of the Lacepede-Kongorong area in 1997 (extraction
volumes are show in Table 1).
4.2.6.5. Report
Stadter F and Yan W, 2000, Assessment of the potential use of the groundwater resources in the area
south of Mount Gambier, Report PIRSA 2000/00040, Primary Industries and Resources South Australia,
Adelaide
4.2.7. PADTHAWAY MODEL (PADMOD1 AND PADMOD2)
4.2.7.1. Purpose
Predicting historical and future groundwater levels and salinities in the Padthaway Prescribed Wells
Area (Padthaway PWA) in response to changes in land use and pumping scenarios, and for determining
the benefits of alternative groundwater management options.
4.2.7.2. Background
The groundwater flow and solute transport model, PADMOD1 (Aquaterra, 2008), represents the final
output of the Department of Water Land and Biodiversity Conservation’s (now DFW’s) Padthaway Salt
Accession Project (Harrington et al., 2004; Van den Akker, 2005; Wohling et al., 2005; Van den Akker et
al., 2006; Harrington et al., 2006). The Padthaway Salt Accession Project was an intensive field-based
investigation into salt accumulation in groundwater under the main irrigation area of the Padthaway
PWA, providing information on (a) the flushing of the unsaturated zone salt store following clearing in
the Naracoorte Ranges and (b) the recycling of irrigation water salinity in the main irrigation area. The
main conclusion was that the predominant cause of rising groundwater salinities in the main irrigation
area was the former process (a). The initial project was funded through the National Action Plan for
Salinity and Water Quality, the South East NRM Board and the Padthaway Grape Growers’ Association
and was carried out to inform the Water Allocation Plan for the Padthaway PWA. The numerical model,
being required as a tool to engage the community and assess management options for the PWA, was
funded through the National Water Commission’s National Water Initiative (NWI). PADMOD1 was
updated to PADMOD2 with a revised recharge dataset to address some model limitations and
investigate some additional pumping scenarios (Wohling, 2008).
4.2.7.3. Location
The location of the model is the Padthaway Prescribed Wells Area (Figure 1).
4.2.7.4. Model Structure
The model covers an area of 38 x 33 km, discretised using a 100 m square grid and consists of three
layers, representing the layers of the unconfined aquifer, the Padthaway / Bridgewater Formations, the
underlying clay aquitard and the Coomandook / Gambier Limestone formations.
Recharge
Recharge for this model was applied differently in three areas – the Naracoorte Ranges, irrigated areas,
and non-irrigated areas of the Padthaway Flats. In all cases, recharge rates were applied annually (i.e.
the modelled recharge period was 365 days for each year).

PREVIOUS MODELLING STUDIES IN THE LLC REGION
Department for Water | Technical Report DFW 2011/12 37 Lower South East Water Balance Project Phase 1 – Review of the conceptual model and recommendations for a Modelling Approach
Recharge to the Naracoorte Ranges was based on previous studies by Wohling et al. (2005) and Wohling
(2006), which simulated an increase in recharge following clearance of native vegetation in the 1960s.
Recharge rates initially ranged from 0 – 110 mm/y, and varied spatially according to land use and soil
type. However during calibration, recharge in the Naracoorte Ranges was capped at 50 mm/y. Recharge
rates also varied temporally, with increases occurring over ten year periods following the change in land
use.
Recharge under irrigation was based on measurements of drainage reported by DWLBC (Harrington et
al., 2006). Under drip irrigation, modelled recharge rates ranged from 91 mm/y to 118 mm/y. Under
pivot irrigated areas, modelled recharge of 100mm/y was applied. Recharge under flood irrigated areas
was initially applied at 1400 mm/y, but reduced to 840 mm/y during calibration because of poor model
performance.
Recharge to non-irrigated areas in the Padthaway Flats was based on rainfall data recorded at
Padthaway, and hydrograph analysis in the Flats, given the correlation between trends in rainfall and
groundwater level in the flats. Recharge was applied as 30% of the eight year moving average of rainfall,
and varied between 55 mm/y and 110 mm/y. Using this method, the long term mean recharge rate was
75 mm/y, which is the recharge rate for Padthaway reported by Brown et al. (2006).
Groundwater extraction
When the Padthaway model was constructed, metered groundwater extraction data was available for
the 2004-05 irrigation season for a significant proportion of licences, and estimated use for the
remainder of licences. Given the accuracy of the 2004-05 data set, it was used as a basis for extraction in
the model. Extraction was set at 110% of the 2004-05 rate from 1992 until 2006 (the increase in volume
related to uncertainty in the estimated use figures in the 2004-05 data set, which were thought to be
underestimates). From 1970 to 1992, extraction was set at 75% of the estimated 2004-05 rate, based on
local knowledge of groundwater use. No extraction was implemented in the model prior to 1970
(transient model simulation commenced in 1950). All groundwater extraction wells present in 2004-05
were included in the model simulation for all irrigation periods. Extraction was applied throughout the
year, not limited to a summer irrigation season (as in other models of the South East).
Evapotranspiration
Evapotranspiration (ET) from the shallow water table on the Padthaway Flats (below the main irrigation
area) was measured on a weekly basis at several CSIRO flux stations during the Padthaway Salt
Accession Project. The total actual ET for 2004 was measured at 499 mm/y (i.e. similar to rainfall), with
the highest rates in summer (up to 20 mm/month) and lowest in winter (about 5 mm/month). ET was
implemented in the model by specifying an extinction depth of 3 m.
4.2.7.5. Report
Aquaterra, 2008, Padthaway Groundwater Flow and Solute Transport Model (PADMOD1), Prepared for DWLBC, October 2008. Wohling, D., 2008, Padthaway Groundwater Flow and Solute Transport Model (PADMOD2): New Abstraction Scenarios Requested by the SENRM Board., Department of Water, Land and Biodiversity Conservation. DWLBC Technical Note 2008/22. June 2008.
PREVIOUS MODELLING STUDIES IN THE LLC REGION
Department for Water | Technical Report DFW 2011/12 38 Lower South East Water Balance Project Phase 1 – Review of the conceptual model and recommendations for a Modelling Approach
4.3. CONCLUSIONS AND RECOMMENDATIONS
Based on the review of existing numerical groundwater models for the Lower South East, the following
conclusions and recommendations can be made:
A wide variety of numerical groundwater models exist for the Lower South East.
These models represent our best understanding of the groundwater system in the areas that they cover, and are a collation of all of the relevant information, providing a large knowledge base for a regional-scale model.
The complexity and variety of the models that already exist show that the Lower South East is an area rich in data.
The models have been developed to fulfil a range of objectives, including investigating the applicability of modelling methodologies, testing conceptual model of groundwater flow systems, modelling pathways of diffuse source contaminants, assessing the impacts of plantation forestry and determining PAVs and impacts of proposed management scenarios.
For this reason, the various components of the water balance, e.g. recharge, evapotranspiration, forestry impacts and groundwater extraction have been represented in the models in a variety of different ways, with an array of different input datasets, with the result that the outputs of the models are not necessarily comparable from region to region, nor are all of the models applicable to addressing all potential modelling objectives.

Department for Water | Technical Report DFW 2011/12 39 Lower South East Water Balance Project Phase 1 – Review of the conceptual model and recommendations for a Modelling Approach
5. OUTCOMES FROM A TECHNICAL WORKSHOP REVIEWING THE STATUS OF THE CONCEPTUAL MODEL
5.1. BACKGROUND
A full-day technical workshop was held as part of the Lower South East Water Balance Project on Tues
25th May 2010, with the following objectives:
Review the scope, outcomes and challenges faced by previous, current and planned technical projects across the following water balance topics for the Lower South East:
o Existing Groundwater Models
o Groundwater Recharge Processes
o Groundwater Flow
o Irrigation and Forestry Impacts (groundwater extraction, recharge interception, irrigation return flows)
o Groundwater Dependent Ecosystems (including the Blue Lake)
o Surface Water Flows
o Inter-aquifer Leakage
o Rainfall and Climate Change.
Review water balance data availability and quality and identify the key knowledge / data gaps from the perspective of developing a numerical groundwater model of the Lower South East.
Discuss opportunities for future collaboration and co-ordination of projects towards improving the overall conceptual model.
There were 33 attendees from DFW, CSIRO, universities and private consulting firms. A series of
presentations on previous and current technical projects in the Lower South East was followed by
workshop-style discussions. A summary of the main points that were taken away from the workshop by
the project team is presented below.
5.2. SUMMARY
There were some clear themes that came out throughout the workshop. The following data /
knowledge gaps were identified as the key priorities:
Good representations of spatial and temporal variations in:
o Land use
o Recharge
o ET
o Groundwater interaction with drains
o Forestry impacts
PREVIOUS MODELLING STUDIES IN THE LLC REGION
Department for Water | Technical Report DFW 2011/12 40 Lower South East Water Balance Project Phase 1 – Review of the conceptual model and recommendations for a Modelling Approach
An understanding of, and monitoring data to inform the feasibility of modelling Surface Water – Groundwater interactions.
A quantitative knowledge of the salt balance.
The general consensus was that there needs to be a major effort to identify our future priorities in
knowledge acquisition for the region (i.e. what are the objectives and what data do we really need) and
to optimise our monitoring efforts towards those priorities. This requires a co-ordinated and inclusive
approach and someone or some organisation designated to co-ordinate this.
It was also clear that a co-ordinated approach to the collation of the historical data described above
would be of great benefit to everybody. This would essentially build a chronological history of the South
East and may involve a combination of desktop studies of historical reports, digitising aerial photos and
modelling. Having this available as a central resource would be of great benefit to the region.
The general opinion was that a regional three dimensional model would be required to bring the
community on board for groundwater management in the Lower South East. However, it was also
emphasised that conceptual models can be an extremely powerful tool in helping to understand
systems and educate the wider community. Conceptual models are under-used in this respect and this
should be an important output from the Lower South East Water Balance Project. A three dimensional
numerical model may have large limitations but ultimately needs to be seen by the community to
maintain their confidence in management decisions.

Department for Water | Technical Report DFW 2011/12 41 Lower South East Water Balance Project Phase 1 – Review of the conceptual model and recommendations for a Modelling Approach
6. DETAILED REVIEW OF CONCEPTUAL MODEL AND INPUT DATA AVAILABILITY
6.1. PHYSICAL CHARACTERISTICS OF THE LLC REGION
6.1.1. TOPOGRAPHY
The Gambier Basin of the Otway Basin, in which the study area is located, is an undulating coastal plain
with a general slope to the west and southwest towards the sea. It is bound by topographic highs in the
east and north, the Dundas Plateau and the Padthaway Ridge respectively, and by the Southern Ocean
to the south and west. The topographic relief in the study area is generally low, rising to a maximum of
50 m along a series of northwest to southeast trending stranded coastal ridges (Fig. 6 shows the South
Australian portion of the study area). Topographic lows (< 30 m AHD) occur in the inter-dunal regions.
The highest points in the landscape are the Mount Gambier and Mount Schank volcanic cones, rising to
190 m and 120 m AHD respectively (Fig. 6).
Topographic data is available for both South Australia and Victoria through Geoscience Australia, with
an accuracy of 0.5m and a point spacing of <2m.

DETAILED REVIEW OF CONCEPTUAL MODEL AND INPUT DATA AVAILABILITY
Department for Water | Technical Report DFW 2011/12 42 Lower South East Water Balance Project Phase 1 – Review of the conceptual model and recommendations for a Modelling Approach
Figure 6. Digital elevation model for the South East
6.1.2. CLIMATE

DETAILED REVIEW OF CONCEPTUAL MODEL AND INPUT DATA AVAILABILITY
Department for Water | Technical Report DFW 2011/12 43 Lower South East Water Balance Project Phase 1 – Review of the conceptual model and recommendations for a Modelling Approach
The South East maintains a Mediterranean climate of hot dry summers and cool wet winters. Daily
maxima can be as high as 40 C in the summer months and as low as 10–12 C during the winter months.
A rainfall gradient exists in the South East, with generally higher rainfall in the southern part of the
region, and lower rainfall further north. Figure 7 displays mean annual rainfall for the South Australian
portion of the study area, which ranges from 835 mm/y in the elevated Mt Burr Ranges (north east of
Millicent), to 460mm/y in Keith (Fawcett et al., 2006). Approximately 75% of annual rainfall falls
between the months of April – October, and this is typically when recharge occurs (when monthly
rainfall exceeds monthly evapotranspiration). Evapotranspiration also follows an approximate north-
south gradient, with potential evapotranspiration ranging from ~ 1400 mm/y in Mount Gambier to
~1700 mm/y in Keith. Rainfall and evapotranspiration are discussed in more detail in the Recharge and
Evapotranspiration sections below.
Figure 7. Long term average (1971 – 2000) annual rainfall for the South East of South Australia (taken from
Fawcett et al., 2006)
6.1.3. LAND USE
Knowledge of changes in land use over time is important for understanding temporal changes to rainfall
recharge, evapotranspiration and plantation forestry impacts. It can also be useful, in the absence of
more accurate data, as a surrogate for estimating changes to groundwater extraction over time. GIS-
based land use maps for both the Victorian and the South Australian portions of the study area are
available for approximately 2002 - 2005 from the ABARES (Australian Bureau of Agricultural and
Resource Economics and Sciences) website. The Victorian data has also been obtained separately from
the Victorian Dept. Of Sustainability and Environment (DSE). Figure 8 shows the 2008 Land Use
classification map for the South East.
Digital land use maps are not available prior to 2000. However, temporal land use information can be
gained by digitising and interpreting historical aerial photos, a time consuming process that would

DETAILED REVIEW OF CONCEPTUAL MODEL AND INPUT DATA AVAILABILITY
Department for Water | Technical Report DFW 2011/12 44 Lower South East Water Balance Project Phase 1 – Review of the conceptual model and recommendations for a Modelling Approach
nonetheless have benefits for numerous applications. This has been done for the domain of the
Coonawarra (Zone 3A) Model, for the years 1969 and 1987. A map of the forestry footprint for the
South East in 1995-96 is also available.
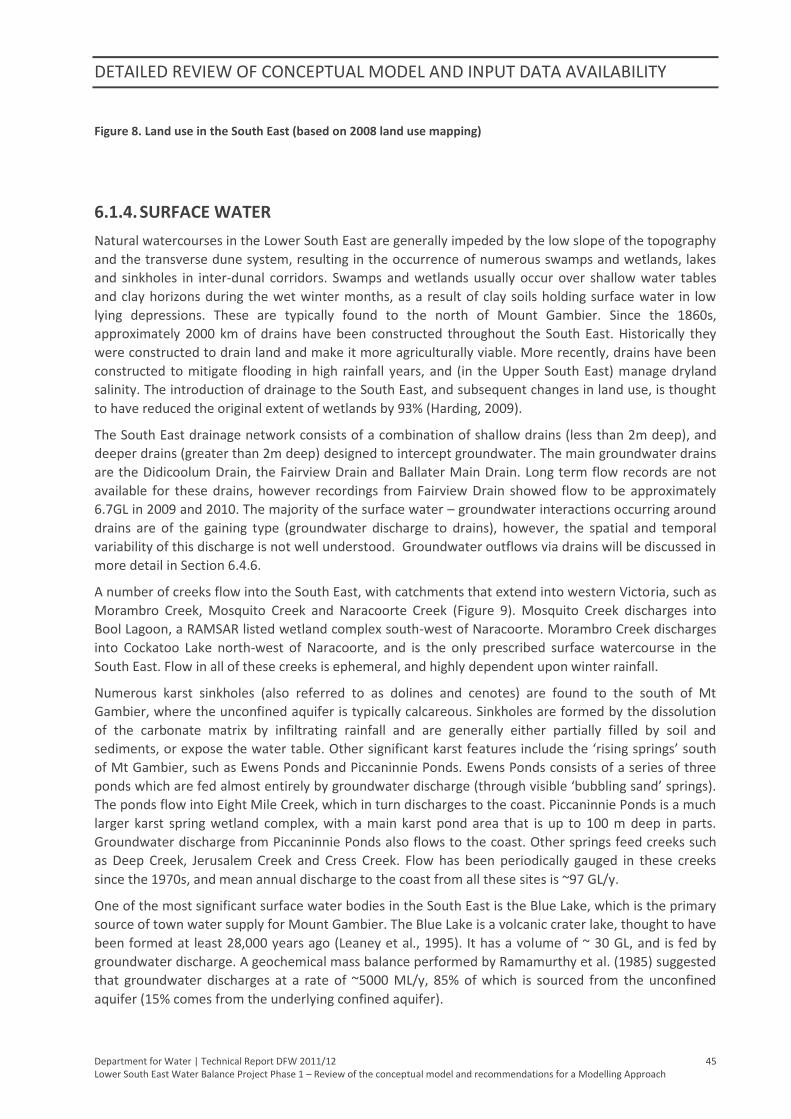
DETAILED REVIEW OF CONCEPTUAL MODEL AND INPUT DATA AVAILABILITY
Department for Water | Technical Report DFW 2011/12 45 Lower South East Water Balance Project Phase 1 – Review of the conceptual model and recommendations for a Modelling Approach
Figure 8. Land use in the South East (based on 2008 land use mapping)
6.1.4. SURFACE WATER
Natural watercourses in the Lower South East are generally impeded by the low slope of the topography
and the transverse dune system, resulting in the occurrence of numerous swamps and wetlands, lakes
and sinkholes in inter-dunal corridors. Swamps and wetlands usually occur over shallow water tables
and clay horizons during the wet winter months, as a result of clay soils holding surface water in low
lying depressions. These are typically found to the north of Mount Gambier. Since the 1860s,
approximately 2000 km of drains have been constructed throughout the South East. Historically they
were constructed to drain land and make it more agriculturally viable. More recently, drains have been
constructed to mitigate flooding in high rainfall years, and (in the Upper South East) manage dryland
salinity. The introduction of drainage to the South East, and subsequent changes in land use, is thought
to have reduced the original extent of wetlands by 93% (Harding, 2009).
The South East drainage network consists of a combination of shallow drains (less than 2m deep), and
deeper drains (greater than 2m deep) designed to intercept groundwater. The main groundwater drains
are the Didicoolum Drain, the Fairview Drain and Ballater Main Drain. Long term flow records are not
available for these drains, however recordings from Fairview Drain showed flow to be approximately
6.7GL in 2009 and 2010. The majority of the surface water – groundwater interactions occurring around
drains are of the gaining type (groundwater discharge to drains), however, the spatial and temporal
variability of this discharge is not well understood. Groundwater outflows via drains will be discussed in
more detail in Section 6.4.6.
A number of creeks flow into the South East, with catchments that extend into western Victoria, such as
Morambro Creek, Mosquito Creek and Naracoorte Creek (Figure 9). Mosquito Creek discharges into
Bool Lagoon, a RAMSAR listed wetland complex south-west of Naracoorte. Morambro Creek discharges
into Cockatoo Lake north-west of Naracoorte, and is the only prescribed surface watercourse in the
South East. Flow in all of these creeks is ephemeral, and highly dependent upon winter rainfall.
Numerous karst sinkholes (also referred to as dolines and cenotes) are found to the south of Mt
Gambier, where the unconfined aquifer is typically calcareous. Sinkholes are formed by the dissolution
of the carbonate matrix by infiltrating rainfall and are generally either partially filled by soil and
sediments, or expose the water table. Other significant karst features include the ‘rising springs’ south
of Mt Gambier, such as Ewens Ponds and Piccaninnie Ponds. Ewens Ponds consists of a series of three
ponds which are fed almost entirely by groundwater discharge (through visible ‘bubbling sand’ springs).
The ponds flow into Eight Mile Creek, which in turn discharges to the coast. Piccaninnie Ponds is a much
larger karst spring wetland complex, with a main karst pond area that is up to 100 m deep in parts.
Groundwater discharge from Piccaninnie Ponds also flows to the coast. Other springs feed creeks such
as Deep Creek, Jerusalem Creek and Cress Creek. Flow has been periodically gauged in these creeks
since the 1970s, and mean annual discharge to the coast from all these sites is ~97 GL/y.
One of the most significant surface water bodies in the South East is the Blue Lake, which is the primary
source of town water supply for Mount Gambier. The Blue Lake is a volcanic crater lake, thought to have
been formed at least 28,000 years ago (Leaney et al., 1995). It has a volume of ~ 30 GL, and is fed by
groundwater discharge. A geochemical mass balance performed by Ramamurthy et al. (1985) suggested
that groundwater discharges at a rate of ~5000 ML/y, 85% of which is sourced from the unconfined
aquifer (15% comes from the underlying confined aquifer).

DETAILED REVIEW OF CONCEPTUAL MODEL AND INPUT DATA AVAILABILITY
Department for Water | Technical Report DFW 2011/12 46 Lower South East Water Balance Project Phase 1 – Review of the conceptual model and recommendations for a Modelling Approach
As part of the Regional Flow Management Strategy project for the South East, the regional Digital
Elevation Model was used to define stream networks and catchment boundaries for the surface water
systems of the South East. Wood and Way (2010) then developed a series of rainfall-runoff models for
these catchments to simulate regional flow through the drainage system and natural watercourses, with
special attention given to simulation of water inflow to high value wetlands. A reference period of
simulation from 1971-2000 was used for all models, and they were calibrated to observed data (i.e.
measured flow) where that data was available. However, the lack of monitoring data in some areas –
particularly in areas where interactions between surface water and groundwater may be significant –
was identified as a limitation in validating the models.

DETAILED REVIEW OF CONCEPTUAL MODEL AND INPUT DATA AVAILABILITY
Department for Water | Technical Report DFW 2011/12 47 Lower South East Water Balance Project Phase 1 – Review of the conceptual model and recommendations for a Modelling Approach
Figure 9. Surface water features in the South East
6.2. GEOLOGY AND HYDROGEOLOGY OF THE LOWER LIMESTONE COAST
6.2.1. GEOLOGICAL SETTING

DETAILED REVIEW OF CONCEPTUAL MODEL AND INPUT DATA AVAILABILITY
Department for Water | Technical Report DFW 2011/12 48 Lower South East Water Balance Project Phase 1 – Review of the conceptual model and recommendations for a Modelling Approach
The study area is located in the Gambier Basin of the Otway Basin. The latter is an east-west elongate
basin of ~100 000 km2 containing a thick accumulation of mixed marine and terrestrial sediments
deposited during the Cretaceous and Tertiary eras (Figure 2). The Gambier Basin is the most westerly of
the groundwater sub-basins of the Otway Basin. It is separated from the Murray Basin to the north by
the Padthaway Ridge, a granitic basement high and is bounded in the east by the Dundas Plateau (Figure
2).
Sedimentation in the Gambier Basin commenced in the Late Palaeocene to Middle Eocene with the
Paralic Wangerrip Group (Pebble Point Formation, Pember Mudstone and Dilwyn Formation). The
Dilwyn Formation includes the Confined Dilwyn Sands Aquifer (TCSA) and the Dilwyn Clay aquitard.
Increasing marine influence led to the deposition of the Middle to Late Eocene marginal-marine
Nirranda Group (Mepunga Formation and Narrawaturk Marl, both aquitards), and the Late Eocene to
Middle Miocene marine Gambier Limestone, the unconfined aquifer.
A number of prominent structural features occur within the Gambier Basin that are believed to have
significant influence over groundwater flow. In particular, the north-west trending Kanawinka Fault
occurs in the north east of the Basin, and the west – north west trending Tartwaup Fault occurs in the
south of the basin (Fig. 2, Fig. 10). Both faults have a throw towards the southwest, with the magnitude
of the discontinuity diminishing towards the surface. The Tartwaup Fault forms a major structural hinge
line, with Cretaceous and Tertiary sediments rapidly increasing in thickness to the south of it
(Gravestock et al., 1986). A number of smaller parallel faults are associated with the Tartwaup Fault (Fig.
10) (Lawson et al., 2009). An important structural high, the Gambier Axis (Kenley, 1971) occurs to the
north of the Tartwaup Fault. The recent mapping of fault locations in the Tertiary sequences (Figure 10)
have revealed that the northern boundary of the Gambier Basin is likely to occur approximately along
the Kingston-to-Naracoorte line, and is associated with a magnetic high in between Lucindale and Struan
(Lawson et al., 2009). This can be approximated by following the northern extent of mapped faults in
Figure 10.

DETAILED REVIEW OF CONCEPTUAL MODEL AND INPUT DATA AVAILABILITY
Department for Water | Technical Report DFW 2011/12 49 Lower South East Water Balance Project Phase 1 – Review of the conceptual model and recommendations for a Modelling Approach
Figure 10. Location of stratigraphic faults in the South East (note: faults have only been mapped for the Otway
Basin)
A sea level rise during the Pleistocene resulted in a number of marine transgressions that extended as
far inland as the Kanawinka Fault and caused reworking of the Tertiary units. A series of fossiliferous
sand dunes (Bridgewater Formation) formed in strand lines sub-parallel to the coastline as the ocean

DETAILED REVIEW OF CONCEPTUAL MODEL AND INPUT DATA AVAILABILITY
Department for Water | Technical Report DFW 2011/12 50 Lower South East Water Balance Project Phase 1 – Review of the conceptual model and recommendations for a Modelling Approach
regressed, with the shallow marine limestone of the Padthaway Formation being deposited in the inter-
dunal areas. These units, where present, also form part of the unconfined aquifer for the region.
6.2.2. OVERVIEW AND HYDROSTRATIGRAPHIC MODEL OF THE LOWER LIMESTONE COAST
Groundwater of the Gambier Basin occurs in a number of different hydrogeological systems in the
Cainozoic and Cretaceous sequences. The Cretaceous aquifers are possibly saline and generally too deep
for economic utilisation. The two major low salinity groundwater systems occur within the Cainozoic
sequence. These are the sand and clay Dilwyn confined aquifer system and the multilithological Gambier
unconfined aquifer system. The confined system is separated in places from the underlying Cretaceous
aquifers by the Lower Tertiary aquitard (Pember Mudstone), and from the overlying unconfined system
by the Upper Tertiary Aquitard, comprising the Narrawaturk Marl, the Mepunga Formation (can occur in
parts as discontinued aquifer) and a clayey unit of the Dilwyn Formation itself, known as the Dilwyn
Clay. The unconfined aquifer system consists of the late Tertiary Gambier Limestone and the Quaternary
Padthaway and Bridgewater Formations. The Gambier Limestone has been divided into a series of three
sub-units, the Greenways, Camelback and Green Point members (Li et al., 2000). The entire
hydrogeological sequence of the Gambier Basin is wedge shaped, thickening from north to south to up
to 5 000 m offshore. The Cainozoic groundwater system itself can be up to 1 000 m thick near the
southern coast.
A conceptual hydrostratigraphic framework for the Lower Limestone Coast was compiled as part of the
South East NWI project, and a 3D model constructed from this (Figure 11). The model includes
stratigraphic logs from a combination of groundwater observation wells, water supply and irrigation
bores and petroleum exploration holes, which were available from the state drill hole database,
SAGeodata, or as microfiche records held by DFW. Additional investigation holes that have been
recently drilled are also included. Overall, the model includes data from 327 well logs, including 5 newly
drilled wells in the Victorian Border Zone 3B. Additional stratigraphy data is available to extend the
domain of the existing stratigraphic model north to the proposed regional model boundary.
The model adopts generalised lithologies, rather than strict stratigraphic definitions. For example, all
unconfined aquifer units are grouped as the Tertiary Limestone Aquifer (Gambier Limestone, Murray
Limestone, Bridgewater and Padthaway Formations).
As mentioned above, the existing stratigraphic model includes only 5 data points from the Victorian side
of the Border. Additional hydrostratigraphic data from this side of the Border has been obtained from
the Victorian DSE and, although the interpretations and unit descriptions are different, it is believed that
the spatial coverage is good and this data can be interpreted to align with the South Australian
stratigraphic model.

DETAILED REVIEW OF CONCEPTUAL MODEL AND INPUT DATA AVAILABILITY
Department for Water | Technical Report DFW 2011/12 51 Lower South East Water Balance Project Phase 1 – Review of the conceptual model and recommendations for a Modelling Approach
Figure 11. Stratigraphic model for the South East (from Lawson et al., 2009)
6.2.3. GROUNDWATER FLOW AND AQUIFER PROPERTIES
6.2.3.1. Tertiary Confined Sand Aquifer
The Tertiary Confined Sand Aquifer (TCSA) comprises interbedded gravels, sands, silts and carbonaceous
clays of the early Tertiary Dilwyn and Mepunga Formations, and generally increases in thickness towards
the south, being up to 800 m thick in the region to the south of Mt Gambier (Love, 1991). It is a multi-

DETAILED REVIEW OF CONCEPTUAL MODEL AND INPUT DATA AVAILABILITY
Department for Water | Technical Report DFW 2011/12 52 Lower South East Water Balance Project Phase 1 – Review of the conceptual model and recommendations for a Modelling Approach
aquifer system, but is treated as one aquifer unit for management purposes. There are few data and
hence little understanding of the hydraulic interconnection between the sub-aquifers of the Dilwyn
Formation. Most wells only penetrate the uppermost sand unit of the aquifer for economic reasons, but
a number of deeper petroleum exploration wells have provided some valuable stratigraphic information
(Brown et al., 2001).
Hydraulic data for the confined aquifer is sparse, but what is available suggests that hydraulic properties
are not as spatially variable as for the unconfined aquifers. For the entire Otway Basin region, porosity
values estimated from borehole geophysical logs vary from 20% to 30%, whilst transmissivity estimates
range from 200 m2/d to 1600 m2/d (Floegel, 1972; Bowering, 1976; Waterhouse, 1977; Smith, 1978a&b;
Cobb, 1976; Shepherd, 1978).
In their model of the region to the south of Mt Gambier, Stadter and Yan (2000) assigned zones of
hydraulic conductivity ranging between 0.5–10 m/d to the Dilwyn Sand aquifer, based on limited
hydraulic testing results and local knowledge. A uniform specific storage value of 10-6/m was also
applied. In the regional model of the confined aquifer, Brown (2000) assigned hydraulic conductivities
ranging from 1–80 m/d.
Harrington et al. (1999) estimated lateral flow velocities in the TCSA to range between 0.4 m/yr and 5.5
m/yr using their combined MODFLOW and Compartmental Mixing Cell approach.
6.2.3.2. Upper Tertiary Aquitard
Little information exists on the hydraulic properties of the Upper Tertiary aquitard. Vertical hydraulic
conductivities were determined via triaxial permeability testing to range between 10-7 and 10-3 m/d in
the northern portion of the Otway Basin, near Lucindale (Love & Stadter, 1990). Laboratory tests carried
out on the Dilwyn Clay in the Nangwarry / Tarpeena Area provided vertical hydraulic conductivity values
ranging between 3.4 x 10⁻⁶ m/d and 7.2 x 10⁻⁶ m/d (Brown et al., 2001). The recent NWI stratigraphy
project (Lawson et al., 2009) obtained three porosity estimates for the aquitard through downhole
geophysics. These were for the Mepunga Formation (7.1 % and 7.2%) and Narrawaturk Marl (9.5 %).
The Zero Head Difference (ZHD) line is a line along which the head difference between the unconfined
and confined aquifers is zero (Fig. 12; Love, 1991). There is potential for downward groundwater flow
across the aquitard to the north of the ZHD line and for upward flow to the south of the ZHD line
(throughout most of the study area). Brown et al. (2001) suggested that any downward groundwater
flow across the aquitard in the Nangwarry / Tarpeena area to the north of the study area occurs
preferentially via faulting, fractures or sinkholes. Supporting this theory, 14C activities of groundwater
from the aquitard in the Tarpeena area measured by Brown et al. (2001) were below background levels,
whilst significant concentrations of 14C existed in the underlying confined aquifer. The aquitard is
relatively thin in the Nangwarry / Tarpeena area (~2 m). However, it is possible that inter-aquifer flow
also occurs through the clay via similar preferential flow mechanisms in areas where the clay is
significantly thicker.

DETAILED REVIEW OF CONCEPTUAL MODEL AND INPUT DATA AVAILABILITY
Department for Water | Technical Report DFW 2011/12 53 Lower South East Water Balance Project Phase 1 – Review of the conceptual model and recommendations for a Modelling Approach
Figure 12. Map of Otway Basin, showing unconfined aquifer potentiometric surface and location of zero-head
difference (ZHD) line
Groundwater sampled by Love (1991) from the unconfined aquifer observation well GAM28, located in
the south-eastern corner of the study area, had a uranium concentration and atomic ratio similar to that
of the confined Dilwyn Sand aquifer, suggesting upward leakage in that region. This is despite the
presence of a 300 m thick aquitard between the two aquifers at this location. The location of a fault in
that region (Fig. 10) suggests that it is possible that leakage may have occurred through a preferential

DETAILED REVIEW OF CONCEPTUAL MODEL AND INPUT DATA AVAILABILITY
Department for Water | Technical Report DFW 2011/12 54 Lower South East Water Balance Project Phase 1 – Review of the conceptual model and recommendations for a Modelling Approach
pathway, although this is unconfirmed. It is currently unknown whether there are any other occurrences
of upward leakage across the aquitard in the study area.
6.2.3.3. Tertiary Limestone Aquifer
The Gambier Limestone is part of the Quaternary/Upper Tertiary Unconfined Aquifer System and
consists of various facies of fossiliferous limestone of Tertiary age, ranging in thickness from very thin to
300m. The Gambier Limestone is overlain and hydraulically inter-connected with the superficial
Quaternary surface aquifers, the Padthaway, Bridgewater and Coomandook Formations, of which the
Bridgewater Formation is predominant in the study area. The Gambier Limestone is divided into three
main sub-units, the Greenways, Camelback and Green Point Members. It often becomes marly and
dolomitic towards the base. This unit has recently been mapped across part of the study area (Lawson
et al., 2009) but its regional extent is unknown due to a lack of penetrating wells (Love, 1991).
Outcrops of the Gambier Limestone occur via uplift and/or erosion of overlying sediments, with a major
outcrop occurring in the study area, to the south of the Tartwaup Fault. Rapid thinning of the entire
unconfined aquifer formation to the north of Mount Gambier is due to up-warping along the Gambier
Axis and transgression of the sea in the late Pleistocene, which truncated and re-worked the top part of
the sequence. A groundwater divide occurs here along the Gambier Axis (Love, 1991).
Groundwater flow in the unconfined aquifer in the study area is generally from east to west, towards
the coast in areas north of Mount Gambier (Figure 12). To the south of Mt Gambier, flow is to the south
or southwest, with discharge occurring at the coast. The water table generally ranges between 5 m and
25 m below ground level, but is within 2 m of the ground surface adjacent the coast. A steep hydraulic
gradient zone to the north of Mount Gambier coincides with the location of the Tartwaup Fault (Fig. 12).
The exact influence of the fault on groundwater flow is complex, and not fully understood. However,
recent drilling investigations indicate that significant stratigraphic displacement occurs across the areas
where the fault structure has been mapped. Lawson et al. (2009) reported on drilling investigations
across the Tartwaup fault north-east of Mt Gambier. They found ~100m of uplift occurred in the
southern part of the transect (Figure 13). In these up-lifted sections, significant upper sub-units of the
Gambier Limestone (Green Point Member sub-units) were not present. While Figure 13 displays the
stratigraphy, it does not display the actual location of faults. However, these may be inferred from the
locations of significant displacement. For example, at approximately the 1000m mark, uplift places much
of the Camelback member (usually the most transmissive unit of the TLA) against the Greenways
member (typically a marly, less transmissive formation). Such displacement is likely to hinder regional
groundwater flow, and is likely to be the cause of the steep gradient.

DETAILED REVIEW OF CONCEPTUAL MODEL AND INPUT DATA AVAILABILITY
Department for Water | Technical Report DFW 2011/12 55 Lower South East Water Balance Project Phase 1 – Review of the conceptual model and recommendations for a Modelling Approach
Figure 13. Geological cross section showing significant aquifer displacement around confirmed fault locations
A similar ‘steep gradient’ zone is observed in the watertable along the base of the Naracoorte Ranges
(Figure 12). This steep gradient zone is associated with the Kanawinka Fault line, and is thought to be
caused by thinning of aquifer sediments on the eastern side of the fault (Lawson et al. 2009).
Love (1991) identified that a number of potential local flow systems occur in the unconfined aquifer in
the study area, and that the fact that the water table is close to and follows the topographic surface
suggests a high importance of local recharge/discharge processes within the unconfined aquifer. Brown

DETAILED REVIEW OF CONCEPTUAL MODEL AND INPUT DATA AVAILABILITY
Department for Water | Technical Report DFW 2011/12 56 Lower South East Water Balance Project Phase 1 – Review of the conceptual model and recommendations for a Modelling Approach
et al. (2001) inferred average groundwater residence times from CFC-12 values of ~30–35 yrs for
shallow groundwater (between 1.5–2 m below the water table) in the Tarpeena and Nangwarry areas.
The Gambier Limestone has an intrinsic primary permeability, with a secondary fracture permeability
occurring in many areas along structurally weak zones in the form of karstic features. In some areas,
dissolution of the limestone along the karstic features has resulted in brecciation and collapse of the
limestone near the ground surface, forming numerous sinkholes.
Porosity estimates for the unconfined aquifer range from 30% to 50% from borehole geophysics and
49% to 61% from measurements on outcrops (Andrews, 1974; Love, 1991; Lawson et al., 2009)). This
data also includes the Padthaway and Bridgewater Formations (Love, 1991). More recent estimates of
porosity from borehole geophysics are in the range of 6% to 18% for the Gambier Limestone, 5% to 20%
for the Bridgewater Formation and 20% to 30% for fractured rock (Lawson et al., 2009). Transmissivities
determined from aquifer pump tests range from 200 m2/d to >10 000 m2/d within karstic features, again
also including the Padthaway and Bridgewater Formations (Waterhouse, 1977; Stadter, 1989). However,
despite the extensive development of karst in the South East, Holmes and Waterhouse (1983)
considered that they do not form an inter-connected system and that groundwater flow is
predominantly intergranular (Love, 1991).
Mustafa and Lawson (2002) reviewed all available hydraulic data for the Gambier Limestone in the
lower South East. They found that the majority of transmissivity and specific yield values estimated for
that area were of low reliability, either due to the length of time over which the tests were carried out,
the pumping rate used, or the construction or configuration of the bores used. Of the data for the
entire lower South East, transmissivities ranging between 35 m2/day and 560 m2/day were considered
to be of medium or high reliability. The majority of these values were between 200–500 m2/day. Only
two specific yield estimates, both of 2 x 10⁻⁴, from the Millicent – Tantanoola area, were considered to
be of medium to high reliability.
As a result of their review, transmissivity values were calculated by Mustafa and Lawson (2002) from
specific capacity data using a variety of empirical relationships. It was found that, when plotted spatially
with water table contours, most low T values overlay the steep gradient zone to the north and north
west of Mount Gambier and high T values coincide with the flat gradient zone to the south of Mount
Gambier. Most of the high T values were for wells finished in the Camelback Member of the Gambier
Limestone. In the hundred of Mingbool, high T values were also associated with wells finished in the
Bridgewater Formation.
Harrington et al. (1999) estimated lateral flow in the TLA to range between 4 m/yr and 38 m/yr using
their combined MODFLOW and Compartmental Mixing Cell approach.
Based on data from previous reports and production test results, hydraulic conductivity values between
10 m/d and 300 m/d, and specific yield values between 0.1 and 0.25 were considered reasonable by
Stadter and Yan (2000) for their numerical model of the Gambier Limestone aquifer in the region to the
south of Mt Gambier. Through the model calibration process, they also found that the use of hydraulic
conductivity zones ranging between 0.5 m/d and 90 m/d and a specific yield value of 0.1 produced
optimum results.
In the original model of the Coles-Short area (Mustafa et al., 2006), two layers were used to represent
the unconfined aquifer and different hydraulic conductivity zones delineated based on existing data.
Conductivity values ranged from 15 m/d to 55 m/d, and specific yield from 0.07 to 0.15. Aquaterra
(2010) updated this model by making it a one layer model, and assigning generally higher hydraulic
conductivity values (25 m/d to 78 m/d). These increases in hydraulic conductivity were required to
adjust to other updates in the model, such as lower recharge, lower irrigation extraction, the inclusion
of evapotranspiration and refined drainage.

DETAILED REVIEW OF CONCEPTUAL MODEL AND INPUT DATA AVAILABILITY
Department for Water | Technical Report DFW 2011/12 57 Lower South East Water Balance Project Phase 1 – Review of the conceptual model and recommendations for a Modelling Approach
6.3. INPUTS TO THE UNCONFINED AQUIFER (TLA)
6.3.1. RAINFALL RECHARGE
6.3.1.1. Rainfall Recharge Under Non-Forested Areas
The dominant inflow to the unconfined aquifer in the Lower Limestone Coast (LLC) is vertical recharge
from rainfall. This occurs both as diffuse infiltration of rainfall through the unsaturated zone (diffuse
recharge), and direct recharge to the water table through sink-holes and other karst features (point
source recharge). Since the 1960s, several studies have been conducted in the South East to investigate
and quantify recharge processes using a variety of methods. The majority of these studies have focused
on areas in the Lower Limestone Coast (LLC), with an emphasis on the Border Designated Area.
Table 2 and Figure 14 summarise recharge studies in the LLC (not all study areas are displayed on Figure
14 due to spatial over-lap). Figure 15 from Brown et al. (2006) gives recharge rates for each
groundwater management area in the LLC based on some of these studies. Updated estimates were
reported in Wood (2010a) using chloride mass balance and CFC methods. However, Wood (2010a)
reported a range of recharge rates for a variety of soil type and land use combinations, with the range
reflecting the different assumptions in each method. In most cases, the ‘management area’ recharge
rates reported by Brown et al. (2006) fall within the range of those reported by Wood (2010a).
Spatially, trends in recharge are similar to those in rainfall with higher recharge rates observed in the
higher rainfall areas (in the southern part of the LLC), and lower recharge rates further north. Gibbs
(2010) analysed the relationship between rainfall and recharge in the LLC, by comparing annual
estimates of recharge based on the watertable fluctuation method with annual rainfall data. As could be
expected, a statistically significant relationship was found between rainfall and recharge for the majority
of observation wells used, especially when ‘winter’ rainfall (rainfall between April and September) was
used. However, it is well known that factors other than rainfall influence recharge rates, such as:
depth to water – with lower recharge rates in areas of greater depth to water
soil type – with higher recharge under sandy soils
land use – with reduced recharge under native vegetation and plantation forestry, and increased
recharge under irrigation

Department for Water | Technical Report DFW 2011/12 58 Lower South East Water Balance Project Phase 1 – Review of the conceptual model and recommendations for a Modelling Approach
Table 2. Recharge studies in the Lower Limestone Coast Prescribed Wells Area
Site/study Land use Methods Recharge rates (mm/y except where
specified)
Grassland hydrology (Holmes and Colville,
1970a)
Pasture Lysimeters 63
Forest hydrology, Penola and Mt Gambier
forests (Holmes and Colville, 1970b)
Softwood forest Lysimeters 0
Forest hydrology, Penola and Mt Gambier
forests (Colville and Holmes, 1972)
Softwood forest Watertable fluctuation method 19 – 73
Forest hydrology, Penola and Mt Gambier
forests (Allison and Hughes, 1972)
Softwood forest Tritium 0
Padthaway Plains (Allison and Hughes, 1975) Pasture and irrigation Tritium and mixing cell model 27
Southern regions near Mount Gambier (Allison
and Hughes, 1978)
Pasture Chloride mass balance and
tritium
70 – 270
Border zone
Bradley et al. (1995)
Pasture, forestry and native
vegetation
Watertable fluctuation method 5 – 130
Border zone lateral throughflow from Victoria
Bradley et al. (1995)
Pasture, forestry and native
vegetation
Darcy’s Law ~63 GL/y in the LLC
Plantation forestry water use (Benyon &
Doody, 2004)
Blue gum plantations, pine
plantations and pasture
Water balance ~0 mm/y (blue gum)
~0 – 80 mm/y (pine)
~180 mm/y (pasture)
Padthaway salt accession project
(Wohling et al. 2005)
Pasture, irrigation and native
vegetation
Chloride methods and water
balances
95.5 – 1450 mm/y (higher estimates are
recharge from drainage under flood
irrigation)
Bakers Range land use impacts project
(Mustafa et al. 2006)
Pasture, forestry and native
vegetation
Chloride and water balances ~200 mm/y (pasture),
8 mm/y (native vegetation) and 0 mm/y
(plantation forestry)
Review of resource condition
(Brown et al. 2006)
Pasture and forestry Watertable fluctuation method 15 – 200 mm/y
Border Zone Salt Accession Project Pasture, irrigation and native Chloride methods and 1D Mean rates =

DETAILED REVIEW OF CONCEPTUAL MODEL AND INPUT DATA AVAILABILITY
Department for Water | Technical Report DFW 2011/12 59 Lower South East Water Balance Project Phase 1 – Review of the conceptual model and recommendations for a Modelling Approach
(Wohling, 2008) vegetation models 8 mm/y (native veg)
42 mm/y (pasture)
130 mm/y (irrigation)
Land Use Impacts in Zone 3A (Harrington et al.,
in prep.)
Pasture, forestry, irrigation
and native vegetation
Chloride and CFCs Ranges =
4 – 12.5 mm/y (hardwood forestry)
0.8 – 11 mm/y (softwood forestry)
8 – 10 mm/y (native vegetation)
7 – 9 mm/y (irrigated vineyards)
9 – 18 mm/y (pasture)
National Water Initiative recharge project
(Wood 2010)
Pasture and forestry
(hardwood and softwood)
Chloride and CFCs
2 – 190 mm/y (pasture)

Department for Water | Technical Report DFW 2011/12 60 Lower South East Water Balance Project Phase 1 – Review of the conceptual model and recommendations for a Modelling Approach
Figure 14. Summary of recharge investigations in the Lower Limestone Coast (excluding Brown et al. (2006))

DETAILED REVIEW OF CONCEPTUAL MODEL AND INPUT DATA AVAILABILITY
Department for Water | Technical Report DFW 2011/12 61 Lower South East Water Balance Project Phase 1 – Review of the conceptual model and recommendations for a Modelling Approach
Figure 15. Estimates of recharge for each groundwater management area, taken from Brown et al. (2006)
6.3.1.2. Rainfall Recharge Under Plantation Forestry
Interception of rainfall recharge, referred to as a forest recharge debit (Brown et al., 2006), is one of two
mechanisms for water use by plantation forestry. Forest recharge debits are calculated using an
estimate of the total area of land covered by plantation and knowledge of the percentage of recharge
that is intercepted by the forest canopy (Brown et al., 2006). The latter is estimated to be 83% for
softwood plantations and 78% for hardwood plantations (Brown et al., 2006). The total estimated
volume of recharge intercepted by commercial plantation forestry in the LLC PWA is 199,402 ML/y. A
further 5446 ML/y is estimated to be intercepted by farm forestry.
6.3.2. LATERAL GROUNDWATER INFLOW Cross-border groundwater flow from Victoria to South Australia occurs in all areas where the
groundwater flow gradient is east to west (all areas along the South Australian-Victorian border except
the management areas Zone 1A and Zone 2A). Lateral throughflow may be estimated using Darcy’s Law:
Q = KAI
Where: Q = volume of lateral inflow from Victoria (m3/yr)
K = hydraulic conductivity of the aquifer (m/yr)
A = area along the border where throughflow may occur (m2)
I = hydraulic gradient (the difference in watertable elevation between Victoria and South
Australia) (m/m).

DETAILED REVIEW OF CONCEPTUAL MODEL AND INPUT DATA AVAILABILITY
Department for Water | Technical Report DFW 2011/12 62 Lower South East Water Balance Project Phase 1 – Review of the conceptual model and recommendations for a Modelling Approach
Bradley et al. (1995) estimated throughflow to range from 6500 ML/y in Zone 6A, to 33,150 ML/y in
Zone 3A, and totalling 66,545 ML/y in the LLC.
It should be noted that these estimates were made in 1995, and are based on watertable gradients at
that time. Many observation wells in the Border Zone have shown declining groundwater levels over the
past 5 to 10 years, which may have influenced the watertable gradient across the Border. Therefore
updated throughflow estimates could be provided, using the same assumptions as Bradley et al. (1995)
about aquifer transmissivity. Groundwater inflow to the regional model domain can be estimated in the
same way once the eastern boundary of the model domain is finalized.
6.3.3. UPWARD LEAKAGE
In all areas to the south west of the ZHD line (Figure 12), the confined aquifer has a higher hydraulic
head than the unconfined aquifer and as a result, upward leakage between the two aquifers is possible
throughout that region. Post-depositional faulting has resulted in the potential for hydraulic connection
between the unconfined and confined aquifers (Lawson et al., 1993; Lawson et al., 2009). The
occurrence and magnitude of upward leakage is unknown, however the map of fault locations (Fig. 10)
provides an initial indication of potential locations if leakage is fault-related.
At the ZHD line the quantities of inter aquifer leakage are unknown, however it is possible that leakage
may be occurring in either direction.
As described in Section 6.2.3.2, there is unconfirmed evidence for upward leakage via preferential flow
through the 300 m thick aquitard at observation well GAM28, in the south-eastern corner of the study
area.
6.3.4. DRAINAGE OF STORMWATER
Drainage of stormwater occurs via a network of drainage wells located predominantly to the north of
the Blue Lake in the vicinity of Mount Gambier. These drainage wells drain ponded surface water to the
unconfined aquifer to prevent waterlogging at the surface. It is estimated that there are ~350
operational drainage wells throughout the city (Lawson et al., 1993), however a number of these may
have been abandoned or backfilled.
Past findings by Emmett (1995) have estimated that ~2 800 ML of stormwater discharges to the
unconfined aquifers annually. This approximation was based on estimates of rainfall and paved area
over Mount Gambier. However, due to vast expansion of the city over recent years, the estimated
amount of stormwater reaching the unconfined aquifer per year has been revised to about 3 200 ML (J.
Lawson, DWLBC, Pers. Comm., 2006).
6.3.5. IRRIGATION DRAINAGE
Irrigation drainage refers to the volume of irrigation water that is surplus to crop water requirements
and is therefore returned to the aquifer. The Volumetric Conversion Project (VCP) has demonstrated this
process to be most significant beneath flood irrigation (Latcham et al., 2007). Drainage below flood
irrigation is a highly variable parameter, depending on a range of factors such as volumes of water
applied and the irrigation regime, climatic conditions, configuration of flood bays, crop type and soil
type. It is therefore very difficult to spatially extrapolate the results of field investigations, of which
there are very few in the South East. However, irrigation drainage is a fairly small component of the
water balance of the LLC PWA and hence could be represented fairly approximately in a regional scale
water balance model. Nevertheless, the local effects of irrigation drainage on water tables and

DETAILED REVIEW OF CONCEPTUAL MODEL AND INPUT DATA AVAILABILITY
Department for Water | Technical Report DFW 2011/12 63 Lower South East Water Balance Project Phase 1 – Review of the conceptual model and recommendations for a Modelling Approach
groundwater salinities can be substantial and this may need to be taken into consideration in local-scale
models.
Latcham et al. (2007) estimated volumes of deep drainage for individual management areas of the
South East, based on volumes of groundwater extracted for flood irrigation and estimates of
evaporation from flood bays and of crop water use. For the LLC, this is 60 GL/y. These estimates
assume application of the full (100%) allocations and can be corrected (again, for individual
management areas) for estimates of actual use of allocations given by Hodge (2009). This gives a total
of 23 GL/y for the LLC PWA (Wood, 2010b). Such data is available on a management area scale for only
the past couple of irrigation seasons, since metering was implemented. If necessary, digitising historical
aerial photos may provide a means for adjusting historical values of irrigation drainage as well as
groundwater extraction, with a number of assumptions.
6.3.6. SURFACE WATER INFLOW As mentioned earlier, three main creeks flow into the Lower Limestone Coast – Naracoorte Creek,
Mosquito Creek and Morambro Creek. All creeks are ephemeral and are highly dependent upon
seasonal (winter) rainfall to generate flows. However, Paydar et al. (2009) estimate a mean annual
inflow from these creeks of ~15 GL/y based on long term flow records.
6.3.7. RAINFALL ON SURFACE WATER BODIES Paydar et al. (2009) estimated the volume of rainfall that falls on surface water bodies in the LLC, based
on average regional rainfall from the BoM 1961-1990 reference period, to be 309,000 ML/y. Rainfall on
land surface is not included as an input in this exercise, as it is accounted for (along with
evapotranspiration of any rainfall) in estimates of groundwater recharge.
6.4. OUTPUTS FROM THE UNCONFINED AQUIFER (TLA)
6.4.1. GROUNDWATER EXTRACTION Figure 16 shows that groundwater use in the LLC, use can be separated into four main categories:
irrigation, stock and domestic use, plantation forestry use and other uses (public water supply,
aquaculture, industrial and recreational). Groundwater extraction for irrigation, industry, recreational
use, aquaculture and public water supply is licensed in the LLC. Currently, all licensed groundwater users
are required to have meters installed on pumping wells, so that accurate data on groundwater use may
be recorded. However metering was only implemented in 2002, and metered data has only been
collected since 2007. Metered extraction figures (and in the past, areas of land irrigated) are reported by
licensees to the Department for Water on a yearly basis through Annual Water Use Returns (AWURs).
While there is the possibility for incorrect figures to be reported (due to meter failures, non-compliance
etc), the DFW does conduct its own meter reading programs for compliance purposes, and has reported
95% accuracy in licensee provided meter reads in the past (D. Laslett, pers comm.).

DETAILED REVIEW OF CONCEPTUAL MODEL AND INPUT DATA AVAILABILITY
Department for Water | Technical Report DFW 2011/12 64 Lower South East Water Balance Project Phase 1 – Review of the conceptual model and recommendations for a Modelling Approach
Figure 16. Groundwater use in the LLC PWA in 2008-09
6.4.1.1. Irrigation
Prior to the collection of metered data, irrigation water use figures (the dominant component of
licensed water use) in the LLC were based on estimates of the area of land irrigated and theoretical crop
water requirement relationships. Figure 17 gives an indication of trends in extraction for irrigation since
2001-02.
Figure 17. Irrigation use in the Lower Limestone Coast Prescribed Wells Area (based on estimates from 2001-
2007, and metered data from 2007-2009)
Prior to 1998, estimates of groundwater use only exist for irrigation, and only for the management
zones within the Border Designated Area (the Comaum-Caroline Prescribed Wells Area and the
Naracoorte Ranges Prescribed Wells Area (Figure 18). The lack of historical water use in the old

DETAILED REVIEW OF CONCEPTUAL MODEL AND INPUT DATA AVAILABILITY
Department for Water | Technical Report DFW 2011/12 65 Lower South East Water Balance Project Phase 1 – Review of the conceptual model and recommendations for a Modelling Approach
Lacepede-Kongorong PWA relates to fact that the groundwater resources were only prescribed there in
1997. Data is also not available for 1999/2000 and 2000/2001. Figure 19 shows variations in
groundwater extraction by the “other” users between 2004 and 2009.
Figure 18. Historical estimates of groundwater use for irrigation in the Lower Limestone Coast (data not
available for 2000–01)
Figure 19. Groundwater extraction by users other than the irrigation industry in the LLC PWA
Data from licensed meters and meter readings in the LLC is administered by the DFW in Mount Gambier.
Currently, data may be retrieved either directly through internally held databases, or through the South
East Meter Data Management System (SEMDMS). The SEMDMS is a graphical user interface that allows
users to retrieve licensee information and meter details, display them spatially, and in many cases link
groundwater meters to groundwater extraction wells (providing important information on the depth in
the aquifer from which groundwater is being extracted).
In summary, metered groundwater extraction data only currently exists for the 2008-09 irrigation
season. Metered data will continue to be collected into the future, however it cannot be captured
retrospectively. Therefore historic groundwater extraction data is only available as estimates of use

DETAILED REVIEW OF CONCEPTUAL MODEL AND INPUT DATA AVAILABILITY
Department for Water | Technical Report DFW 2011/12 66 Lower South East Water Balance Project Phase 1 – Review of the conceptual model and recommendations for a Modelling Approach
(based on areas irrigated and theoretical crop water requirements) and the level of detailed information
on estimates of use decreases with time, with no records of use in the Lacepede-Kongorong area prior
to 1997. Digitisation of aerial photography from historical records may provide some basis for
estimating historical water use. Metered data where it is currently available can be accessed through
the SEMDMS.
6.4.1.2. Stock and domestic use and public water supply
Extraction of groundwater for stock and domestic purposes is neither licensed nor metered in the Lower
Limestone Coast. Currently, estimates of extraction for stock use are based on Australian Bureau of
Statistics stock numbers for the 1996-97 season, as well as NSW Department of Agriculture figures on
daily stock consumption (Cobb and Brown, 2000). No specific data exists on domestic groundwater use
in the Lower Limestone Coast, hence figures reported are purely estimates. Previous groundwater
models have generally not incorporated stock and domestic use. This is because there are few reliable
estimates of this groundwater use and it has always been considered an insignificant part of the water
balance for modelling purposes. Current estimates are based on 1996-97 ABS data, and amount to
16,554 ML in the LLC (<2% of total use).
With the exception of the Keith township in the Upper South East, all public water supply is taken from
groundwater. Public water supply (town supply) is metered by SA Water, hence use figures can be
considered accurate. Table 3 shows public water supply data from the 2008-09 year (Hodge, 2009).
Table 3. Town water supply volumes in the Lower Limestone Coast (* indicates Confined Aquifer management
area)
Town Aquifer accessed Allocation (ML/y)
Beachport Confined 180
Kalangadoo Confined 50
Kingston SE Confined 560
Lucindale Confined 100
Millicent Unconfined 580
Mount Burr Unconfined 130
Mount Gambier Blue Lake 4000
Nangwarry Unconfined 120
Naracoorte Confined 800
Padthaway Unconfined 20
Penola Unconfined and confined Unconfined = 170; Confined = 100
Pt Macdonnell Confined 110
Robe Confined 550
Tarpeena Confined 60
6.4.1.3. Plantation forestry water use
Plantation forestry has been an acknowledged part of the groundwater cycle in the LLC since the earliest
recharge investigations in the region (Colville and Holmes, 1970). More recent studies have focused on
quantifying the forestry component of the water balance. Benyon and Doody (2004) investigated
plantation forestry water use in the LLC, and reported groundwater use by plantations at eight out of

DETAILED REVIEW OF CONCEPTUAL MODEL AND INPUT DATA AVAILABILITY
Department for Water | Technical Report DFW 2011/12 67 Lower South East Water Balance Project Phase 1 – Review of the conceptual model and recommendations for a Modelling Approach
nine research sites. They reported a mean annual extraction rate of 4.35 ML/ha/y for all sites (ranging
from 1.08 ML/ha/y to 6.70 ML/ha/y).
For management purposes, the use of groundwater by plantation forests is considered to be 1.66
ML/ha/y for softwood plantations (radiata pine) and 1.82 ML/ha/y for hardwood plantations
(Tasmanian blue gum), and, also for management purposes, groundwater extraction by forestry is only
considered to occur in areas where the watertable is within 6m of the ground surface (Latcham et al.,
2007). However, forest extraction has been observed to occur from water tables as deep as 8.9 m
(Benyon et al., 2006) and current monitoring data suggests that the depth constraint may be site
specific. The groundwater model of the Coles-Short hotspot area showed that the onset of direct
extraction by forests had a more significant impact on groundwater levels than recharge interception
and that this process is undoubtedly the cause of water table declines in that region (Aquaterra, 2010).
For this reason, a better understanding of the spatial and temporal variation in this process is required
to properly simulate groundwater levels in forested areas.
It is anticipated that there will be projects commencing in the near future that will seek to better
quantify plantation water use at different spatial and temporal scales.
6.4.2. DOWNWARD LEAKAGE
There is potential for downward leakage of groundwater from the unconfined aquifer to the confined
aquifer in the area to the north of the ZHD line shown in Figure 12. However, the spatial distribution and
magnitude of this process is poorly understood. Downward leakage to the north of the ZHD line is
supported by variations in groundwater chloride concentration observed in the confined aquifer, up to
the ZHD line, which were attributed by Love (1991) to recharge inputs via downward leakage along the
flow path. Brown et al. (2001) suggest that the area over which downward leakage occurs may be much
smaller than that indicated by a downward hydraulic head gradient and the mechanism is probably via
preferential flow along cracks, faults or sinkholes rather than matrix flow. In particular, this applies to
the region known to be a confined aquifer recharge zone, located in the Nangwarry / Tarpeena area,
identified by the observation of relatively high confined aquifer groundwater 14C activities (>40 pmC)
(Brown et al., 2001). In this area, there is a groundwater mound in the confined aquifer and a sink in the
unconfined aquifer, accompanying a downward hydraulic gradient across the Upper Tertiary Aquitard.
Some additional geochemical evidence for such leakage occurs in this region. For example, confined
aquifer observation well Tarpeena Town Water Supply no.2, have both uranium concentrations and
atomic ratios similar to that of the unconfined aquifer, indicating downward leakage to the confined
aquifer at this location (Love, 1991). Much of the inferred recharge area is now covered in forest
plantations, which are likely to limit recharge to both the unconfined and confined aquifers in this
region. A relatively high confined aquifer groundwater 14C activity also occurs adjacent the Tartwaup
Fault to the northwest of the study area, possibly indicating preferential recharge along the fault (Brown
et al., 2001).
It is currently unknown whether any additional downward leakage occurs within the study area,
particularly in the region to the north of the ZHD line. Love (1991) found that the 13C signature of
confined aquifer groundwater was constant between the ZHD line and the coast, suggesting little
downward leakage from the unconfined aquifer to the confined aquifer, as expected due to the upward
hydraulic potential that occurs in that region.
6.4.3. EVAPOTRANSPIRATION (ET)
For the purpose of this project, evapotranspiration (ET) of rainfall prior to recharge is incorporated into
estimates of groundwater recharge. However, it is widely regarded that groundwater may be lost

DETAILED REVIEW OF CONCEPTUAL MODEL AND INPUT DATA AVAILABILITY
Department for Water | Technical Report DFW 2011/12 68 Lower South East Water Balance Project Phase 1 – Review of the conceptual model and recommendations for a Modelling Approach
directly to evapotranspiration in areas where the watertable is relatively shallow (generally <2m deep).
Paydar et al (2009) investigated the importance of this process under dryland agriculture (the dominant
land use) in the South East using SWAGMAN, a 1-D soil/crop/water use model. Over the area covered by
dryland agriculture with a shallow watertable (~17000 ha), Paydar et al. estimated evaporation rates of
69 mm/y for 0.5 m water tables, 23 mm/y for 1 m water tables and 0 mm/y for 2 m water tables. This
resulted in 7 000 ML/y being lost to evaporation by capillary upflow from shallow water tables in the
Lower Limestone Coast region.
Previous numerical models developed for the South East have implemented ET in a variety of ways. ET
In their model of the area to the south of Mount Gambier, Stadter and Yan (2000) used values derived
from Waterhouse (1977), with averages for the summer irrigation period of October to March and the
winter period of April to September being 560 mm and 210 mm respectively. Aquaterra (2008)
implemented ET in their model of the Padthaway area at a rate of 500mm/y, and with an extinction
depth of 2m. When implemented by the MODFLOW ‘Evapotranspiration’ package, this means that ET
can only occur in areas where the watertable is within 2m of the surface. The maximum ET rate (500
mm/y) only applies at the surface, and decreases to 0 mm/y at the 2m extinction depth.
Outcomes from the recently completed Diffuse Impacts Project”, a joint project between SARDI, Flinders
University and DFW, include modelled maps (modelled using the unsaturated zone model LEACHM
coupled with GIS) of evapotranspiration, as well as recharge, which may be of use to this study.
Evapotranspiration may occur from the areas covered by surface water, such as coastal lakes, swamps
and wetlands. Paydar et al. (2009) used average potential evapotranspiration data from the 1961-1990
BoM reference period to estimate ET losses from the area covered by surface water bodies, and
reported ~770 000 ML/y is lost via this process for the Lower Limestone Coast region.
6.4.4. SURFACE WATER – GROUNDWATER INTERACTIONS AROUND WETLANDS Given the generally shallow depth to groundwater, it is widely acknowledged that groundwater and
surface water systems throughout much of the South East are intrinsically connected. Investigations at
a number of sites have provided an improved understanding of these processes. Fass and Cook (2006)
measured chloride and radon-222 concentrations in 37 wetlands in the Lower South East, and used
simple mass balance models to determine the level of groundwater dependence. They found that a
majority of the wetlands surveyed had a moderate to high dependence on groundwater (Fig. 20).
However these results were usually based on one measurement of radon-222 and chloride in each
wetland, and hence considered preliminary.

DETAILED REVIEW OF CONCEPTUAL MODEL AND INPUT DATA AVAILABILITY
Department for Water | Technical Report DFW 2011/12 69 Lower South East Water Balance Project Phase 1 – Review of the conceptual model and recommendations for a Modelling Approach
Figure 20. Ratio of groundwater inflow (Ig) to surface water inflow (Is) for wetlands assessed by Fass and Cook
(2006). Relatively high values of Ig/Is suggest higher groundwater dependence
Cook et al. (2008) conducted more a more detailed investigation at a wetland located in Honans Scrub,
~12km north-west of Mt. Gambier. Radon-222 concentrations were measured in the wetland on
multiple occasions in 2006, and used to construct a steady state and a transient model of groundwater
discharge to the wetland, which was estimated to vary between 12 – 18 m3/day.
Wood (2010a) used a variety of hydrochemical tracers to investigate groundwater discharge processes
at a number of springs in the Lower South East, including Ewens Ponds and Piccaninnie Ponds. It was
found that flow out of Ewens Ponds was dominated by discharge from the third pond, which has a
higher salinity than spring discharge from the first two ponds, and a chemical signature that suggested
discharge from one of the deeper sub-units of the unconfined aquifer. Results from Piccaninnie Ponds
showed groundwater discharge occurred primarily in a deep karstic feature referred to as ‘The Chasm.’
Discharge was inferred to occur via seepage from the entire ‘open’ section of limestone aquifer, with
higher discharge occurring at the interface between aquifer sub-units (where fracturing is thought to
have an influence on transmissivity and flow).
SKM (2009) looked at the regional extent of surface water-groundwater interactions in the South East,
by examining the relationship between the surface elevation of surveyed water bodies (determined
from a high resolution DEM) and seasonal watertable elevations. They reported that 45% of wetlands
had a high to very high potential for surface water-groundwater interaction, with the majority of these
likely to be gaining systems (i.e. groundwater discharging to surface water).
Harding (2010) summarised all these studies in a recent assessment of the potential groundwater
dependence of surface water bodies in South Australia. Figure 21 displays the results of this study for
the LLC. This showed that the majority of surface water bodies are potentially groundwater dependent.
The exceptions are wetlands located in the Naracoorte Ranges and Mt Burr areas, where the higher
elevation (and greater depth to water) means they are unlikely to have any connection to or reliance
upon the unconfined aquifer.

DETAILED REVIEW OF CONCEPTUAL MODEL AND INPUT DATA AVAILABILITY
Department for Water | Technical Report DFW 2011/12 70 Lower South East Water Balance Project Phase 1 – Review of the conceptual model and recommendations for a Modelling Approach
Figure 21. Potential groundwater dependent ecosystems in the South East
6.4.5. GROUNDWATER DISCHARGE AT THE COAST
DETAILED REVIEW OF CONCEPTUAL MODEL AND INPUT DATA AVAILABILITY
Department for Water | Technical Report DFW 2011/12 71 Lower South East Water Balance Project Phase 1 – Review of the conceptual model and recommendations for a Modelling Approach
There are significant coastal spring discharges at Eight Mile Creek, Deep Creek and Piccaninnie Ponds,
with the total spring discharge estimated to be 160 000 ML/yr by Waterhouse (1977). This discharge is
considered to be due to karstic flow within the Gambier Limestone. Monitoring of the springs from
1970–2000 yielded an estimate of average annual flow of 110 000 ML (Stadter & Yan, 2000). However,
subsequent monitoring indicates discharge from Picanninnie ponds, Ewens Ponds, Deep Creek and Eight
Mile Creek to be ~98 000 ML/yr over the past ten years. These measurements are expected to represent
a fraction of the groundwater discharging at the coast, as discharge can be expected to occur as seeps
and springs along the whole coastline from the South Australia/Victoria border to the Coorong.
However, the occurrence and magnitude of this and any groundwater discharge via offshore seepage is
currently unknown.
6.4.6. SURFACE WATER OUTFLOWS Constructed drains, other than those fed by groundwater springs, are typically referred to as surface
water drains. However, surface water-groundwater interactions in the South East are complex and not
fully understood and, in reality, many of these receive groundwater discharge. For example, Stace and
Murdoch (2003) estimated up to 75% of surface water flow may be derived from baseflow.
Paydar (2009) summarised all surface water drainage data for the South East, including estimates of
flow at ungauged sites, and reported that 106 000 ML/y of surface water drainage in the South East
discharges to the coast.
6.5. INPUTS TO THE CONFINED AQUIFER
6.5.1. RECHARGE (DOWNWARD LEAKAGE) The only known outcrop of the Dilwyn Formation in South Australia occurs on an undulating erosional surface 10 km to the north west of Mt Gambier (Waterhouse, 1977). To the east, in Victoria, there are minor outcrops along the Glenelg River. Because of the limited outcrop of this aquifer, recharge is considered to occur predominantly via downward leakage through the unconfined aquifer and confining beds (Love, 1991). This process was described in detail in Section 6.4.2.
6.6. CONFINED AQUIFER OUTPUTS
6.6.1. GROUNDWATER EXTRACTION The majority of groundwater extraction for irrigation, stock and domestic use in the LLC is from the
unconfined aquifer. However the confined aquifer is still an important source of water for town supply
in various towns in the LLC (Penola, Naracoorte, Lucindale, Robe, Port MacDonnell, Beachport,
Kalangadoo, Tarpeena). It is also the emergency back-up water supply for Mount Gambier. Irrigation use
from the confined aquifer is sparse across much of the LLC. Total use from the confined aquifer is
estimated to be around 21,289 ML/y, ~70% of which is concentrated in an area where the aquifer is
artesian, to the east of Kingston (Hodge, 2009).
6.6.2. OFFSHORE DISCHARGE Upward discharge from the confined aquifer to the Gambier Limestone has been postulated to occur offshore, but no direct evidence of this exists (Blake, 1980). As it occurs beyond the boundary of the study area, any such discharge is not considered to be relevant to the conceptual model.

Department for Water | Technical Report DFW 2011/12 72 Lower South East Water Balance Project Phase 1 – Review of the conceptual model and recommendations for a Modelling Approach
7. STATUS OF THE CONCEPTUAL MODEL: KNOWLEDGE GAPS AND LIMITATIONS IDENTIFIED THROUGH PHASE 1
The review of the conceptual model has identified that a great deal of knowledge and data exists for the
Lower South East, upon which a conceptual model of the hydrologic system can be based. However, it is
a complex system, both in terms of the hydrostratigraphy and its history of human development. The
Technical Workshop (Section 5) gathered the opinions of a cross-section of people with experience
working in the region. Despite the high level of information that clearly exists for the South East in
comparison to other regions, there was an overwhelming feeling that there is still a need to develop
good representations of spatial and temporal variations in:
Land use
Recharge
Evapotranspiration
Groundwater interactions with drains
Forestry impacts
Groundwater extraction.
Surface water – groundwater interactions.
Interactions between the confined and unconfined aquifers.
These areas are fairly broad, as is reflected in the fact that there are currently difficulties in developing a
well-defined research program for the region. Based on the review of the conceptual model presented
above, the discussions at the technical workshop and experience in other modelling projects in the
region, the project team has developed a list of the knowledge gaps relevant to the outcomes of both a
regional (Lower South East) numerical water balance model and local-scale models (Table 4). These
have been prioritised in terms of the impacts of these knowledge gaps on the outcomes of regional and
local-scale numerical models. This list is preliminary and the numerical modelling in Phase 2 of this
project will help to (a) test their relative importance to the outcomes of numerical models and, (b) in
many cases, determine the locations where these knowledge gaps really require further investigation.

Department for Water | Technical Report DFW 2011/12 73 Lower South East Water Balance Project Phase 1 – Review of the conceptual model and recommendations for a Modelling Approach
Table 4. Prioritised list of knowledge gaps in the conceptual model of the groundwater system in the Lower South East
Knowledge Gap Area of Influence Current Level of Understanding (G=Good, M=Moderate, P=Poor)
Impact on Regional or Local Models
Influence on Model Outcomes
Mitigation Strategy
Priority Area of Investigation (based on current level of knowledge and impact on numerical model outcomes)?
Regional Local
1. Groundwater flow around numerous faults in the region (i.e. impacts of faults on aquifer geometry, properties and preferential vertical flow).
Faulting occurs
throughout the
Lower South East
P M H Inability to
accurately model
steep gradient
zones around
faults, and
accurately model
water balances
due to losses/gains
through vertical
leakage.
Use NWI fault
mapping study to
inform possible
location of ‘low K’
zones to simulate
steep gradients
around faults, and
identify areas where
losses/gains maybe
occurring through
vertical leakage.
1
2. Occurrence and magnitude of vertical leakage between unconfined and confined aquifers.
Entire model
domain – south of
ZHD for upward
leakage and north
of ZHD for
downward leakage.
P H H Inability to
calibrate around
areas where
vertical leakage is
of significance.
Fault mapping may
be able to help
understand reasons
for non-calibration.
1
3. Spatial variability of aquifer properties
Unconfined aquifer
– whole South East M L M If conduits or other
high conductivity
If there are areas
where modelled 3

STATUS OF THE CONCEPTUAL MODEL: KNOWLEDGE GAPS AND LIMITATIONS IDENTIFIED THROUGH PHASE 1
Department for Water | Technical Report DFW 2011/12 74 Lower South East Water Balance Project Phase 1 – Review of the conceptual model and recommendations for a Modelling Approach
and the role of karstic features in GW flow.
karst features are
present, and not
included the model
(i.e. a lower
regional
conductivity value
is used), this can
result in modelled
groundwater levels
being too high.
If preferential flow
occurs along
conduits, this
would have a large
impact on
outcomes of any
solute transport
modelling
undertaken.
heads are too high,
use knowledge of
location of karst
features (caves,
runaway holes etc)
from NWI
catchment data set,
as well as drillhole
records and
historical pump test
data to assess
whether karst
features are likely to
be present. If they
are and are
considered crucial
to calibration, then
potentially
incorporate ‘high K’
zones into the
model domain.
4. Historical groundwater extraction data
Mainly the intensely
irrigated areas. M M M Inability to
properly calibrate
transient model to
pre-2000 water
levels results in
reduced
confidence in
model’s predictive
capability.
Use well
construction records
and digitise aerial
photos (prior to
2000) to construct a
groundwater
extraction history.
2
5. Land use prior to Mainly the areas of M M M Inability to Digitise aerial 2

STATUS OF THE CONCEPTUAL MODEL: KNOWLEDGE GAPS AND LIMITATIONS IDENTIFIED THROUGH PHASE 1
Department for Water | Technical Report DFW 2011/12 75 Lower South East Water Balance Project Phase 1 – Review of the conceptual model and recommendations for a Modelling Approach
2000 beyond the domains of the Coonawarra (Zone 3A) and WR2010 (Coles-Short) models (relevant to knowledge of temporal variations in recharge, irrigation drainage and forestry impacts).
forestry and intense
irrigation
development.
properly calibrate
transient model to
pre-2000 water
levels results in
reduced
confidence in
model’s predictive
capability.
photos to provide
basic information on
temporal land use
changes. Anecdotal
evidence.
6. Spatial and temporal variability in historical groundwater recharge.
Whole region M H H Large impacts on
water balance and
on modelled
regional and local
flow systems.
Compared to other
regions, there is a
lot of data available
and point
measurements of
recharge can be
scaled up using
knowledge of soil
type, depth to water
and land use.
Simple methods can
be used with rainfall
data to generate
temporally varying
recharge. These
methods have not
been verified but
comparison
between model
outputs and
hydrographs
2

STATUS OF THE CONCEPTUAL MODEL: KNOWLEDGE GAPS AND LIMITATIONS IDENTIFIED THROUGH PHASE 1
Department for Water | Technical Report DFW 2011/12 76 Lower South East Water Balance Project Phase 1 – Review of the conceptual model and recommendations for a Modelling Approach
displaying only
impacts of recharge
variability can be
used to assess the
methodology.
7. Spatial and temporal variability in future groundwater recharge.
Whole region. M H H Large impacts on
predicted water
balance and on
modelled regional
and local flow
systems.
The DFW project
‘Impacts of Climate
Change on Water
Resources’ will
produce
unsaturated zone
recharge models for
the South East
region, showing the
projected changes
in recharge as a
result of climate
change, which could
be incorporated into
the regional model.
2
8. Spatial and temporal variability of SW-GW interactions around drains.
Shallow watertable
areas (DTW<2-5m)
around drains.
P M H If drains are
modelled with a
MODFLOW Drains
package (or similar
package), drain
flows may be too
high or low
(depending on
type of
interaction).
Impacts on local
Calibrate drain flows
to measured flows,
and alter drain
conductance value
to achieve adequate
model fit.
1

STATUS OF THE CONCEPTUAL MODEL: KNOWLEDGE GAPS AND LIMITATIONS IDENTIFIED THROUGH PHASE 1
Department for Water | Technical Report DFW 2011/12 77 Lower South East Water Balance Project Phase 1 – Review of the conceptual model and recommendations for a Modelling Approach
heads and
groundwater flow
directions. Poor
confidence in
model results.
9. SW-GW Interactions around wetlands.
Refer to map of
potential
groundwater
dependence in main
report – generally
shallow watertable
areas (i.e DTW<2-
5m) where wetlands
are present.
P L M Local calibration
problems. Lack of
confidence in
ability to model
local scale
processes around
wetlands. Inability
to interpret model
results in terms of
wetland health.
If the DEM is used
as the top elevation
in the model, and
wetlands modelled
using a MODFLOW
Lakes package, it
may be possible to
asses those that fill
from groundwater
and those that
don’t. This may
significantly add to
understanding of
SW-GW interactions
at a regional scale,
and build upon the
DTW/GW
dependence
mapping done
earlier (SKM, 2009).
However, model
outputs require
groundtruthing to
provide confidence.
2
10. Evapotranspiration from shallow water
Large portions of
the Lower South P H H Significant
uncertainty in
Access results of
Diffuse Impacts 1

STATUS OF THE CONCEPTUAL MODEL: KNOWLEDGE GAPS AND LIMITATIONS IDENTIFIED THROUGH PHASE 1
Department for Water | Technical Report DFW 2011/12 78 Lower South East Water Balance Project Phase 1 – Review of the conceptual model and recommendations for a Modelling Approach
tables – Lack of field measurements.
East, where water
tables are < 2 m
deep. Large
component of water
balance so has
wide-reaching
(regional) effects.
water balance. project, which
modelled
unsaturated zone
fluxes across the
whole lower South
East. Adopt broad
average rates based
on these results and
assess through
calibration and
sensitivity analysis.
11. Spatial and temporal variability in direct extraction of groundwater by forest plantations.
Areas affected by
current and future
forest plantations.
M L H Localised effects
on simulated water
tables around
forestry. Inability
to effectively
interpret model
results in terms of
impacts of
plantation forestry
on groundwater
dependent assets.
Use existing agreed
values, information
from the forestry
industry, consider
methodology from
WR2010 (Coles-
Short) model and/or
assess model
performance
around these areas.
1-2
12. Quantification of deep drainage of irrigation water under flood irrigation.
Local areas around
flood irrigation. P L M Localised
calibration issues.
Small component
of regional water
balance so small
impact on regional
model outcomes.
Use measured
values from
Padthaway Salt
Accession and
Volumetric
Conversion Projects.
Assess model results
around these areas.
3

STATUS OF THE CONCEPTUAL MODEL: KNOWLEDGE GAPS AND LIMITATIONS IDENTIFIED THROUGH PHASE 1
Department for Water | Technical Report DFW 2011/12 79 Lower South East Water Balance Project Phase 1 – Review of the conceptual model and recommendations for a Modelling Approach
13. Coastal and Offshore Groundwater Discharge (includes understanding of seawater intrusion).
Coastal margins and
coastal aquifer
areas. Large
component of
regional water
balance so has
wide-reaching
effects.
P M H Again, a significant
uncertainty in the
water balance,
over estimation of
which may lead to
poor decision
support ability in
coastal areas (i.e.
may lead to over-
exploitation in
coastal areas, and
enhance seawater
intrusion).
Assessment of
model results. 1-2

Department for Water | Technical Report DFW 2011/12 80 Lower South East Water Balance Project Phase 1 – Review of the conceptual model and recommendations for a Modelling Approach
8. PROPOSED OVERALL (LONG-TERM) MODELLING APPROACH
8.1. BACKGROUND
Phase 1 of the Establishing Total Water Balance for Water Planning in the (Lower) South East Project has
involved:
Consultation with key stakeholders to understand the policy issues and framework into which
numerical models should provide input and determine the model objectives (see Section 3 of
this report).
Review of available data and knowledge of the hydrologic system in the Lower South East
Consultation with technical experts for guidance on a broad modelling approach that addresses
the management needs of the region.
Based on this extensive consultation and review process, the following general issues / needs for a
future modelling strategy for the region have been highlighted:
Three-dimensional numerical groundwater flow models are essential to underpin the
management of groundwater resources in the Lower South East through testing of our
understanding of the resource and simulation of outcomes of proposed management scenarios.
Previous approaches to groundwater modelling have focused on specific issues and have not
been coordinated in any way. As a result, a number of models exist in various stages of
development, with varied objectives and hence varied input data and conceptual models. The
outputs of such models are not necessarily comparable or relevant for addressing the
management questions that have been identified through this project.
A suite of numerical models is required, with consistent conceptual models and input data,
designed to address at both regional and local scales specific management questions / issues
important to the WAP process. Such a product should be able to identify emerging and likely
risks through simulation of specific climate and management scenarios.
There is a preference amongst a number of stakeholders to move towards a fully-coupled
surface water – groundwater modelling approach. However, the specific objectives of such an
exercise, the data / knowledge requirements and hence feasibility (cost/benefit) of such an
exercise have not been explored.
There is an urgent need for a tool to assist with identifying and prioritising the research / data
needs that are critical to water resources management in the (Lower) South East and to provide
a link between current and proposed management scenarios and observed / modelled
ecosystem responses.

PROPOSED OVERALL (LONG TERM) MODELLING APPROACH
Department for Water | Technical Report DFW 2011/12 81 Lower South East Water Balance Project Phase 1 – Review of the conceptual model and recommendations for a Modelling Approach
8.2. THREE-STEP MODELLING APPROACH
In consultation with the Technical Reference Group, the following three-step modelling approach has
been developed to address the objectives identified through the stakeholder consultation and support
the WAP process: 1. Construct a regional three-dimensional numerical model (current project), with a domain
targeting the Lower Limestone Coast Prescribed Wells Area but otherwise governed by
aquifer extents where possible, with the following objectives:
Identify and prioritise critical knowledge / data gaps at a regional scale.
Assess / improve our knowledge of the regional water balance, including recharge,
groundwater extraction, groundwater inflows from Victoria and outflows at the coast.
Quantify available water (surface water and groundwater) at a regional scale.
Provide first-pass assessments of current allocation approach – e.g. what are the
implications at a regional scale of allocating 90% of recharge?
Provide broad-scale information on likely locations and types of surface water - groundwater
interactions and identify those groundwater dependent ecosystems (GDEs) likely to be
impacted by up-stream activities.
Identify areas of interaction between the confined/unconfined aquifers or areas where this
is likely, but requires further investigation.
Assist stakeholders with visualising the system and provide an educational tool.
Provide a basis / boundary conditions for more detailed localised models and
recommendations for a consistent modelling approach for these models (i.e.
recommendations for step 2).
The broad details of the proposed regional water balance model, based on the detailed review
of the conceptual model and the outcomes of consultation with the Technical Reference Group,
have been provided in Section 8 of this report.
2. Develop a consistent framework for numerical groundwater flow modelling in the (Lower)
South East, including:
The regional numerical model to provide boundary conditions and regional conceptual
framework for smaller scale models (step 1).
Documentation of the possible approaches for translating the conceptual model into
numerical models, i.e. approaches for representing key processes, e.g. historical recharge,
groundwater extraction, evapotranspiration (ET), forestry impacts, surface water –
groundwater interactions, etc, including their benefits and limitations to different modelling
applications.

PROPOSED OVERALL (LONG TERM) MODELLING APPROACH
Department for Water | Technical Report DFW 2011/12 82 Lower South East Water Balance Project Phase 1 – Review of the conceptual model and recommendations for a Modelling Approach
A clear set of objectives for a suite of local-scale “hotspot” numerical models to be
developed specifically to support the WAP. It is important to consider here (and to
emphasise to stakeholders) that one size does not necessarily fit all in modelling, and that
not all potential objectives may be able to be addressed by one model (see below).
A consistent methodology for constructing local-scale numerical models to meet the above
objectives.
A mechanism for reviewing the framework and the numerical models to incorporate new
knowledge.
3. Develop a suite of local-scale “hotspot” numerical models to address known and emerging
risks that should be considered in any WAP review, using the framework proposed in step 2.
Possible objectives of these models include:
Identify and prioritise critical knowledge / data gaps at local scales.
Assess validity of current resource condition triggers.
Quantify water balances of individual management areas (current and proposed).
Provide a better understanding of localised processes, e.g. confined-unconfined aquifer
interactions, surface water-groundwater interactions (including GDEs) and the role of
preferential recharge.
Detailed (quantitative) assessment of impacts of potential future climate scenarios and
proposed management scenarios or developments (e.g. irrigation, forestry and industry).
Contaminant transport modelling or investigation of groundwater salinity issues.
8.3. METHODOLOGY FOR ALLOWING FEEDBACK BETWEEN REGIONAL AND LOCAL SCALE MODELS
It would be desirable for feedback to occur between the regional numerical model developed during
this project (Step 1) and the smaller scale models developed during Step 3. The different ways in which
this could occur are:
Manual feedback approach. i.e. use output from the regional model to provide boundary
conditions for smaller scale models and subsequently update the regional model based on the
results of the smaller scale models.
Telescopic Mesh Refinement (TMR). This is an established technique in which the boundary
conditions for a finely discretized local/site scale model are defined from a coarser regional flow
model in which the local model is nested. The traditional method of TMR does not allow
feedback from the small grid back to the large grid (e.g. Ward et al., 1987; Leake and Claar,
1999; Davison and Lerner, 2000; Hunt et al., 2001). However, more rigorously numerically
coupled methods allowing such feedback have recently been developed (e.g. Haefner and Boy,
2003; Schaars and Kamps, 2001; Szekely, 1998; Mehl and Hill, 2002) and are expected to be

PROPOSED OVERALL (LONG TERM) MODELLING APPROACH
Department for Water | Technical Report DFW 2011/12 83 Lower South East Water Balance Project Phase 1 – Review of the conceptual model and recommendations for a Modelling Approach
available in the near future (Hugh Middlemis, pers. Comm.). TMR can currently be applied to
the MODFLOW code in the Groundwater Vistas platform.
8.4. ADDRESSING SURFACE WATER – GROUNDWATER INTERACTIONS
A great deal of discussion around modelling of surface water – groundwater interactions has occurred
during Phase 1 of this project. Amongst the stakeholders, there is a general preference to move
towards “fully-coupled” surface water – groundwater modelling for the South East. A number of points
that have been raised by the Technical Reference Group regarding this issue include:
The objectives of such a modelling exercise must be clearly identified in order to determine
whether a fully coupled model is likely to or necessary to address these objectives.
MODFLOW (the proposed groundwater modelling platform for this project) incorporates surface
water interactions through the drain, river and stream-routing packages. Fluxes between the
surface water body and the aquifer are calculated using base elevation, stage height and bed
conductance data.
These fluxes can be calibrated against actual gaugings to obtain estimates of conductance and to
ensure that surface water – groundwater interactions are being adequately represented.
In order to provide more accuracy than the above approach, a fully coupled model would
require detailed data such as:
o Detailed bathymetry (e.g. LiDAR).
o Unsaturated zone information (i.e. physical properties of soils in and around drains and
creeks)
o Detailed monitoring data (both surface water and groundwater) for calibration. The
actual requirements in this area are yet to be determined.
For these reasons, a “fully-coupled” surface water – groundwater model has not been proposed for the
long-term modelling approach. However, if this preference remains amongst the stakeholders, it is
recommended that a feasibility analysis be carried out.
The surface water models developed as part of the Regional Flow Management project (Wood and Way,
2010) could provide useful input to an “un-coupled” MODFLOW model. Drain water level data taken
from monitoring records could be used as an input to the MODFLOW model, and the catchment yield
values determined by the surface water models could be used to calibrate the MODFLOW drain
conductance values against. This would provide an opportunity to test the assumptions regarding
groundwater interaction made in the surface water models, and help align the objectives of both areas
of modelling. It would also build upon the surface water modelling, by allowing for temporal variation in
interactions by simulating seasonal fluctuations in the watertable (a boundary condition not considered
by the surface water models). Other options could be pursued for linking the outputs of the surface
water models to the groundwater model, including the conversion of flow rates determined by the
surface water models to drain levels (to act as input to the groundwater model). However this would
require further post-processing of the surface water model outputs, and development of a hydraulic
surface water model for the South East (which has not yet been developed). Regardless of the approach

PROPOSED OVERALL (LONG TERM) MODELLING APPROACH
Department for Water | Technical Report DFW 2011/12 84 Lower South East Water Balance Project Phase 1 – Review of the conceptual model and recommendations for a Modelling Approach
taken, there is clearly scope to incorporate the results of the surface water modelling into the
development of a groundwater model.
Additionally, it is anticipated that, in the case that some field sites are located in the Lower South East, a
proposed National Centre for Groundwater Research and Technology (NCGRT) project investigating
groundwater fluxes to drains in the South East will provide some additional data against which the
numerical groundwater flow model can be calibrated. It is also hoped that the NCGRT project may
provide some insight into: o The best ways to estimate groundwater fluxes to drains and the optimum level of data /
instrumentation required to do this.
o A methodology for up-scaling site-specific information.
8.5. USING NUMERICAL MODELS TO GUIDE FUTURE RESEARCH AND WORK PLANS FOR THE LOWER SOUTH EAST
Numerical models are emerging as critical tools in water resources management and hence the quality
of the conceptual models upon which these are based should be considered of high importance to
water resource managers. It is usually the numerical models themselves that provide the best
indication of the areas of the conceptual model that require improvement. Therefore, modelling is an
iterative process and requires a long-term commitment if the best outcomes are to be achieved. The
importance of numerical models as tools for testing conceptual models and identifying critical
knowledge gaps has been emphasised by all parties throughout Phase 1 of this project.
The conceptual model review has shown that a large body of knowledge already exists, certainly enough
to allow us to construct a regional model that can answer certain regional questions with confidence.
However, the review, along with the Technical Workshop and other similar recent workshops, have also
identified a range of research and data collection needs, including a better knowledge of aquifer
properties, unconfined / confined aquifer interactions, spatial and temporal variations in forestry water
use, evapotranspiration, groundwater recharge and interactions between groundwater and GDEs. How
these perceived knowledge gaps should be prioritised has not been clear.
If numerical models are to be an integral part of future water resources planning for the Lower South
East, then the outcomes from the Long-Term Modelling Approach proposed above should be closely
coupled with the planning of water resources research and data collection efforts. Where the real
knowledge gaps lie and the level of importance of these will become clearer as the conceptual model is
tested in a numerical model.

Department for Water | Technical Report DFW 2011/12 85 Lower South East Water Balance Project Phase 1 – Review of the conceptual model and recommendations for a Modelling Approach
9. REGIONAL WATER BALANCE MODELLING APPROACH
The fine details of the regional numerical modelling approach will be finalised during Phase 2 of this
project. However, based on the consultation and review activities carried out during Phase 1, the
following broad details have been determined.
9.1. MODELLING CODE AND PLATFORM
Following discussions with the Technical Reference Group, the MODFLOW code has been selected as the
numerical modelling tool for this project, using the Visual MODFLOW or Groundwater Vistas platforms.
The reasons for this selection are as follows:
Visual MODFLOW and Groundwater Vistas are the industry standard for numerical groundwater
modelling studies and are hence most easily used by the majority of modelling professionals.
Groundwater Vistas interfaces well with ArcGIS.
Despite its limitations discussed below, the benefits of using MODFLOW are that it has a good
capability for calculating water balances at a range of scales and that Telescopic Mesh
Refinement, with feedback from small scale to larger scale (as described in Section 7.3), is
expected to be available soon.
For these reasons, the Department For Water has adopted Visual MODFLOW and Groundwater
Vistas as its preferred modelling packages and the current Groundwater Model Warehouse
project will require all numerical groundwater models to be provided in either of these
platforms.
The limitations of using the MODFLOW code for this project must also be acknowledged. These are that
MODFLOW:
Does not have the ability to represent density dependent flow and hence cannot accurately
represent flow at the groundwater – seawater interface.
Does not support a fully integrated surface water – groundwater modelling approach – i.e. it
does not link with surface water models.
9.2. MODEL DOMAIN, LAYERS AND GRID
Consultation with stakeholders made it clear that there is a strong preference to have the model
centred on the LLC PWA boundary. However, advice from the technical reference group was to use
appropriate geological/hydrogeologic boundaries to assign the model domain. For these reasons it was
decided that the same model domain adopted by Brown (2000) to model the confined aquifer would be
used (Fig. 2). The model area is bounded to the north by the Padthaway Ridge, which approximately
marks the transition between the Otway and Murray basins. To the east, the domain is bounded by the
Dundas Plateau. The remainder of the model is bounded by the Southern Ocean.

REGIONAL WATER BALANCING MODELLING APPROACH
Department for Water | Technical Report DFW 2011/12 86 Lower South East Water Balance Project Phase 1 – Review of the conceptual model and recommendations for a Modelling Approach
The stratigraphic framework constructed for the NWI project will be used as the basis for layer
elevations in the numerical model, with three layers representing the unconfined and confined aquifers
and the intermediate aquitard. The model constructed by Brown (2000) used grid cells of 4km x 4km, as
the emphasis was on modelling flow and trends in the confined aquifer, where less data is available.
Given that this project intends to better model processes in the unconfined aquifer, where significantly
more data is available, grid cells of 1km x 1km will be used for the majority of the grid. This grid size may
be refined where necessary to represent more detail or localised processes. The unconfined aquifers
(Gambier, Murray, Bridgewater, Padthaway etc), will be modelled as one grouped Tertiary Limestone
Aquifer layer. Again, this may be refined to multiple layers if required during the modelling process.
The location and influence of significant faults was identified in the NWI project through detailed
analysis of seismic records, and drilling and identification of aquifer displacement across known fault
lines. Particular consideration will be given to layer boundaries and aquifer properties around the fault
locations to ensure that the aquifer displacement identified through the NWI project is properly
represented. These are likely to be areas where a more refined grid is required. Surface elevation will
be taken from the DEM for the region, which has a vertical accuracy of 0.5m, and a horizontal accuracy
and point spacing of <2m.
9.3. AQUIFER PROPERTIES
Estimates of aquifer properties for the Tertiary Limestone Aquifer are characterised by spatial variability
of orders of magnitude (a result of karst development in the aquifer). However, confidence in the
estimates of aquifer transmissivity and specific yield is generally quite low (Mustafa and Lawson, 2002).
This limits the usefulness of all data for inclusion in any numerical modelling study.
Previous groundwater models in the Lower Limestone Coast have identified the variation in aquifer
properties as a key uncertainty. The Phase 2 regional model will initially adopt aquifer properties from
previous modelling studies, with note taken of the reasons behind the particular distribution of aquifer
properties. These values take into account spatial variability, and have in some cases already been
subjected to a sensitivity analysis. Aquifer properties will be adjusted appropriately through the
calibration process.
9.4. MODEL BOUNDARIES
Preliminary discussions about model boundary conditions, particularly the benefits of constant vs
general head boundaries, have been held with the Technical Reference Group. It is anticipated that,
where no-flow boundaries are inappropriate, general head boundaries will be used at the extremities of
the model domain, but groundwater flows across these boundaries will be carefully monitored to
ensure that they are consistent with the conceptual model. A constant head boundary will initially be
applied at the coast and this approach will, again, be reviewed during the modelling process.
9.5. RECHARGE
Several approaches have been used in the past to represent recharge in models in the LLC. These range
from the use of long term averages (management area recharge rates), to modelling year to year
variation in recharge based on the relationship between rainfall and recharge. As rainfall recharge is a
large component of the water balance (~80% of total water inputs to the system (Wood, 2010b)), it is
considered that it is important to implement this as accurately as possible in numerical groundwater
flow models and that the approach taken be uniform across all models. For this study, a relationship
between rainfall and recharge will be used to represent temporal variations in recharge. The recharge
rates for each year will then be compared with long term averages reported in previous studies (those in

REGIONAL WATER BALANCING MODELLING APPROACH
Department for Water | Technical Report DFW 2011/12 87 Lower South East Water Balance Project Phase 1 – Review of the conceptual model and recommendations for a Modelling Approach
Table 2) to ensure they are realistic. Influences of land use will also been incorporated, with reduced
recharge under plantation forestry and native vegetation, and increased recharge under flood irrigation.
Care will also be taken in applying recharge rates to deep watertable areas, particularly in the Border
Designated Area, around the town of Mount Gambier, and in the uplifted areas associated with the Mt
Burr volcanics.
There are several SILO weather stations in the South East, and these can be separated into areas of
similar long term recharge, based on recharge rates reported in Brown et al. (2006) (Fig. 22). Rainfall
data from these stations will be used to assign recharge rates in these zones. Annual recharge rates will
either be determined using the ‘average winter rainfall’ method used by Harrington (in prep.) or set as a
percentage of winter rainfall, and compared with the average recharge rates shown in Figure 22.
Recharge rates may be subject to change during model calibration, providing an indication of the
applicability of this and other methods of recharge estimation. If this approach proves too coarse in
applying recharge rates, further sub-zoning of recharge areas may be done based on the results of
Wood (2010a), and additional rainfall stations used.

REGIONAL WATER BALANCING MODELLING APPROACH
Department for Water | Technical Report DFW 2011/12 88 Lower South East Water Balance Project Phase 1 – Review of the conceptual model and recommendations for a Modelling Approach
Figure 22. Proposed initial recharge zones for regional scale model based on locations of SILO weather stations
and recharge zones of Brown et al. (2006). Further sub-zoning may be conducted if required based
on results of Wood (2010a)
The data requirements of this methodology are as follows:
Time series rainfall data (preferably monthly) to calculate April-October rainfall statistics. This
can either be weather station data in key locations, or gridded SILO data.

REGIONAL WATER BALANCING MODELLING APPROACH
Department for Water | Technical Report DFW 2011/12 89 Lower South East Water Balance Project Phase 1 – Review of the conceptual model and recommendations for a Modelling Approach
Land use maps to identify areas where alternative recharge estimation methods should be used
(see Table 5).
Observation well hydrographs to match against rainfall statistics (to confirm relationship
between rainfall and recharge).
Land use information, both current and past, especially in areas where changes in land use are
thought to be responsible for groundwater trends (plantation forestry areas and areas of large
scale irrigation development).
Any information about the potential influence of point source recharge and extreme recharge
events.
Table 5. Proposed methodology for applying recharge to different land uses in model
Land use Proposed recharge methodology
Dryland/un-irrigated pasture Recharge based on SILO rainfall data as outlined above.
Recharge only applied during ‘winter rainfall months’
(i.e. ~April – September).
Native vegetation Recharge applied at a set rate of 10 mm/y, as reported
values range from 5 – 20 mm/y (see Table 2).
Note: the accepted value for management purposes is
0 mm/y.
Irrigation Receive rainfall recharge the same as dryland areas, but
flood irrigation areas should receive additional recharge
during ‘summer irrigation months’ (i.e. ~ October –
March). Initially set at 20% of the volume of water
applied, following the approach taken in the Padthaway
model developed by Aquaterra (2008), however this
may be altered during calibration.
Hardwood forestry Receive rainfall recharge in the same way as dryland
areas, but amount reduced by 78%. If information is
available regarding the date of plantation
establishment, this reduction may be staggered as in
the Coles and Short model (Aquaterra, 2010).
Softwood forestry Receive rainfall recharge in the same way as dryland
areas, but amount reduced by 83%. If information is
available regarding the date plantation establishment,
this reduction may be staggered as in the Coles and
Short model (Aquaterra, 2010).
Water bodies/urban areas No recharge applied.
9.6. EVAPOTRANSPIRATION (NON-FORESTRY)

REGIONAL WATER BALANCING MODELLING APPROACH
Department for Water | Technical Report DFW 2011/12 90 Lower South East Water Balance Project Phase 1 – Review of the conceptual model and recommendations for a Modelling Approach
Regionally, evapotranspiration rates are not well understood. Previous modelling approaches have
treated evapotranspiration in non-forestry areas as a process that only affects shallow watertables
(generally where the depth to water is less than 2-3 m). Maximum evapotranspiration rates are set
based on site specific information, and extinction depths set at 2-3 m. Initially, maximum
evapotranspiration will be set at 500mm/y for the entire region, with an extinction depth of 2 m. Initial
model runs will show how significant evapotranspiration is in controlling hydraulic heads and
groundwater flow, and comparisons will be made with the volumes estimated by Paydar et al. (2009). If
additional information becomes available through the Diffuse Impacts Project work, these ET rates may
be incorporated into the model as required.
9.7. GROUNDWATER EXTRACTION
As described in Section 6.4.1.1, metered groundwater extraction data only exists for the LLC PWA from
about 2007. Prior to this, records of groundwater use are based on estimated use. Estimates of use go
back to 1998 for the whole LLC PWA, and back to 1985 for the areas formerly known as Comaum-
Caroline PWA and Naracoorte Ranges PWA.
Extraction from 2007 – 2010 will be based on metered records, obtained from the South East Meter
Database System (SEMDMS). In many cases, extraction data from the SEMDMS will be related to a
drillhole recorded in the State drillhole database (SA Geodata), so extraction depth should be able to be
assigned from this. Where drillholes have not already been assigned to meters, they will be manually
created in the model, and given a depth based on the depth of nearby extraction wells.
Extraction data prior to 2007 will have to be based on estimates. Initially, existing estimates from recent
years could be compared to current metered records, to ensure that estimates of use are not
unrealistically different to metered records. The date of drillhole construction may also be obtained
from SA Geodata and used to ‘introduce’ extraction wells into the model. To test that this method of
‘introducing’ wells into the model realistically simulates the expansion of irrigation in the LLC, total
extraction volumes over time will be compared to estimated trends in use (Fig. 23). If some uncertainty
in modelled and estimated trends in use arises, historical aerial imagery could be consulted to
understand the difference.
Irrigation extraction in the model will be averaged over an approximate ‘summer irrigation season.’ That
is, all extraction wells will be assigned constant daily pump rates between October and March.

REGIONAL WATER BALANCING MODELLING APPROACH
Department for Water | Technical Report DFW 2011/12 91 Lower South East Water Balance Project Phase 1 – Review of the conceptual model and recommendations for a Modelling Approach
Figure 23. Expansion in estimated irrigation use in the LLC PWA
9.8. IMPACTS OF PLANTATION FORESTRY
The method for incorporating the impacts of plantation forestry in the regional model is yet to be
decided and this will be done early in Phase 2 of the project in consultation with stakeholders and the
Technical Reference Group. It is important that the method used be consistent or comparable between
the regional model and any smaller-scale models and this must be carefully considered. One possible
methodology is that employed in the recent model of the Wattle Range (Coles-Short) area (model
WR2010), developed for DFW by Aquaterra (2010). In this model, the impact of direct extraction by
forestry is not limited to areas where the depth to water is <6m, but applied to all areas occupied by
commercial plantations. Extraction rates were implemented as ‘negative recharge’ in the model, and
rates varied over a theoretical ‘crop rotation’ cycle to give average extraction rates of 1.82 ML/ha/y
under blue gum plantations, and 1.66 ML/ha/y under pine plantations. Recharge interception was dealt
with in a similar fashion, with recharge values decreasing to 0 mm/y over a plantation cycle. Table 6 and
Table 7 give examples of the extraction and recharge models used for blue gum plantations in the
Wattle Range model (taken from Aquaterra, 2010).

REGIONAL WATER BALANCING MODELLING APPROACH
Department for Water | Technical Report DFW 2011/12 92 Lower South East Water Balance Project Phase 1 – Review of the conceptual model and recommendations for a Modelling Approach
Table 6. Groundwater extraction model for blue gum plantations in Wattle Range model (Aquaterra, 2010)
Table 7. Groundwater recharge model for blue gum plantations in Wattle Range model (Aquaterra, 2010)
It is anticipated that there will be projects commencing in the near future that will seek to better
quantify plantation water use at different spatial and temporal scales. Depending on the timing of the
work, this may provide an improved basis for representing forestry impacts in the model.

REGIONAL WATER BALANCING MODELLING APPROACH
Department for Water | Technical Report DFW 2011/12 93 Lower South East Water Balance Project Phase 1 – Review of the conceptual model and recommendations for a Modelling Approach
9.9. GROUNDWATER-SURFACE WATER INTERACTIONS
While fully-coupled surface water-groundwater models are seen as ideal tools to assess interactions, the
availability of appropriate data sets and capabilities of current modelling platforms limit our ability to
build a fully coupled model in Phase 2 of this project. However, the MODFLOW groundwater modelling
platform contains a number of mechanisms for incorporating surface water – groundwater interactions.
9.9.1. DRAINS AND CREEKS It is expected that drains and creeks in the South East will be modelled using the MODFLOW Drains
Package. This package builds the drain (based on its elevation) into the model domain. The water level in
the drain is set based on observations, and losses or gains to/from groundwater are calculated based on
the hydraulic gradient between surface water and groundwater, and the conductivity of the material
lining the drain. Surface water modelling has been conducted as part of the Regional Flow Management
Strategy , and results of this can be used to estimate in-flows to the drain along defined sections, which
can then be compared to model results through the zone budget function in Visual Modflow. It is
envisaged that calibration will be achieved by altering the drain conductance value. This will help give a
first order estimate and assessment of surface water-groundwater interactions in the South East.
It is recognised that there are small areas where drains may be losing systems, i.e. where the water
table has dropped below the base of the drains. These will need to be represented differently in the
model and the methodology for this will be developed during Phase 2 of the project.
9.9.2. WETLANDS In the initial stages, how well the model represents the occurrence of entirely groundwater-fed
wetlands (i.e. where the water table is at or above the ground surface), through the interaction between
topography, groundwater levels and evapotranspiration, compared with mapped wetlands, will be
assessed. In many cases, this may adequately represent the occurrence and dynamics of wetlands in the
South East. Some permanent water bodies may be better represented using the MODFLOW Lakes
package.
9.10. MODEL CALIBRATION
The objectives of the model are outlined in Section 7.2. As its main purpose is as a tool for investigating
processes and our understanding of the conceptual model, a detailed formal calibration is not required
at this stage. However, the model’s performance against observation well hydrographs will be assessed
and model parameters will be optimised within reasonable limits. Assessment will predominantly be
against hydrographs showing regional trends, as local-scale processes will not be represented in this
model. However, a process of assessment of model performance against a range of hydrographs will be
carried out to gain a better understanding of the knowledge gaps and smaller-scale modelling
requirements.
As well as comparison with observation well hydrographs, the model outcomes will also be compared
with measured and estimated components of the water balance, e.g. measured surface water flows,
lateral inflow and outflow, inter-aquifer leakage and groundwater flow rates (e.g. those estimated by
Harrington et al. (1999)).

Department for Water | Technical Report DFW 2011/12 94 Lower South East Water Balance Project Phase 1 – Review of the conceptual model and recommendations for a Modelling Approach
10. CONCLUSIONS AND RECOMMENDATIONS
The conclusions and recommendations from Phase 1 of the Lower South East Water Balance Modelling
Project are as follows:
The Lower South East is a region rich in hydrologic data and knowledge and therefore any
conceptual and numerical models developed for water resource management will be well-
founded, albeit not without limitations.
A groundwater flow model is the appropriate platform for a water balance model given that the
system is groundwater dominated and that groundwater models have facilities for including
surface water-groundwater interactions at the level that is required and justified by the data
available.
A feasibility study for fully coupled surface water – groundwater modelling should be carried out
as soon as possible if this is still considered to be a desirable option.
To address the needs of water resource management, identified through consultation with
stakeholders, and through consultation with the Technical Reference Group, a three-stage
modelling process should be carried out, involving:
o Development of a regional scale water balance model (groundwater modelling platform)
to address regional scale objectives (Phase 2 of this project).
o Development of a modelling framework, including the regional water balance model
itself, guidelines for the development of local scale “hotspot” models, and a
methodology for allowing feedback between the two scales of model.
o Development of local scale “hotspot” models to address local scale objectives.
An approach for development of the regional water balance model has been formulated as part
of this report.
Any hydrological models are limited by the quality and quantity of data available to them and
the level of understanding of the relevant processes. The following priority areas for
improvement of the conceptual model of the Lower South East have been identified, based on
(a) the current level of knowledge and (b) the likely impacts on outcomes of regional and local
scale models (see Table 4 for the full list of knowledge gaps identified):
o Groundwater flow around numerous faults in the region (i.e. impacts of faults on aquifer geometry, properties and preferential vertical flow).
o Occurrence and magnitude of vertical leakage between unconfined and confined
aquifers.
o Spatial and temporal variability of SW-GW interactions around drains.
o ET from shallow water tables.

CONCLUSIONS AND RECOMMENDATIONS
Department for Water | Technical Report DFW 2011/12 95 Lower South East Water Balance Project Phase 1 – Review of the conceptual model and recommendations for a Modelling Approach
o Spatial and temporal variability in direct extraction of groundwater by forest plantations
o Coastal and offshore groundwater discharge (includes understanding of seawater
intrusion).
This list will be revised based on outcomes of the proposed regional water balance model (Phase
2 of this project) and it is also anticipated that the proposed Phase 2 will allow us to be more
specific about the work that needs to be carried out in these general areas.

Department for Water | Technical Report DFW 2011/12 96 Lower South East Water Balance Project Phase 1 – Review of the conceptual model and recommendations for a Modelling Approach
APPENDICES
A. CURRENT ADMINISTRATIVE BOUNDARIES FOR THE SOUTH EAST, INCLUDING CONFINED AND UNCONFINED AQUIFER MANAGEMENT ZONES

APPENDICES
Department for Water | Technical Report DFW 2011/12 97 Lower South East Water Balance Project Phase 1 – Review of the conceptual model and recommendations for a Modelling Approach
Figure A-1.

APPENDICES
Department for Water | Technical Report DFW 2011/12 98 Lower South East Water Balance Project Phase 1 – Review of the conceptual model and recommendations for a Modelling Approach
Figure A-2.

Department for Water | Technical Report DFW 2011/12 99 Lower South East Water Balance Project Phase 1 – Review of the conceptual model and recommendations for a Modelling Approach
UNITS OF MEASUREMENT
Units of measurement commonly used (SI and non-SI Australian legal)
Name of unit Symbol Definition in terms of other metric units Quantity
day d 24 h time interval
gigalitre GL 106 m
3 volume
gram g 10–3
kg mass
hectare ha 104
m2
area
hour h 60 min time interval
kilogram kg base unit mass
kilolitre kL 1 m3
volume
kilometre km 103 m length
litre L 10-3
m3 volume
megalitre ML 103 m
3 volume
metre m base unit length
microgram g 10-6
g mass
microlitre L 10-9
m3 volume
milligram mg 10-3
g mass
millilitre mL 10-6
m3 volume
millimetre mm 10-3
m length
minute min 60 s time interval
second s base unit time interval
tonne t 1000 kg mass
year y 365 or 366 days time interval
Shortened forms
~ approximately equal to
bgs below ground surface
EC electrical conductivity (µS/cm)
K hydraulic conductivity (m/d)
pH acidity
pMC percent of modern carbon
ppb parts per billion
ppm parts per million
ppt parts per trillion
w/v weight in volume
w/w weight in weight

Department for Water | Technical Report DFW 2011/12 100 Lower South East Water Balance Project Phase 1 – Review of the conceptual model and recommendations for a Modelling Approach
GLOSSARY
Aquifer — An underground layer of rock or sediment that holds water and allows water to percolate through
Aquifer, confined — Aquifer in which the upper surface is impervious (see ‘confining layer’) and the water is held at greater than atmospheric pressure; water in a penetrating well will rise above the surface of the aquifer
Aquifer test — A hydrological test performed on a well, aimed to increase the understanding of the aquifer properties, including any interference between wells, and to more accurately estimate the sustainable use of the water resources available for development from the well
Aquifer, unconfined — Aquifer in which the upper surface has free connection to the ground surface and the water surface is at atmospheric pressure
Aquitard — A layer in the geological profile that separates two aquifers and restricts the flow between them
Artesian — An aquifer in which the water surface is bounded by an impervious rock formation; the water surface is at greater than atmospheric pressure, and hence rises in any well which penetrates the overlying confining aquifer
Baseflow — The water in a stream that results from groundwater discharge to the stream; often maintains flows during seasonal dry periods and has important ecological functions
Basin — The area drained by a major river and its tributaries
BoM — Bureau of Meteorology, Australia
Bore — See ‘well’
14C — Carbon-14 isotope (percent modern Carbon; pmC)
Catchment — That area of land determined by topographic features within which rainfall will contribute to run-off at a particular point
Confining layer — A rock unit impervious to water, which forms the upper bound of a confined aquifer; a body of impermeable material adjacent to an aquifer; see also ‘aquifer, confined’
DFW — Department for Water (Government of South Australia)
DWLBC — Department of Water, Land and Biodiversity Conservation (Government of South Australia)
EC — Electrical conductivity; 1 EC unit = 1 micro-Siemen per centimetre (µS/cm) measured at 25°C; commonly used as a measure of water salinity as it is quicker and easier than measurement by TDS
Ecosystem — Any system in which there is an interdependence upon, and interaction between, living organisms and their immediate physical, chemical and biological environment
Ephemeral streams or wetlands — Those streams or wetlands that usually contain water only on an occasional basis after rainfall events. Many arid zone streams and wetlands are ephemeral.
Evapotranspiration — The total loss of water as a result of transpiration from plants and evaporation from land, and surface water bodies
GIS — Geographic Information System; computer software linking geographic data (for example land parcels) to textual data (soil type, land value, ownership). It allows for a range of features, from simple map production to complex data analysis
Groundwater — Water occurring naturally below ground level or water pumped, diverted and released into a well for storage underground; see also ‘underground water’
Hydraulic conductivity (K) — A measure of the ease of flow through aquifer material: high K indicates low resistance, or high flow conditions; measured in metres per day
Hydrogeology — The study of groundwater, which includes its occurrence, recharge and discharge processes, and the properties of aquifers; see also ‘hydrology’

GLOSSARY
Department for Water | Technical Report DFW 2011/12 101 Lower South East Water Balance Project Phase 1 – Review of the conceptual model and recommendations for a Modelling Approach
Hydrology — The study of the characteristics, occurrence, movement and utilisation of water on and below the Earth’s surface and within its atmosphere; see also ‘hydrogeology’
Irrigation — Watering land by any means for the purpose of growing plants
Irrigation season — The period in which major irrigation diversions occur, usually starting in August–September and ending in April–May
Natural recharge — The infiltration of water into an aquifer from the surface (rainfall, streamflow, irrigation etc). See also recharge area, artificial recharge
Observation well — A narrow well or piezometer whose sole function is to permit water level measurements
Obswell — Observation Well Network
Piezometer — A narrow tube, pipe or well; used for measuring moisture in soil, water levels in an aquifer, or pressure head in a tank, pipeline, etc
Prescribed water resource — A water resource declared by the Governor to be prescribed under the Act, and includes underground water to which access is obtained by prescribed wells. Prescription of a water resource requires that future management of the resource be regulated via a licensing system.
Prescribed well — A well declared to be a prescribed well under the Act
PWA — Prescribed Wells Area
PWRA — Prescribed Water Resources Area
SA Geodata — A collection of linked databases storing geological and hydrogeological data, which the public can access through the offices of PIRSA. Custodianship of data related to minerals and petroleum, and groundwater, is vested in PIRSA and DWLBC, respectively. DWLBC should be contacted for database extracts related to groundwater
Specific yield (Sy) — The volume ratio of water that drains by gravity, to that of total volume of the porous medium. It is dimensionless
Surface water — (a) water flowing over land (except in a watercourse), (i) after having fallen as rain or hail or having precipitated in any another manner, (ii) or after rising to the surface naturally from underground; (b) water of the kind referred to in paragraph (a) that has been collected in a dam or reservoir
Tertiary aquifer — A term used to describe a water-bearing rock formation deposited in the Tertiary geological period (1–70 million years ago)
Transmissivity (T) — A parameter indicating the ease of groundwater flow through a metre width of aquifer section
Underground water (groundwater) — Water occurring naturally below ground level or water pumped, diverted or released into a well for storage underground
Water allocation — (1) In respect of a water licence means the quantity of water that the licensee is entitled to take and use pursuant to the licence. (2) In respect of water taken pursuant to an authorisation under s.11 means the maximum quantity of water that can be taken and used pursuant to the authorisation
WAP — Water Allocation Plan; a plan prepared by a CWMB or water resources planning committee and adopted by the Minister in accordance with the Act
Water-dependent ecosystems — Those parts of the environment, the species composition and natural ecological processes, that are determined by the permanent or temporary presence of flowing or standing water, above or below ground; the in-stream areas of rivers, riparian vegetation, springs, wetlands, floodplains, estuaries and lakes are all water-dependent ecosystems
Wetlands — Defined by the Act as a swamp or marsh and includes any land that is seasonally inundated with water. This definition encompasses a number of concepts that are more specifically described in the definition used in the Ramsar Convention on Wetlands of International Importance. This describes wetlands as areas of permanent or periodic to intermittent inundation, whether natural or artificial, permanent or temporary, with

GLOSSARY
Department for Water | Technical Report DFW 2011/12 102 Lower South East Water Balance Project Phase 1 – Review of the conceptual model and recommendations for a Modelling Approach
water that is static or flowing, fresh, brackish or salt, including areas of marine water, the depth of which at low tides does not exceed six metres.

Department for Water | Technical Report DFW 2011/12 103 Lower South East Water Balance Project Phase 1 – Review of the conceptual model and recommendations for a Modelling Approach
REFERENCES
Andrews, R.C., 1974, Report on laboratory results of rock parameters for the karstic Gambier region of South Australia., Engineering & Water Supply Dept. unpublished report E.W.S 748. Aquaterra, 2008, Padthaway Groundwater Flow and Solute Transport Model (PADMOD1), Prepared for DWLBC, October 2008.
Aquaterra, 2010, Modelling forestry effects on groundwater resources in the Southeast of SA.
Benyon RG, Doody TM. 2004. Water use by tree plantations in Southeast South Australia. Final report September 2004. Progress Report No. 1352
Benyon, R.G., Theiveyanathan, S. And Doody, T.M., 2006, Impacts of tree plantations on groundwater in south eastern Australia. Australian Journal of Botany, 54, 181-192. Blake, W.J.R., (1980) Geology and hydrogeology of the Early Tertiary sediments of the Otway Basin. La Trobe University (Victoria). MSc. thesis (unpublished). Bowering, O.J.W., 1976, Hydrogeology of the Otway Basin (Gambier Basin). In: Hydrogeology and Environmental Geology of south eastern South Australia. Excursion Guide No. 32AC, 25th International Geological Congress, p 21-27. Bradley, J., De Silva, J., Foley, G., Robinson, M. and Stadter, F., 1995, Five year technical review 1991-1995 Border (Groundwater Agreement) Act, 1985. Department of Mines and Energy, Geological Survey. South Australia. Report Book 95/22. Brookes, J. (ed.), 2010, South East Water Science Review. Report for the Lower Limestone Coast Taskforce. Cabinet in Confidence. Brown, K., 2000, A groundwater flow model of the Tertiary confined sand aquifer in south east South Australia and south west Victoria., Dept. Of Primary Industry and Resources South Australia Report Book 2000/16. Brown, K.G., Love, A.J. and Harrington, G.A., 2001, Vertical Groundwater Recharge to the Tertiary Confined Sand Aquifer, South East, South Australia. South Australia. Department for Water Resources. Report DWR 2001/00 Brown, K., Harrington, G. and Lawson, J., 2006, Review of Groundwater Resource Condition and Management Principles for the Tertiary Limestone Aquifer in the South East of South Australia., South Australia. Department of Water, Land and Biodiversity Conservation. DWLBC Report 2006/2. Cobb, M. A., 1976, Completion Report and Aquifer Test Naracoorte Town Water Supply, Boreholes 6 and 7. South Australian Dept. Mines & energy Report Book 76/61. Cobb, M., and Brown, K., 2000, Water Resource Assessment: Lacapede-Kongorong Prescribed Wells Area for the South East Catchment Water Management Board, PIRSA Report Book 2000/00049.

REFERENCES
Department for Water | Technical Report DFW 2011/12 104 Lower South East Water Balance Project Phase 1 – Review of the conceptual model and recommendations for a Modelling Approach
Cook, P.G., Wood, C., White, T., Simmons, C.T., Fass, T., and Brunner, P., 2008, Groundwater inflow to a shallow, poorly-mixed wetland estimated from a mass balance of radon, Journal of Hydrology, 354, 213-226. Davison, R.M., Lerner, D.N., 2000. Evaluating Natural Attenuation of Groundwater Pollution from a Coal-Carbonisation Plant: Developing a Local-Scale Model using MODFLOW, MODTMR and MT3D, Journal of the Chartered Institute of Water and Environmental Management, 14, 419-426. Emmett, A.J., 1985, Mount Gambier Stormwater Quality., E & WS Dept. Report 84/23. 1983. Fass, T., and Cook, P.G., 2004, Reconnaissance survey of groundwater dependence of wetlands, SE, SA using a mass balance of radon and chloride, CSIRO Land & Water unpublished report. Fawcett, R.J., Jones, D.A., and Shitaye, B., 2006, Climatological rainfall analyses for Southeast South Australia, a report prepared by the National Climate Centre for use by the South Australian Department of Water, Land and Biodiversity Conservation. Floegel, H., 1972, The position of the Lower Tertiary artesian aquifer within the hydrogeology and hydrochemistry of the Gambier Basin area (South Australia/Victoria)., PhD Thesis Breslau University, West Germany (unpublished).
Gibbs, M., 2010, Rainfall and Recharge, in South East Science Review, (ed.) Brookes, J. Report for the
Lower Limestone Coast Taskforce. Cabinet in Confidence. Gravestock, D.I., Hill, A.J. and Morton, J.G.G., 1986, A review of the structure, geology and hydrocarbon potential of the Otway Basin in South Australia., South Australian Department of Mines and Energy, Report Book 86/77. Haefner, F., Boy, S., 2003. Fast Transport Simulation with an Adaptive Grid Refinement, Ground Water, 39(2), 273-279. Harding, C., 2009, Extension of the Water Dependent Ecosystem Risk Assessment Framework to the South East NRM Region, Department for Water, Land and Biodiversity Conservation, Unpublished technical report. Harding, C., 2010, A Preliminary Risk Assessment of Groundwater Dependent Ecosystems South Australia Phase 1 – Draft report, Department for Water draft technical report. Harrington, G.A., Walker, G.R., Love, A.J., and Narayan, K.A., 1999, A compartmental mixing-cell approach for the quantitative assessment of groundwater dynamics in the Otway Basin, South Australia., J. Hydrol., 214: 49-63. Harrington, G. And Brown, K., 2007, South East Confined Aquifer Groundwater Resource Assessment: A review of the condition of the resource and estimates of Permissible Annual Volume., Draft Report, Dept. of Water, Land and Biodiversity Conservation. Harrington, N., Van den Akker, J., Brown, K. and Mackenzie, G., 2004, Padthaway Salt Accession Study. Volume 1. Methodology, Site description and instrumentation. South Australia. Department of Water, Land and Biodiversity Conservation. DWLBC Report 2004/61.

REFERENCES
Department for Water | Technical Report DFW 2011/12 105 Lower South East Water Balance Project Phase 1 – Review of the conceptual model and recommendations for a Modelling Approach
Harrington, N., Van den Akker, J., and Brown, K., 2006, Padthaway Salt Accession Study Volume Four: Summary Conclusions and Recommendations, DWLBC Technical Report 2005/35. Harrington, N, Chambers, K & Lawson, J 2007, Primary Production to Mitigate Water Quality Threats Project. Zone 1A Numerical Modelling Study: Conceptual Model Development, DWLBC Report 2008/12,
Harrington, N., Lawson, J. And Somaratne, N. in prep., Estimating Regional Impacts of Plantation
Forestry and Intensive Irrigation Development on Groundwater Resources in the Lower South East.
Phase 2 (2007/08) Numerical Model Report. Department for Water. DFW Technical Report in prep. Hodge, B., 2009, Water Allocation and Use in the South East 2008-2009 Summary Report. DWLBC internal report. Hunt, R.J., Steuer, J.J., Mansor, M.T.C., Bullen, T.D., 2001. Delineating a Recharge Area for a Spring Using Numerical Modeling, Monte Carlo Techniques, and Geochemical Investigation, Ground Water, 39(5), 702-712. Kenley, P.R., 1971. Cainozoic geology of the Eastern part of the Gambier Basin, south-western Victoria, in Wopfner, H., and Douglas, J.G., eds., The Otway Basin of South-eastern Australia, Special Bulletin, Geological Surveys of South Australia and Victoria, p. 89 - 144. Latcham, B., Carruthers, R., Harrington, G. And Harvey, D., 2007, A New Understanding on the Level of Development of the Unconfined Tertiary Limestone Aquifer in the South East of South Australia. South Australia. Department of Water, Land and Biodiversity Conservation. DWLBC Report 2007/11. Lawson, J. Love, A.J, Aslin, J. and Stadter.F, 1993. Blue Lake Hydrogeological Investigation Progress Report No. 1- Assessment of Available Hydrogeological Data. Department of Mines and Energy South Australia. Report Book 93/14. 1993. Lawson, J., Mustafa, S., and Wood, C., 2009. Field investigations into the influence of faulting on groundwater flow and recharge of the Tertiary Limestone Aquifer, Lower South East, South Australia. Draft DFW Technical report. Leake, S.A., Claar, D.V., 1999. Procedures and computer programs for telescopic mesh refinement using MODFLOW, U.S. Geological Survey Open-File Report 99-238.
Leaney, F.W.J., Allison, G.B., Dighton, J.C. and Trumbore, S., 1995, The age and hydrologic history of Blue Lake, South Australia. Paleogeogr., Paleoclimatol., Palaeoecol. 118, p111-130.
Li, Q., McGowran, B and White, M.R., 2000, Sequences and biofacies packages in Mid-Cenozoic Gambier Limestone, South Australia; repraisal of foraminiferal evidence. Aust. J. Earth Science, 47: 955-970 Love, A.J., 1991, Groundwater Flow Systems: Past and Present, Gambier Basin, Otway Basin, South-East Australia, M.Sc. thesis. School of Earth Sciences, Flinders University of South Australia. Love, A.J. and Stadter, F., 1990, Greenways No. 1. Groundwater well completion report., South Aust. Dept. Mines & Energy. Report Book 90/81.

REFERENCES
Department for Water | Technical Report DFW 2011/12 106 Lower South East Water Balance Project Phase 1 – Review of the conceptual model and recommendations for a Modelling Approach
Love, A.J., Herczeg, A.L., Armstrong, D., Stadter, M.F.F. and Mazor, E., 1993, Groundwater flow regime within the Gambier Basin of the Otway Basin, Australia: evidence from hydraulics and hydrochemistry., J. Hydrol., 143: 297-338. Love, A.J., Herczeg, A.L., Leaney, F.W., Stadter, M.F.F., Dighton, J.C., Armstrong, D., 1994, Groundwater residence time and palaeohydrology in the Otway Basin, South Australia: 2H, 18O and 14C data., J. Hydrol., 153: 157-187. Love, A.J., Herczeg, A.L. and Walker, G.R., 1996, Transport of water and solutes across a regional aquitard inferred from porewater deuterium and chloride profiles: Otway Basin, Australia, In: Isotopes in Water Resources Management, Proceedings of a Symposium on Isotopes in Water Resources Management. International Atomic Energy Agency, Vienna, pp. 73-86. Mehl, S., Hill, M.C., 2002a. Development and evaluation of a local grid refinement method for blockcentered finite-difference groundwater models using shared nodes, Advances in Water Resources, 25(5), 497-511. Mehl, S., Hill, M.C., 2002b. Evaluation of a local grid refinement method for steady-state block-centered finite-difference groundwater models: p. 367-374 in eds. S.M. Hassanizadeh, R.J.. Schotting, W.G. Gray, and G.F. Pinder, Proceedings of the XIVth International Conference on Computer Methods in Water Resources Conference, Developments in Water Science vol. 47, Elsevier, June, 2002, Delft, the Netherlands., ISBN: 0-444-50975-5, 1808 p. Middlemis, H., Merrick, N., Ross, J., 2001. Groundwater Flow Modeling Guideline. Aquaterra Consulting Pty Ltd, Project No. 125, Final guideline-Issue 1, pp. 1-72. Mustafa, S. and Lawson, J.S., 2002, Review of Tertiary Gambier Limestone aquifer properties, lower South-East, South Australia., South Australian Dept. Water, Land and Biodiversity Conservation, report DWLBC 2002/24. Mustafa, S., Lawson, J., Leaney, F. And Osei-Bonsu, K., 2006, Land-use impact on water quality and quantity in the Lower South East, South Australia., Government of South Australia. Department of Water, Land and Biodiversity Conservation, DWLBC Report 2006/25.
Osei Bonsu, K., 2009, Bakers Range 2006 Groundwater Flow Model, DWLBC Report 2009/28 (in prep.) Paydar, Z., Chen, Y., Xevi, E. And Buettikofer, H., 2009, Current understanding of the water cycle in the Limestone Coast region. CRC for Irrigation Futures Technical Report No. 03/09. Ramamurthy, L.M., Veeh, H.H., and Holmes, J.W. 1985. Geochemical mass balance of a volcanic crater lake in Australia. Journal of Hydrology 79: 127-139. REM, 2008, Estimating Regional Impacts of Plantation Forestry and Intensive Irrigation Development on Groundwater Resources in the Lower South East Phase 1 (2006/07) Final Research Report. REM Consulting report prepared for DWLBC. Schaars, F., Kamps, P., 2001. MODGRID: Simultaneous solving of different groundwater flow models at various scales, Proceedings of MODFLOW 2001 and Other Modeling Odysseys Conference, Golden, CO, Sep. 11-14, Volume I, 38-44. Shepherd, R.G., 1978, Underground Water Resources of South Australia. South Australian Dept. Mines & Energy Bulletin 48.

REFERENCES
Department for Water | Technical Report DFW 2011/12 107 Lower South East Water Balance Project Phase 1 – Review of the conceptual model and recommendations for a Modelling Approach
SKM, 2009, Classification of groundwater-surface water interactions for water dependent ecosystems in the South East, South Australia, Consultant report to Department of Water, Land and Biodiversity Conservation by Sinclair Knight Merz Pty Ltd. Smerdon, B.D., 2009, A review of scientific assessments underpinning the work-in-progress Water Allocation Plan for the Lower Limestone Coast Prescribed Wells Area. CSIRO: Water for a Healthy Country National Research Flagship. Smith, P.C., 1978a, Mount Gambier Town Water Supply Standby Well No. 7., South Australian Dept. Mines & Energy. Report Book 78/9. Smith, P.C., 1978b, Mount Gambier Town Water Supply Standby Well No. 8., South Australian Dept. Mines & Energy. Report Book 78/34. Stace, P., and Murdoch, B., 2003, Project to determine potential effects of increasing blue gum forest plantations in the SE Region, south of Bool Lagoon, in the Drain ‘M’ catchment. Surface Water Unit, DWLBC unpublished project paper. Stadter, F., 1989, Re-assessment of groundwater resources for Zones 2A to 8A of the S.A. Designated Area, Border Groundwater Agreement., South Aust. Dept. Mines & Energy Report Book 89/27. Stadter, F. and Yan, W., 2000, Assessment of the potential use of groundwater resources in the area south of Mount Gambier., PIRSA Report Book 2000/00040. Székely, F., 1998. Windowed Spatial Zooming in Finite-Difference Ground Water Flow Models, Ground Water, 36(5), 718-721. Van den Akker, J., 2005, Padthaway Salt Accession Study. Volume two: Results. South Australia. Department for Water, Land and Biodiversity Conservation. DWLBC Report 2005/15.
Van den Akker, J., Harrington, N. and Brown, K., 2006, Padthaway Salt Accession Study. Volume 3:
Conceptual Models. South Australia. Department of Water, Land and Biodiversity Conservation. DWLBC
Report 2005/21.
Ward, D.S., D.R. Buss, J.W. Mercer, S.S. Hughes, 1987. Evaluation of a Groundwater Corrective Action at the Chem-Dyne Hazardous Waste Site Using a Telescopic Mesh Refinement Modeling Approach, Water Resources Research, 23(4), 603-617. Waterhouse, J.D., 1977, The hydrogeology of the Mount Gambier area., Report of Investigation Geological Survey of South Australia: 48. Wohling, D., Leaney, F., Davies, P. and Harrington, N., 2005, Groundwater Salinisation in the Naracoorte Ranges Portion of the Padthaway Prescribed Wells Area. South Australia. Department of Water, Land and Biodiversity Conservation. DWLBC Report 2005/27. Wohling, D., 2006, Groundwater salinisation in the Naracoorte Ranges portion of the Padthaway Prescribed Wells Area, DWLBC Technical Report 2005/27.

REFERENCES
Department for Water | Technical Report DFW 2011/12 108 Lower South East Water Balance Project Phase 1 – Review of the conceptual model and recommendations for a Modelling Approach
Wohling, D., 2008, Padthaway Groundwater Flow and Solute Transport Model (PADMOD2): New Abstraction Scenarios Requested by the SENRM Board., Department of Water, Land and Biodiversity Conservation. DWLBC Technical Note 2008/22. June 2008. Wood, C., 2010a, Improved estimates of groundwater recharge in the South East of South Australia, DFW Technical Report 2010/05.
Wood, C., 2010b, Regional Water Balance, in South East Science Review, (ed.) Brookes, J. Report for the
Lower Limestone Coast Taskforce. Cabinet in Confidence.
Wood, G., and Way, D., 2010, Development of a Technical Basis for a Regional Flow Management
Strategy for the South East of South Australia, DWLBC Technical Report 2010/12