Embed Size (px)
Citation preview
EU ETS Phase IV CSCF application and market balanceComparison between the European Commission,
Parliament and Council phase IV proposals
19/05/2017
Ecofys by order of CEMBUREAU
© ECOFYS. A Navigant Company. | |
Ecofys does not warrant any responsibility for any results obtained or
conclusions drawn from Consulting Services provided. Customers and third
parties are advised that they are responsible for reliance on the report, data,
information, findings and opinions provided by Ecofys and for decisions made
based upon the report or conclusions of Ecofys.
Disclaimer
2 19/05/2017
© ECOFYS. A Navigant Company. | |
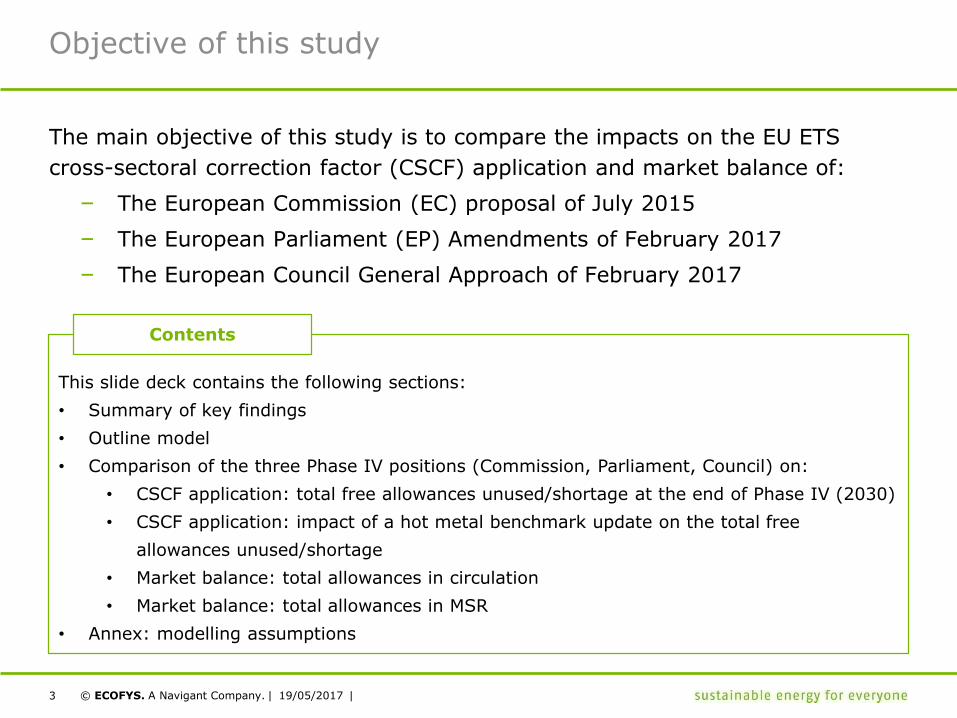
Objective of this study
The main objective of this study is to compare the impacts on the EU ETS
cross-sectoral correction factor (CSCF) application and market balance of:
– The European Commission (EC) proposal of July 2015
– The European Parliament (EP) Amendments of February 2017
– The European Council General Approach of February 2017
This slide deck contains the following sections:
• Summary of key findings
• Outline model
• Comparison of the three Phase IV positions (Commission, Parliament, Council) on:
• CSCF application: total free allowances unused/shortage at the end of Phase IV (2030)
• CSCF application: impact of a hot metal benchmark update on the total free
allowances unused/shortage
• Market balance: total allowances in circulation
• Market balance: total allowances in MSR
• Annex: modelling assumptions
Contents
3 19/05/2017
© ECOFYS. A Navigant Company. | |
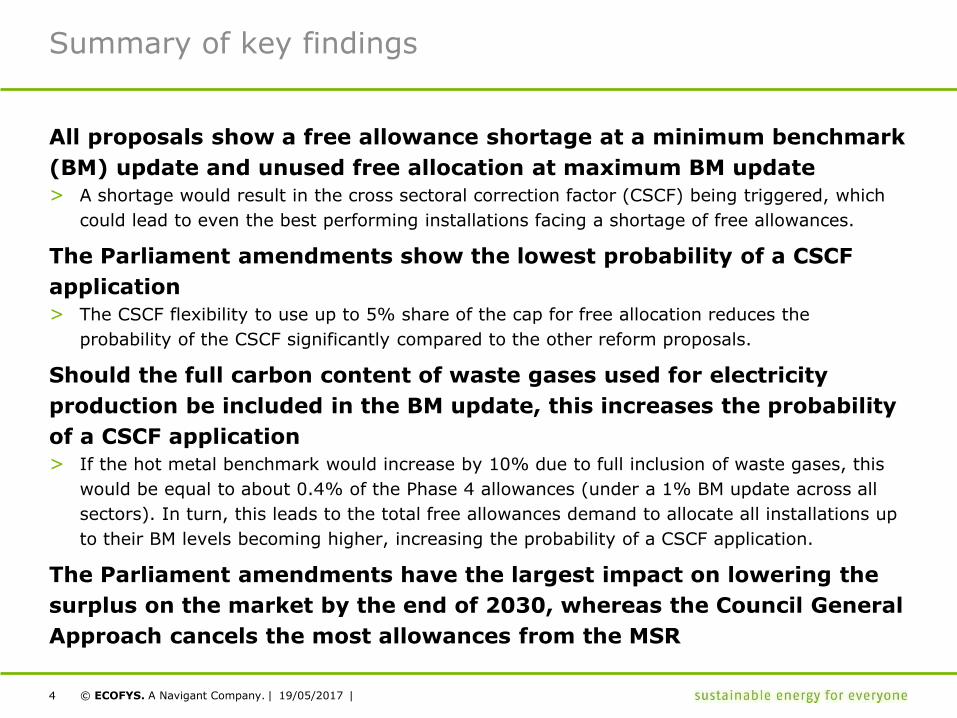
Summary of key findings
All proposals show a free allowance shortage at a minimum benchmark
(BM) update and unused free allocation at maximum BM update
> A shortage would result in the cross sectoral correction factor (CSCF) being triggered, which
could lead to even the best performing installations facing a shortage of free allowances.
The Parliament amendments show the lowest probability of a CSCF
application
> The CSCF flexibility to use up to 5% share of the cap for free allocation reduces the
probability of the CSCF significantly compared to the other reform proposals.
Should the full carbon content of waste gases used for electricity
production be included in the BM update, this increases the probability
of a CSCF application
> If the hot metal benchmark would increase by 10% due to full inclusion of waste gases, this
would be equal to about 0.4% of the Phase 4 allowances (under a 1% BM update across all
sectors). In turn, this leads to the total free allowances demand to allocate all installations up
to their BM levels becoming higher, increasing the probability of a CSCF application.
The Parliament amendments have the largest impact on lowering the
surplus on the market by the end of 2030, whereas the Council General
Approach cancels the most allowances from the MSR
4 19/05/2017
© ECOFYS. A Navigant Company. | |
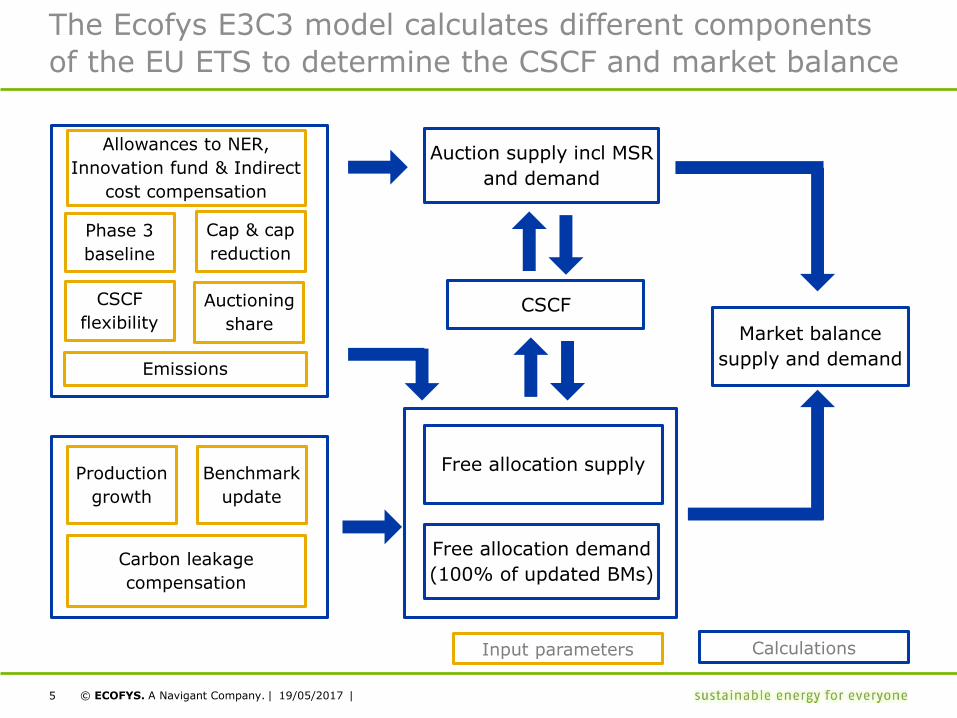
The Ecofys E3C3 model calculates different components
of the EU ETS to determine the CSCF and market balance
Cap & cap
reduction
CalculationsInput parameters
Free allocation supply
Auction supply incl MSR
and demand
CSCF
Free allocation demand
(100% of updated BMs)
Auctioning
share
Allowances to NER,
Innovation fund & Indirect
cost compensation
Production
growth
Benchmark
update
Phase 3
baseline
Carbon leakage
compensation
Market balance
supply and demand
CSCF
flexibility
5 19/05/2017
Emissions
© ECOFYS. A Navigant Company. | |
-819
542
-139
310773
775
-981
117493
536
-476
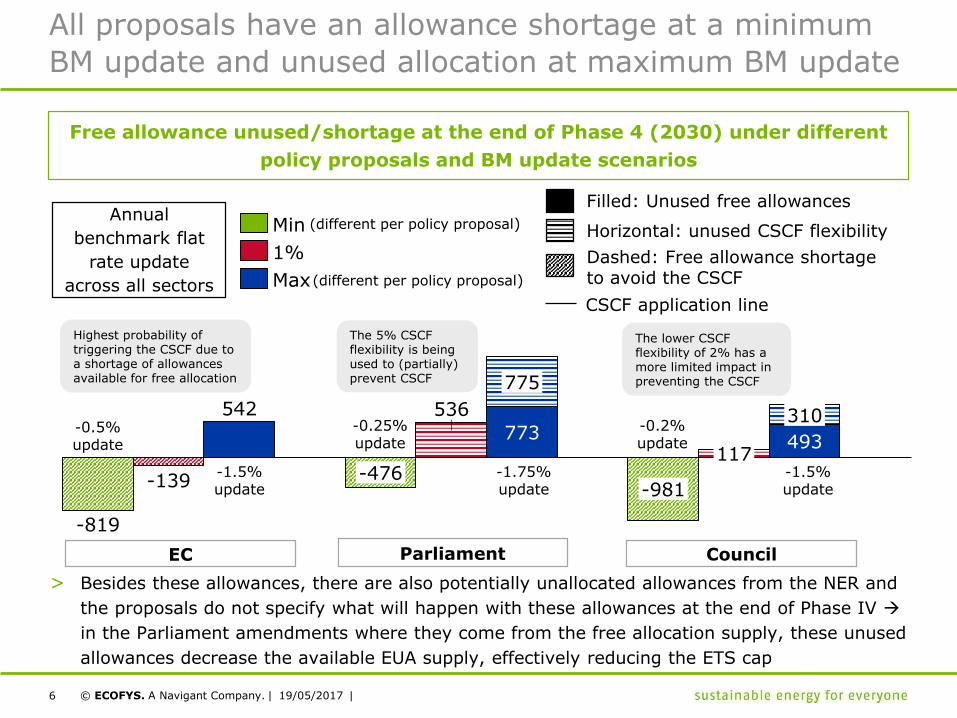
All proposals have an allowance shortage at a minimum
BM update and unused allocation at maximum BM update
> Besides these allowances, there are also potentially unallocated allowances from the NER and
the proposals do not specify what will happen with these allowances at the end of Phase IV
in the Parliament amendments where they come from the free allocation supply, these unused
allowances decrease the available EUA supply, effectively reducing the ETS cap
Free allowance unused/shortage at the end of Phase 4 (2030) under different
policy proposals and BM update scenarios
EC Parliament Council
Annual
benchmark flat
rate update
across all sectors
The 5% CSCF flexibility is beingused to (partially) prevent CSCF
Max
1%
Min
Highest probability of triggering the CSCF due to a shortage of allowances available for free allocation
Dashed: Free allowance shortage to avoid the CSCF
Horizontal: unused CSCF flexibility
CSCF application line
Filled: Unused free allowances
The lower CSCF flexibility of 2% has a more limited impact in preventing the CSCF
-0.5%update
-0.25%update
-0.2%update
-1.5%update
-1.75%update
-1.5%update
6
(different per policy proposal)
(different per policy proposal)
19/05/2017
© ECOFYS. A Navigant Company. | |
717
775
469
-554-1,060
43350
310482
-893
-206
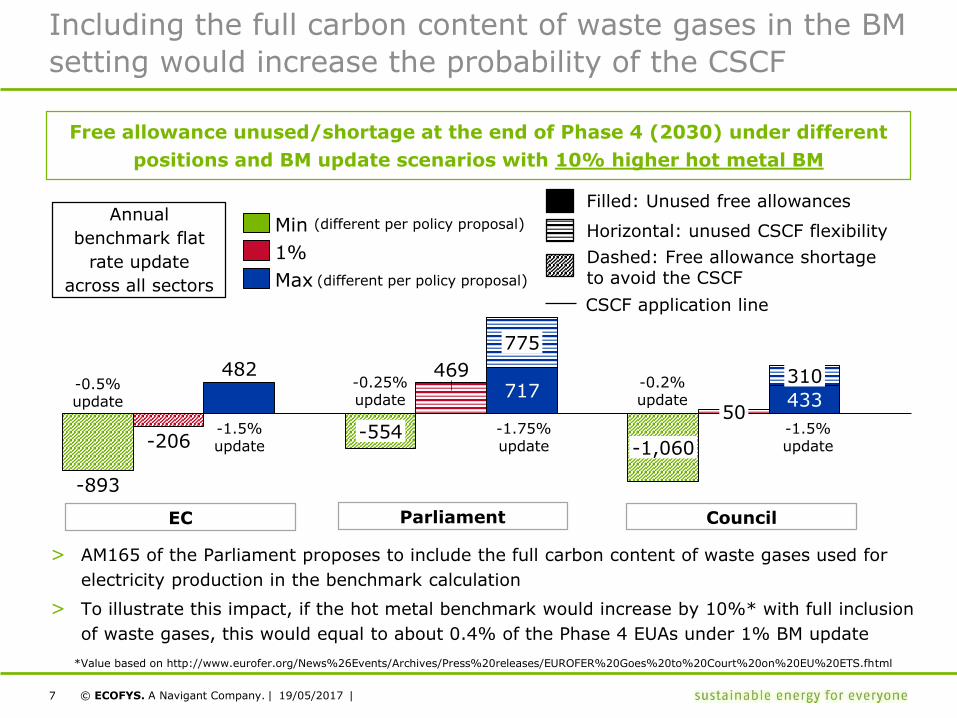
Including the full carbon content of waste gases in the BM
setting would increase the probability of the CSCF
> AM165 of the Parliament proposes to include the full carbon content of waste gases used for
electricity production in the benchmark calculation
> To illustrate this impact, if the hot metal benchmark would increase by 10%* with full inclusion
of waste gases, this would equal to about 0.4% of the Phase 4 EUAs under 1% BM update
Free allowance unused/shortage at the end of Phase 4 (2030) under different
positions and BM update scenarios with 10% higher hot metal BM
EC Parliament Council
Min
Max
1%
-0.5%update
-0.25%update
-0.2%update
-1.5%update
-1.75%update
-1.5%update
7
Dashed: Free allowance shortage to avoid the CSCF
Horizontal: unused CSCF flexibility
CSCF application line
Filled: Unused free allowances
(different per policy proposal)
(different per policy proposal)
Annual
benchmark flat
rate update
across all sectors
*Value based on http://www.eurofer.org/News%26Events/Archives/Press%20releases/EUROFER%20Goes%20to%20Court%20on%20EU%20ETS.fhtml
19/05/2017
© ECOFYS. A Navigant Company. | |
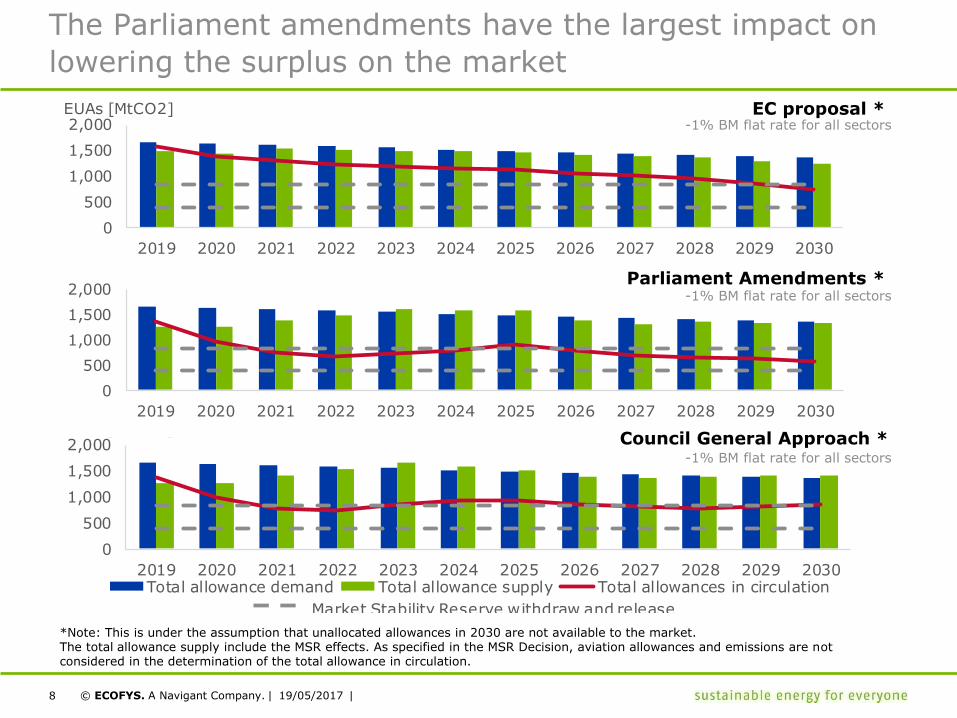
The Parliament amendments have the largest impact on
lowering the surplus on the market
Parliament Amendments *-1% BM flat rate for all sectors
EC proposal *-1% BM flat rate for all sectors
*Note: This is under the assumption that unallocated allowances in 2030 are not available to the market.The total allowance supply include the MSR effects. As specified in the MSR Decision, aviation allowances and emissions are not considered in the determination of the total allowance in circulation.
Council General Approach *-1% BM flat rate for all sectors
8
0
500
1,000
1,500
2,000
2019 2020 2021 2022 2023 2024 2025 2026 2027 2028 2029 2030
EUAs [MtCO2]
Total allowance demand Total allowance supply Total allowances in circulation
Market Stability Reserve withdraw and release thresholds
0
500
1,000
1,500
2,000
2019 2020 2021 2022 2023 2024 2025 2026 2027 2028 2029 2030
EUAs [MtCO2]
Total allowance demand Total allowance supply Total allowances in circulation
Market Stability Reserve withdraw and release
0
500
1,000
1,500
2,000
2019 2020 2021 2022 2023 2024 2025 2026 2027 2028 2029 2030
EUAs [MtCO2]
Total allowance demand Total allowance supply Total allowances in circulation
Market Stability Reserve withdraw and release
19/05/2017
© ECOFYS. A Navigant Company. | |
-2,000
-1,000
0
1,000
2,000
3,000
2019 2020 2021 2022 2023 2024 2025 2026 2027 2028 2029 2030
EUAs to the NEREUAs cancelledEUAs to the Innovation fundLeftover non-CL EUAs Phase IIIUnallocated EUAs Phase IIIEUAs from backloadingRegular MSR mechanism
EUAs withheld (+) or released (-) in the MSR [MtCO2e]
-2,000
-1,000
0
1,000
2,000
3,000
2019 2020 2021 2022 2023 2024 2025 2026 2027 2028 2029 2030
EUAs cancelledEUAs to the Innovation fundLeftover non-CL EUAs Phase IIIUnallocated EUAs Phase IIIEUAs from backloadingRegular MSR mechanismTotal EUAs in the MSRTotal allowances in circulation
EUAs withheld (+) or released (-) in the MSR [MtCO2e]
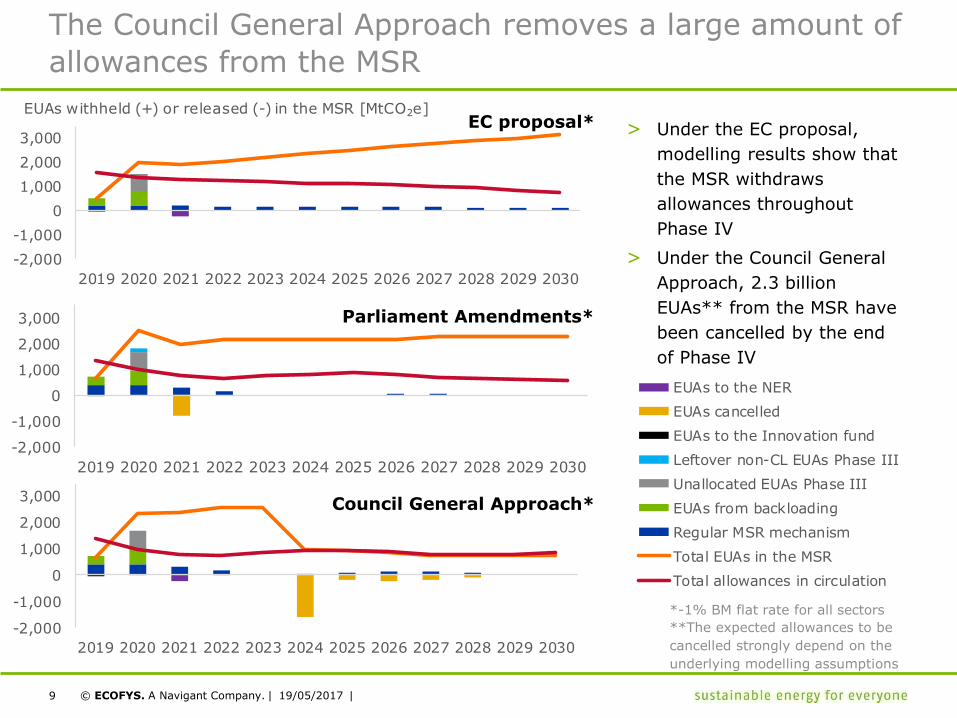
The Council General Approach removes a large amount of
allowances from the MSR
*-1% BM flat rate for all sectors
EC proposal*
Parliament Amendments*
Council General Approach*
-2,000
-1,000
0
1,000
2,000
3,000
2019 2020 2021 2022 2023 2024 2025 2026 2027 2028 2029 2030
EUAs to the NER
EUAs cancelled
EUAs to the Innovation fund
Leftover non-CL EUAs Phase III
Unallocated EUAs Phase III
EUAs from backloading
Regular MSR mechanism
Total EUAs in the MSR
Total allowances in circulation
EUAs withheld (+) or released (-) in the MSR [MtCO2e]
9
> Under the EC proposal,
modelling results show that
the MSR withdraws
allowances throughout
Phase IV
> Under the Council General
Approach, 2.3 billion
EUAs** from the MSR have
been cancelled by the end
of Phase IV
-2,000
-1,000
0
1,000
2,000
3,000
2019 2020 2021 2022 2023 2024 2025 2026 2027 2028 2029 2030
EUAs to the NER
EUAs to the Innovation fund
Unallocated EUAs Phase III
EUAs from backloading
Regular MSR mechanism
Total EUAs in the MSR
Total allowances in circulation
EUAs withheld (+) or released (-) in the MSR [MtCO2e]
**The expected allowances to be
cancelled strongly depend on the
underlying modelling assumptions
19/05/2017
© ECOFYS. A Navigant Company. | |
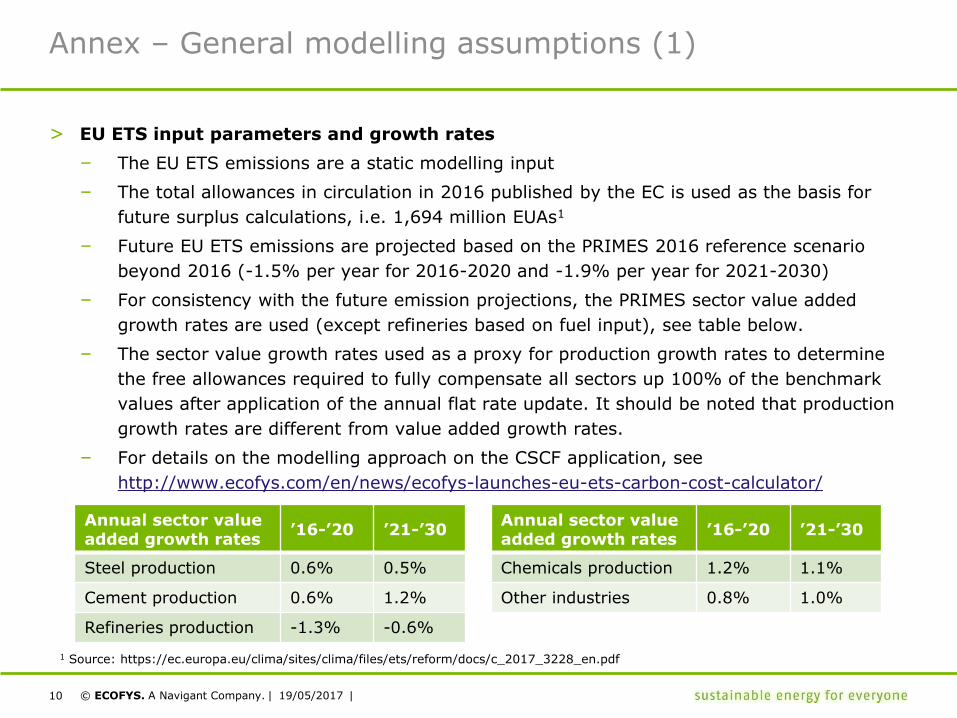
Annex – General modelling assumptions (1)
> EU ETS input parameters and growth rates
– The EU ETS emissions are a static modelling input
– The total allowances in circulation in 2016 published by the EC is used as the basis for
future surplus calculations, i.e. 1,694 million EUAs1
– Future EU ETS emissions are projected based on the PRIMES 2016 reference scenario
beyond 2016 (-1.5% per year for 2016-2020 and -1.9% per year for 2021-2030)
– For consistency with the future emission projections, the PRIMES sector value added
growth rates are used (except refineries based on fuel input), see table below.
– The sector value growth rates used as a proxy for production growth rates to determine
the free allowances required to fully compensate all sectors up 100% of the benchmark
values after application of the annual flat rate update. It should be noted that production
growth rates are different from value added growth rates.
– For details on the modelling approach on the CSCF application, see
http://www.ecofys.com/en/news/ecofys-launches-eu-ets-carbon-cost-calculator/
10
Annual sector value added growth rates
’16-’20 ’21-’30
Steel production 0.6% 0.5%
Cement production 0.6% 1.2%
Refineries production -1.3% -0.6%
Annual sector value added growth rates
’16-’20 ’21-’30
Chemicals production 1.2% 1.1%
Other industries 0.8% 1.0%
1 Source: https://ec.europa.eu/clima/sites/clima/files/ets/reform/docs/c_2017_3228_en.pdf
19/05/2017
© ECOFYS. A Navigant Company. | |
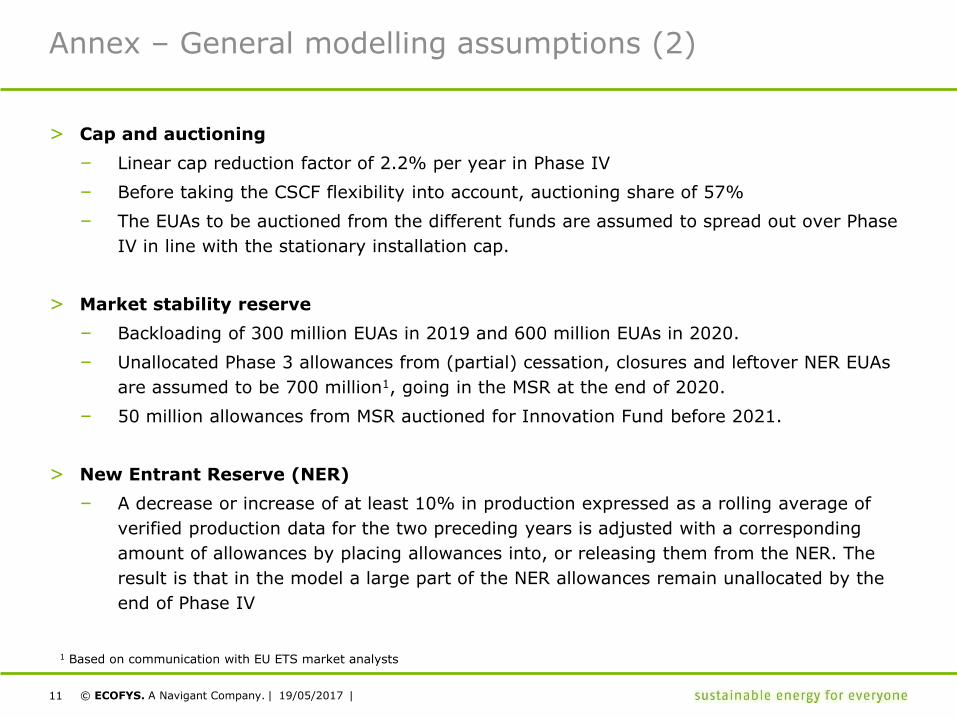
Annex – General modelling assumptions (2)
> Cap and auctioning
– Linear cap reduction factor of 2.2% per year in Phase IV
– Before taking the CSCF flexibility into account, auctioning share of 57%
– The EUAs to be auctioned from the different funds are assumed to spread out over Phase
IV in line with the stationary installation cap.
> Market stability reserve
– Backloading of 300 million EUAs in 2019 and 600 million EUAs in 2020.
– Unallocated Phase 3 allowances from (partial) cessation, closures and leftover NER EUAs
are assumed to be 700 million1, going in the MSR at the end of 2020.
– 50 million allowances from MSR auctioned for Innovation Fund before 2021.
> New Entrant Reserve (NER)
– A decrease or increase of at least 10% in production expressed as a rolling average of
verified production data for the two preceding years is adjusted with a corresponding
amount of allowances by placing allowances into, or releasing them from the NER. The
result is that in the model a large part of the NER allowances remain unallocated by the
end of Phase IV
11
1 Based on communication with EU ETS market analysts
19/05/2017
© ECOFYS. A Navigant Company. | |
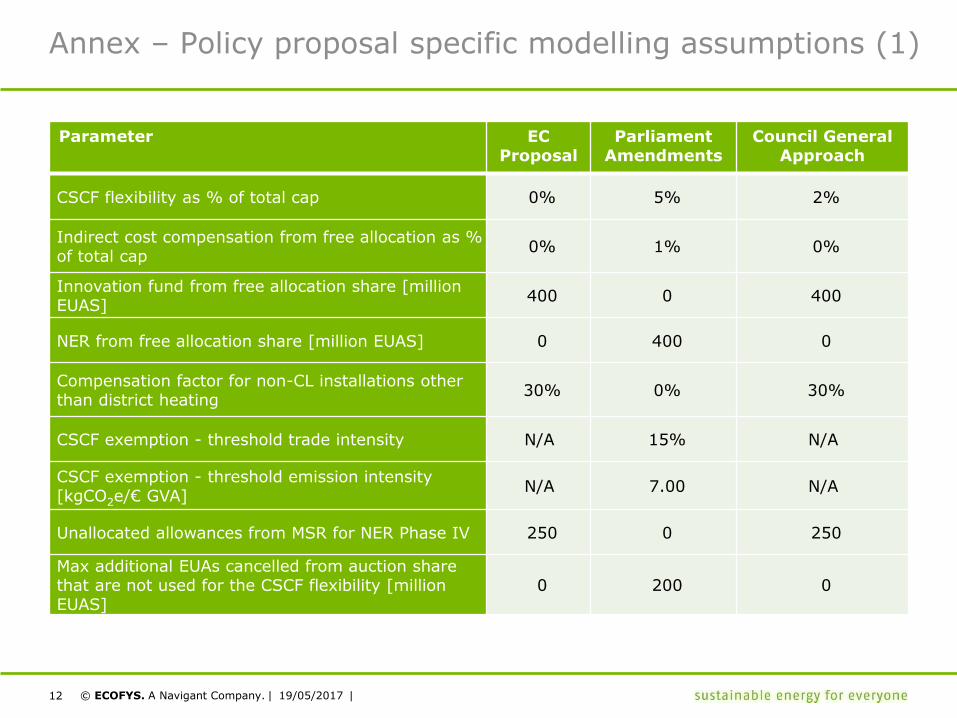
Annex – Policy proposal specific modelling assumptions (1)
Parameter ECProposal
ParliamentAmendments
Council General Approach
CSCF flexibility as % of total cap 0% 5% 2%
Indirect cost compensation from free allocation as % of total cap
0% 1% 0%
Innovation fund from free allocation share [million EUAS]
400 0 400
NER from free allocation share [million EUAS] 0 400 0
Compensation factor for non-CL installations other than district heating
30% 0% 30%
CSCF exemption - threshold trade intensity N/A 15% N/A
CSCF exemption - threshold emission intensity [kgCO2e/€ GVA]
N/A 7.00 N/A
Unallocated allowances from MSR for NER Phase IV 250 0 250
Max additional EUAs cancelled from auction share that are not used for the CSCF flexibility [million EUAS]
0 200 0
12 19/05/2017
© ECOFYS. A Navigant Company. | |
Annex – Policy proposal specific modelling assumptions (2)
> Leftover non-CL allowances from the CSCF calculation are assumed to be 145 million1:
– Going into the MSR at the end of 2020 under the EP Amendments
– Going into the NER at the end of 2020 under the EC proposal and Council General
Approach
> The MSR withholding quantity doubles from 12% to 24% of the total allowances in
circulation:
– In the first four years of the start of the MSR (2019) under the EP Amendments
– In the first five years of the start of the MSR (2019) under the Council General Approach
> The MSR release quantity doubles from 100 million to 200 million EUAs in the first five
years of the MSR operation (2019) under the Council general approach
> The quantity of allowances in the MSR are cancelled:
– 800 million EUAs in 2021 under the EP amendments
– The difference between the EUAs in MSR in a certain year and the auction volume of the
previous year from 2024 onwards under the Council general approach
13
1 Source: https://ec.europa.eu/clima/sites/clima/files/ets/revision/docs/impact_assessment_en.pdf
19/05/2017

© ECOFYS. A Navigant Company. | |
Contact details
ECOFYS GROUPKanaalweg 15-G3526 KL Utrecht – The Netherlands
ECOFYS GERMANY (COLOGNE)Am Wassermann 3650829 Cologne – Germany
ECOFYS GERMANY (BERLIN)Albrechtstraße 10 c10117 Berlin – Germany
ECOFYS UKWoolgate Exchange – 25 Basinghall StreetLondon EC2V 5HA – United Kingdom
ECOFYS BELGIUMAvenue Marnix 281000 Brussels – Belgium
Find the full set of offices here.
www.ecofys.com
14 19/05/2017

© ECOFYS. A Navigant Company. | |
sustainable energy
for everyone
15 19/05/2017