Embed Size (px)
Citation preview
NASA Technical Memorandum 104641
Low Temperature Creep of a Titanium
Alloy Ti-6AI-2Cb- 1Ta-0.8Mo
H. P. Chu
NASA Goddard Space Flight Center
Greenbelt, Maryland
National Aeronautics and
Space Administration
Goddard Space Flight CenterGreenbelt, Maryland 20771
1997
https://ntrs.nasa.gov/search.jsp?R=19970015288 2018-05-25T20:09:29+00:00Z

This publication is available from the NASA Center for AeroSpace Information,
l 800__Elkridge Landing Road, Linthicum Heights, MD 21090-2_93_4, (301) 621-0390.
LOW TEMPERATURE CREEP OF A TITANIUM ALLOY Ti-6AI-2Cb-ITa-0.8Mo
H. P. Chu
NASA Goddard Space Flight Center
Greenbelt, MD 20771
Abstract
This paper presents a methodology for the analysis of low temperature creep of titanium
alloys in order to establish design limitations due to the effect of creep. The creep data on a
titanimum Ti-6A1-2Cb-1Ta-0.8Mo are used in the analysis. A creep equation is formulated
to determine the allowable stresses so that creep at ambient temperatures can be kept within
an acceptable limit during the service life of engineering structures or instruments.
Microcreep which is important to design of precision instruments is included in the discus-sion also.
Introduction
Titanium alloys have the intrinsic property of creep
at ambient temperatures. Previous work has shown
that commonly used alloys such as Ti-6A1-4V would
creep at stress levels below yield strength at room
temperature (1). This work is to study creep of a
titanium alloy in a range of low temperatures that
may exist both in low Earth orbit and in hydrospaceenvironment. The material tested was titanium al-
loy Ti-6AI-2Cb-ITa-0.8Mo (Ti-6211). Chu (2) has
studied creep and stress relaxation of this alloy at
room temperature. The alloy has been developed
for marine applications with excellent weldability,
fracture toughness, and stress corrosion resistance
(3, 4). It should be also suitable for space and other
applications where such properties are at a premium.
Experimental Procedure
Material and Specimens
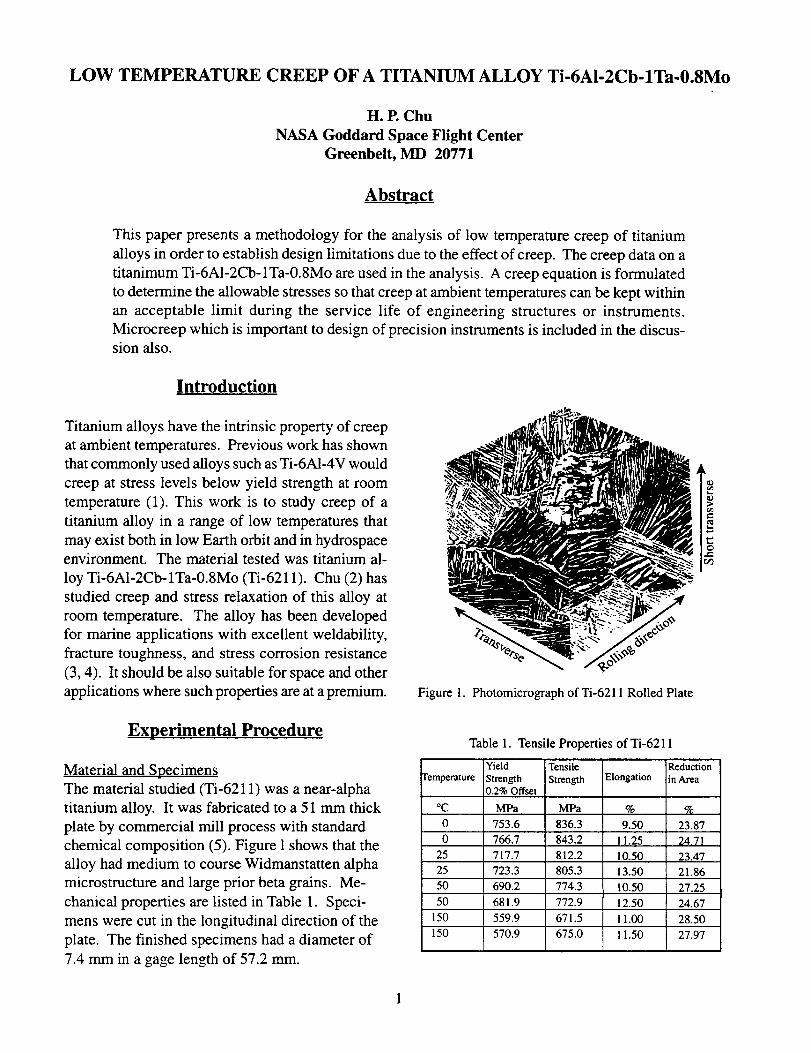
The material studied (Ti-6211) was a near-alpha
titanium alloy. It was fabricated to a 51 mm thick
plate by commercial mill process with standard
chemical composition (5). Figure 1 shows that the
alloy had medium to course Widmanstatten alpha
microstructure and large prior beta grains. Me-
chanical properties are listed in Table 1. Speci-
mens were cut in the longitudinal direction of the
plate. The finished specimens had a diameter of
7.4 mm in a gage length of 57.2 mm.
,@. _s
" L
Figure 1. Photomicrograph of Ti-6211 Rolled Plate
Table 1. Tensile Properties ofTi-6211
Yield Tensile
remperature Strength Strength Elongation0.2% Offset
°C MPa MPa %
0 753.6 836.3 9.50
0 766.7 843.2 I 1.25
25 717.7 812.2 10.50
25 723.3 805.3 13.50
50 690.2 774.3 10.50
50 681.9 772.9 12.50
150 559.9 671.5 11.00
150 570.9 675.0 11.50
Reductionin Area
ok23.87
24.71
23.47
21.86
27.25
24.67
28.50
27.97
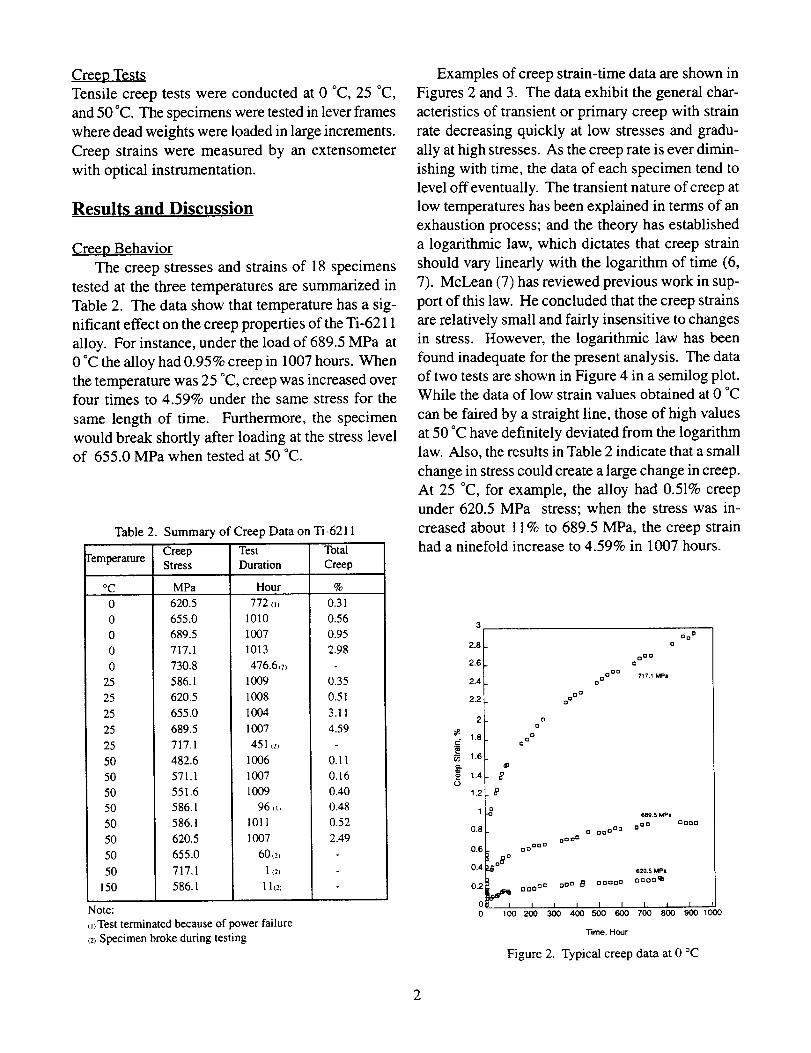
Creep Tests
Tensile creep tests were conducted at 0 °C, 25 °C,
and 50 °C. The specimens were tested in lever frames
where dead weights were loaded in large increments.
Creep strains were measured by an extensometer
with optical instrumentation.
Results and Discussion
Creep Behavior
The creep stresses and strains of 18 specimens
tested at the three temperatures are summarized in
Table 2. The data show that temperature has a sig-
nificant effect on the creep properties of the Ti-6211
alloy. For instance, under the load of 689.5 MPa at
0 °C the alloy had 0.95% creep in 1007 hours. When
the temperature was 25 °C, creep was increased over
four times to 4.59% under the same stress for the
same length of time. Furthermore, the specimen
would break shortly after loading at the stress level
of 655.0 MPa when tested at 50 °C.
Table 2. Summary of Creep Data on Ti-6211
CreepFemperature Stress
oC
0
0
0
0
0
25
25
25
25
25
5O
5O
5O
5O
5O
5O
5O
5O
150
MPa Hour
620.5 772 ._
655.0 1010
689.5 1007
717.1 1013
730.8 476.612_
586.1 1009
620.5 1008
655.0 1004
689.5 1007
717.1 451 a>
482.6 11306
Test Total
Duration Creep
%
0.31
0.56
0.95
2.98
0.35
0.51
3.11
4.59
0.11
0.16
0.40
0.48
0.52
2.49
571.1
551.6
586.1
586.1
620.5
655.0
717.1
586.1
1007
1009
96 ill
1011
1007
6012_
1 (2)
11 _2_
Note:
. _Test terminated because of power failure
cz_Specimen broke during testing
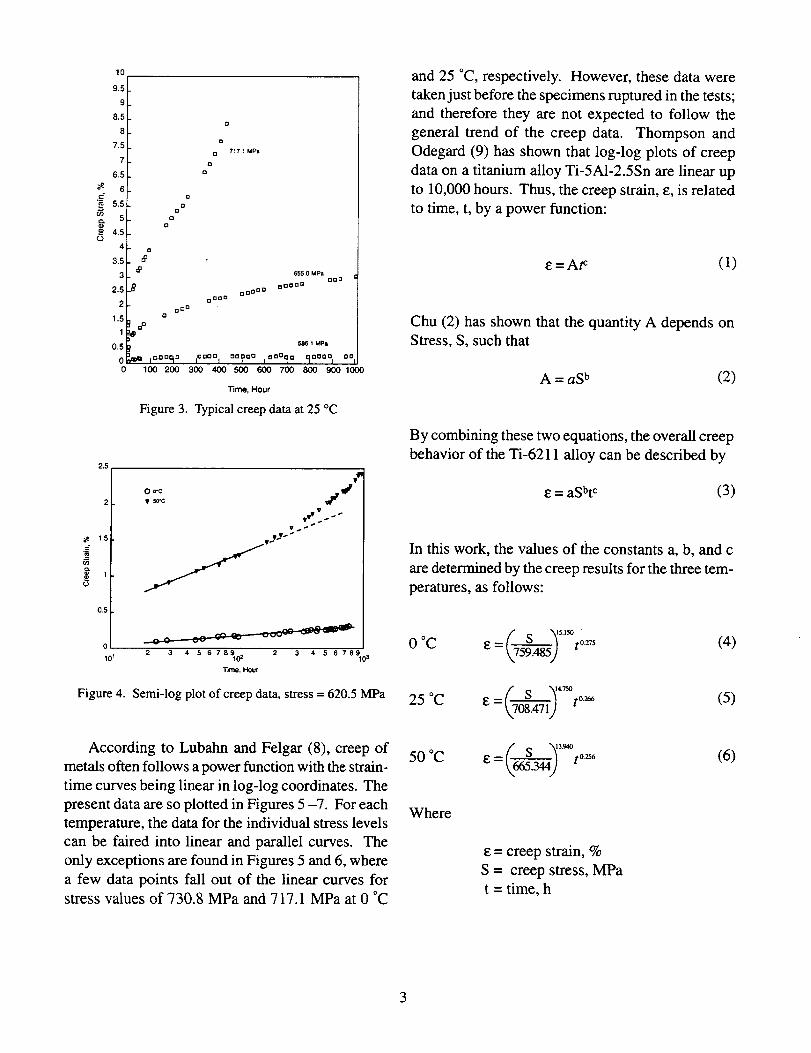
Examples of creep strain-time data are shown in
Figures 2 and 3. The data exhibit the general char-
acteristics of transient or primary creep with strain
rate decreasing quickly at low stresses and gradu-
ally at high stresses. As the creep rate is ever dimin-
ishing with time, the data of each specimen tend to
level off eventually. The transient nature of creep at
low temperatures has been explained in terms of an
exhaustion process; and the theory has established
a logarithmic law, which dictates that creep strain
should vary linearly with the logarithm of time (6,
7). McLean (7) has reviewed previous work in sup-
port of this law. He concluded that the creep strains
are relatively small and fairly insensitive to changes
in stress. However, the logarithmic law has been
found inadequate for the present analysis. The data
of two tests are shown in Figure 4 in a semilog plot.While the data of low strain values obtained at 0 °C
can be faired by a straight line, those of high values
at 50 °C have definitely deviated from the logarithm
law. Also, the results in Table 2 indicate that a small
change in stress could create a large change in creep.
At 25 °C, for example, the alloy had 0.51% creep
under 620.5 MPa stress; when the stress was in-
creased about 11% to 689.5 MPa, the creep strain
had a ninefold increase to 4.59% in 1007 hours.
3
2.8
2.6
2.4
2.2
2
#. 1.8
.c
1.6g-
1.40
1.2
1
0.8
0,6
0.4
0.2
0
0
oo o°
oooo
o
o
° og°
7_7.1 MPa
oo °
oo
o
o o
g
689.5 MPa
0000o oo
o oo o°D
oO _o
oo boo
o8 °
620.5 MPa
9 'a_b- ooOOC: oOO e ooooO ooooqb
I I I I I I I t 1100 200 300 400 500 600 700 800 900 1000
Time, Hour
Figure 2. Typical creep data at 0 °C
._e
==o
(D
10
9.5
9
8.5
8
7.5
7
6.5
6t=
5.5 ° o5 o
o4.5
4
3.5 d_°
3
2.5
2OD o
1,5 O
_P1
0.5
0 lOO 200
o
o
o 717.1MPa
o
o
oooooOO oo
ooo
5861 MPa
laaoo I oo_aO laoa_a 900001 oc300 4OO 5O0 60O 700 800 900 1000
Time, Hour
Figure 3. Typical creep data at 25 °C
2.5
1.5
¢
u)
0.5
T $0"C
2 3 • 5 6789_ 2 3 4 s 6ra%_33roe, Hour
Figure 4. Semi-log plot of creep data, stress = 620.5 MPa
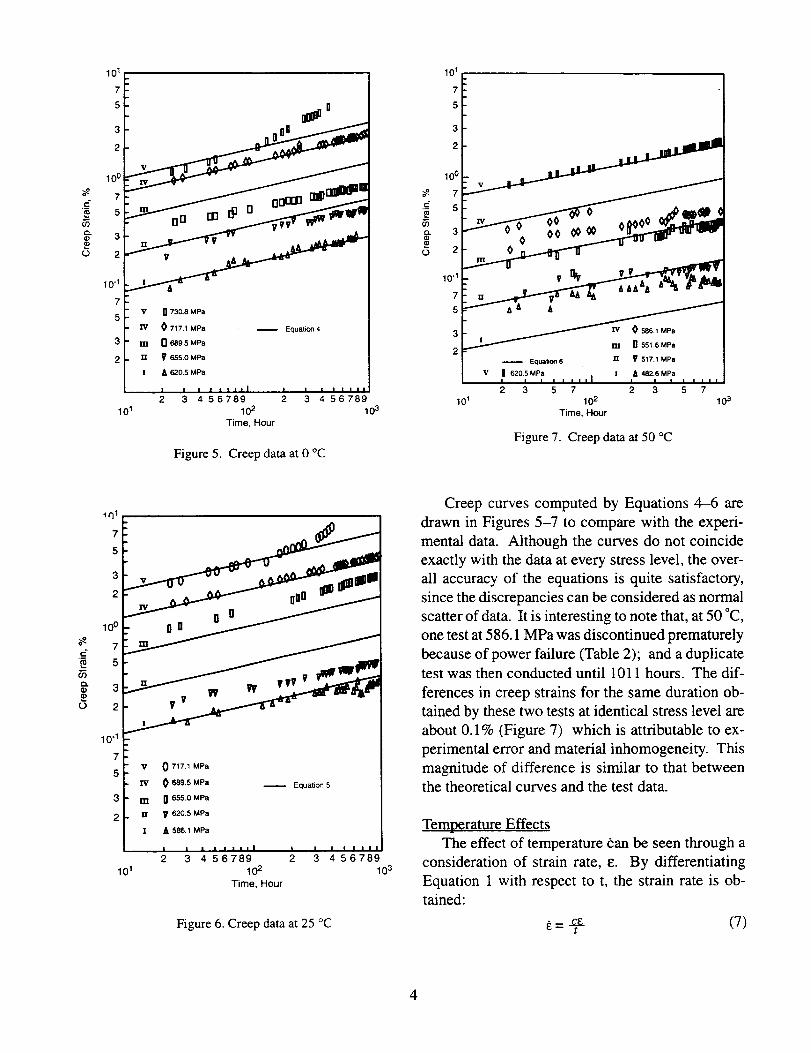
According to Lubahn and Felgar (8), creep of
metals often follows a power function with the strain-
time curves being linear in log-log coordinates. The
present data are so plotted in Figures 5 -7. For each
temperature, the data for the individual stress levels
can be faired into linear and parallel curves. The
only exceptions are found in Figures 5 and 6, where
a few data points fall out of the linear curves forstress values of 730.8 MPa and 717.1 MPa at 0 °C
and 25 °C, respectively. However, these data were
taken just before the specimens ruptured in the tests;
and therefore they are not expected to follow the
general trend of the creep data. Thompson and
Odegard (9) has shown that log-log plots of creep
data on a titanium alloy Ti-5A1-2.5Sn are linear up
to 10,000 hours. Thus, the creep strain, e, is related
to time, t, by a power function:
e=Ar: (1)
Chu (2) has shown that the quantity A depends onStress, S, such that
A = aS b (2)
By combining these two equations, the overall creep
behavior of the Ti-6211 alloy can be described by
e = aSbt c (3)
In this work, the values of the constants a, b, and c
are determined by the creep results for the three tem-
peratures, as follows:
ooc (_s .y, o=Z= _,.75-_--_._5jto.=, (4)
25 °C _ = to=_ (5)
5ooc (_s .y.,oe=_,) to._ (6)
Where
= creep strain, %
S = creep stress, MPa
t = time, h
3
101 101 ,
s Oleo rt
3
2
I
101
0 717.1MPa
m n 689.5MPa
rr V 655.0MPa
A 620,5 MPa
I I I I I IIII2 3 4 56789
102
Time, Hour
Equation 4
l l l l I I I l
2 3 4 56789
lo3
Figure 5. Creep data at 0 °C
Figure 7. Creep data at 50 °C
Ir11 £ 1
10"1
7v
5
3 m
2 n
I
101
0 717.1 MPa
0 689.5 MPa -- Equat_c*n5
0 655.0 MPa
V 620.5 MPa
A 586,1 MPa
I I I I I I III | I
2 3 4 56789 2 3
lO2Time, Hour
I a I I n i
4 56789
10:3
Figure 6. Creep data at 25 °C
Creep curves computed by Equations 4-6 are
drawn in Figures 5-7 to compare with the experi-
mental data. Although the curves do not coincide
exactly with the data at every stress level, the over-
all accuracy of the equations is quite satisfactory,
since the discrepancies can be considered as normal
scatter of data. It is interesting to note that, at 50 °C,
one test at 586.1 MPa was discontinued prematurely
because of power failure (Table 2); and a duplicate
test was then conducted until 1011 hours. The dif-
ferences in creep strains for the same duration ob-
tained by these two tests at identical stress level are
about 0.1% (Figure 7) which is attributable to ex-
perimental error and material inhomogeneity. This
magnitude of difference is similar to that betweenthe theoretical curves and the test data.
Temperature Effects
The effect of temperature _an be seen through a
consideration of strain rate, E. By differentiating
Equation 1 with respect to t, the strain rate is ob-tained:
= t-_ (7)
4
Combining Equation 7 with Equation 3, the expres-
sion of creep behavior can be changed to the fol-
lowing form:
S = Ke"_:" (8)
Where K = strength coefficient
m = strain hardening exponent
n = strain rate exponent
For the three test temperatures Equation 8 be-
comes
0 °C S = 777.494e°.°48t °m 8 (9)
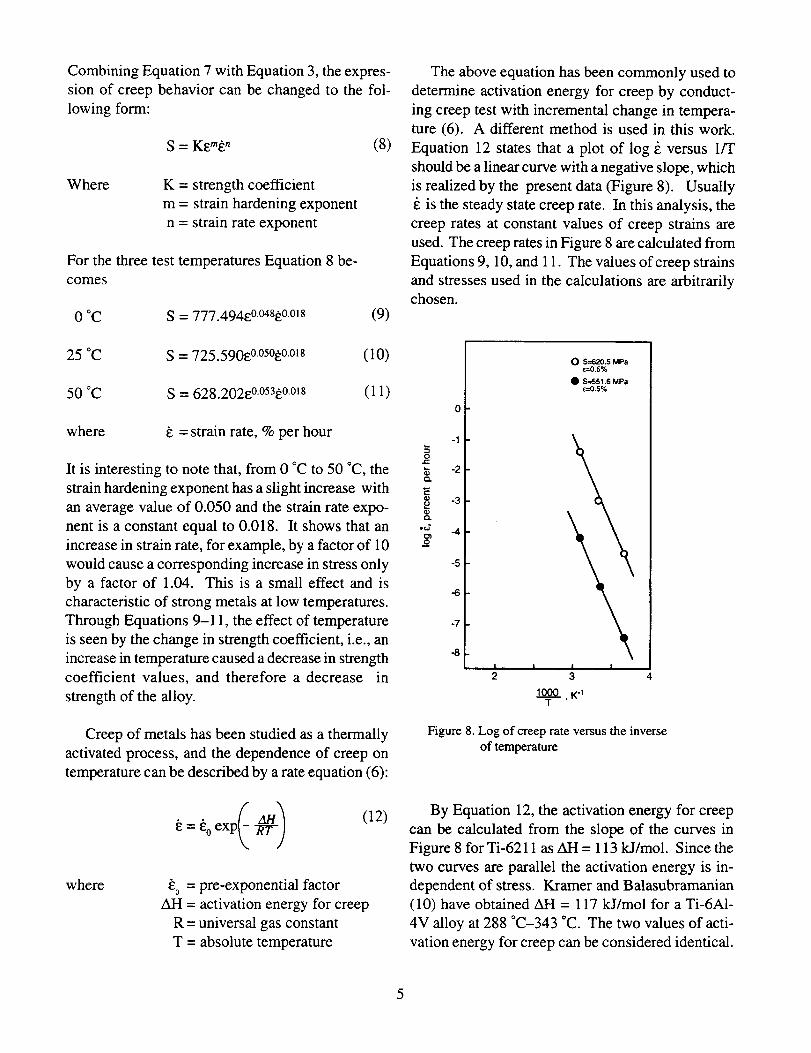
The above equation has been commonly used to
determine activation energy for creep by conduct-
ing creep test with incremental change in tempera-
ture (6). A different method is used in this work.
Equation 12 states that a plot of log _ versus 1/T
should be a linear curve with a negative slope, which
is realized by the present data (Figure 8). Usually
is the steady state creep rate. In this analysis, the
creep rates at constant values of creep strains are
used. The creep rates in Figure 8 are calculated from
Equations 9, 10, and 11. The values of creep strains
and stresses used in the calculations are arbitrarilychosen.
25 °C S = 725.590@050@ °18 (10)
50 °C S = 628.202@.°53@ -°l8 (11)
where g = strain rate, % per hour
It is interesting to note that, from 0 °C to 50 °C, the
strain hardening exponent has a slight increase with
an average value of 0.050 and the strain rate expo-
nent is a constant equal to 0.018. It shows that an
increase in strain rate, for example, by a factor of 10
would cause a corresponding increase in stress only
by a factor of 1.04. This is a small effect and is
characteristic of strong metals at low temperatures.
Through Equations 9-11, the effect of temperature
is seen by the change in strength coefficient, i.e., an
increase in temperature caused a decrease in strength
coefficient values, and therefore a decrease in
strength of the alloy.
Creep of metals has been studied as a thermally
activated process, and the dependence of creep on
temperature can be described by a rate equation (6):
(12)
where /_0 = pre-exponential factor
AH = activation energy for creep
R = universal gas constant
T = absolute temperature
oc-
o
e_
°_"
o
0
-1
-2
-3
-4
-5
-6
-7
-8
0 S--620.5 MPa_-0.5%
• S=551.6 MPa_-0.5%
I I I I
2 3 4
1000 ,K-1T
Figure 8. Log of creep rate versus the inverse
of temperature
By Equation 12, the activation energy for creep
can be calculated from the slope of the curves in
Figure 8 for Ti-6211 as AH = 113 kJ/mol. Since the
two curves are parallel the activation energy is in-
dependent of stress. Kramer and Balasubramanian
(10) have obtained AH = 117 kJ/mol for a Ti-6AI-
4V alloy at 288 °C-343 °C. The two values of acti-
vation energy for creep can be considered identical.
5
It is importanttonotethatLibanatiandDyment(11)havedeterminedthe activationenergyfor self dif-fusion in alphatitanium as 123kJ/molat 690 °C-850°C. Theseactivationenergyvaluesarepracti-cally thesame.This is consistentwith thecorrela-tionbetweencreepandselfdiffusionestablishedbyDorn andSherbyfor variousmetals(12,13). It in-dicatesthat creepof alphatitanium alloys,includ-ing Ti-6211,involvesa single,diffusion-controlledprocessat0 °C-850 °C.
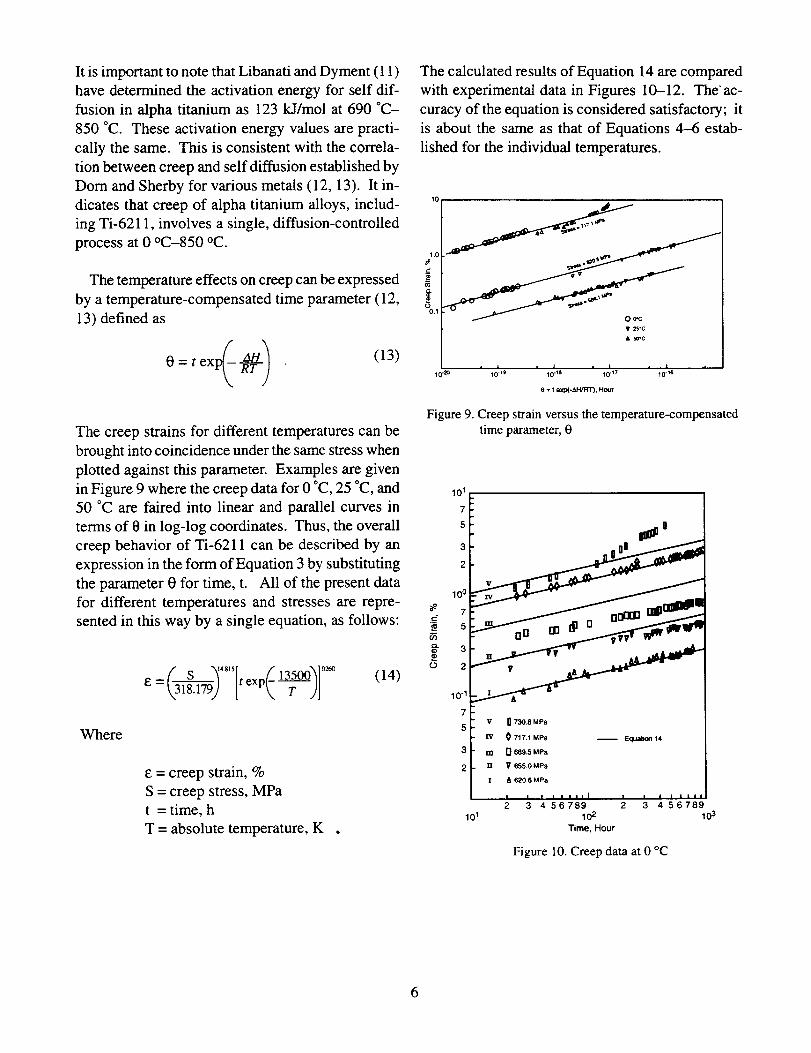
Thetemperatureeffectsoncreepcanbeexpressedby atemperature-compensatedtimeparameter(12,13)definedas
(13)
Thecreepstrainsfor differenttemperaturescanbebroughtintocoincidenceunderthesamestresswhenplottedagainstthis parameter.ExamplesaregiveninFigure9 wherethecreepdatafor 0 °C,25°C,and50 °C are faired into linear andparallelcurvesintermsof 0 in log-log coordinates.Thus,theoverallcreepbehaviorof Ti-6211 canbedescribedby anexpressionin theform of Equation3by substitutingtheparameter0 for time,t. All of thepresentdatafor different temperaturesand stressesare repre-sentedin this wayby asingleequation,asfollows:
£ = t exp(14)
Where
= creep strain, %
S = creep stress, MPa
t = time, h
T = absolute temperature, K
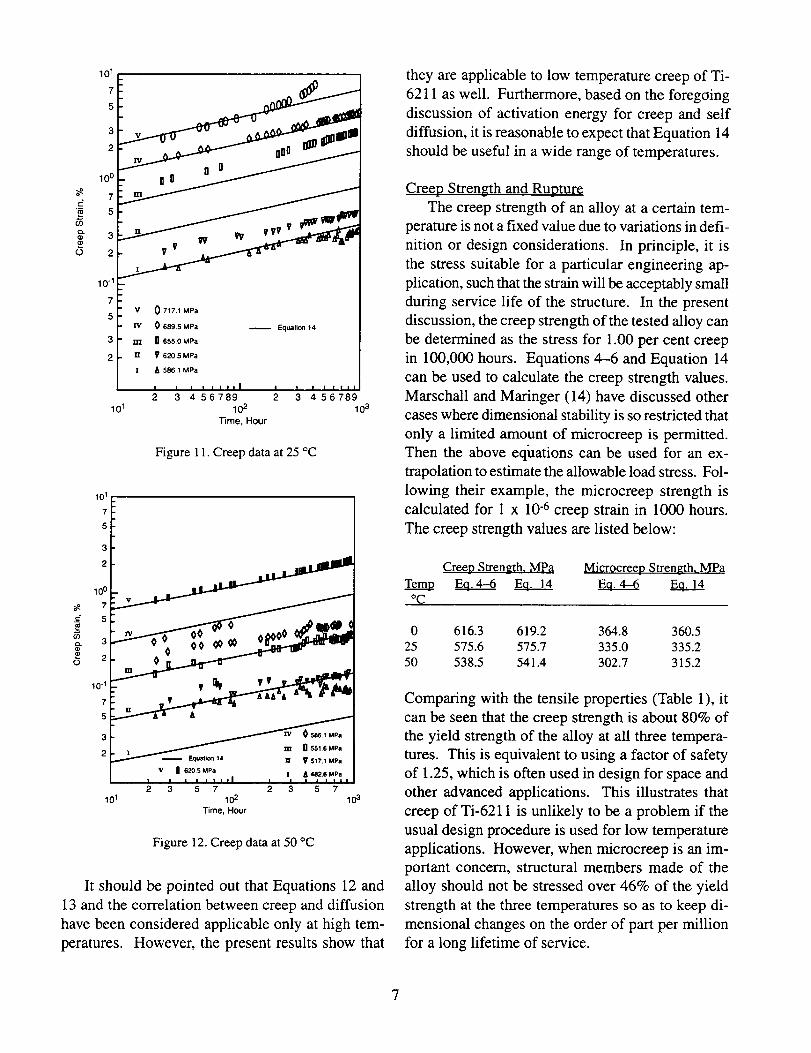
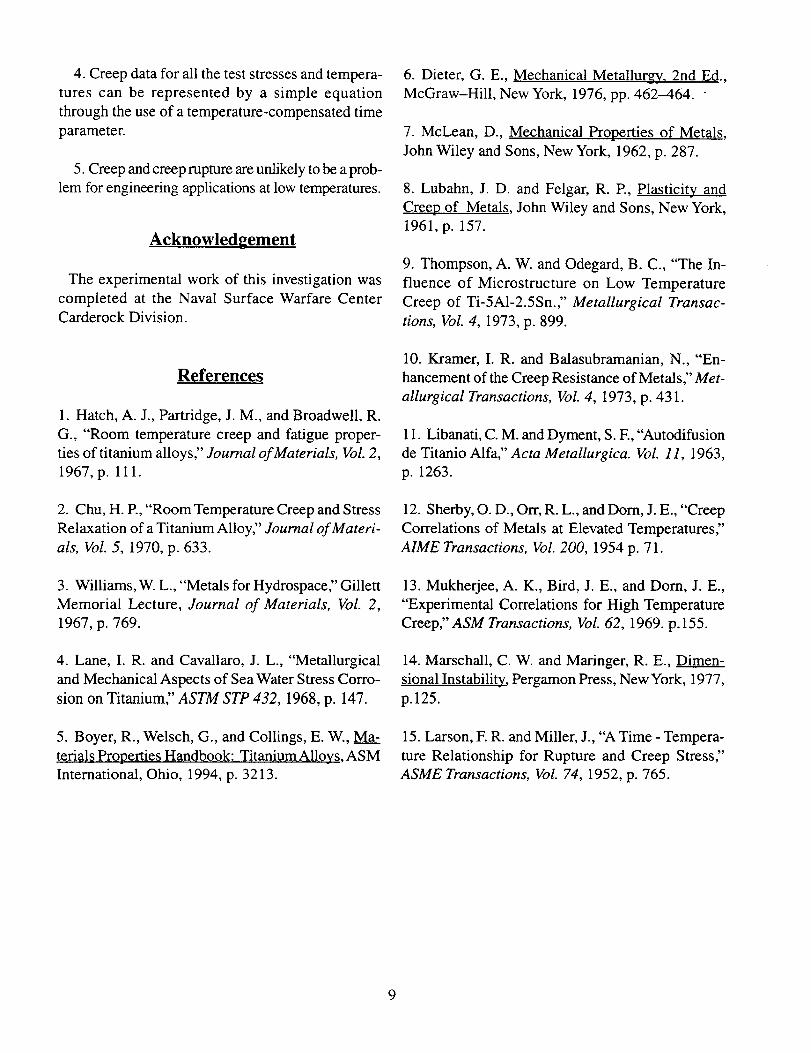
The calculated results of Equation 14 are compared
with experimental data in Figures 10--12. Theac-
curacy of the equation is considered satisfactory; it
is about the same as that of Equations 4-6 estab-
lished for the individual temperatures.
.0
=-
jJ _J
¢_'__'= O_'c
_#25-cA ,_o-c
' 0'- ' !,, ' ' ' ! '10-17 1610.20 1 19 10 t0
e = t exp.(-_'vR'r), Holxr
Figure 9. Creep strain versus the temperature-compensated
time parameter, 0
2 "_"- V A " "_'_"-- -
10-1 z_ -
7v
5
3 m
2 u
101
0 730.8 MPa
O 717.1 MPa -- Equabon14
I1 689.5 MPa
V 655.0 MPa
i A 620.6 MPa
i I i I I i Ill I / I I I I I I
2 3 4 56789 2 3 4 56789
lO2 lO3Time, Hour
Figure 10. Creep data at 0 °C
101
5
3
1001
-_ ,
10-1
7v
5W
3 m
2 u
!
101
0 717.1 MPa
0 689.5 MPa
n 655.0 MPa
620.5 MPa
A 586.1 MPa
I i I I l I I I I
2 3 4 56789
lO2Time, Hour
Equaticct14
* l I I I ''*2 3 4 56789
lO3
Figure 11. Creep data at 25 °C
101
7
5
3
2
100
_o3
,,3 2
10-1
7
5
3
101
J
:lgl] I1 551.6 MPa111 _1' 517.1 MPa
'V II 6205 MPa A 482.6 MPaI I | i i I i i II i |1 i i I i i i
2 3 5 7 2 3 5 7
lO2 lO3Time, Hour
Figure 12. Creep data at 50 °C
It should be pointed out that Equations 12 and
13 and the correlation between creep and diffusion
have been considered applicable only at high tem-
peratures. However, the present results show that
they are applicable to low temperature creep of Ti-
6211 as well. Furthermore, based on the foregoing
discussion of activation energy for creep and self
diffusion, it is reasonable to expect that Equation 14
should be useful in a wide range of temperatures.
Creep Strength and Rupture
The creep strength of an alloy at a certain tem-
perature is not a fixed value due to variations in defi-
nition or design considerations. In principle, it is
the stress suitable for a particular engineering ap-
plication, such that the strain will be acceptably small
during service life of the structure. In the present
discussion, the creep strength of the tested alloy can
be determined as the stress for 1.00 per cent creep
in 100,000 hours. Equations 4--6 and Equation 14
can be used to calculate the creep strength values.
Marschall and Maringer (14) have discussed other
cases where dimensional stability is so restricted that
only a limited amount of microcreep is permitted.
Then the above eqiaations can be used for an ex-
trapolation to estimate the allowable load stress. Fol-
lowing their example, the microcreep strength is
calculated for 1 x 10⁻⁶ creep strain in I000 hours.
The creep strength values are listed below:
Tem_°C
Creep Strength, MPa Microcreep Strength, MPaE__q.4-6 _ E__q_______________
0 616.3 619.2 364.8 360.525 575.6 575.7 335.0 335.250 538.5 541.4 302.7 315.2
Comparing with the tensile properties (Table 1), it
can be seen that the creep strength is about 80% of
the yield strength of the alloy at all three tempera-
tures. This is equivalent to using a factor of safety
of 1.25, which is often used in design for space and
other advanced applications. This illustrates that
creep of Ti-6211 is unlikely to be a problem if the
usual design procedure is used for low temperature
applications. However, when microcreep is an im-
portant concern, structural members made of the
alloy should not be stressed over 46% of the yield
strength at the three temperatures so as to keep di-
mensional changes on the order of part per million
for a long lifetime of service.
7
Four specimens broke during creep testing (Table
2). The data on these specimens indicate that Ti-
6211 could fail by creep rupture if the load stress is
near its yield strength level. This raises an impor-
tant question whether the alloy would fail prema-
turely at lower stresses also. For example, it is de-
sirable to know if rupture would occur at a stress,
say, equal to the creep strength within the assumed
service life of 100,000 hours. The present data may
be examined to obtain some useful information on
the rupture behavior of the alloy. For this purpose,
an additional specimen was tested at 150 °C under a
creep stress of 586.1 MPa; the specimen ruptured in
11 hours.
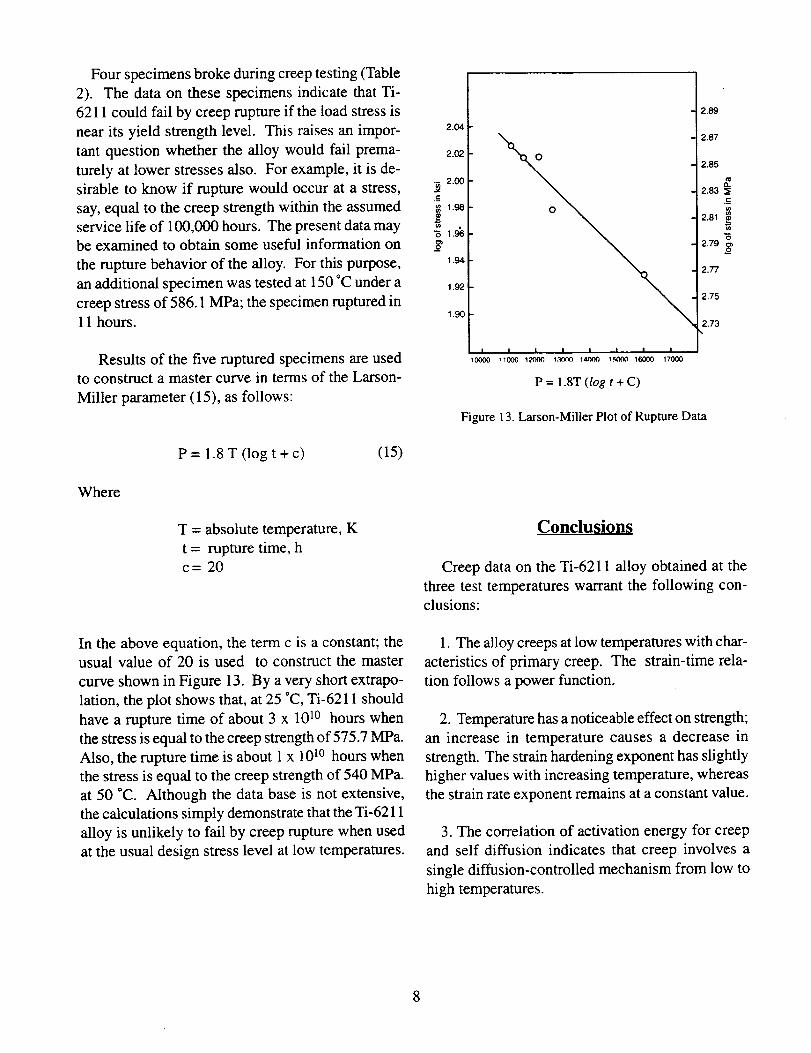
Results of the five ruptured specimens are used
to construct a master curve in terms of the Larson-
Miller parameter (15), as follows:
P=l.8T(logt+c) (15)
Where
T = absolute temperature, K
t = rupture time, hc= 20
2.04
2.02
•_ 2.00
_, 1.98
_._
1.94
1.92
1.90
I I i I I I ' J10000 11000 12000 1,"a.oL_14000 1F-_1oo16000 17000
P = 1.8T (log t + C)
Figure 13. Larson-Miller Plot of Rupture Data
2.89
2.87
2.85
g_2.83 IE
2.81
2.79 o_
2.77
2.75
2.73
Conclusions
Creep data on the Ti-6211 alloy obtained at the
three test temperatures warrant the following con-
clusions:
In the above equation, the term c is a constant; the
usual value of 20 is used to construct the master
curve shown in Figure 13. By a very short extrapo-
lation, the plot shows that, at 25 °C, Ti-6211 should
have a rupture time of about 3 x 10 ]° hours when
the stress is equal to the creep strength of 575.7 MPa.
Also, the rupture time is about 1 x 10 l° hours when
the stress is equal to the creep strength of 540 MPa.
at 50 °C. Although the data base is not extensive,
the calculations simply demonstrate that the Ti-6211
alloy is unlikely to fail by creep rupture when used
at the usual design stress level at low temperatures.
1. The alloy creeps at low temperatures with char-
acteristics of primary creep. The strain-time rela-
tion follows a power function.
2. Temperature has a noticeable effect on strength;
an increase in temperature causes a decrease in
strength. The strain hardening exponent has slightly
higher values with increasing temperature, whereas
the strain rate exponent remains at a constant value.
3. The correlation of activation energy for creep
and self diffusion indicates that creep involves a
single diffusion-controlled mechanism from low to
high temperatures.
4. Creep data for all the test stresses and tempera-
tures can be represented by a simple equation
through the use of a temperature-compensated time
parameter.
5. Creep and creep rapture are unlikely to be a prob-
lem for engineering applications at low temperatures.
Acknowledgement
The experimental work of this investigation was
completed at the Naval Surface Warfare CenterCarderock Division.
References
1. Hatch, A. J., Partridge, J. M., and Broadwell, R.
G., "Room temperature creep and fatigue proper-
ties of titanium alloys," Journal of Materials, Vol. 2,
1967, p. 111.
2. Chu, H. R, "Room Temperature Creep and Stress
Relaxation of a Titanium Alloy," Journal of Materi-
als, Vol. 5, 1970, p. 633.
3. Williams, W. L., "Metals for Hydrospace," Gillett
Memorial Lecture, Journal of Materials, Vol. 2,
1967, p. 769.
4. Lane, I. R. and Cavallaro, J. L., "Metallurgical
and Mechanical Aspects of Sea Water Stress Corro-
sion on Titanium" ASTM STP 432, 1968, p. 147.
5. Boyer, R., Welsch, G., and Collings, E. W., Ma-
terials Properties Handbook: Titanium Alloys, ASM
Intemational, Ohio, 1994, p. 3213.
6. Dieter, G. E., Mechanical Metallurgy, 2nd Ed.,
McGraw-Hill, New York, 1976, pp. 462-464.
7. McLean, D., Mechanical Properties of Metals,
John Wiley and Sons, New York, 1962, p. 287.
8. Lubahn, J. D. and Felgar, R. R, Plasticity and
Creep of Metals, John Wiley and Sons, New York,
1961, p. 157.
9. Thompson, A. W. and Odegard, B. C., "The In-
fluence of Microstructure on Low Temperature
Creep of Ti-5A1-2.5Sn.," Metallurgical Transac-
tions, Vol. 4, 1973, p. 899.
10. Kramer, I. R. and Balasubramanian, N., "En-
hancement of the Creep Resistance of Metals" Met-
allurgical Transactions, Vol. 4, 1973, p. 431.
11. Libanati, C. M. and Dyment, S. E, "'Autodifusion
de Titanio Alfa," Acta Metallurgica. Vol. 11, 1963,
p. 1263.
12. Sherby, O. D., Orr, R. L., and Dorn, J. E., "Creep
Correlations of Metals at Elevated Temperatures"
AIME Transactions, Vol. 200, 1954 p. 71.
13. Mukherjee, A. K., Bird, J. E., and Dora, J. E.,
"Experimental Correlations for High Temperature
Creep" ASM Transactions, Vol. 62, 1969. p. 155.
14. Marschall, C. W. and Maringer, R. E., Dimen-
sional Instability, Pergamon Press, New York, 1977,
p.125.
15. Larson, E R. and Miller, J., "A Time - Tempera-
ture Relationship for Rupture and Creep Stress,"
ASME Transactions, Vot. 74, 1952, p. 765.
9


Form ApprovedREPORT DOCUMENTATION PAGE OM_Noo7o4-o18o
Pubhc reporting burden for this collection of information is estimated to average 1 hour per response, including the time for reviewing instruct=ons, searching existing data sources, gatheringand maintaining the data needed, and completing and reviewing the collection of information. Send comments regarding this burden estimate or any other aspecl of this collect_'_ of
information, including suggestions for reducing this burden, to Washington Headcluarters Services. Directorate for Information Operations and Reports, 1215 Jefferson Davis Highway. Suite1204, Arlington, VA 22202-4302. and to the Office of Manacjement and Budget, Paperwork Reduction Proiect 10704-01881, Washin(_ton, DC 20503.
1. AGENCY USE ONLY (Leave blank) 2. REPORT DATE 3. REPORT TYPE AND DATES COVERED
January 1997 Technical Memorandum4. TITLE AND SUBTITLE 5. FUNDING NUMBERS
Low Temperature Creep of a Titanium AlloyTi-6A1-2Cb- 1Ta-0.8Mo Code 313
6. AUTHOR(S)
H. P. Chu
7. PERFORMING ORGANIZATION NAME(S) AND ADDRESS(ES)
Materials Engineering Branch
Goddard Space Flight Center
Greenbelt, Maryland 20771
9. SPONSORING/MONITORING AGENCY NAME(S) AND ADDRESSOES)
Goddard Space Flight Center
National Aeronautics and Space Administration
Washington, DC 20546-0001
8. PERFORMING ORGANIZATIONREPORT NUMBER
97B00021
10. SPONSORING/MONITORINGAGENCY REPORT NUMBER
TM- 104641
11. SUPPLEMENTARY NOTES
12a. DISTRIBUTION/AVAILABILITY STATEMENT
Unclassified-Unlimited
Subject Catagory: 24This report is available from the NASA Center for AeroSpace Information,
800 Elkridge Landing Road, Linthicum Heights, MD 21090; (301) 621-039013. ABSTRACT (MaxT?nLrn200 words)
12b. DISTRIBUTION CODE
This paper presents a methodology for the analysis of low temperature creep of titanium alloys in
order to establish design limitations due to the effect of creep. The creep data on a titanimum Ti-6A1-
2Cb-1Ta-0.8Mo are used in the analysis. A creep equation is formulated to determine the allowable
stresses so that creep at ambient temperatures can be kept within an acceptable limit during the service
life of engineering structures or instruments. Microcreep which is important to design of precisioninstruments is included in the discussion also.
14. SUBJECT TERMS
Titanium alloy, creep, low temperature
17. SECURITY CLASSlRCATIONOF REPORT
Unclassified
18. SECURITY CLASSIFICATIONOF THIS PAGE
Unclassified
NSN 7540-01-280-5500
19. SECURITY CLASSlRCATIONOF ABSTRACT
Unclassified
15. NUMBER OF PAGES
9
16. PRICE CODE
20. LIMITATION OF ABSTRACT
Unlimited
Standard Form 298 (Rev. 2-89)