Embed Size (px)
Citation preview
NPL Report MATC(A)114
Low rate extensional rheometry of polymer melts
Martin Rides and Crispin Allen
July 2002

NPL Report MATC(A)114
[MATC(A)114 v#1]
July 2002
Low rate extensional rheometry of polymer melts
Martin Rides and Crispin Allen NPL Materials Centre
National Physical Laboratory Teddington, Middlesex
United Kingdom TW11 0LW
ABSTRACT
The NPL extensional rheometer has been developed further to test polymer melts at low strain rates. Results of extensional viscosity measurements are reported for various polyethylene melts at strain rates down to 0.001 s-1 and at 150 °C. Three polyethylene materials, a HDPE, LDPE and LLDPE, exhibited significant differences in their extensional behaviour, particularly in their additional strain hardening to failure which was greatest at the lowest strain rate. Comparison of four similar HDPEs used for thick-walled pipe extrusion revealed differences of up to a factor of ×2 in their transient extensional viscosity values. Measurements of extrudate draw-down using a melt flow rate instrument and a hand-held micrometer, and interpreted as approximate extensional viscosity values, yielded results that were consistent with the data obtained using the more elaborate NPL extensional rheometer. An analysis of the uncertainties in measurement of transient extensional viscosity values at low strain rates is briefly reported.
NPL Report MATC(A)114
[MATC(A)114 v#1]
� Crown copyright 2002 Reproduced by permission of the Controller of HMSO
ISSN 1473-2734
National Physical Laboratory Teddington, Middlesex, UK, TW11 0LW
Extracts from this report may be reproduced provided the source is acknowledged.
Prepared as a deliverable of milestone 16 of the project MPM1.2: Viscoelastic measurement techniques for polymer melts,
a project of the Department of Trade and Industry programme on measurements related to the processability of materials
Approved on behalf of Managing Director, NPL by Dr C Lea, Director, NPL Materials Centre
NPL Report MATC(A)114
[MATC(A)114 v#1]
CONTENTS
1. INTRODUCTION ..........................................................................................................1
2. LOW RATE EXTENSIONAL RHEOMETER ...........................................................1
3. RESULTS ..........................................................................................................................2 3.1 Extensional viscosity results for three different polyethylenes..............................3 3.2 Extensional viscosity results for four similar polyethylenes..................................3 3.3 Assessment of uncertainties in low strain rate extensional viscosity
testing ......................................................................................................................4
4. DISCUSSION AND CONCLUSIONS ......................................................................5
5. ACKNOWLEDGEMENTS ...........................................................................................6
6. REFERENCES ..................................................................................................................6
FIGURES .......................................................................................................................................7

NPL Report MATC(A)114
1 [MATC(A)114 v#1]
1. INTRODUCTION
In many plastics-forming processes the polymer melt undergoes significant extensional or stretching flow, for example in extrusion, blow moulding, vacuum forming, film extrusion and wire coating. The extensional flow behaviour of materials will therefore have a significant effect on their processability and also on the properties of the moulded product, for example due to the stresses generated by the extensional deformation that are subsequently frozen into the product. However, established rheological techniques predominantly characterize the behaviour of polymers in shear and it can prove difficult to relate the behaviour measured in shear with that observed in processing where the deformation is predominantly extensional. An ability to characterize their behaviour more appropriately will have benefits in materials development and in process and product design. The techniques most suitable for characterizing the extensional flow behaviour of polymer melts are converging flow methods, which use capillary extrusion rheometry data, and stretching flow methods. These techniques have been the focus of recent research and were critically reviewed [1, 2]. The converging flow approach can be used to obtain qualitative data on the extensional flow behaviour of materials [3], but to obtain reliable quantitative data then stretching flow methods should be used [4,5]. However, stretching techniques available for the characterisation of the extensional flow behaviour of polymers are very limited in number. Furthermore, testing at low strain rates presents particular experimental difficulties due to the very low forces involved and the long test durations that result (in order to obtain data to failure to fully characterise the materials). Low strain rates are important for characterising the rheological behaviour of materials: in shear, differences tend to be more apparent in low rate tests. Also, in extrusion, particularly of thick walled products, low rate deformations occur which result in slump of the product causing a variation in the wall thickness. To address the measurement of polymer melts at low strain rates the NPL extensional rheometer was developed further. This report describes that instrument and discusses various measurement issues that were addressed. It presents results demonstrating the use of the instrument in characterizing the flow properties of three polymers that exhibited significant differences in their extensional flow behaviour: a high density polyethylene (HDPE), a low density polyethylene (LDPE) and a linear low density polyethylene (LLDPE). It also presents results of an industrial case study on four similar HDPEs used for thick-walled pipe extrusion. The objective of the latter testing was to identify differences in their extensional flow behaviour that may be correlated to their processability.
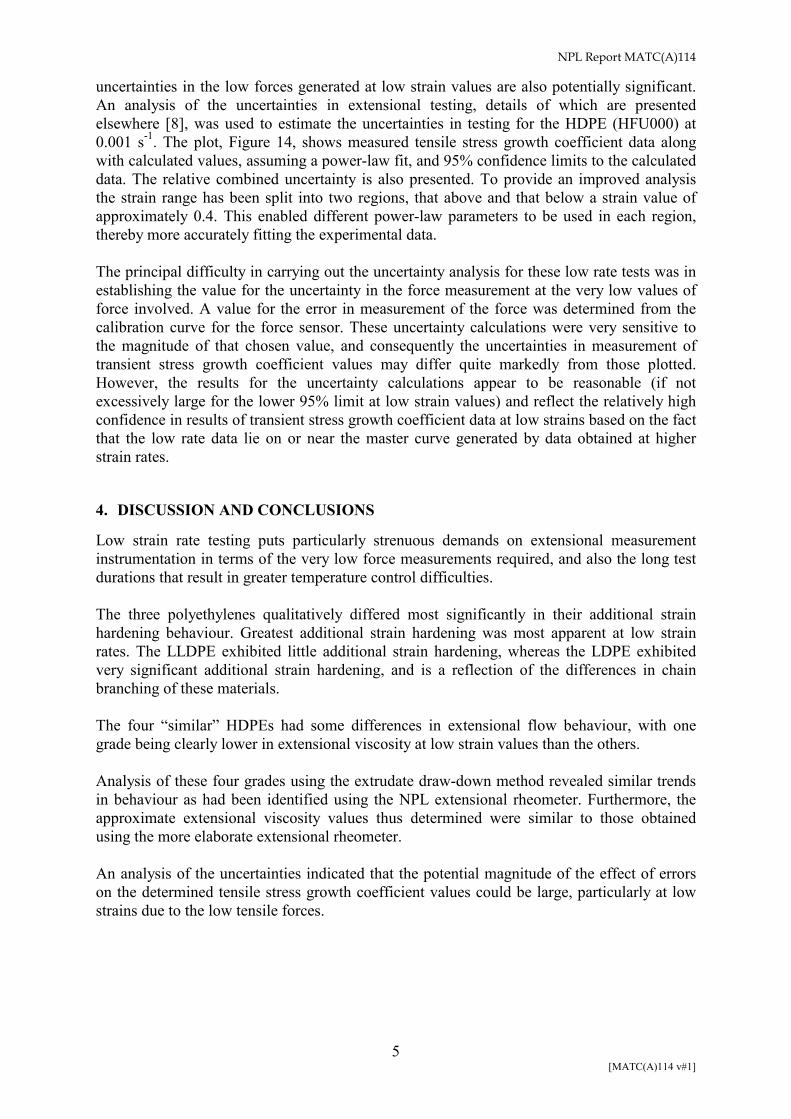
2. LOW RATE EXTENSIONAL RHEOMETER
An instrument for measuring the extensional viscoelasticity of polymer melts was developed to operate at low strain rates, Figure 1. The operating principle of the instrument is to stretch a molten specimen between a rotating clamp and a fixed clamp [4]. The specimens used were typically 80 mm in length. The rotating clamp, by winding up the specimen, controlled the rate at which the specimen was stretched. In using a rotating clamp, measurements at constant strain rate can be achieved simply by using a constant rotation speed. More importantly, the use of a rotating clamp results in an instrument that is not limited in its maximum strain capability. For an instrument that uses translating clamps the maximum strain that can be achieved is limited by the dimensions of the instrument.
NPL Report MATC(A)114
2 [MATC(A)114 v#1]
The fixed clamp was used to measure the tensile force developed in the specimen during stretching. This clamp was mounted on a leaf spring, the displacement of which was measured using a non-contacting optical transducer. The force was then calculated from the force - displacement characteristics of the leaf spring, determined through calibration.
The specimens were fixed to the clamps using an epoxy adhesive. After loading a specimen into the instrument, the specimen and clamps were then immersed into a silicone oil bath to provide temperature control and also support for the specimen during testing. The instrument has been used up to 230 °C and has a maximum operating temperature of 250 °C, limited by the maximum operating temperature of the silicone oil used. By using a larger diameter winding drum and short specimen lengths, high strain rates up to ≈ 100 s-1 have been achieved using this instrument. At the other extreme, using a 40 mm diameter drum, measurements have successfully been made at strain rates as low as 0.001 s-1 giving the instrument a range in strain rate of five decades.
Particular difficulties that had to be addressed in developing the equipment to operate at low strain rates related to the control of specimen temperature and the measurement of low forces. The heating system had to be developed to enable the temperature of the specimen to be controlled for the duration of the test. This was achieved by using a second oil bath to feed a heater coil in the test bath thereby providing heat input to counter the loss of heat from that bath to the surrounding environment. This solution was adopted as it provided the heat input to the test bath without causing excessive vibrational noise or excessive stirring of the silicone oil in the bath, which would otherwise swamp the measured force signal. In testing at low rates the tensile force generated in the specimen due to its deformation is very low. A thinner and thus less stiff leaf spring was used for testing at low rates to improve the accuracy of measurements. Also, improvement to the procedure for using the non-contacting force measuring device enabled the drift in the sensor due to contamination to be minimised. This resulted in greater confidence in defining the base line for the sensor which, because of the lower forces and longer durations of testing, became much more significant. Testing to failure, and thus testing to very long times, was important as it was necessary to determine a base line which was subsequently used to calculate the transient extensional viscosity values. As an indication of the maximum test duration, for materials that failed at a strain of three and were tested at 0.001 s-1 the test duration was 3000 s, or 50 minutes. Testing at low rates also presented problems for logging where relatively high logging rates were required at the start of the test, to capture the transients at the start, yet needed to continue for some considerable time thereafter.
Transient extensional viscosity values are presented, according to nomenclature convention, as tensile stress growth coefficient values [6]. For full details of the measurement principle, nomenclature and for details of the analysis of the experimental data see reference [4].
3. RESULTS
A number of polyethylenes have been investigated in this work. Three polyethylenes exhibited significant differences in their extensional flow behaviour: a high density polyethylene (HDPE), a low density polyethylene (LDPE) and a linear low density polyethylene (LLDPE). The NPL references for these materials are: HDPE HFU000 LDPE HGE000 LLDPE HGF000
NPL Report MATC(A)114
3 [MATC(A)114 v#1]
These materials were used to carry out initial testing to assess the performance of the instrument modified for low rate testing. A further four samples of HDPE having similar properties were then tested for an industrial case study. The NPL references for these materials were: HGZ000, HHA000, HHB000 and HHR000.
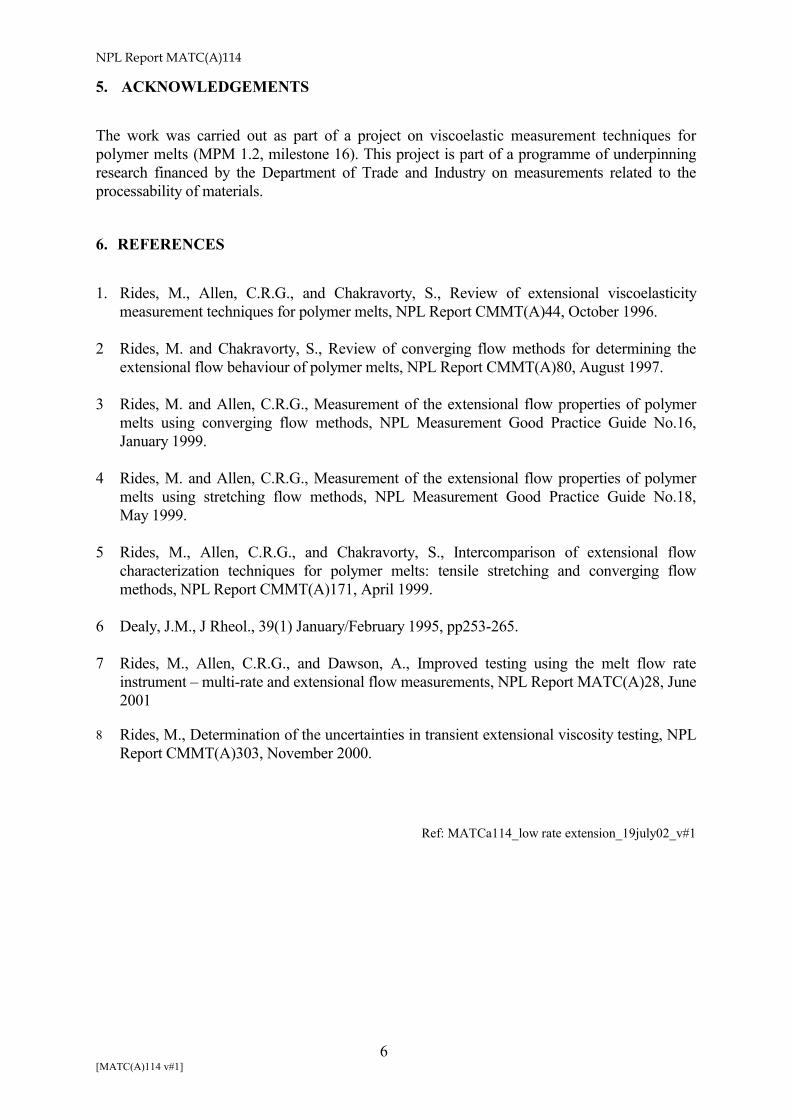
3.1 Extensional viscosity results for three different polyethylenes Results of testing of the three different polyethylenes clearly demonstrated the low rate capability of the instrument. For the HDPE (HFU000) strain rates down to 0.002 s-1 were achieved with test times greater than 1000 s, Figure 2. The peak force measured at the strain rate of 0.002 s-1 was 0.007 N, and compared with a value of 0.17 N at a strain rate of 1 s-1 (the resolution of the force measuring device was 0.000024 N for the low rate test). Very significant additional strain hardening was apparent for this material, in particular at the lowest strain rate. Transient extensional stress growth coefficient values (commonly referred to as transient extensional viscosity values) exhibited a decade increase in magnitude on departing from the master curve1. Scatter in data is more apparent at the lowest strain rate but could be reduced further by modifying the filtering of the force sensor signal. A smooth curve through the mid-range of these data is considered reasonable.
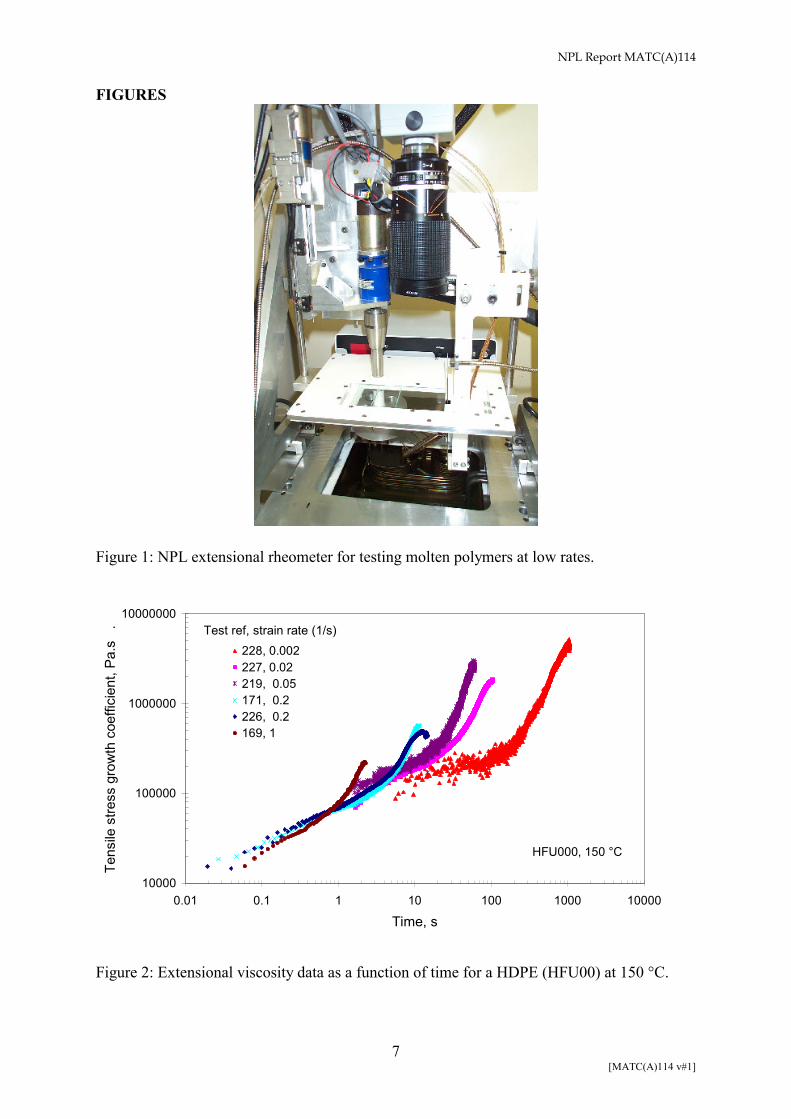
For the LDPE (HGE000) considerable strain hardening was also exhibited, Figure 3. At the higher strain rates the additional strain hardening was greater for the LDPE (Figure 3) than for the HDPE (Figure 2). At the lowest strain rate used no apparent strain hardening was observed. In this test the peak force was less than 0.005 N (equivalent to 0.5 gf). The reason for an absence of strain hardening is unclear. It may have been due to premature failure of the specimen. However the repeat test showed almost identical behaviour at long times indicating the high level of repeatability of the behaviour.
For the LLDPE (HGF000) the minimum strain rate that could be used to obtain reliable results was 0.02 s-1, Figure 4. This was considered to be due to the very low forces generated in the specimen during testing combined with the almost non-existent additional strain hardening behaviour that the material exhibited. LLDPE has little chain branching and thus little additional strain hardening. At a strain rate of 0.02 s-1 the peak force generated in the test was 0.007 N. The lack of strain hardening means that the specimen is relatively unstable and should any necking occur it is likely to fail prematurely.
3.2 Extensional viscosity results for four similar polyethylenes
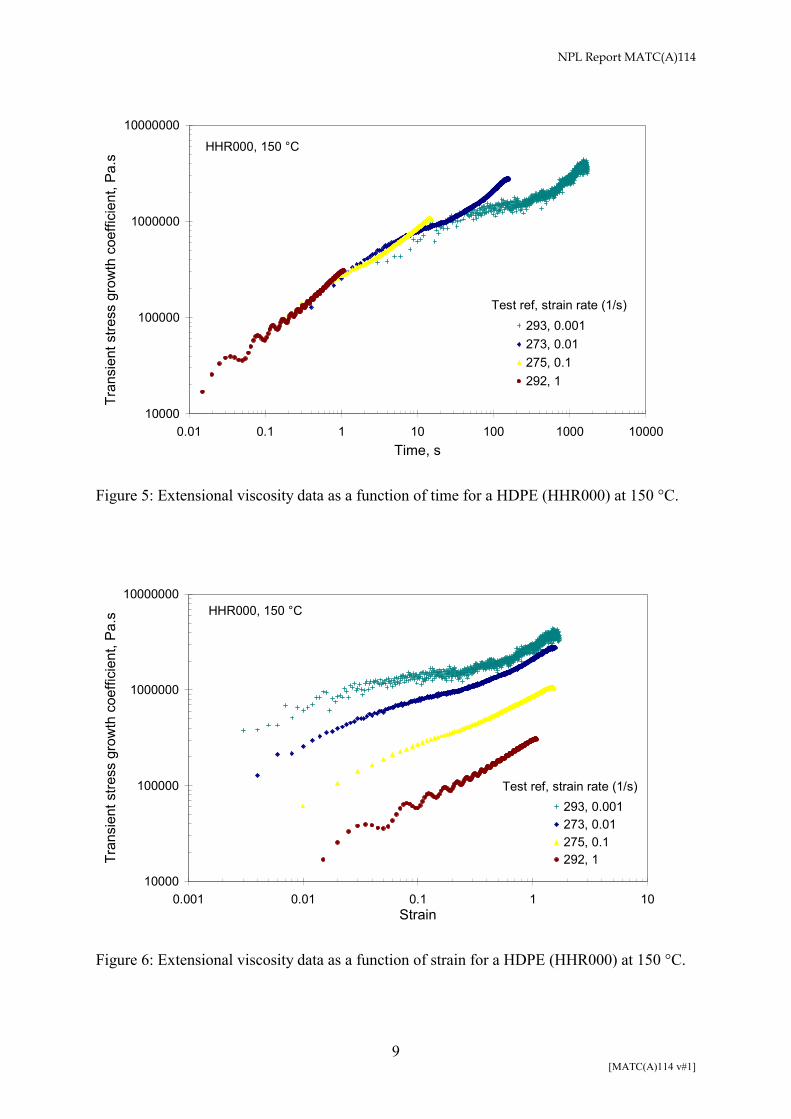
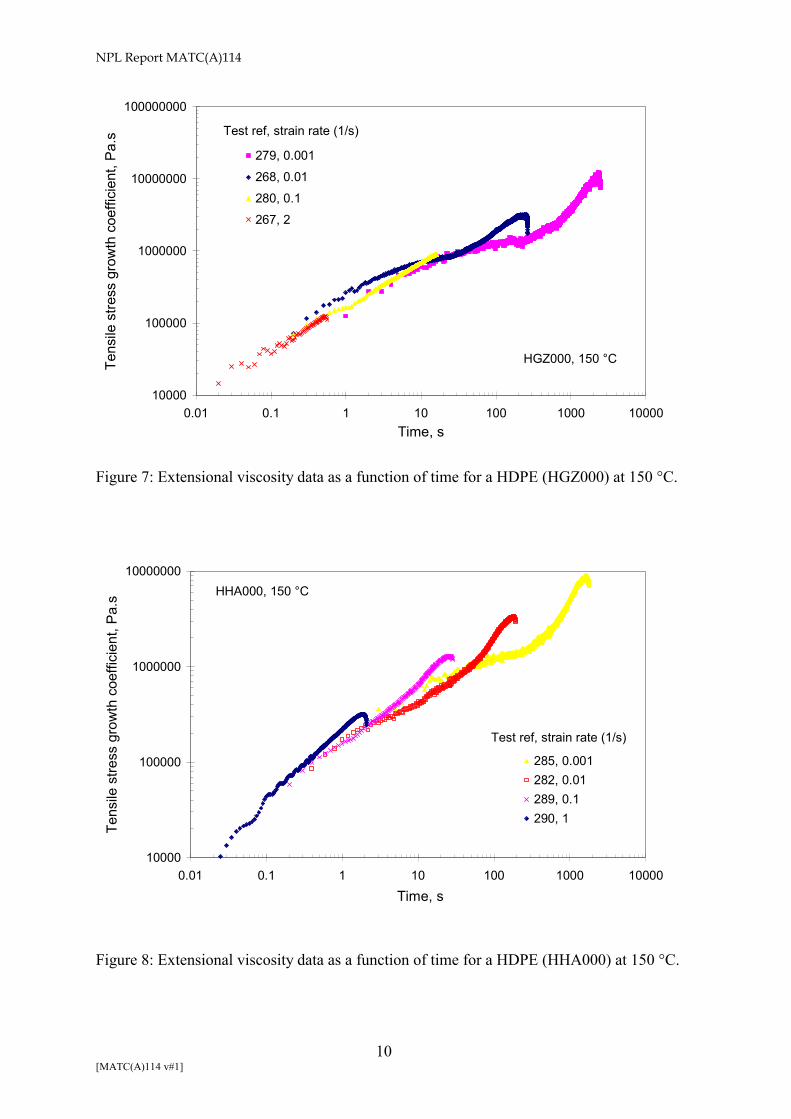
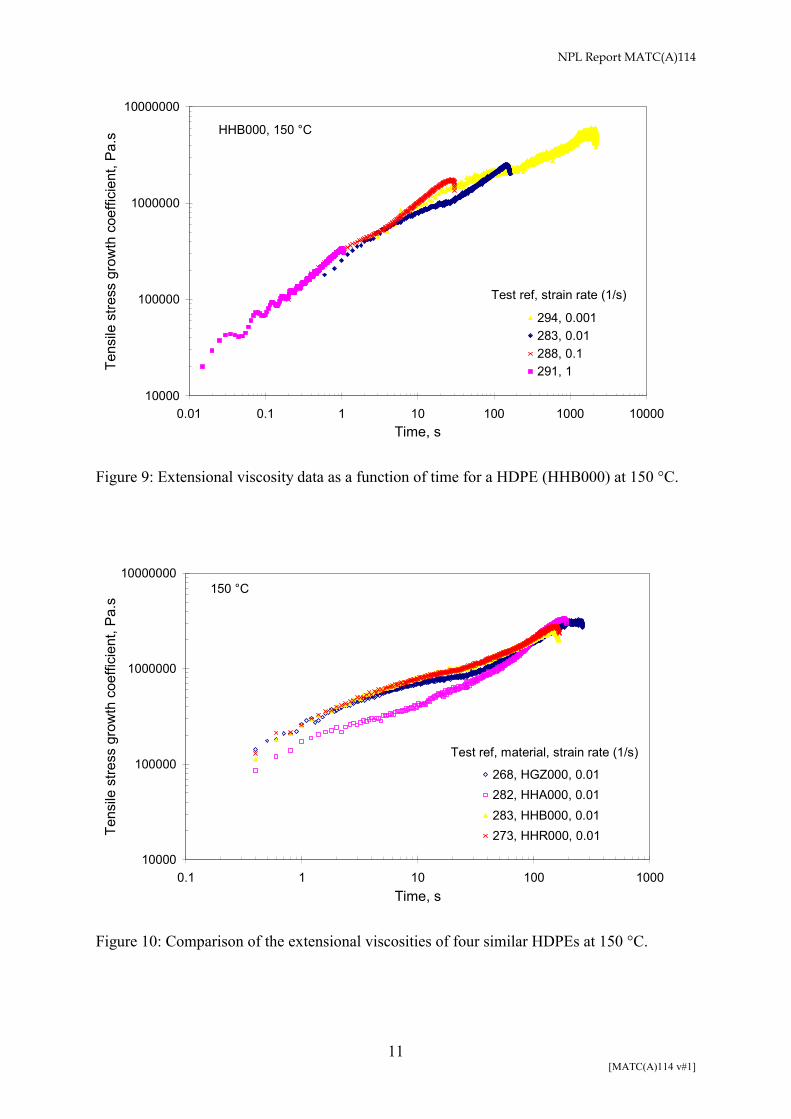
Low strain rate transient stress growth coefficient results are presented for four similar HDPEs, Figures (5 - 9). Strain rates down to 0.001 s-1 were achieved following improvements to the procedure compared with that used for the three polyethylenes reported in 3.1. Greatest strain hardening, at the lowest rate of 0.001 s-1 at which additional strain hardening was most predominant, was observed for HHA000, followed by HGZ000, HHR000 and then HHB000. The plot for HHR000, Figure 6, illustrates the behaviour when plotted as a function of strain, indicating that the strain at failure was relatively independent of the strain rate. Comparing the results for the four grades at a strain rate of 0.01 s-1, Figure 10, indicates that the material HHA000 had lower transient extensional stress growth values at strains up to approximately
1 The master curve refers to the superimposition of data obtained at different strain rates when plotted as transient stress growth coefficient versus time. Additional strain hardening refers to the departure of data from this master curve at high strain values.
NPL Report MATC(A)114
4 [MATC(A)114 v#1]
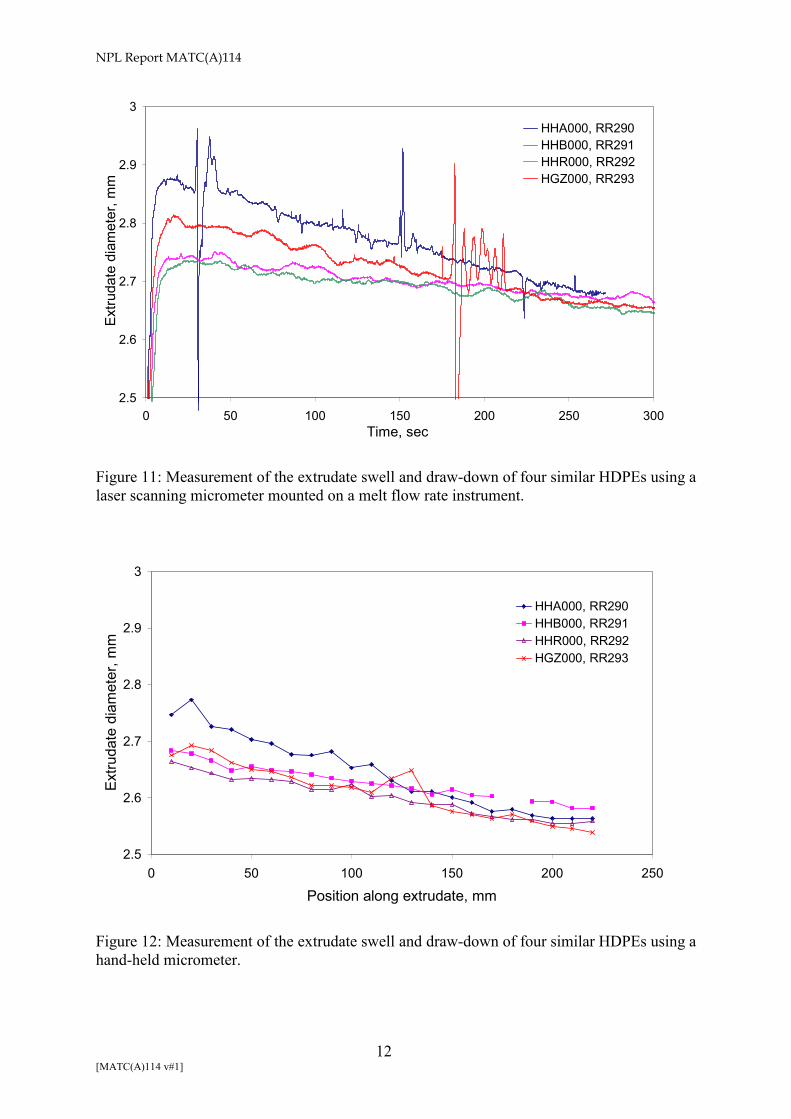
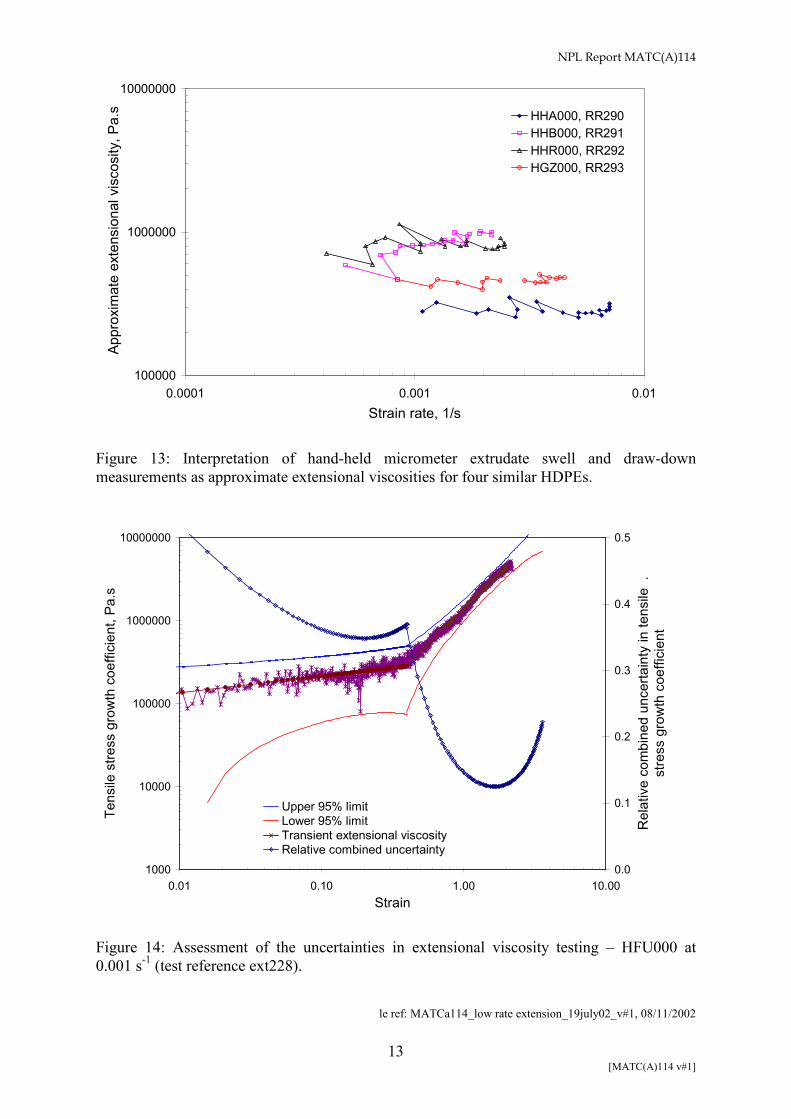
0.4 (time ≈ 40 s). At higher strains, due to the greater additional strain hardening, the transient extensional stress growth values were similar for all materials. The differences between the three materials HGZ000, HHB000 and HHR000 were relatively small although the values for HGZ000 were slightly lower by approximately 10%. Analysis of the individual plots (Figures 5,7-9) and assuming that the data should fall onto a master curve indicates that the data at 0.01 s-1 were reasonable for HHB000 and HHR000, but possibly a little high (by ≈ 10% to 20%) at low times (< 10 s) for HGZ000, and possibly a little low for HHA000 (by ≈ 10%). Taking these factors into considerations would give HGZ000 intermediate transient extensional stress growth values approximately 20% lower than for HHB000 and HHR000. Measurement of the draw-down of extrudate using a melt flow rate instrument to determine approximate extensional viscosity values was also carried out. The measurements were made using a standard Ray-Ran Test Equipment Limited’s 5MPCA Advanced Melt Flow System instrument. Automated, non-contact extrudate swell measurements were made using a Mitutoyo Laser Scanning Micrometer (LSM-3000) mounted on the melt flow rate instrument. The measurement of extrudate diameter was at approximately 45 mm beneath the exit of the die. Measurements were also made on the cooled extrudate using a hand-held digital micrometer after completion of the melt flow rate test. Analysis of the results in terms of approximate extensional viscosity values permitted comparison with the results obtained using the more elaborate NPL extensional rheometer (Figures 5-9). The results obtained using the laser scanning micrometer clearly showed, as expected, the decrease in extrudate diameter as the test progressed, due to the effect of the mass of extrudate already formed drawing down the molten extrudate, Figures 11 and 12. The gradient of the line of extrudate diameter versus position can be related to the extensional viscosity of the material. The greater the (negative) gradient implies the more easily the material draws down, the lower its resistance to extensional deformation and thus the lower its extensional viscosity. The greatest negative gradient was exhibited by HHA000, followed by HGZ000 and then HHB000 and HHR000, the latter two having very similar gradients. An analysis was developed to interpret the drawing down of the extrudate in terms of extensional viscosity [7]. The extensional viscosities, determined from the hand-held micrometer measurements of extrudate swell, are presented in Figure 13. This shows that there is a difference of approximately x 3 in the approximate extensional viscosity values of the four materials with HHA000 exhibiting the lowest values, HGZ000 exhibiting intermediate values and HHB000 and HHR000 exhibiting the highest values. It is noted that this is consistent with the trend in values obtained using the NPL extensional rheometer. Furthermore the magnitude of the extensional viscosity values obtained using the melt flow rate method (in the range 105 Pa.s to 106 Pa.s) is also similar to that obtained using the NPL extensional rheometer. It is noted that in order to make a reasonable comparison the strains and strain rates of the data from the two methods must be matched. In the draw-down tests the strain rates were in the range typically 0.5 × 10⁻³ s-1 to 7 × 10⁻³ s-1 and strains were in the range 0.025 to 0.15. However exact agreement is not expected as the extrudate draw-down method is non-isothermal and not of constant strain rate whereas the NPL extensional rheometer is both isothermal and at constant strain rate.
3.3 Assessment of uncertainties in low strain rate extensional viscosity testing As demonstrated previously [8], the uncertainties in extensional viscosity determination grow rapidly at large strains primarily due to the rapid decrease in cross-sectional area of the specimen with a resultant rapid decrease in the measured force. At low strain rates the
NPL Report MATC(A)114
5 [MATC(A)114 v#1]
uncertainties in the low forces generated at low strain values are also potentially significant. An analysis of the uncertainties in extensional testing, details of which are presented elsewhere [8], was used to estimate the uncertainties in testing for the HDPE (HFU000) at 0.001 s-1. The plot, Figure 14, shows measured tensile stress growth coefficient data along with calculated values, assuming a power-law fit, and 95% confidence limits to the calculated data. The relative combined uncertainty is also presented. To provide an improved analysis the strain range has been split into two regions, that above and that below a strain value of approximately 0.4. This enabled different power-law parameters to be used in each region, thereby more accurately fitting the experimental data. The principal difficulty in carrying out the uncertainty analysis for these low rate tests was in establishing the value for the uncertainty in the force measurement at the very low values of force involved. A value for the error in measurement of the force was determined from the calibration curve for the force sensor. These uncertainty calculations were very sensitive to the magnitude of that chosen value, and consequently the uncertainties in measurement of transient stress growth coefficient values may differ quite markedly from those plotted. However, the results for the uncertainty calculations appear to be reasonable (if not excessively large for the lower 95% limit at low strain values) and reflect the relatively high confidence in results of transient stress growth coefficient data at low strains based on the fact that the low rate data lie on or near the master curve generated by data obtained at higher strain rates.
4. DISCUSSION AND CONCLUSIONS
Low strain rate testing puts particularly strenuous demands on extensional measurement instrumentation in terms of the very low force measurements required, and also the long test durations that result in greater temperature control difficulties. The three polyethylenes qualitatively differed most significantly in their additional strain hardening behaviour. Greatest additional strain hardening was most apparent at low strain rates. The LLDPE exhibited little additional strain hardening, whereas the LDPE exhibited very significant additional strain hardening, and is a reflection of the differences in chain branching of these materials. The four “similar” HDPEs had some differences in extensional flow behaviour, with one grade being clearly lower in extensional viscosity at low strain values than the others. Analysis of these four grades using the extrudate draw-down method revealed similar trends in behaviour as had been identified using the NPL extensional rheometer. Furthermore, the approximate extensional viscosity values thus determined were similar to those obtained using the more elaborate extensional rheometer. An analysis of the uncertainties indicated that the potential magnitude of the effect of errors on the determined tensile stress growth coefficient values could be large, particularly at low strains due to the low tensile forces.
NPL Report MATC(A)114
6 [MATC(A)114 v#1]
5. ACKNOWLEDGEMENTS
The work was carried out as part of a project on viscoelastic measurement techniques for polymer melts (MPM 1.2, milestone 16). This project is part of a programme of underpinning research financed by the Department of Trade and Industry on measurements related to the processability of materials.
6. REFERENCES
1. Rides, M., Allen, C.R.G., and Chakravorty, S., Review of extensional viscoelasticity
measurement techniques for polymer melts, NPL Report CMMT(A)44, October 1996. 2 Rides, M. and Chakravorty, S., Review of converging flow methods for determining the
extensional flow behaviour of polymer melts, NPL Report CMMT(A)80, August 1997. 3 Rides, M. and Allen, C.R.G., Measurement of the extensional flow properties of polymer
melts using converging flow methods, NPL Measurement Good Practice Guide No.16, January 1999.
4 Rides, M. and Allen, C.R.G., Measurement of the extensional flow properties of polymer
melts using stretching flow methods, NPL Measurement Good Practice Guide No.18, May 1999.
5 Rides, M., Allen, C.R.G., and Chakravorty, S., Intercomparison of extensional flow
characterization techniques for polymer melts: tensile stretching and converging flow methods, NPL Report CMMT(A)171, April 1999.
6 Dealy, J.M., J Rheol., 39(1) January/February 1995, pp253-265. 7 Rides, M., Allen, C.R.G., and Dawson, A., Improved testing using the melt flow rate
instrument – multi-rate and extensional flow measurements, NPL Report MATC(A)28, June 2001
8 Rides, M., Determination of the uncertainties in transient extensional viscosity testing, NPL
Report CMMT(A)303, November 2000.
Ref: MATCa114_low rate extension_19july02_v#1
NPL Report MATC(A)114
7 [MATC(A)114 v#1]
FIGURES
Figure 1: NPL extensional rheometer for testing molten polymers at low rates.
Figure 2: Extensional viscosity data as a function of time for a HDPE (HFU00) at 150 °C.
10000
100000
1000000
10000000
0.01 0.1 1 10 100 1000 10000
Time, s
Tens
ile s
tress
gro
wth
coe
ffici
ent,
Pa.s
.
228, 0.002227, 0.02219, 0.05171, 0.2226, 0.2169, 1
HFU000, 150 °C
Test ref, strain rate (1/s)
NPL Report MATC(A)114
8 [MATC(A)114 v#1]
Figure 3: Extensional viscosity data as a function of time for a LDPE (HGE000) at 150 °C.
Figure 4: Extensional viscosity data as a function of time for a LLDPE (HGF000) at 150 °C.
10000
100000
1000000
10000000
0.001 0.01 0.1 1 10 100 1000
Time, s
Tens
ile s
tress
gro
wth
coe
ffici
ent,
Pa.s
.
222, short, 1206, 0.2237, 0.2238, 0.2239, 0.02242, 0.02240, 0.002241, 0.002
HGE000, 150 °C
Test ref, strain rate (1/s)
1000
10000
100000
1000000
0.001 0.01 0.1 1 10 100 1000Time, s
Tens
ile s
tress
gro
wth
coe
ffici
ent,
Pa.s
.
233, 0.02234, 0.02213, 0.2231, 0.2212, 1
HGF000, 150 °C
Test ref, strain rate (1/s)
NPL Report MATC(A)114
9 [MATC(A)114 v#1]
Figure 5: Extensional viscosity data as a function of time for a HDPE (HHR000) at 150 °C.
Figure 6: Extensional viscosity data as a function of strain for a HDPE (HHR000) at 150 °C.
10000
100000
1000000
10000000
0.01 0.1 1 10 100 1000 10000Time, s
Tran
sien
t stre
ss g
row
th c
oeffi
cien
t, Pa
.s
293, 0.001273, 0.01275, 0.1292, 1
HHR000, 150 °C
Test ref, strain rate (1/s)
10000
100000
1000000
10000000
0.001 0.01 0.1 1 10Strain
Tran
sien
t stre
ss g
row
th c
oeffi
cien
t, Pa
.s
293, 0.001273, 0.01275, 0.1292, 1
HHR000, 150 °C
Test ref, strain rate (1/s)
NPL Report MATC(A)114
10 [MATC(A)114 v#1]
Figure 7: Extensional viscosity data as a function of time for a HDPE (HGZ000) at 150 °C.
Figure 8: Extensional viscosity data as a function of time for a HDPE (HHA000) at 150 °C.
10000
100000
1000000
10000000
100000000
0.01 0.1 1 10 100 1000 10000Time, s
Tens
ile s
tress
gro
wth
coe
ffici
ent,
Pa.s
279, 0.001268, 0.01280, 0.1267, 2
HGZ000, 150 °C
Test ref, strain rate (1/s)
10000
100000
1000000
10000000
0.01 0.1 1 10 100 1000 10000Time, s
Tens
ile s
tress
gro
wth
coe
ffici
ent,
Pa.s
285, 0.001282, 0.01289, 0.1290, 1
HHA000, 150 °C
Test ref, strain rate (1/s)
NPL Report MATC(A)114
11 [MATC(A)114 v#1]
Figure 9: Extensional viscosity data as a function of time for a HDPE (HHB000) at 150 °C.
Figure 10: Comparison of the extensional viscosities of four similar HDPEs at 150 °C.
10000
100000
1000000
10000000
0.01 0.1 1 10 100 1000 10000Time, s
Tens
ile s
tress
gro
wth
coe
ffici
ent,
Pa.s
294, 0.001283, 0.01288, 0.1291, 1
HHB000, 150 °C
Test ref, strain rate (1/s)
10000
100000
1000000
10000000
0.1 1 10 100 1000Time, s
Tens
ile s
tress
gro
wth
coe
ffici
ent,
Pa.s
268, HGZ000, 0.01282, HHA000, 0.01283, HHB000, 0.01273, HHR000, 0.01
Test ref, material, strain rate (1/s)
150 °C
NPL Report MATC(A)114
12 [MATC(A)114 v#1]
Figure 11: Measurement of the extrudate swell and draw-down of four similar HDPEs using a laser scanning micrometer mounted on a melt flow rate instrument.
Figure 12: Measurement of the extrudate swell and draw-down of four similar HDPEs using a hand-held micrometer.
2.5
2.6
2.7
2.8
2.9
3
0 50 100 150 200 250 300Time, sec
Extru
date
dia
met
er, m
mHHA000, RR290HHB000, RR291HHR000, RR292HGZ000, RR293
2.5
2.6
2.7
2.8
2.9
3
0 50 100 150 200 250
Position along extrudate, mm
Extru
date
dia
met
er, m
m
HHA000, RR290HHB000, RR291HHR000, RR292HGZ000, RR293
NPL Report MATC(A)114
13 [MATC(A)114 v#1]
Figure 13: Interpretation of hand-held micrometer extrudate swell and draw-down measurements as approximate extensional viscosities for four similar HDPEs.
Figure 14: Assessment of the uncertainties in extensional viscosity testing – HFU000 at 0.001 s-1 (test reference ext228).
le ref: MATCa114_low rate extension_19july02_v#1, 08/11/2002
100000
1000000
10000000
0.0001 0.001 0.01Strain rate, 1/s
Appr
oxim
ate
exte
nsio
nal v
isco
sity
, Pa.
s HHA000, RR290HHB000, RR291HHR000, RR292HGZ000, RR293
1000
10000
100000
1000000
10000000
0.01 0.10 1.00 10.00Strain
Tens
ile s
tress
gro
wth
coe
ffici
ent,
Pa.s
0.0
0.1
0.2
0.3
0.4
0.5
Rel
ativ
e co
mbi
ned
unce
rtain
ty in
tens
ile .
st
ress
gro
wth
coe
ffici
ent
Upper 95% limitLower 95% limitTransient extensional viscosityRelative combined uncertainty

![Constant Force Extensional Rheometry of Polymer Solutionsweb.mit.edu/nnf/publications/GHM176.pdf · compared to the weights used by Matta & Tytus [28] and in the current paper) also](https://img.pdfslide.us/doc/110x75/60555fea38efc6208364cd4c/constant-force-extensional-rheometry-of-polymer-compared-to-the-weights-used-by.jpg)