Embed Size (px)
Citation preview
Mon. Not. R. Astron. Soc. 408, 2457–2475 (2010) doi:10.1111/j.1365-2966.2010.17302.x
Low-mass stars and brown dwarfs in Praesepe
D. E. A. Baker,1� R. F. Jameson,1 S. L. Casewell,1 N. Deacon,2,3 N. Lodieu4,5
and N. Hambly6
1Department of Physics and Astronomy, University of Leicester, University Road, Leicester LE1 7RH2Department of Astrophysics, Faculty of Science, Radboud University Nijmegen, PO Box 9010, 6500 GL Nijmegen, the Netherlands3Institute for Astronomy, University of Hawaii, 2680 Woodlawn Drive, Honolulu, HI 96822, USA4Instituto de Astrofısica de Canarias, C/ vıa Lacta s/n, E-38200 La Laguna, Tenerife, Spain5Departamento de Astrofısica, Universidad de La Laguna, E-38250 La Laguna, Tenerife, Spain6Institute for Astronomy, SUPA (Scottish Universities Physics Alliance), University of Edinburgh, Royal Observatory, Blackford Hill, Edinburgh EH9 3HJ
Accepted 2010 July 2. Received 2010 July 2; in original form 2010 January 29
ABSTRACT
Presented are the results of a large and deep optical–near-infrared multi-epoch survey of thePraesepe open star cluster using data from the UKIRT Infrared Deep Sky Survey (UKIDSS)Galactic Clusters Survey. Multiple colour–magnitude diagrams were used to select potentialmembers and proper motions were used to assign levels of membership probability. Fromour sample, 145 objects were designated as high probability members (p ≥ 0.6) with mostof these having been found by previous surveys although 14 new cluster members are alsoidentified. Our membership assignment is restricted to the bright sample of objects (Z < 18).From the fainter sample, 39 candidates were found from an examination of multiple colour–magnitude plots. Of these, two have small but significant membership probabilities. Finally,using theoretical models, cluster luminosity and mass functions were plotted with the latterbeing fitted with a power law of α = 1.11 ± 0.37 for the mass range 0.6 to 0.125 M� andan assumed cluster age of 500 Myr in the UKIDSS Z photometric band. Likewise taking anassumed cluster age of 1 Gyr we find α = 1.10 ± 0.37. Similar values were also found forthe J and K bands. These results compare favourably with the result of Kraus & Hillenbrand(α = 1.4 ± 0.2) but are significantly lower than that of the more recent study conducted byBoudreault et al. (α = 1.8 ± 0.1).
Key words: brown dwarfs – stars: low-mass – stars: luminosity function, mass function –open clusters and associations: individual: Praesepe.
1 IN T RO D U C T I O N
Low-mass stars (LMS) and brown dwarfs (BDs) are the lowestmass objects for which the stellar formation process is applicable(Burrows et al. 2001). Locating these objects in a cluster is particu-larly important as it provides some of the key parameters that helpdefine them, notably age, distance and metallicity. These can in turnbe used to help provide constraints to theoretical evolutionary andatmospheric models. Another important reason for trying to locatethese objects in clusters, particularly older ones, is that as the clusterages it undergoes a process of dynamical evolution, in which thelower mass objects are preferentially ejected from the cluster intothe field (de La Fuente Marcos & de La Fuente Marcos 2000). Thisejection of objects causes changes to occur in the cluster’s luminos-ity and mass function, which for a gravitationally bound association
�E-mail: [email protected]
can be considered a proxy for the initial mass function (IMF) of thesystem. Although there have been many previous studies aimed atcharacterising the IMF, they have often come from many surveysconducted in different filters and with different instruments. For thisreason the UKIRT Infrared Deep Sky Survey (UKIDSS) GalacticClusters Survey (GCS; Lawrence et al. 2007) was devised. One ofthe clusters surveyed is the open star cluster of Praesepe.
Praesepe lies at a distance of ≈180 pc [(M − m)0 = 6.30 ± 0.003;van Leeuwen 2009] with zero reddening and near solar metallic-ity. Whilst the distance is fairly well constrained, there is a lack ofagreement with regards to its age. Allen (1973) placed the value ofPraesepe’s age towards the lower end of the scale at 430 Myr and itwas the standard value for many years. Later work by Vandenberg& Bridges (1984) placed it at a much higher value of 900 Myr. Theirvalue was obtained via the fitting of models describing the main se-quence to the observed colour–magnitude diagrams (CMDs). Thewidest range of age estimates is reported by Tsvetkov (1993) whoplaced a similar lower limit of 540 Myr but an upper limit of over
C© 2010 The Authors. Journal compilation C© 2010 RAS
2458 D. E. A. Baker et al.
1.5 Gyr. The method of Tsvetkov does not depend on the fittingof the zero-age main-sequence but instead relied on models usedto calculate the ages of δ Scuti stars that are present within thecluster. Finally, Kharchenko et al. (2005) placed the age in the mid-dle at 795 Myr after using the Padova grid of post-main-sequenceisochrones from Girardi et al. (2002). We consider this to be closestto the most likely age as there is some evidence that the Hyadescluster at 625 Myr shares a common origin with Praesepe (Eggen1960; Henry, Anderson & Hesser 1977). However, due to the un-certainty that exists, two ages for the cluster have been adoptedthroughout this paper. The first is an age of 500 Myr and the sec-ond 1 Gyr. These were chosen as they coincide nicely with agesfor which the NextGen (Baraffe et al. 1998) and DUSTY (Chabrieret al. 2000) theoretical models have been calculated. In this work wehave used the BT-NextGen and BT-DUSTY models which are basedon the aforementioned versions except they have been calculatedwith updated opacity data.1
Praesepe’s members all have a common proper motion centredaround μα = −35.81 mas yr−1 and μδ = −12.85 mas yr−1, againfrom the work by van Leeuwen based on rereduced Hipparcos data.This distinct proper motion allows relatively easy photometric andastrometric membership surveys to take place. The ‘high-mass’stellar population (V < 13) was identified by Klein-Wassink (1927)with ‘intermediate-mass’ (V < 17) and ‘low-mass’ M dwarfs (R >
20) being identified by Jones & Cudworth (1983) and Hambly et al.(1995a), respectively. Further work has been carried out by Pinfieldet al. (1997, 2003), Adams et al. (2002), Chappelle et al. (2005) andGonzalez-Garcıa et al. (2006). However, these surveys have oftenproved to be contaminated with an excess of field stars, as in thecase of Adams et al. or have no proper motion information (Pinfieldet al. 1997). The most comprehensive study to date was produced byKraus & Hillenbrand (2007), who used data from the Sloan DigitalSky Survey (SDSS; York et al. 2000), Two Micron All Sky Survey(2MASS; Skrutskie et al. 2006), USNOB1.0 (Monet et al. 2003)and finally UCAC2 (Zacharias et al. 2004) to find 1010 candidatemembers of Praesepe, 442 being identified for the first time, downto a spectral type of around M5. The work presented in this paper isagain a return to a search for this ‘low-mass’ population; however,we have based our search on data made available from the UKIDSS,2MASS and SDSS.
2 TH E SU RV EY S
UKIDSS is a near-infrared sky survey that aims to survey some7500 deg2 of the northern sky within its science operation lifetime.The depth that it aims to achieve will be three magnitudes deeperthan that offered by 2MASS, making UKIDSS an ideal compan-ion to the SDSS in areas where the two coincide. UKIDSS usesthe 3.8-m United Kingdom Infrared Telescope (UKIRT) located onMauna Kea and the Wide Field Camera (WFCAM). WFCAM itselfconsists of four Rockwell Hawaii-II (HgCdTe) detectors, each ofdimension 2048 × 2048 pixels. A single pixel represents a scaleof 0.4 arcsec and the spacing between the detectors requires thatfour paw prints be undertaken in order to construct a single 0.8 deg2
tile. The UKIDSS survey program consists of five separate com-ponents: The Large Area Survey, The Galactic Plane Survey, TheDeep Extragalactic Survey, The Ultra Deep Survey and The Galac-tic Clusters Survey, which provides the focus and data for this paper.
1 http://phoenix.ens-lyon.fr/simulator/index.faces
For more specific information on the UKIDSS programme a set ofreference papers have been produced which aim to provide technicaldocumentation on the infrared survey instrument itself (WFCAM;Casali et al. 2007), the WFCAM photometric system (Hewett et al.2006; Hodgkin et al. 2009), the UKIDSS surveys (Lawrence et al.2007), the pipeline processing system (Irwin et al., in prepara-tion) and finally the science archive as described in Hambly et al.(2008).
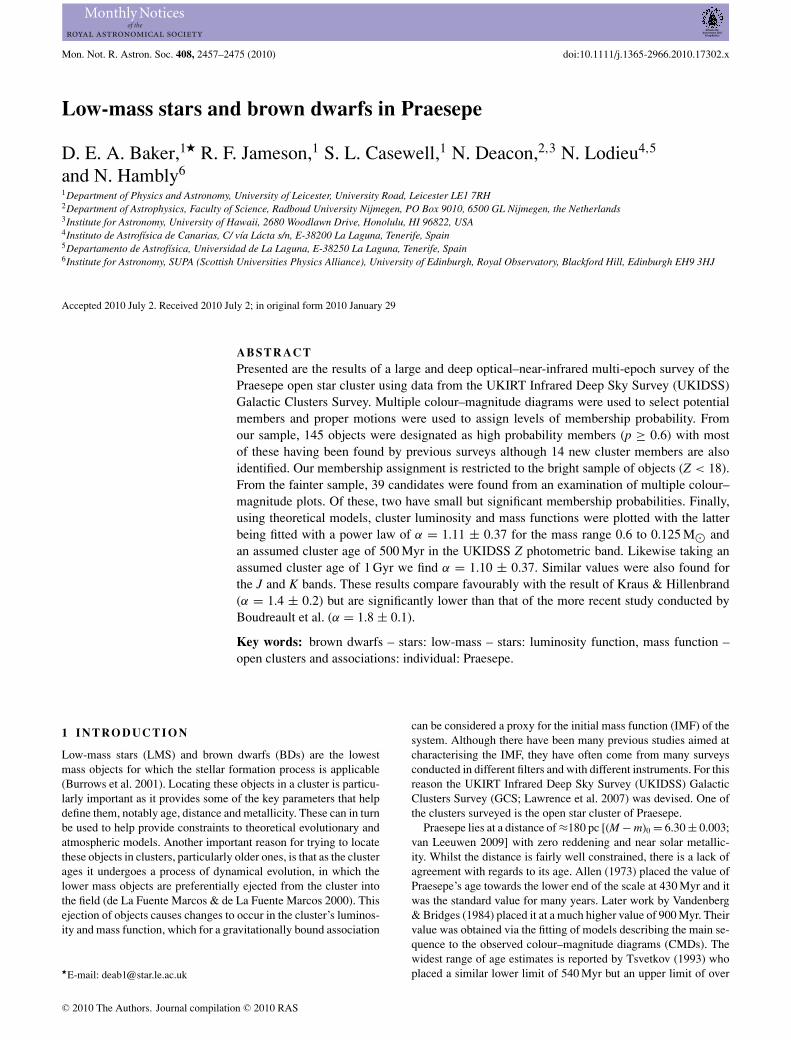
The GCS aims to enable a comprehensive study of 10 star-forming regions and clusters, with hopes of detailing the form ofthe IMF and how it is affected by the environment in the substellarregime. All the data for these programmes is processed by the Cam-bridge Astronomical Survey Unit (CASU) and then archived andreleased by the WFCAM Science Archive (WSA) located in Edin-burgh. Currently, UKIDSS is on Data Release 6 (DR6) as of 2009October 13 for the ESO community (and DR3 as of the 2009 June5 for the world release). DR6 has reported depths of Z = 20.4, Y =20.1, J = 19.6, H = 18.8 and K = 18.2 (first epoch). At the timeof writing the Praesepe cluster has not yet been fully surveyed withonly ≈23 deg2 being available in all filters and imposing a 3◦ ra-dial selection from the cluster centre ≈18 deg2. This can be clearlyseen in Fig. 1. Because of the missing region consisting of mainlythe cluster centre, a clear lack of overlap will exist between thisand any of the previous bodies of work. As such, this work fails toretrieve many of the previously identified cluster members and soacts to serve as an incremental part of a full cluster survey withinthe UKIDSS programme.
To retrieve the data from the WSA a similar SQL query tothat of Lodieu et al. (2007a) was devised (see Appendix Afor the full queries). The query was adapted to cross matchwith the SDSS through the use of the newly implementedgcsSourceXDR7PhotoObj table. The class parameter in each ofthe five filter bands was set to only select objects that matched withcriteria −2 or −1 in value, i.e. those that had been deemed stellarin nature by the pipeline. While this clearly limits the number ofsources by requiring the object to be present in all bands, particu-larly at the faint end (Lodieu et al. 2007b), it does mean a greaterlevel of reliability for the data that have been selected. Alongsidethe class selection criteria, the query also placed various qualitycontrol mechanisms as defined by the use of the post processing
Figure 1. The full coverage of the Praesepe star cluster available fromUKIDSS DR6 with the blue region denoting the sources present in the 3◦radial selection.
C© 2010 The Authors. Journal compilation C© 2010 RAS, MNRAS 408, 2457–2475
Low-mass stars and brown dwarfs in Praesepe 2459
error bits flags on the UKIDSS data and the flags contained withinthe SDSS subsection.2
The SQL query retrieved a total of 79 162 sources from the archive.When asking for the 2MASS and SDSS cross tables, the UKIDSSsource identifier was used in order to merge the two separate queriesinto a master table, with each source containing any data fromUKIDSS, 2MASS and/or SDSS. This match was performed usingthe TOPCAT program in the Starlink suite of programs. To try andminimize the contamination due to field stars at the outer edges ofthe survey area where the cluster is more diffuse we employed aradial cut of 3◦ from the cluster centre. This left 59 779 sources,which we call our GCS data set.
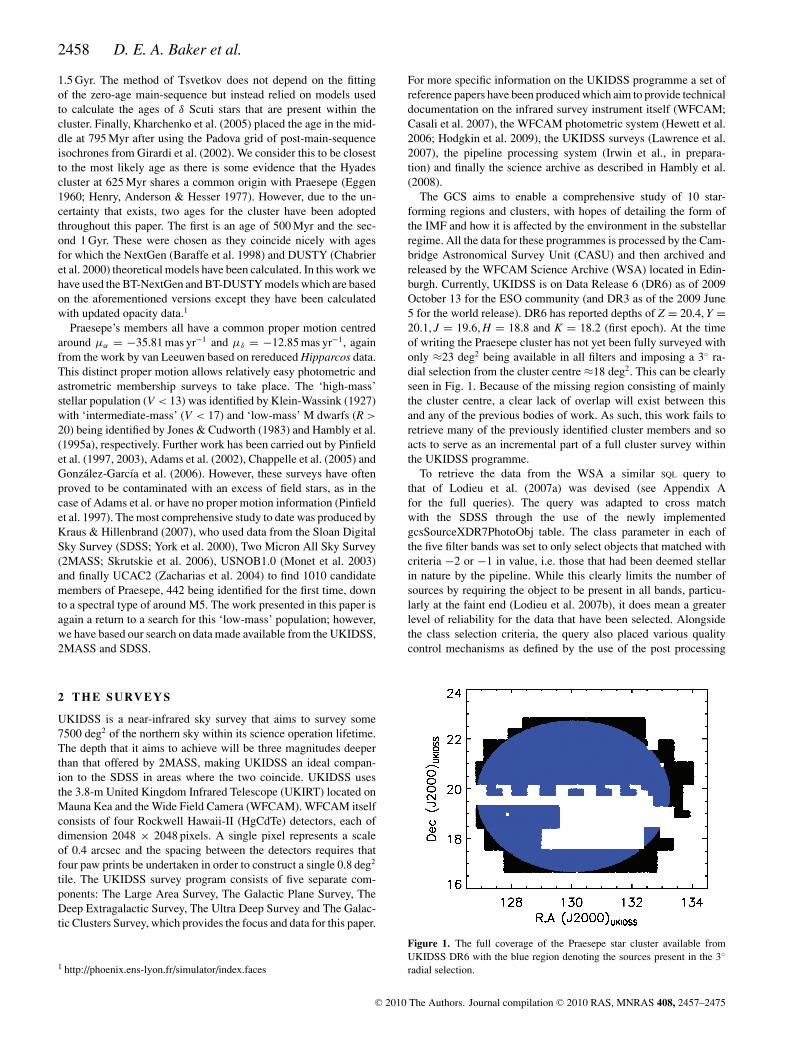
The objects found by Adams et al. (2002), Chappelle et al. (2005),Hambly et al. (1995b), Gonzalez-Garcıa et al. (2006), Kraus &Hillenbrand (2007), Pinfield et al. (1997) and Pinfield et al. (2003)were then matched to this GCS data set to select only those whosesurvey areas overlapped and could be recovered from our data. Intotal 642 sources were recovered from Adams et al. (who in totalreport 4954 objects for their whole survey), six from Chappelleet al. (26 in total), 109 from Hambly et al. (515 in total), zero fromGonzalez-Garcıa et al. (20 in total), 274 from Kraus & Hillenbrand(1130 in total) and five from each of the Pinfield surveys,3 these canall be seen in Fig. 2.
The first run of the SQL query contained a cross-correlation be-tween the UKIDSS DR6 GCS data set with its nearest 2MASScounterpart. This cross-correlation allows a determination of propermotion for the matched objects. Typically over a small area the as-trometry provided by 2MASS is good to 50 mas (Skrutskie et al.2006). The CASU pipeline performs its astrometric calibration forthe WFCAM data based on point sources within the 2MASS cat-alogues. Hence, accurate relative proper motions can be derivedby simply taking the difference in 2MASS and WFCAM positionsand dividing by the epoch difference (Lodieu et al. 2007a; Jamesonet al. 2008). This was automatically done and the results convertedinto mas yr−1 by the SQL query when run through the WSA datacentre. The proper motions are described as relative as they ex-hibit a distinct movement in contrast to the comparably stationarybackground. The accuracy of the astrometry and the average timebaseline of around 5 yr provides an error of ≈10 mas yr−1. Of the59 779 sources 34 990 were found to have 2MASS counterpartsleaving 24 789 with no 2MASS identifier. Because 2MASS lacksthe depth of UKIDSS we only retrieved the brighter of our sample(K < 16.5) from this data set, with the SDSS data set providing thefainter candidates. (The extent of the data set can be seen in Fig. 2.)
Thanks to the newly implemented gcsSourceXDR7PhotoObj ta-ble linking the WFCAM DR6 and SDSS DR7 data sets at the WSA,a cross-correlation between the UKIDSS data set and that of theSDSS was also available for interrogation. SDSS DR7 reportedhaving surveyed 11 000 deg2 in all of its five filters (ugriz′) whichincluded the full area of Praesepe (Kraus & Hillenbrand 2007).Upon inspection of the survey dates it became apparent that only ashort amount of time had elapsed between the survey of Praesepeby Sloan and that of UKIDSS (≈2–2.5 yr on average). The lack of a
2 The SDSS flag selections were taken from clean photometry sectionof the SDSS SQL query sample page http://cas.sdss.org/dr6/en/help/docs/realquery.asp. Because of the nature of the objects being investigated theconstraints were placed only on bands in which the object was likely to bepresent i.e the i and z′ bands.3 The objects retrieved from the two Pinfield surveys are the same fiveobjects.
Figure 2. (Z − J, Z) CMD for the ≈18 deg2 of the Praesepe cluster selectedfrom the WSA with a corresponding 2MASS source within the inner 3◦ ofthe cluster centre. Matches to this data set from the surveys of Adamset al. (2002), Chappelle et al. (2005), Hambly et al. (1995b), Kraus &Hillenbrand (2007) and Pinfield et al. (1997, 2003) are also shown. Thesurvey of Gonzalez-Garcıa et al. did overlap with this area; however, forthose sources within the region no matches were found, due possibly to ourstrict selection criteria on the UKIDSS data.
decent baseline therefore warranted a different approach in order tocalculate proper motions and thus cluster membership assignmentfrom that which will be detailed for 2MASS. Again the 59 779UKIDSS sources were retrieved with 53 562 having an SDSS coun-terpart and 6253 being unique to UKIDSS. In total UKIDSS has2225 unique sources for which no counterpart has been found ineither 2MASS of SDSS (30 998 objects were present in all threesurveys).
3 MEMBERS O F PRAESEPE FRO M 2 MASS
This section will describe the processes undertaken to construct thelist of candidate cluster members in Praesepe from the UKIDSSCMDs, and where possible proper motion vector point analysisbased from the 2MASS–UKIDSS cross-correlation. The procedureis as follows.
(i) Select only those sources that have a 2MASS identifier asso-ciated with their UKIDSS identifier and are within 3◦ of the definedcluster centre (34 990 objects).
(ii) To check the proper motion errors fit the reduced data set(CMD and radius selections imposed) with a two-dimensionalGaussian, then use the σ of the Gaussian to act as a proxy forthe error.
(iii) Using the theoretical isochrones, select objects that are nomore than 0.3 mag to the left, and all of those on the right in boththe (Z − J, Z) and (Y − K, Y) CMDs.
C© 2010 The Authors. Journal compilation C© 2010 RAS, MNRAS 408, 2457–2475
2460 D. E. A. Baker et al.
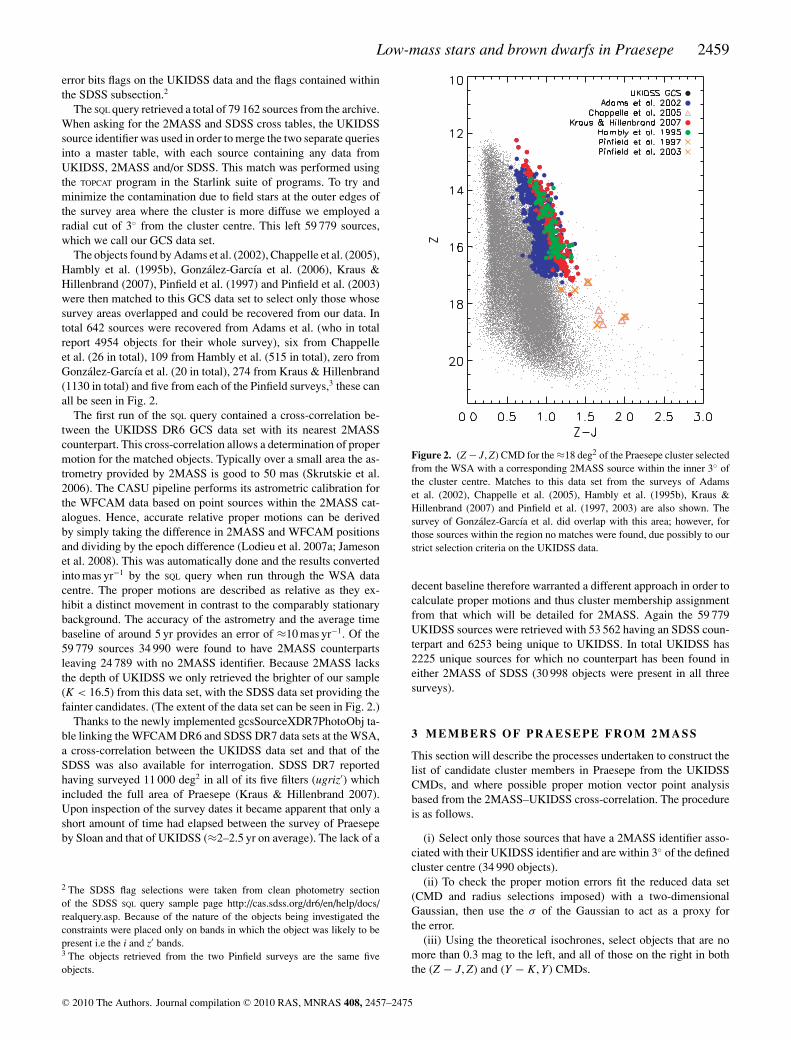
Figure 3. On the left is the VPD for the sources selected from our spatial and colour cuts in the (Z − J, Z) and (Y − K, Y) CMD as shown in the middle andon the right, respectively. The cluster can be seen as the overdensity of objects around −30 and −10 mas yr−1 in right ascension and declination. The greendashed line is the theoretical isochrone for the BT-NextGen evolutionary model and the blue the BT-DUSTY equivalent. Both the 500 Myr and 1 Gyr flavourshave been considered due to the uncertainty in the age of Praesepe.
(iv) Analyse the resulting vector point diagram (VPD) for thiscolour selected data set across a range of magnitude bins and infer-ring from the probability fitting routine a level of cluster member-ship for each object. Then selecting out a high probability sample(HPM) as those objects with assigned probabilities p ≥ 0.60.
(v) Again look at this HPM sample and reject any obvious non-photometric candidates.
3.1 Calculating proper motions
The cross-correlation of UKIDSS with 2MASS provided a value forthe matched objects proper motion in μα cosδ and μδ . An estimate ofthe errors based on the time baseline and specifications of 2MASSis ≈10 mas yr−1. To confirm this error estimate, the proper motionsfor those sources that lay within 3◦ of the cluster centre (whichwere spread over a region of proper motion space from −150 to150 mas yr−1) were divided into bins of 20 mas yr−1 and the numberin each bin totalled. A two-dimensional Gaussian was then fittedenabling, a determination of the cluster spread. Objects that weredefined as being outside of the 3σ limit were then removed andthe fit reapplied. The σ of the Gaussian then provides an estimatefor the error in the proper motions (Jameson et al. 2008) and wasfound to be of the order of ≈12 mas yr−1, instead of our assumed10 mas yr−1.
3.2 Colour–magnitude diagrams
In order to select candidates from the CMDs we made use of the BT-NextGen and BT-DUSTY theoretical isochrones which have had thedistance modulus of the cluster added to them in order. The modelsrepresent different evolutionary paths for describing objects withand without ‘dusty’ atmospheres. Because of the temperatures andmasses being explored by this survey the objects involved inhabitboth of these regimes and so the two isochrones need to be com-
bined. To create a composite isochrone line, the data points fromthe BT-NextGen isochrone in the relevant band filter were takento their minimum temperature ≈3000 K. This temperature lies justabove where dust grains begin to form in the BD atmosphere andthe BT-NextGen models become invalid. We thus combine the BT-DUSTY isochrone models (Teff < 3000 K) with the BT-Nextgenmodels at this point with a simple straight line added in between theresulting break. This composite isochrone was calculated for boththe 500 Myr and 1 Gyr evolutionary models due to the uncertaintyin the age of Praesepe. It was then employed in both the (Z − J, Z)and (Y − K, Y) CMDs with sources lying no more than 0.3 mag tothe left in the horizontal direction from the line and those to the rightbeing selected and passed to the proper motion fitting routine. SeeFig. 3 for the VPD and the two CMDs associated with the spatialand colour cut selections. This process selected 7127 objects outof the possible 34 990. This selection is rather conservative as itaimed to include all the cluster members from the previous surveys,most notably that of Adams et al. (2002) whose objects appear farbluer than those found by both Kraus & Hillenbrand (2007) and byHambly et al. (1995b).
4 C LUSTER DI STRI BU TI ONS
AND MEMBERSHI P PROBABI LI TY
To calculate the membership probabilities for the data sample twodistributions were fitted to the cluster. One, a circularly symmet-ric Gaussian as originally employed by Sanders (1971) and alsoFrancic (1989), and two, an exponential decaying in the directionof the cluster proper motion centre coupled with a perpendicularlyoriented Gaussian (Hambly et al. 1995b; Deacon & Hambly 2004).For the fitting process to work the cluster proper motion centre(−35.81,−12.85) is rotated from its original position on the VPDto lie on the y-axis. The following set of equations describe the fielddistribution (�f ), cluster distribution (�c) and the normalization to
C© 2010 The Authors. Journal compilation C© 2010 RAS, MNRAS 408, 2457–2475
Low-mass stars and brown dwarfs in Praesepe 2461
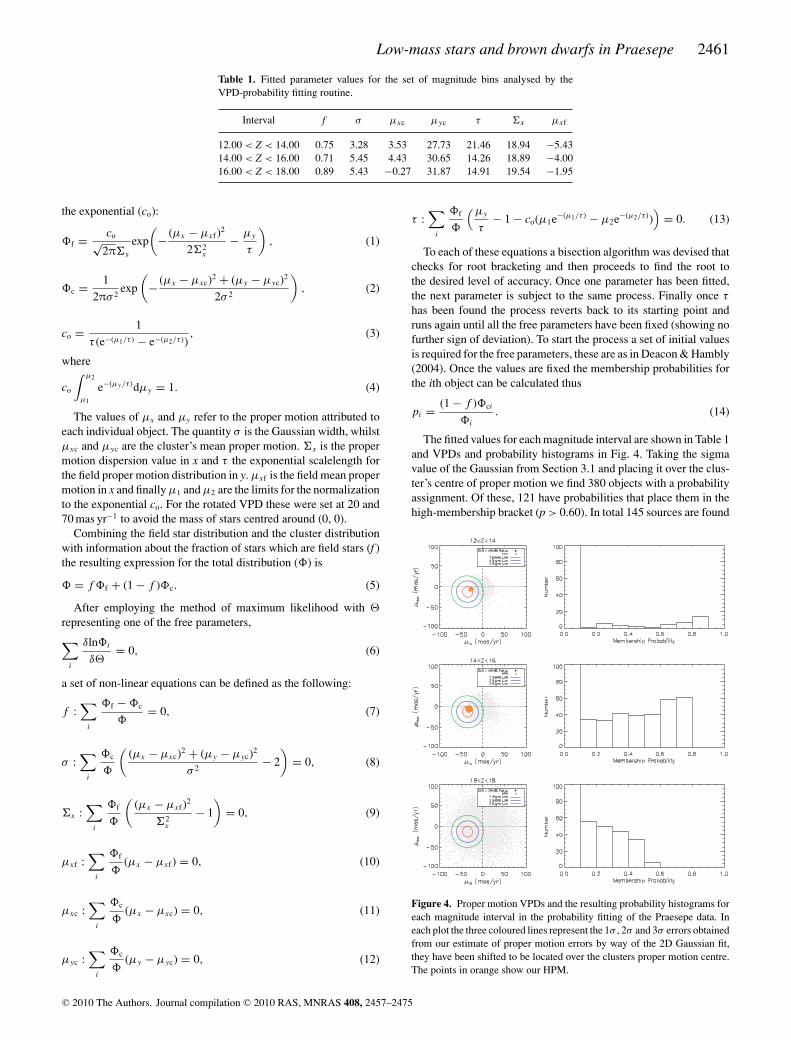
Table 1. Fitted parameter values for the set of magnitude bins analysed by theVPD-probability fitting routine.
Interval f σ μxc μyc τ �x μxf
12.00 < Z < 14.00 0.75 3.28 3.53 27.73 21.46 18.94 −5.4314.00 < Z < 16.00 0.71 5.45 4.43 30.65 14.26 18.89 −4.0016.00 < Z < 18.00 0.89 5.43 −0.27 31.87 14.91 19.54 −1.95
the exponential (co):
�f = co√2π�x
exp
(− (μx − μxf )2
2�2x
− μy
τ
), (1)
�c = 1
2πσ 2exp
(− (μx − μxc)2 + (μy − μyc)2
2σ 2
), (2)
co = 1
τ (e−(μ1/τ ) − e−(μ2/τ )), (3)
where
co
∫ μ2
μ1
e−(μy/τ )dμy = 1. (4)
The values of μx and μy refer to the proper motion attributed toeach individual object. The quantity σ is the Gaussian width, whilstμxc and μyc are the cluster’s mean proper motion. �x is the propermotion dispersion value in x and τ the exponential scalelength forthe field proper motion distribution in y. μxf is the field mean propermotion in x and finally μ1 and μ2 are the limits for the normalizationto the exponential co. For the rotated VPD these were set at 20 and70 mas yr−1 to avoid the mass of stars centred around (0, 0).
Combining the field star distribution and the cluster distributionwith information about the fraction of stars which are field stars (f )the resulting expression for the total distribution (�) is
� = f �f + (1 − f )�c. (5)
After employing the method of maximum likelihood with
representing one of the free parameters,
∑i
δln�i
δ= 0, (6)
a set of non-linear equations can be defined as the following:
f :∑
i
�f − �c
�= 0, (7)
σ :∑
i
�c
�
((μx − μxc)2 + (μy − μyc)2
σ 2− 2
)= 0, (8)
�x :∑
i
�f
�
((μx − μxf )2
�2x
− 1
)= 0, (9)
μxf :∑
i
�f
�(μx − μxf ) = 0, (10)
μxc :∑
i
�c
�(μx − μxc) = 0, (11)
μyc :∑
i
�c
�(μy − μyc) = 0, (12)
τ :∑
i
�f
�
(μy
τ− 1 − co(μ1e−(μ1/τ ) − μ2e−(μ2/τ ))
)= 0. (13)
To each of these equations a bisection algorithm was devised thatchecks for root bracketing and then proceeds to find the root tothe desired level of accuracy. Once one parameter has been fitted,the next parameter is subject to the same process. Finally once τ
has been found the process reverts back to its starting point andruns again until all the free parameters have been fixed (showing nofurther sign of deviation). To start the process a set of initial valuesis required for the free parameters, these are as in Deacon & Hambly(2004). Once the values are fixed the membership probabilities forthe ith object can be calculated thus
pi = (1 − f )�ci
�i
. (14)
The fitted values for each magnitude interval are shown in Table 1and VPDs and probability histograms in Fig. 4. Taking the sigmavalue of the Gaussian from Section 3.1 and placing it over the clus-ter’s centre of proper motion we find 380 objects with a probabilityassignment. Of these, 121 have probabilities that place them in thehigh-membership bracket (p > 0.60). In total 145 sources are found
Figure 4. Proper motion VPDs and the resulting probability histograms foreach magnitude interval in the probability fitting of the Praesepe data. Ineach plot the three coloured lines represent the 1σ , 2σ and 3σ errors obtainedfrom our estimate of proper motion errors by way of the 2D Gaussian fit,they have been shifted to be located over the clusters proper motion centre.The points in orange show our HPM.
C© 2010 The Authors. Journal compilation C© 2010 RAS, MNRAS 408, 2457–2475
2462 D. E. A. Baker et al.
to have a p ≥ 0.60. The 24 lying outside the sigma selection arestill very much consistent with the cluster as can be seen by smallspread of objects proper motion space in Fig. 4.
5 MEMBERS O F PRAESEPE FROM SDSS
In this section the process for locating any possible candi-dates/members of the Praesepe cluster from available data withinthe cross link between UKIDSS and SDSS will be described.
(i) Select those objects that are again within the 3◦ radial cutfrom the cluster centre. These objects are only present in UKIDSS–SDSS data set. Any corresponding SDSS–2MASS source wouldhave been treated within the previous section.
(ii) Select the list of candidate objects from six CMDs.(iii) Extract the FITS files for these objects from the WSA and
SDSS data access server.(iv) Calculate a pixel to pixel transformation between the two
images and using the epoch difference calculate a proper motion.(v) Perform a basic probability analysis on the resulting data.
5.1 Extracting the candidates
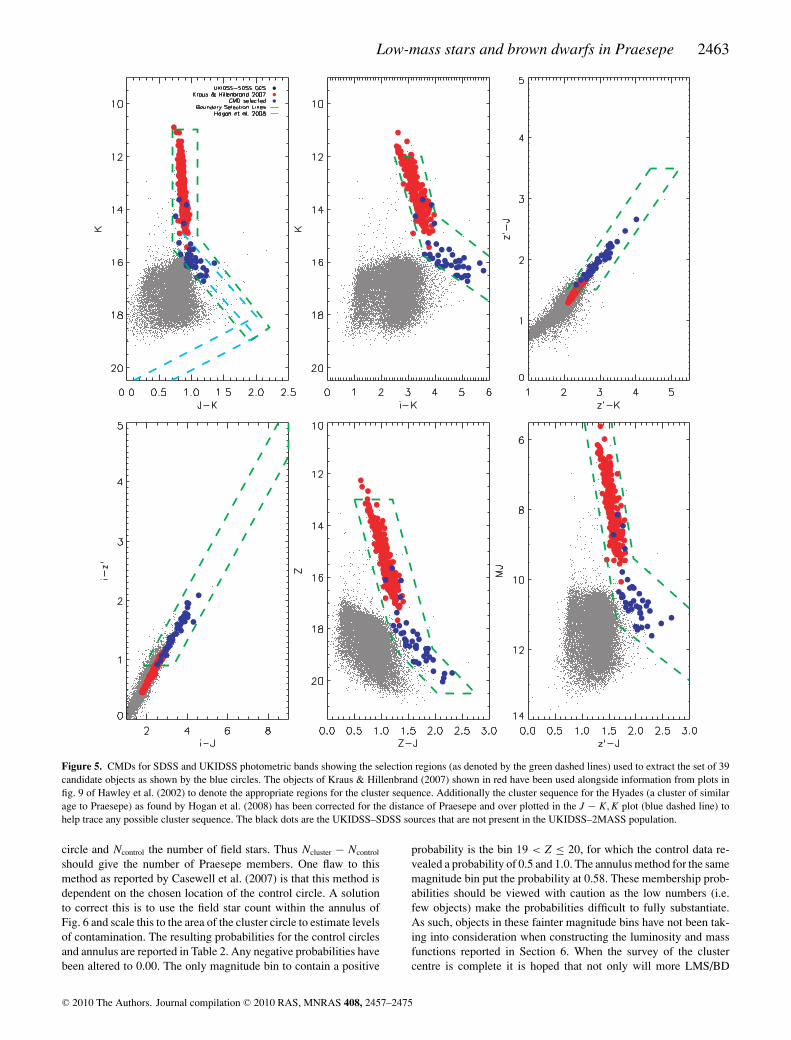
Performing the same radial cut with objects only present in theUKIDSS–SDSS match (no 2MASS counterpart) led to a selectionof 22 564 objects. To extract the candidates from this list, a series ofphotometric cuts were applied in a range of different CMDs. Thesecan be seen in Fig. 5. These CMDs made use of a range of differentfilters and known locations of LMS/VLMS and BDs as detailed byHawley et al. (2002). Objects within these predefined regions wereselected for further analysis.
5.2 Refinement of proper motions
The primary problem with the SDSS data set is the small epochdifference between the two surveys which subsequently results inlarge errors on the proper motion. This, coupled with a small num-ber of objects (<100) means that the analysis as performed for the2MASS data is not applicable. An alternate approach has thereforebeen taken in order to assign membership probabilities to these can-didates. To begin with, suitable queries were developed to allow theacquisition of the catalogue and FITS flat files from each survey’sdata centre.4 The candidate object were then located and a set of ref-erence objects selected. These reference objects had to be commonto both chips (appearing in each epoch), be in the magnitude range12.0 < Z < 18.0, have ellipticities less than 0.2 (from UKIDSScatalogue data) and not sit within 5 per cent of the chip border (inpixels) in order to help minimize any radial distortion effects.
The list of reference objects are used to create a 12 parametertransformation (where too few reference objects were present forthe quadratic fit a linear six parameter fit was tried instead) thatallows the motion of the candidate object between the two epochsto be calculated. Reference objects that are shown to be moving ata rate greater than three times the rms value of the fit are discarded.The revised reference list is again passed to the fitting routines inorder to calculate the correct coefficients that describe the motion
4 For the SDSS data this involved creating a few specific requests as thecatalogue data are split amongst a wide range of files. The SDSS DAS hasalso recently been updated to SDSS DAS version 2 for use with DR7, usersare instructed to read the DR7 release website for more information.
between the two epochs. This motion is then converted into mas yr−1
through the use of the following equations:
μα = ((CD1 1 × x + y × CD1 2) × 3600 × 1000)
epoch difference, (15)
μδ = ((CD2 1 × x + y × CD2 2) × 3600 × 1000)
epoch difference. (16)
The quantities CD1 1, CD1 2, CD2 1 and CD2 2 are the worldcoordinate transformation matrix elements contained within theFITS header (Greisen & Calabretta 2002), whilst x and y simplyrefer to the change in pixel elements. The direction in μα is finallyfurther corrected by multiplying by the appropriate cos δ value.
In order to calculate errors, the magnitudes of all possible objectswere calculated on the reference image frames using the relevantcalculations listed on the SDSS5 and WSA6 pages. The x and ypixel centroiding errors reported for each object in the cataloguefiles were then totalled for each bin of width 2 mag and dividedby the number in that magnitude bin to give an average centroidinguncertainty value. These values were then added in quadrature withthe rms in that particular direction as found by the 12 parameterquadratic fit:
error pm =√
rms2 + err2epoch1 + err2
epoch2. (17)
The values representing the error found in the x or y direction forboth epoch 1 and epoch 2 measurements are in turn calculated fromthe following:
μα err = ((CD1 1 × xerr + yerr × CD1 2) × 3600 × 1000)
epoch difference,
(18)
μδ err = ((CD2 1 × xerr + yerr × CD2 2) × 3600 × 1000)
epoch difference,
(19)
where xerr and yerr represent the centroiding errors in the x and ydirections as described in the previous paragraph. The errors on theproper motion are likely an overestimation of the astrometric errorsas they are based on the rms from the fitting process rather than anerror in the transformed coordinate.
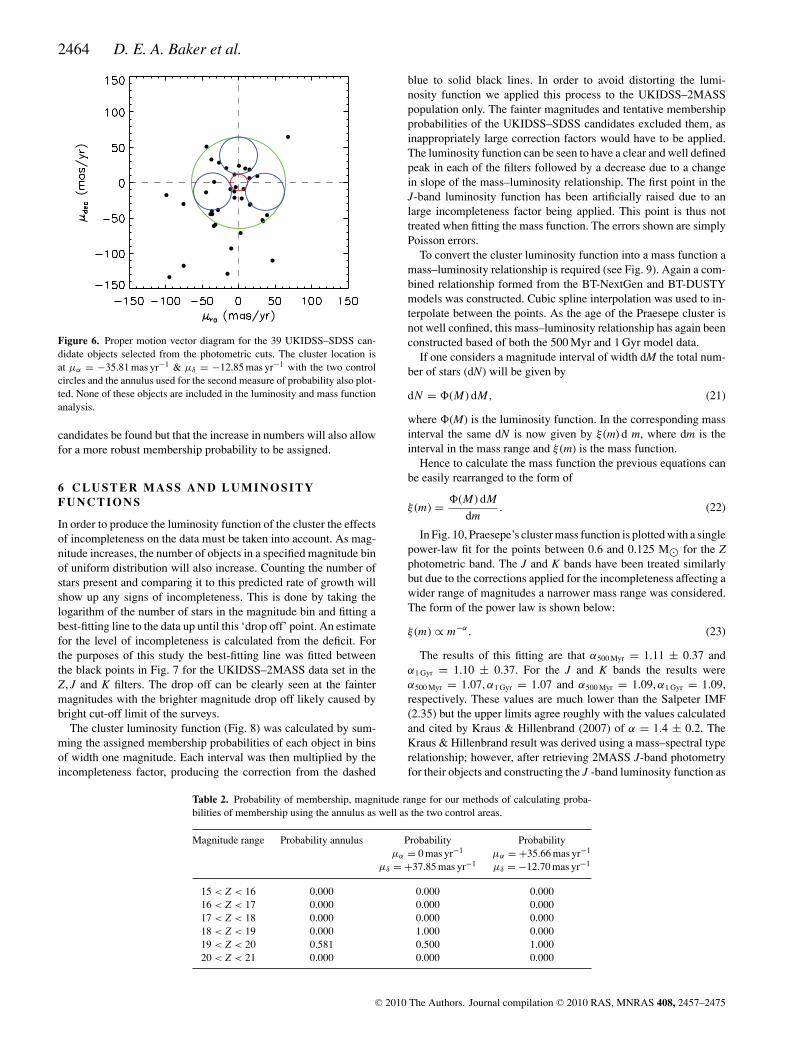
To try and calculate membership probabilities for these objects,an attempt at using control data to determine levels of contamina-tion was undertaken.The cluster circle and two control circles ofradius 26 arcsec were used. The radius value is the average valuetaken from the 12 parameter fit information, ignoring any obviousdiscrepancies (as objects become fainter the centroiding errors be-come larger). Those that were in the faintest magnitude bin hadcentroiding errors a factor ten larger than for the other candidatesand so were discounted from the average). The circles were locatedat the same distance from (0,0) in proper motion space and as isusual, the data were split into magnitude bins with the probabilitybeing calculated using equation (20):
Pmembership = Ncluster − Ncontrol
Ncluster. (20)
Pmembership is the probability assigned for a particular magnitudebin, Ncluster the number of field and cluster stars within the cluster
5 SDSS magnitude algorithm calculations: http://www.sdss.org/dr6/algorithms/fluxcal.html#counts2mag6 WFCAM magnitude algorithm calculations: http://surveys.roe.ac.uk/wsa/flatFiles.html#catmags
C© 2010 The Authors. Journal compilation C© 2010 RAS, MNRAS 408, 2457–2475
Low-mass stars and brown dwarfs in Praesepe 2463
Figure 5. CMDs for SDSS and UKIDSS photometric bands showing the selection regions (as denoted by the green dashed lines) used to extract the set of 39candidate objects as shown by the blue circles. The objects of Kraus & Hillenbrand (2007) shown in red have been used alongside information from plots infig. 9 of Hawley et al. (2002) to denote the appropriate regions for the cluster sequence. Additionally the cluster sequence for the Hyades (a cluster of similarage to Praesepe) as found by Hogan et al. (2008) has been corrected for the distance of Praesepe and over plotted in the J − K, K plot (blue dashed line) tohelp trace any possible cluster sequence. The black dots are the UKIDSS–SDSS sources that are not present in the UKIDSS–2MASS population.
circle and Ncontrol the number of field stars. Thus Ncluster − Ncontrol
should give the number of Praesepe members. One flaw to thismethod as reported by Casewell et al. (2007) is that this method isdependent on the chosen location of the control circle. A solutionto correct this is to use the field star count within the annulus ofFig. 6 and scale this to the area of the cluster circle to estimate levelsof contamination. The resulting probabilities for the control circlesand annulus are reported in Table 2. Any negative probabilities havebeen altered to 0.00. The only magnitude bin to contain a positive
probability is the bin 19 < Z ≤ 20, for which the control data re-vealed a probability of 0.5 and 1.0. The annulus method for the samemagnitude bin put the probability at 0.58. These membership prob-abilities should be viewed with caution as the low numbers (i.e.few objects) make the probabilities difficult to fully substantiate.As such, objects in these fainter magnitude bins have not been tak-ing into consideration when constructing the luminosity and massfunctions reported in Section 6. When the survey of the clustercentre is complete it is hoped that not only will more LMS/BD
C© 2010 The Authors. Journal compilation C© 2010 RAS, MNRAS 408, 2457–2475
2464 D. E. A. Baker et al.
Figure 6. Proper motion vector diagram for the 39 UKIDSS–SDSS can-didate objects selected from the photometric cuts. The cluster location isat μα = −35.81 mas yr−1 & μδ = −12.85 mas yr−1 with the two controlcircles and the annulus used for the second measure of probability also plot-ted. None of these objects are included in the luminosity and mass functionanalysis.
candidates be found but that the increase in numbers will also allowfor a more robust membership probability to be assigned.
6 C LUSTER M A SS AND LUMINOSITY
F U N C T I O N S
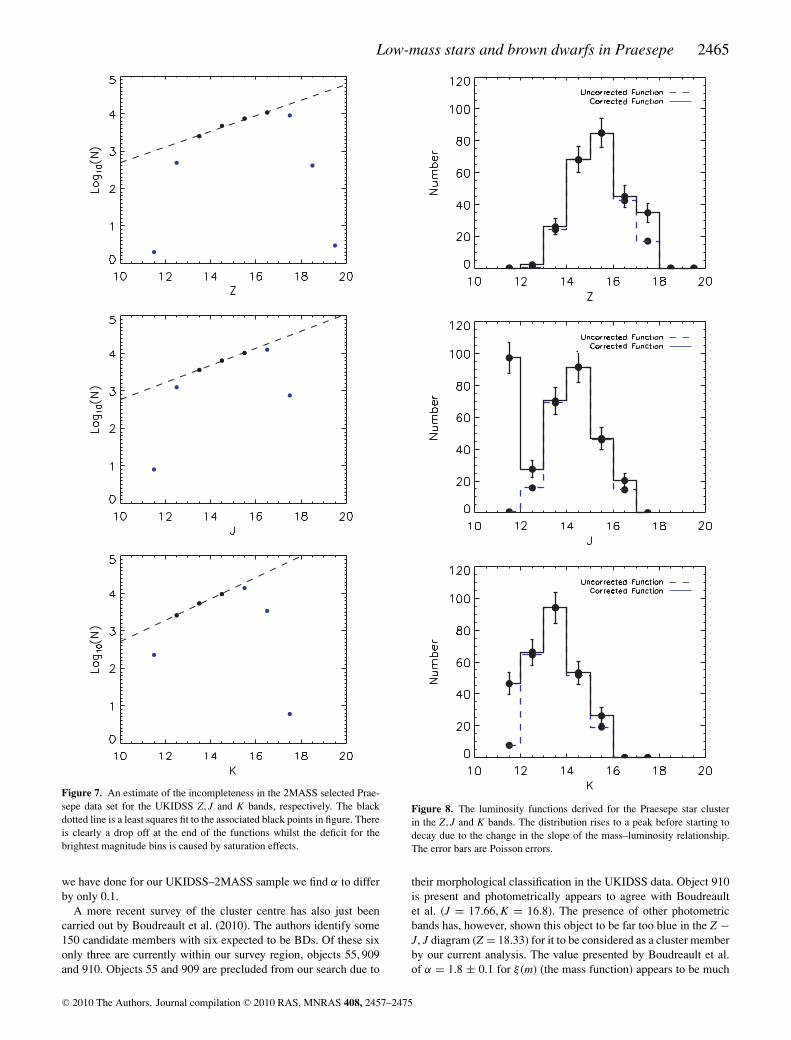
In order to produce the luminosity function of the cluster the effectsof incompleteness on the data must be taken into account. As mag-nitude increases, the number of objects in a specified magnitude binof uniform distribution will also increase. Counting the number ofstars present and comparing it to this predicted rate of growth willshow up any signs of incompleteness. This is done by taking thelogarithm of the number of stars in the magnitude bin and fitting abest-fitting line to the data up until this ‘drop off’ point. An estimatefor the level of incompleteness is calculated from the deficit. Forthe purposes of this study the best-fitting line was fitted betweenthe black points in Fig. 7 for the UKIDSS–2MASS data set in theZ, J and K filters. The drop off can be clearly seen at the faintermagnitudes with the brighter magnitude drop off likely caused bybright cut-off limit of the surveys.
The cluster luminosity function (Fig. 8) was calculated by sum-ming the assigned membership probabilities of each object in binsof width one magnitude. Each interval was then multiplied by theincompleteness factor, producing the correction from the dashed
blue to solid black lines. In order to avoid distorting the lumi-nosity function we applied this process to the UKIDSS–2MASSpopulation only. The fainter magnitudes and tentative membershipprobabilities of the UKIDSS–SDSS candidates excluded them, asinappropriately large correction factors would have to be applied.The luminosity function can be seen to have a clear and well definedpeak in each of the filters followed by a decrease due to a changein slope of the mass–luminosity relationship. The first point in theJ-band luminosity function has been artificially raised due to anlarge incompleteness factor being applied. This point is thus nottreated when fitting the mass function. The errors shown are simplyPoisson errors.
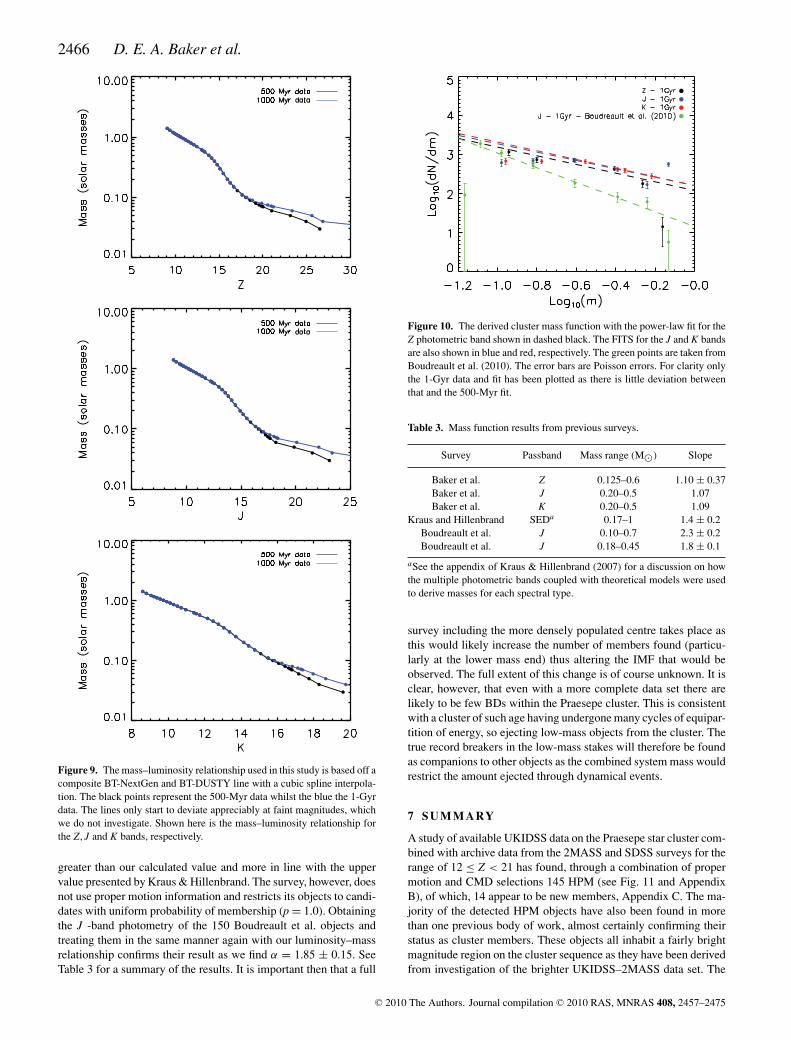
To convert the cluster luminosity function into a mass function amass–luminosity relationship is required (see Fig. 9). Again a com-bined relationship formed from the BT-NextGen and BT-DUSTYmodels was constructed. Cubic spline interpolation was used to in-terpolate between the points. As the age of the Praesepe cluster isnot well confined, this mass–luminosity relationship has again beenconstructed based of both the 500 Myr and 1 Gyr model data.
If one considers a magnitude interval of width dM the total num-ber of stars (dN) will be given by
dN = �(M) dM, (21)
where �(M) is the luminosity function. In the corresponding massinterval the same dN is now given by ξ (m) d m, where dm is theinterval in the mass range and ξ (m) is the mass function.
Hence to calculate the mass function the previous equations canbe easily rearranged to the form of
ξ (m) = �(M) dM
dm. (22)
In Fig. 10, Praesepe’s cluster mass function is plotted with a singlepower-law fit for the points between 0.6 and 0.125 M� for the Zphotometric band. The J and K bands have been treated similarlybut due to the corrections applied for the incompleteness affecting awider range of magnitudes a narrower mass range was considered.The form of the power law is shown below:
ξ (m) ∝ m−α. (23)
The results of this fitting are that α500 Myr = 1.11 ± 0.37 andα1 Gyr = 1.10 ± 0.37. For the J and K bands the results wereα500 Myr = 1.07, α1 Gyr = 1.07 and α500 Myr = 1.09, α1 Gyr = 1.09,respectively. These values are much lower than the Salpeter IMF(2.35) but the upper limits agree roughly with the values calculatedand cited by Kraus & Hillenbrand (2007) of α = 1.4 ± 0.2. TheKraus & Hillenbrand result was derived using a mass–spectral typerelationship; however, after retrieving 2MASS J-band photometryfor their objects and constructing the J -band luminosity function as
Table 2. Probability of membership, magnitude range for our methods of calculating proba-bilities of membership using the annulus as well as the two control areas.
Magnitude range Probability annulus Probability Probabilityμα = 0 mas yr−1 μα = +35.66 mas yr−1
μδ = +37.85 mas yr−1 μδ = −12.70 mas yr−1
15 < Z < 16 0.000 0.000 0.00016 < Z < 17 0.000 0.000 0.00017 < Z < 18 0.000 0.000 0.00018 < Z < 19 0.000 1.000 0.00019 < Z < 20 0.581 0.500 1.00020 < Z < 21 0.000 0.000 0.000
C© 2010 The Authors. Journal compilation C© 2010 RAS, MNRAS 408, 2457–2475
Low-mass stars and brown dwarfs in Praesepe 2465
Figure 7. An estimate of the incompleteness in the 2MASS selected Prae-sepe data set for the UKIDSS Z, J and K bands, respectively. The blackdotted line is a least squares fit to the associated black points in figure. Thereis clearly a drop off at the end of the functions whilst the deficit for thebrightest magnitude bins is caused by saturation effects.
we have done for our UKIDSS–2MASS sample we find α to differby only 0.1.
A more recent survey of the cluster centre has also just beencarried out by Boudreault et al. (2010). The authors identify some150 candidate members with six expected to be BDs. Of these sixonly three are currently within our survey region, objects 55, 909and 910. Objects 55 and 909 are precluded from our search due to
Figure 8. The luminosity functions derived for the Praesepe star clusterin the Z, J and K bands. The distribution rises to a peak before starting todecay due to the change in the slope of the mass–luminosity relationship.The error bars are Poisson errors.
their morphological classification in the UKIDSS data. Object 910is present and photometrically appears to agree with Boudreaultet al. (J = 17.66, K = 16.8). The presence of other photometricbands has, however, shown this object to be far too blue in the Z −J, J diagram (Z = 18.33) for it to be considered as a cluster memberby our current analysis. The value presented by Boudreault et al.of α = 1.8 ± 0.1 for ξ (m) (the mass function) appears to be much
C© 2010 The Authors. Journal compilation C© 2010 RAS, MNRAS 408, 2457–2475
2466 D. E. A. Baker et al.
Figure 9. The mass–luminosity relationship used in this study is based off acomposite BT-NextGen and BT-DUSTY line with a cubic spline interpola-tion. The black points represent the 500-Myr data whilst the blue the 1-Gyrdata. The lines only start to deviate appreciably at faint magnitudes, whichwe do not investigate. Shown here is the mass–luminosity relationship forthe Z, J and K bands, respectively.
greater than our calculated value and more in line with the uppervalue presented by Kraus & Hillenbrand. The survey, however, doesnot use proper motion information and restricts its objects to candi-dates with uniform probability of membership (p = 1.0). Obtainingthe J -band photometry of the 150 Boudreault et al. objects andtreating them in the same manner again with our luminosity–massrelationship confirms their result as we find α = 1.85 ± 0.15. SeeTable 3 for a summary of the results. It is important then that a full
Figure 10. The derived cluster mass function with the power-law fit for theZ photometric band shown in dashed black. The FITS for the J and K bandsare also shown in blue and red, respectively. The green points are taken fromBoudreault et al. (2010). The error bars are Poisson errors. For clarity onlythe 1-Gyr data and fit has been plotted as there is little deviation betweenthat and the 500-Myr fit.
Table 3. Mass function results from previous surveys.
Survey Passband Mass range (M�) Slope
Baker et al. Z 0.125–0.6 1.10 ± 0.37Baker et al. J 0.20–0.5 1.07Baker et al. K 0.20–0.5 1.09
Kraus and Hillenbrand SEDa 0.17–1 1.4 ± 0.2Boudreault et al. J 0.10–0.7 2.3 ± 0.2Boudreault et al. J 0.18–0.45 1.8 ± 0.1
aSee the appendix of Kraus & Hillenbrand (2007) for a discussion on howthe multiple photometric bands coupled with theoretical models were usedto derive masses for each spectral type.
survey including the more densely populated centre takes place asthis would likely increase the number of members found (particu-larly at the lower mass end) thus altering the IMF that would beobserved. The full extent of this change is of course unknown. It isclear, however, that even with a more complete data set there arelikely to be few BDs within the Praesepe cluster. This is consistentwith a cluster of such age having undergone many cycles of equipar-tition of energy, so ejecting low-mass objects from the cluster. Thetrue record breakers in the low-mass stakes will therefore be foundas companions to other objects as the combined system mass wouldrestrict the amount ejected through dynamical events.
7 SU M M A RY
A study of available UKIDSS data on the Praesepe star cluster com-bined with archive data from the 2MASS and SDSS surveys for therange of 12 ≤ Z < 21 has found, through a combination of propermotion and CMD selections 145 HPM (see Fig. 11 and AppendixB), of which, 14 appear to be new members, Appendix C. The ma-jority of the detected HPM objects have also been found in morethan one previous body of work, almost certainly confirming theirstatus as cluster members. These objects all inhabit a fairly brightmagnitude region on the cluster sequence as they have been derivedfrom investigation of the brighter UKIDSS–2MASS data set. The
C© 2010 The Authors. Journal compilation C© 2010 RAS, MNRAS 408, 2457–2475

Low-mass stars and brown dwarfs in Praesepe 2467
Figure 11. A Z − J, Z CMD showing the cluster members given by Hamblyet al. and Kraus & Hillenbrand alongside the 145 HPM derived from thiswork. The BT–NextGen, BT–DUSTY and composite selection lines are alsoshown as are the masses (in units of solar mass) given by those models forthe 500 Myr case. The candidate UKIDSS–SDSS members are also shownto show the limits of the survey. Most of the UKIDSS–SDSS objects werefound in this analysis to be non-members.
UKIDSS–SDSS data set, whilst allowing fainter objects to be ex-amined, suffers from a short time base between observations andsmall number statistics making membership assignments difficultto quantify (see Appendix D for a list of the candidate objects). Aninvestigation into the cluster luminosity and hence mass functionwas also carried out. The upper limits of the latter agree with aprevious result given by Kraus & Hillenbrand (2007), confirmingthat although a low-mass population of objects may have existedthe dynamical evolution of the cluster over its lifetime has led toa significant population depletion. Only when a full survey of thecluster with UKIDSS is complete and second epoch K data availablecan one hope to truly evaluate this cluster.
AC K N OW L E D G M E N T S
DEAB acknowledges the support of an STFC Postgraduate stu-dentship. NL was supported by the Ramon y Cajal fellowship num-ber 08-303-01-02. This publication makes use of data productsfrom the United Kingdom Infrared Deep Sky Survey, the SloanDigital Sky Survey, the 2MASS, the SIMBAD data base, operatedat CDS, Strasbourg, France and NASA’s Astrophyics Data Sys-tem Bibliographic Services. The SDSS is managed by the Astro-physical Research Consortium (ARC) for the Participating Institu-tions. The Participating Institutions are The University of Chicago,Fermilab, the Institute for Advanced Study, the Japan ParticipationGroup, The Johns Hopkins University, Los Alamos National Labo-ratory, the Max-Planck-Institute for Astronomy (MPIA), the Max-Planck-Institute for Astrophysics (MPA), New Mexico State Uni-versity, University of Pittsburgh, Princeton University, the UnitedStates Naval Observatory and the University of Washington. Fund-
ing for the Sloan Digital Sky Survey (SDSS) has been providedby the Alfred P. Sloan Foundation, the Participating Institutions,the National Aeronautics and Space Administration, the NationalScience Foundation, the US Department of Energy, the JapaneseMonbukagakusho and the Max Planck Society. The SDSS Website is http://www.sdss.org/. The Two Micron All Sky Survey is ajoint project of the University of Massachusetts and the InfraredProcessing and Analysis Center/California Institute of Technol-ogy, funded by the National Aeronautics and Space Administra-tion and the National Science Foundation. The authors would liketo thank France Allard for the use of the Phoenix web simulatorat http://phoenix.ens-lyon.fr/simulator/index.faces which has beenused in this research.
REFERENCES
Adams J. D., Stauffer J. R., Skrutskie M. F., Monet D. G., Portegies ZwartS. F., Janes K. A., Beichman C. A., 2002, AJ, 124, 1570
Allen C. W., 1973, Astrophysical Quantities. Athlone Press, LondonBaraffe I., Chabrier G., Allard F., Hauschildt P. H., 1998, A&A, 337, 403Boudreault S., Bailer-Jones C. A. L., Goldman B., Henning T., Caballero J.
A., 2010, A&A, 510, A27Burrows A., Hubbard W. B., Lunine J. I., Liebert J., 2001, Rev. Modern
Phys., 73, 719Casali M. et al., 2007, A&A, 467, 777Casewell S. L., Dobbie P. D., Hodgkin S. T., Moraux E., Jameson R. F.,
Hambly N. C., Irwin J., Lodieu N., 2007, MNRAS, 378, 1131Chabrier G., Baraffe I., Allard F., Hauschildt P., 2000, ApJ, 542, 464Chappelle R. J., Pinfield D. J., Steele I. A., Dobbie P. D., Magazzu A., 2005,
MNRAS, 361, 1323Deacon N. R., Hambly N. C., 2004, A&A, 416, 125de La Fuente Marcos R., de La Fuente Marcos C., 2000, Ap&SS, 271, 127Eggen O. J., 1960, MNRAS, 120, 540Francic S. P., 1989, AJ, 98, 888Girardi L., Bertelli G., Bressan A., Chiosi C., Groenewegen M. A. T., Marigo
P., Salasnich B., Weiss A., 2002, A&A, 391, 195Gonzalez-Garcıa B. M., Zapatero Osorio M. R., Bejar V. J. S., Bihain G.,
Barrado Y Navascues D., Caballero J. A., Morales-Calderon M., 2006,A&A, 460, 799
Greisen E. W., Calabretta M. R., 2002, A&A, 395, 1061Hambly N. C., Steele I. A., Hawkins M. R. S., Jameson R. F., 1995a,
MNRAS, 273, 505Hambly N. C., Steele I. A., Hawkins M. R. S., Jameson R. F., 1995b, A&AS,
109, 29Hambly N. C. et al., 2008, MNRAS, 384, 637Hawley S. L. et al., 2002, AJ, 123, 3409Henry R. C., Anderson R., Hesser J. E., 1977, ApJ, 214, 742Hewett P. C., Warren S. J., Leggett S. K., Hodgkin S. T., 2006, MNRAS,
367, 454Hodgkin S. T., Irwin M. J., Hewett P. C., Warren S. J., 2009, MNRAS, 394,
675Hogan E., Jameson R. F., Casewell S. L., Osbourne S. L., Hambly N. C.,
2008, MNRAS, 388, 495Jameson R. F., Casewell S. L., Bannister N. P., Lodieu N., Keresztes K.,
Dobbie P. D., Hodgkin S. T., 2008, MNRAS, 384, 1399Jones B. F., Cudworth K., 1983, AJ, 88, 215Kharchenko N. V., Piskunov A. E., Roser S., Schilbach E., Scholz R., 2005,
A&A, 438, 1163Klein-Wassink W. J., 1927, Groningen Publ. No. 41Kraus A. L., Hillenbrand L. A., 2007, AJ, 134, 2340Lawrence A. et al., 2007, MNRAS, 379, 1599Lodieu N., Hambly N. C., Jameson R. F., Hodgkin S. T., Carraro G., Kendall
T. R., 2007a, MNRAS, 374, 372Lodieu N., Dobbie P. D., Deacon N. R., Hodgkin S. T., Hambly N. C.,
Jameson R. F., 2007b, MNRAS, 380, 712Monet D. G. et al., 2003, AJ, 125, 984
C© 2010 The Authors. Journal compilation C© 2010 RAS, MNRAS 408, 2457–2475
2468 D. E. A. Baker et al.
Pinfield D. J., Hodgkin S. T., Jameson R. F., Cossburn M. R., von Hippel T.,1997, MNRAS, 287, 180
Pinfield D. J., Dobbie P. D., Jameson R. F., Steele I. A., Jones H. R. A.,Katsiyannis A. C., 2003, MNRAS, 342, 1241
Sanders W. L., 1971, A&A, 14, 226Skrutskie M. F. et al., 2006, AJ, 131, 1163
Tsvetkov T. G., 1993, Ap&SS, 203, 247Vandenberg D. A., Bridges T. J., 1984, ApJ, 278, 679van Leeuwen F., 2009, A&A, 497, 209York D. G. et al., 2000, AJ, 120, 1579Zacharias N., Urban S. E., Zacharias M. I., Wycoff G. L., Hall D. M., Monet
D. G., Rafferty T. J., 2004, AJ, 127, 3043
APPEN D IX A : S Q L QU ERIES
A1 UKIDSS–SDSS
SELECTg.sourceID as u id,T2.slaveObjID as s id,g.ra as u ra,g.dec as u dec,T2.ra as s ra,T2.dec as s dec,m.mjdObs as u mjd,T2. mjd z as s mjd,g.mergedClass as u class,g.zaperMag3 as u z,g.zaperMag3Err as u zerr,g.yaperMag3 as u y ,g.yaperMag3Err as u yerr,g.japerMag3 as u j,g.japerMag3Err as u jerr,g.haperMag3 as u h,g.haperMag3Err as u herr,g.k 1aperMag3 as u k,g.k 1aperMag3Err as u kerr,T2.psfMag u as s u,T2.psfMagErr u as s uerr,T2.psfMag g as s g,T2.psfMagErr g as s gerr,T2.psfMag r as s r,T2.psfMagErr r as s rerr,T2.psfMag i as s i,T2.psfMagErr i as s ierr,T2.psfMag z as s z,T2.psfMagErr z as s zerr,
(T2.distanceMins * 60) as us separation,
3.6e6*COS(RADIANS(g.dec))*(g.ra-T2.ra)/((m.mjdObs-T2.mjd z)/365.25) AS us pmra,3.6e6*(g.dec-T2.dec)/((m.mjdObs-T2.mjd z)/365.25) AS us pmdec,
g.framesetid as framesetid,f.multiframeid as multiframeid,m.filename as filename,m.catname as catname,f.extNum as extnum,T2.run as run,T2.rerun as rerun,T2.camcol as camcol,T2.field as field,T2.rowc z as xpix,T2.colc z as ypix,T2.segmentID as segmentID,
C© 2010 The Authors. Journal compilation C© 2010 RAS, MNRAS 408, 2457–2475
Low-mass stars and brown dwarfs in Praesepe 2469
T2.stripe as stripe,T2.chunkID as chunkID,T2.startmu as startmu
FROMgcsMergeLog as ml,Multiframe as m,gcsFrameSets as f,
(SELECT sdss.ra, sdss.dec, x.slaveObjID, x.masterObjID, x.distanceMins,sdss.psfMag u, sdss.psfMagErr u, sdss.psfMag g, sdss.psfMagErr g, sdss.psfMag r, sdss.psfMagErr r,sdss.psfMag i, sdss.psfMagErr i, sdss.psfMag z, sdss.psfMagErr z, f.mjd z, sdss.run, sdss.rerun,sdss.camcol, sdss.field, sdss.rowc, sdss.colc,sg.segmentID, sg.stripe, c.chunkID, c.startmu
FROM gcsSourceXDR7PhotoObj as x, BestDR7..PhotoObj as sdss,BestDR7..Field as f, BestDR7..Segment as sg, BestDR7..Chunk as c
WHERE sdss.type = 6 AND x.slaveObjID = sdss.objID AND f.fieldID = sdss.fieldIDAND f.segmentID = sg.segmentID AND sg.chunkID = c.chunkID
/* Detected in BINNED 1 */AND ((flags i & 0x10000000) != 0)AND ((flags z & 0x10000000) != 0)/* Not EDGE, NOPROFILE, PEAKCENTER, NOTCHECKEDPSF FLUX INTERP, SATURATED, or BAD COUNTS ERROR */AND ((flags i & 0x8100000c00a4) = 0)AND ((flags z & 0x8100000c00a4) = 0)/* Not DEBLEND NOPEAK or small PSF error */AND (((flags i & 0x400000000000) = 0) or (psfmagerr i <= 0.2))AND (((flags z & 0x400000000000) = 0) or (psfmagerr z <= 0.2))/* Not INTERP CENTER or not COSMIC RAY */AND (((flags i & 0x100000000000) = 0) or (flags i & 0x1000) = 0)AND (((flags z & 0x100000000000) = 0) or (flags z & 0x1000) = 0)
AND distanceMins IN (SELECT MIN(distanceMins) FROM gcsSourceXDR7PhotoObj WHEREmasterObjID = x.masterObjID AND distanceMins < 1.0 / 60
))
AS T2 RIGHT OUTER JOIN gcsSource AS g on g.sourceID=T2.masterObjIDWHERE/* Sample selection predicates: Praesepe RA=120-150 deg && dec=15-25 deg */g.ra BETWEEN 120.0 AND 135.0AND g.dec BETWEEN 15.0 AND 25.0 and(zXi BETWEEN −1.0 AND +1.0 OR zXi < −0.9e9)AND yXi BETWEEN −1.0 AND +1.0AND jXi BETWEEN −1.0 AND +1.0AND hXi BETWEEN −1.0 AND +1.0AND k 1Xi BETWEEN −1.0 AND +1.0AND (zEta BETWEEN −1.0 AND +1.0 OR zEta < −0.9e9)AND yEta BETWEEN −1.0 AND +1.0AND jEta BETWEEN −1.0 AND +1.0AND hEta BETWEEN −1.0 AND +1.0AND k 1Eta BETWEEN −1.0 AND +1.0AND (zClass BETWEEN −2 AND −1 OR zClass < −9999)AND yClass BETWEEN −2 AND −1AND jClass BETWEEN −2 AND −1AND hClass BETWEEN −2 AND −1AND k 1Class BETWEEN −2 AND −1AND (priOrSec = 0 OR priOrSec = g.frameSetID)AND g.frameSetID = ml.frameSetID
C© 2010 The Authors. Journal compilation C© 2010 RAS, MNRAS 408, 2457–2475
2470 D. E. A. Baker et al.
AND ml.zmfID = m.multiframeIDAND g.zppErrBits < 16AND g.yppErrBits < 16AND g.jppErrBits < 16AND g.hppErrBits < 16AND g.k 1ppErrBits < 16AND g.framesetID=f.framesetIDAND f.multiframeID=m.multiframeID
A2 UKIDSS–2MASS
SELECTg.sourceID as u id,T2.pts key as t id,T2.designation t designation,g.ra as u ra,g.dec as u dec,T2.ra as t ra,T2.dec as t dec,m.mjdObs as u mjd,(T2.jdate-2400000.5) as t mjd,g.mergedClass as u class,g.zaperMag3 as u z,g.zaperMag3Err as u zerr,g.yaperMag3 as u y,g.yaperMag3Err as u yerr,g.japerMag3 as u j,g.japerMag3Err as u jerr,g.haperMag3 as u h,g.haperMag3Err as u herr,g.k 1aperMag3 as u k,g.k 1aperMag3Err as u kerr,T2.j m as t j,T2.h m as t h,T2.k m as t k,T2.ph qual as t phqual,T2.nopt mchs as nopt mchs,
(T2.distanceMins * 60) as ut separation,
3.6e6*COS(RADIANS(g.dec))*(g.ra-T2.ra)/((m.mjdObs-(T2.jdate-2400000.5))/365.25) AS ut pmra,3.6e6*(g.dec-T2.dec)/((m.mjdObs-(T2.jdate-2400000.5))/365.25) AS ut pmdec,
g.framesetid as framesetid,f.multiframeid as multiframeid,m.filename as filename,m.catname as catname,f.extNum as extnum
FROMgcsMergeLog AS ml,Multiframe AS m,gcsFrameSets as f,
(SELECT mass.designation, mass.pts key, mass.ra, mass.dec, x.slaveObjID, x.masterObjID,x.distanceMins, mass.jdate, mass.j m, mass.h m, mass.k m,mass.ph qual,mass.nopt mchs
FROM gcsSourceXtwomass psc AS x, TWOMASS..twomass psc as mass
C© 2010 The Authors. Journal compilation C© 2010 RAS, MNRAS 408, 2457–2475
Low-mass stars and brown dwarfs in Praesepe 2471
WHERE x.slaveObjID = mass.pts key AND mass.j m > 9 AND mass.h m > 8.5 AND mass.k m > 8 ANDdistanceMins IN(SELECT MIN(distanceMins) FROM gcsSourceXtwomass psc WHEREmasterObjID = x.masterObjID AND distanceMins < 1.0 / 60
))
AS T2 RIGHT OUTER JOIN gcsSource AS g on g.sourceID=T2.masterObjIDWHERE/* Sample selection predicates:Praesepe RA=120-135 deg && dec=15-25 deg */g.ra BETWEEN 120.0 AND 135.0AND g.dec BETWEEN 15.0 AND 25.0 and(zXi BETWEEN −1.0 AND +1.0 OR zXi < −0.9e9)AND yXi BETWEEN −1.0 AND +1.0AND jXi BETWEEN −1.0 AND +1.0AND hXi BETWEEN −1.0 AND +1.0AND k 1Xi BETWEEN −1.0 AND +1.0AND (zEta BETWEEN −1.0 AND +1.0 OR zEta < −0.9e9)AND yEta BETWEEN −1.0 AND +1.0AND jEta BETWEEN −1.0 AND +1.0AND hEta BETWEEN −1.0 AND +1.0AND k 1Eta BETWEEN −1.0 AND +1.0AND (zClass BETWEEN −2 AND −1 OR zClass < −9999)AND yClass BETWEEN −2 AND −1AND jClass BETWEEN −2 AND −1AND hClass BETWEEN −2 AND −1AND k 1Class BETWEEN −2 AND −1AND (priOrSec = 0 OR priOrSec = g.frameSetID)AND g.frameSetID = ml.frameSetIDAND ml.zmfID = m.multiframeIDAND g.zppErrBits < 16AND g.yppErrBits < 16AND g.jppErrBits < 16AND g.hppErrBits < 16AND g.k 1ppErrBits < 16AND g.framesetID=f.framesetIDAND f.multiframeID=m.multiframeID
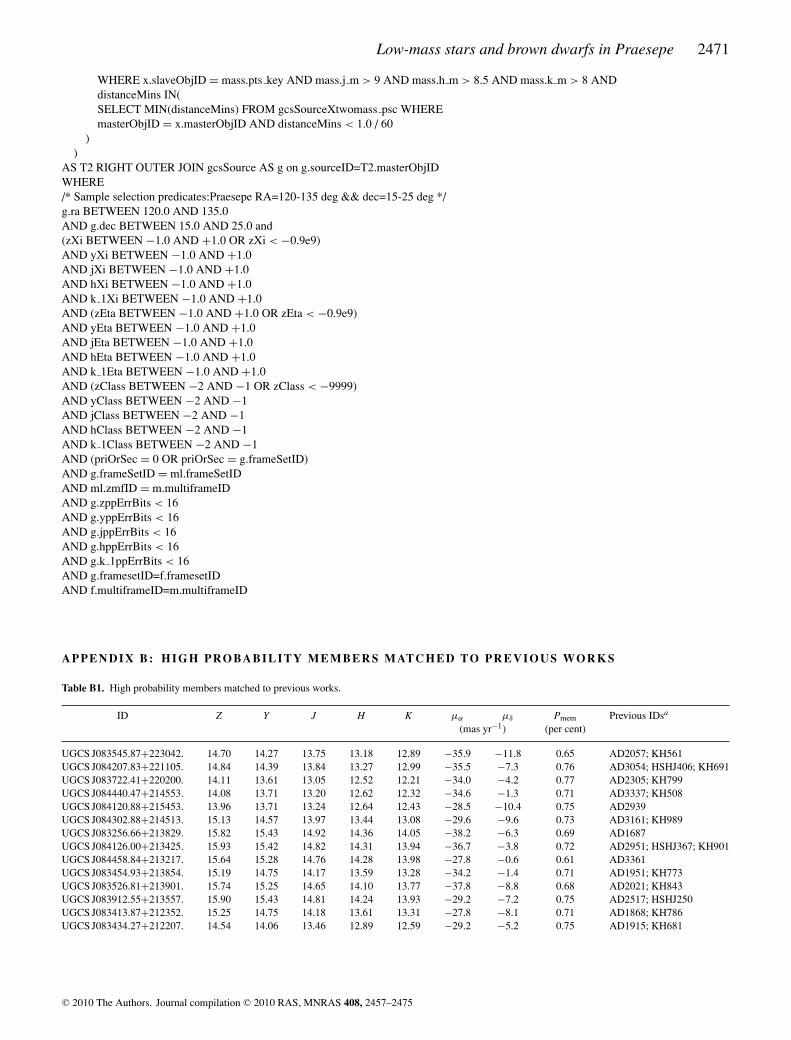
A P P E N D I X B: H I G H PRO BA B I L I T Y M E M B E R S M AT C H E D TO PR E V I O U S WO R K S
Table B1. High probability members matched to previous works.
ID Z Y J H K μα μδ Pmem Previous IDsa
(mas yr−1) (per cent)
UGCS J083545.87+223042. 14.70 14.27 13.75 13.18 12.89 −35.9 −11.8 0.65 AD2057; KH561UGCS J084207.83+221105. 14.84 14.39 13.84 13.27 12.99 −35.5 −7.3 0.76 AD3054; HSHJ406; KH691UGCS J083722.41+220200. 14.11 13.61 13.05 12.52 12.21 −34.0 −4.2 0.77 AD2305; KH799UGCS J084440.47+214553. 14.08 13.71 13.20 12.62 12.32 −34.6 −1.3 0.71 AD3337; KH508UGCS J084120.88+215453. 13.96 13.71 13.24 12.64 12.43 −28.5 −10.4 0.75 AD2939UGCS J084302.88+214513. 15.13 14.57 13.97 13.44 13.08 −29.6 −9.6 0.73 AD3161; KH989UGCS J083256.66+213829. 15.82 15.43 14.92 14.36 14.05 −38.2 −6.3 0.69 AD1687UGCS J084126.00+213425. 15.93 15.42 14.82 14.31 13.94 −36.7 −3.8 0.72 AD2951; HSHJ367; KH901UGCS J084458.84+213217. 15.64 15.28 14.76 14.28 13.98 −27.8 −0.6 0.61 AD3361UGCS J083454.93+213854. 15.19 14.75 14.17 13.59 13.28 −34.2 −1.4 0.71 AD1951; KH773UGCS J083526.81+213901. 15.74 15.25 14.65 14.10 13.77 −37.8 −8.8 0.68 AD2021; KH843UGCS J083912.55+213557. 15.90 15.43 14.81 14.24 13.93 −29.2 −7.2 0.75 AD2517; HSHJ250UGCS J083413.87+212352. 15.25 14.75 14.18 13.61 13.31 −27.8 −8.1 0.71 AD1868; KH786UGCS J083434.27+212207. 14.54 14.06 13.46 12.89 12.59 −29.2 −5.2 0.75 AD1915; KH681
C© 2010 The Authors. Journal compilation C© 2010 RAS, MNRAS 408, 2457–2475
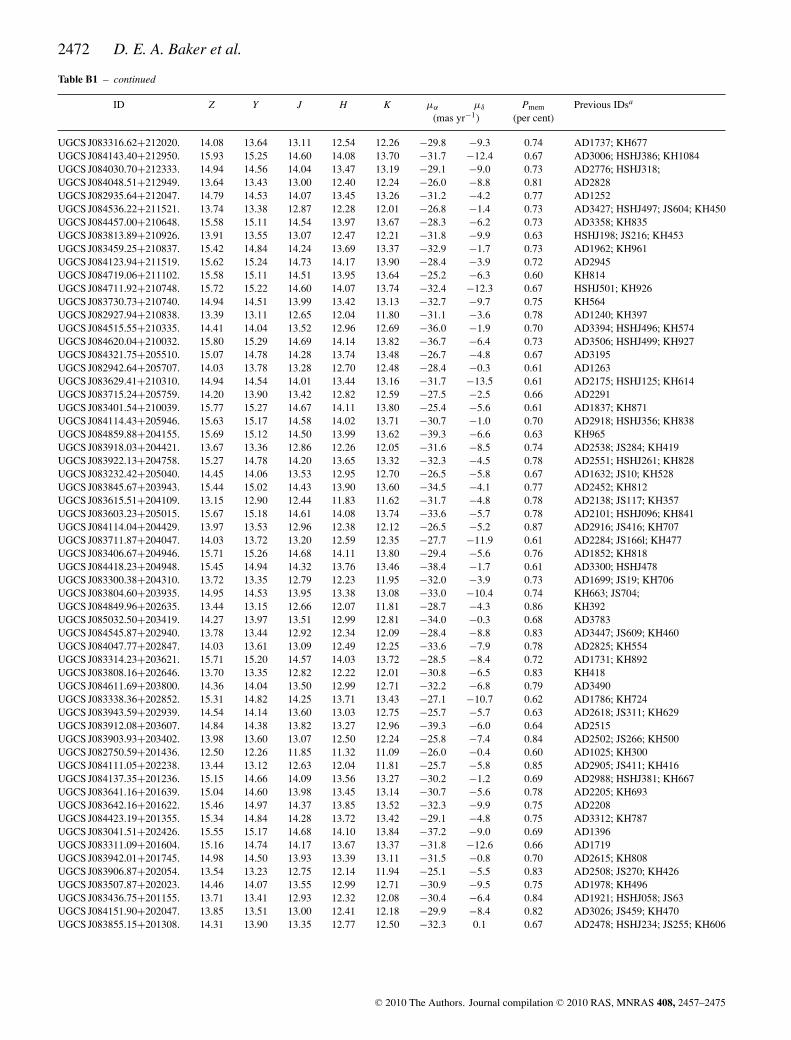
2472 D. E. A. Baker et al.
Table B1 – continued
ID Z Y J H K μα μδ Pmem Previous IDsa
(mas yr−1) (per cent)
UGCS J083316.62+212020. 14.08 13.64 13.11 12.54 12.26 −29.8 −9.3 0.74 AD1737; KH677UGCS J084143.40+212950. 15.93 15.25 14.60 14.08 13.70 −31.7 −12.4 0.67 AD3006; HSHJ386; KH1084UGCS J084030.70+212333. 14.94 14.56 14.04 13.47 13.19 −29.1 −9.0 0.73 AD2776; HSHJ318;UGCS J084048.51+212949. 13.64 13.43 13.00 12.40 12.24 −26.0 −8.8 0.81 AD2828UGCS J082935.64+212047. 14.79 14.53 14.07 13.45 13.26 −31.2 −4.2 0.77 AD1252UGCS J084536.22+211521. 13.74 13.38 12.87 12.28 12.01 −26.8 −1.4 0.73 AD3427; HSHJ497; JS604; KH450UGCS J084457.00+210648. 15.58 15.11 14.54 13.97 13.67 −28.3 −6.2 0.73 AD3358; KH835UGCS J083813.89+210926. 13.91 13.55 13.07 12.47 12.21 −31.8 −9.9 0.63 HSHJ198; JS216; KH453UGCS J083459.25+210837. 15.42 14.84 14.24 13.69 13.37 −32.9 −1.7 0.73 AD1962; KH961UGCS J084123.94+211519. 15.62 15.24 14.73 14.17 13.90 −28.4 −3.9 0.72 AD2945UGCS J084719.06+211102. 15.58 15.11 14.51 13.95 13.64 −25.2 −6.3 0.60 KH814UGCS J084711.92+210748. 15.72 15.22 14.60 14.07 13.74 −32.4 −12.3 0.67 HSHJ501; KH926UGCS J083730.73+210740. 14.94 14.51 13.99 13.42 13.13 −32.7 −9.7 0.75 KH564UGCS J082927.94+210838. 13.39 13.11 12.65 12.04 11.80 −31.1 −3.6 0.78 AD1240; KH397UGCS J084515.55+210335. 14.41 14.04 13.52 12.96 12.69 −36.0 −1.9 0.70 AD3394; HSHJ496; KH574UGCS J084620.04+210032. 15.80 15.29 14.69 14.14 13.82 −36.7 −6.4 0.73 AD3506; HSHJ499; KH927UGCS J084321.75+205510. 15.07 14.78 14.28 13.74 13.48 −26.7 −4.8 0.67 AD3195UGCS J082942.64+205707. 14.03 13.78 13.28 12.70 12.48 −28.4 −0.3 0.61 AD1263UGCS J083629.41+210310. 14.94 14.54 14.01 13.44 13.16 −31.7 −13.5 0.61 AD2175; HSHJ125; KH614UGCS J083715.24+205759. 14.20 13.90 13.42 12.82 12.59 −27.5 −2.5 0.66 AD2291UGCS J083401.54+210039. 15.77 15.27 14.67 14.11 13.80 −25.4 −5.6 0.61 AD1837; KH871UGCS J084114.43+205946. 15.63 15.17 14.58 14.02 13.71 −30.7 −1.0 0.70 AD2918; HSHJ356; KH838UGCS J084859.88+204155. 15.69 15.12 14.50 13.99 13.62 −39.3 −6.6 0.63 KH965UGCS J083918.03+204421. 13.67 13.36 12.86 12.26 12.05 −31.6 −8.5 0.74 AD2538; JS284; KH419UGCS J083922.13+204758. 15.27 14.78 14.20 13.65 13.32 −32.3 −4.5 0.78 AD2551; HSHJ261; KH828UGCS J083232.42+205040. 14.45 14.06 13.53 12.95 12.70 −26.5 −5.8 0.67 AD1632; JS10; KH528UGCS J083845.67+203943. 15.44 15.02 14.43 13.90 13.60 −34.5 −4.1 0.77 AD2452; KH812UGCS J083615.51+204109. 13.15 12.90 12.44 11.83 11.62 −31.7 −4.8 0.78 AD2138; JS117; KH357UGCS J083603.23+205015. 15.67 15.18 14.61 14.08 13.74 −33.6 −5.7 0.78 AD2101; HSHJ096; KH841UGCS J084114.04+204429. 13.97 13.53 12.96 12.38 12.12 −26.5 −5.2 0.87 AD2916; JS416; KH707UGCS J083711.87+204047. 14.03 13.72 13.20 12.59 12.35 −27.7 −11.9 0.61 AD2284; JS166l; KH477UGCS J083406.67+204946. 15.71 15.26 14.68 14.11 13.80 −29.4 −5.6 0.76 AD1852; KH818UGCS J084418.23+204948. 15.45 14.94 14.32 13.76 13.46 −38.4 −1.7 0.61 AD3300; HSHJ478UGCS J083300.38+204310. 13.72 13.35 12.79 12.23 11.95 −32.0 −3.9 0.73 AD1699; JS19; KH706UGCS J083804.60+203935. 14.95 14.53 13.95 13.38 13.08 −33.0 −10.4 0.74 KH663; JS704;UGCS J084849.96+202635. 13.44 13.15 12.66 12.07 11.81 −28.7 −4.3 0.86 KH392UGCS J085032.50+203419. 14.27 13.97 13.51 12.99 12.81 −34.0 −0.3 0.68 AD3783UGCS J084545.87+202940. 13.78 13.44 12.92 12.34 12.09 −28.4 −8.8 0.83 AD3447; JS609; KH460UGCS J084047.77+202847. 14.03 13.61 13.09 12.49 12.25 −33.6 −7.9 0.78 AD2825; KH554UGCS J083314.23+203621. 15.71 15.20 14.57 14.03 13.72 −28.5 −8.4 0.72 AD1731; KH892UGCS J083808.16+202646. 13.70 13.35 12.82 12.22 12.01 −30.8 −6.5 0.83 KH418UGCS J084611.69+203800. 14.36 14.04 13.50 12.99 12.71 −32.2 −6.8 0.79 AD3490UGCS J083338.36+202852. 15.31 14.82 14.25 13.71 13.43 −27.1 −10.7 0.62 AD1786; KH724UGCS J083943.59+202939. 14.54 14.14 13.60 13.03 12.75 −25.7 −5.7 0.63 AD2618; JS311; KH629UGCS J083912.08+203607. 14.84 14.38 13.82 13.27 12.96 −39.3 −6.0 0.64 AD2515UGCS J083903.93+203402. 13.98 13.60 13.07 12.50 12.24 −25.8 −7.4 0.84 AD2502; JS266; KH500UGCS J082750.59+201436. 12.50 12.26 11.85 11.32 11.09 −26.0 −0.4 0.60 AD1025; KH300UGCS J084111.05+202238. 13.44 13.12 12.63 12.04 11.81 −25.7 −5.8 0.85 AD2905; JS411; KH416UGCS J084137.35+201236. 15.15 14.66 14.09 13.56 13.27 −30.2 −1.2 0.69 AD2988; HSHJ381; KH667UGCS J083641.16+201639. 15.04 14.60 13.98 13.45 13.14 −30.7 −5.6 0.78 AD2205; KH693UGCS J083642.16+201622. 15.46 14.97 14.37 13.85 13.52 −32.3 −9.9 0.75 AD2208UGCS J084423.19+201355. 15.34 14.84 14.28 13.72 13.42 −29.1 −4.8 0.75 AD3312; KH787UGCS J083041.51+202426. 15.55 15.17 14.68 14.10 13.84 −37.2 −9.0 0.69 AD1396UGCS J083311.09+201604. 15.16 14.74 14.17 13.67 13.37 −31.8 −12.6 0.66 AD1719UGCS J083942.01+201745. 14.98 14.50 13.93 13.39 13.11 −31.5 −0.8 0.70 AD2615; KH808UGCS J083906.87+202054. 13.54 13.23 12.75 12.14 11.94 −25.1 −5.5 0.83 AD2508; JS270; KH426UGCS J083507.87+202023. 14.46 14.07 13.55 12.99 12.71 −30.9 −9.5 0.75 AD1978; KH496UGCS J083436.75+201155. 13.71 13.41 12.93 12.32 12.08 −30.4 −6.4 0.84 AD1921; HSHJ058; JS63UGCS J084151.90+202047. 13.85 13.51 13.00 12.41 12.18 −29.9 −8.4 0.82 AD3026; JS459; KH470UGCS J083855.15+201308. 14.31 13.90 13.35 12.77 12.50 −32.3 0.1 0.67 AD2478; HSHJ234; JS255; KH606
C© 2010 The Authors. Journal compilation C© 2010 RAS, MNRAS 408, 2457–2475
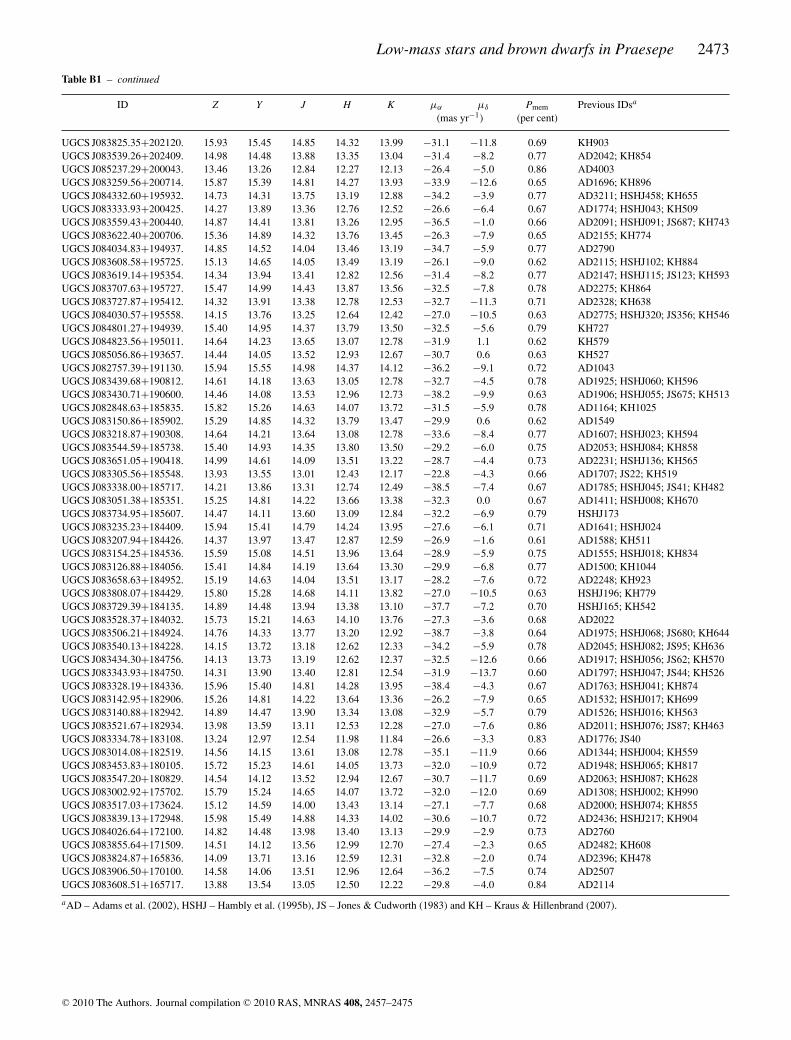
Low-mass stars and brown dwarfs in Praesepe 2473
Table B1 – continued
ID Z Y J H K μα μδ Pmem Previous IDsa
(mas yr−1) (per cent)
UGCS J083825.35+202120. 15.93 15.45 14.85 14.32 13.99 −31.1 −11.8 0.69 KH903UGCS J083539.26+202409. 14.98 14.48 13.88 13.35 13.04 −31.4 −8.2 0.77 AD2042; KH854UGCS J085237.29+200043. 13.46 13.26 12.84 12.27 12.13 −26.4 −5.0 0.86 AD4003UGCS J083259.56+200714. 15.87 15.39 14.81 14.27 13.93 −33.9 −12.6 0.65 AD1696; KH896UGCS J084332.60+195932. 14.73 14.31 13.75 13.19 12.88 −34.2 −3.9 0.77 AD3211; HSHJ458; KH655UGCS J083333.93+200425. 14.27 13.89 13.36 12.76 12.52 −26.6 −6.4 0.67 AD1774; HSHJ043; KH509UGCS J083559.43+200440. 14.87 14.41 13.81 13.26 12.95 −36.5 −1.0 0.66 AD2091; HSHJ091; JS687; KH743UGCS J083622.40+200706. 15.36 14.89 14.32 13.76 13.45 −26.3 −7.9 0.65 AD2155; KH774UGCS J084034.83+194937. 14.85 14.52 14.04 13.46 13.19 −34.7 −5.9 0.77 AD2790UGCS J083608.58+195725. 15.13 14.65 14.05 13.49 13.19 −26.1 −9.0 0.62 AD2115; HSHJ102; KH884UGCS J083619.14+195354. 14.34 13.94 13.41 12.82 12.56 −31.4 −8.2 0.77 AD2147; HSHJ115; JS123; KH593UGCS J083707.63+195727. 15.47 14.99 14.43 13.87 13.56 −32.5 −7.8 0.78 AD2275; KH864UGCS J083727.87+195412. 14.32 13.91 13.38 12.78 12.53 −32.7 −11.3 0.71 AD2328; KH638UGCS J084030.57+195558. 14.15 13.76 13.25 12.64 12.42 −27.0 −10.5 0.63 AD2775; HSHJ320; JS356; KH546UGCS J084801.27+194939. 15.40 14.95 14.37 13.79 13.50 −32.5 −5.6 0.79 KH727UGCS J084823.56+195011. 14.64 14.23 13.65 13.07 12.78 −31.9 1.1 0.62 KH579UGCS J085056.86+193657. 14.44 14.05 13.52 12.93 12.67 −30.7 0.6 0.63 KH527UGCS J082757.39+191130. 15.94 15.55 14.98 14.37 14.12 −36.2 −9.1 0.72 AD1043UGCS J083439.68+190812. 14.61 14.18 13.63 13.05 12.78 −32.7 −4.5 0.78 AD1925; HSHJ060; KH596UGCS J083430.71+190600. 14.46 14.08 13.53 12.96 12.73 −38.2 −9.9 0.63 AD1906; HSHJ055; JS675; KH513UGCS J082848.63+185835. 15.82 15.26 14.63 14.07 13.72 −31.5 −5.9 0.78 AD1164; KH1025UGCS J083150.86+185902. 15.29 14.85 14.32 13.79 13.47 −29.9 0.6 0.62 AD1549UGCS J083218.87+190308. 14.64 14.21 13.64 13.08 12.78 −33.6 −8.4 0.77 AD1607; HSHJ023; KH594UGCS J083544.59+185738. 15.40 14.93 14.35 13.80 13.50 −29.2 −6.0 0.75 AD2053; HSHJ084; KH858UGCS J083651.05+190418. 14.99 14.61 14.09 13.51 13.22 −28.7 −4.4 0.73 AD2231; HSHJ136; KH565UGCS J083305.56+185548. 13.93 13.55 13.01 12.43 12.17 −22.8 −4.3 0.66 AD1707; JS22; KH519UGCS J083338.00+185717. 14.21 13.86 13.31 12.74 12.49 −38.5 −7.4 0.67 AD1785; HSHJ045; JS41; KH482UGCS J083051.38+185351. 15.25 14.81 14.22 13.66 13.38 −32.3 0.0 0.67 AD1411; HSHJ008; KH670UGCS J083734.95+185607. 14.47 14.11 13.60 13.09 12.84 −32.2 −6.9 0.79 HSHJ173UGCS J083235.23+184409. 15.94 15.41 14.79 14.24 13.95 −27.6 −6.1 0.71 AD1641; HSHJ024UGCS J083207.94+184426. 14.37 13.97 13.47 12.87 12.59 −26.9 −1.6 0.61 AD1588; KH511UGCS J083154.25+184536. 15.59 15.08 14.51 13.96 13.64 −28.9 −5.9 0.75 AD1555; HSHJ018; KH834UGCS J083126.88+184056. 15.41 14.84 14.19 13.64 13.30 −29.9 −6.8 0.77 AD1500; KH1044UGCS J083658.63+184952. 15.19 14.63 14.04 13.51 13.17 −28.2 −7.6 0.72 AD2248; KH923UGCS J083808.07+184429. 15.80 15.28 14.68 14.11 13.82 −27.0 −10.5 0.63 HSHJ196; KH779UGCS J083729.39+184135. 14.89 14.48 13.94 13.38 13.10 −37.7 −7.2 0.70 HSHJ165; KH542UGCS J083528.37+184032. 15.73 15.21 14.63 14.10 13.76 −27.3 −3.6 0.68 AD2022UGCS J083506.21+184924. 14.76 14.33 13.77 13.20 12.92 −38.7 −3.8 0.64 AD1975; HSHJ068; JS680; KH644UGCS J083540.13+184228. 14.15 13.72 13.18 12.62 12.33 −34.2 −5.9 0.78 AD2045; HSHJ082; JS95; KH636UGCS J083434.30+184756. 14.13 13.73 13.19 12.62 12.37 −32.5 −12.6 0.66 AD1917; HSHJ056; JS62; KH570UGCS J083343.93+184750. 14.31 13.90 13.40 12.81 12.54 −31.9 −13.7 0.60 AD1797; HSHJ047; JS44; KH526UGCS J083328.19+184336. 15.96 15.40 14.81 14.28 13.95 −38.4 −4.3 0.67 AD1763; HSHJ041; KH874UGCS J083142.95+182906. 15.26 14.81 14.22 13.64 13.36 −26.2 −7.9 0.65 AD1532; HSHJ017; KH699UGCS J083140.88+182942. 14.89 14.47 13.90 13.34 13.08 −32.9 −5.7 0.79 AD1526; HSHJ016; KH563UGCS J083521.67+182934. 13.98 13.59 13.11 12.53 12.28 −27.0 −7.6 0.86 AD2011; HSHJ076; JS87; KH463UGCS J083334.78+183108. 13.24 12.97 12.54 11.98 11.84 −26.6 −3.3 0.83 AD1776; JS40UGCS J083014.08+182519. 14.56 14.15 13.61 13.08 12.78 −35.1 −11.9 0.66 AD1344; HSHJ004; KH559UGCS J083453.83+180105. 15.72 15.23 14.61 14.05 13.73 −32.0 −10.9 0.72 AD1948; HSHJ065; KH817UGCS J083547.20+180829. 14.54 14.12 13.52 12.94 12.67 −30.7 −11.7 0.69 AD2063; HSHJ087; KH628UGCS J083002.92+175702. 15.79 15.24 14.65 14.07 13.72 −32.0 −12.0 0.69 AD1308; HSHJ002; KH990UGCS J083517.03+173624. 15.12 14.59 14.00 13.43 13.14 −27.1 −7.7 0.68 AD2000; HSHJ074; KH855UGCS J083839.13+172948. 15.98 15.49 14.88 14.33 14.02 −30.6 −10.7 0.72 AD2436; HSHJ217; KH904UGCS J084026.64+172100. 14.82 14.48 13.98 13.40 13.13 −29.9 −2.9 0.73 AD2760UGCS J083855.64+171509. 14.51 14.12 13.56 12.99 12.70 −27.4 −2.3 0.65 AD2482; KH608UGCS J083824.87+165836. 14.09 13.71 13.16 12.59 12.31 −32.8 −2.0 0.74 AD2396; KH478UGCS J083906.50+170100. 14.58 14.06 13.51 12.96 12.64 −36.2 −7.5 0.74 AD2507UGCS J083608.51+165717. 13.88 13.54 13.05 12.50 12.22 −29.8 −4.0 0.84 AD2114
aAD – Adams et al. (2002), HSHJ – Hambly et al. (1995b), JS – Jones & Cudworth (1983) and KH – Kraus & Hillenbrand (2007).
C© 2010 The Authors. Journal compilation C© 2010 RAS, MNRAS 408, 2457–2475
2474 D. E. A. Baker et al.
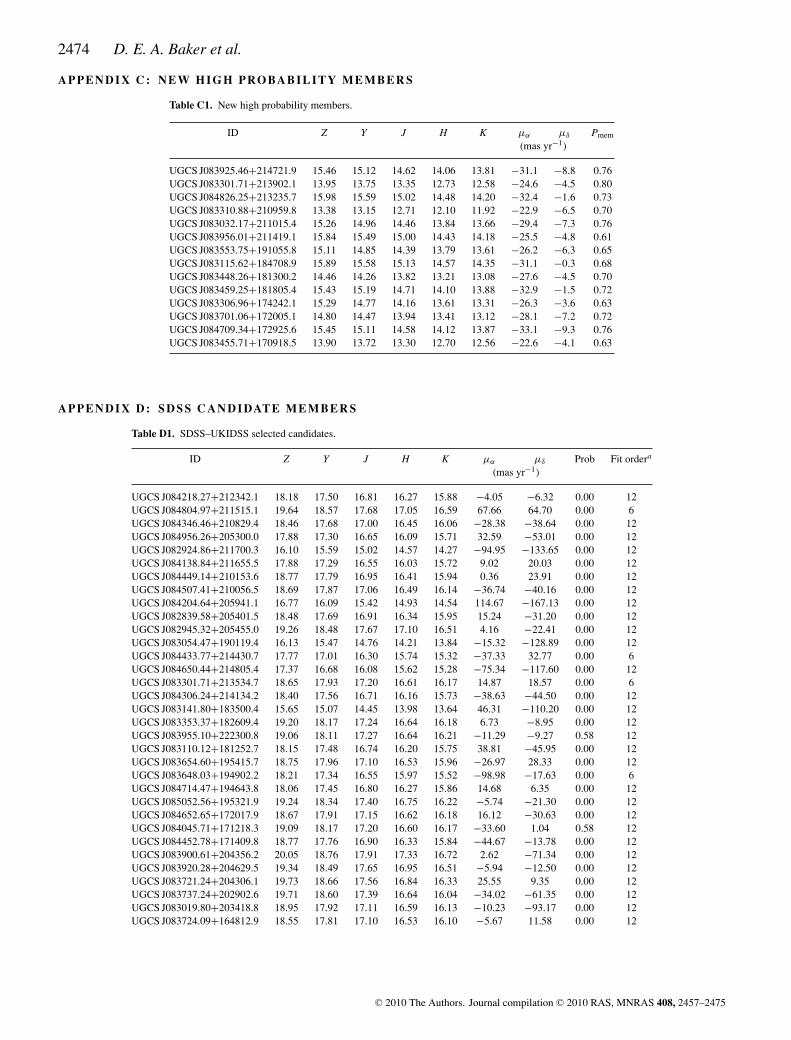
APPEN D IX C : N EW HIGH PROBABILITY MEMBERS
Table C1. New high probability members.
ID Z Y J H K μα μδ Pmem
(mas yr−1)
UGCS J083925.46+214721.9 15.46 15.12 14.62 14.06 13.81 −31.1 −8.8 0.76UGCS J083301.71+213902.1 13.95 13.75 13.35 12.73 12.58 −24.6 −4.5 0.80UGCS J084826.25+213235.7 15.98 15.59 15.02 14.48 14.20 −32.4 −1.6 0.73UGCS J083310.88+210959.8 13.38 13.15 12.71 12.10 11.92 −22.9 −6.5 0.70UGCS J083032.17+211015.4 15.26 14.96 14.46 13.84 13.66 −29.4 −7.3 0.76UGCS J083956.01+211419.1 15.84 15.49 15.00 14.43 14.18 −25.5 −4.8 0.61UGCS J083553.75+191055.8 15.11 14.85 14.39 13.79 13.61 −26.2 −6.3 0.65UGCS J083115.62+184708.9 15.89 15.58 15.13 14.57 14.35 −31.1 −0.3 0.68UGCS J083448.26+181300.2 14.46 14.26 13.82 13.21 13.08 −27.6 −4.5 0.70UGCS J083459.25+181805.4 15.43 15.19 14.71 14.10 13.88 −32.9 −1.5 0.72UGCS J083306.96+174242.1 15.29 14.77 14.16 13.61 13.31 −26.3 −3.6 0.63UGCS J083701.06+172005.1 14.80 14.47 13.94 13.41 13.12 −28.1 −7.2 0.72UGCS J084709.34+172925.6 15.45 15.11 14.58 14.12 13.87 −33.1 −9.3 0.76UGCS J083455.71+170918.5 13.90 13.72 13.30 12.70 12.56 −22.6 −4.1 0.63
APPEN D IX D : SDSS CANDIDATE MEMBERS
Table D1. SDSS–UKIDSS selected candidates.
ID Z Y J H K μα μδ Prob Fit ordera
(mas yr−1)
UGCS J084218.27+212342.1 18.18 17.50 16.81 16.27 15.88 −4.05 −6.32 0.00 12UGCS J084804.97+211515.1 19.64 18.57 17.68 17.05 16.59 67.66 64.70 0.00 6UGCS J084346.46+210829.4 18.46 17.68 17.00 16.45 16.06 −28.38 −38.64 0.00 12UGCS J084956.26+205300.0 17.88 17.30 16.65 16.09 15.71 32.59 −53.01 0.00 12UGCS J082924.86+211700.3 16.10 15.59 15.02 14.57 14.27 −94.95 −133.65 0.00 12UGCS J084138.84+211655.5 17.88 17.29 16.55 16.03 15.72 9.02 20.03 0.00 12UGCS J084449.14+210153.6 18.77 17.79 16.95 16.41 15.94 0.36 23.91 0.00 12UGCS J084507.41+210056.5 18.69 17.87 17.06 16.49 16.14 −36.74 −40.16 0.00 12UGCS J084204.64+205941.1 16.77 16.09 15.42 14.93 14.54 114.67 −167.13 0.00 12UGCS J082839.58+205401.5 18.48 17.69 16.91 16.34 15.95 15.24 −31.20 0.00 12UGCS J082945.32+205455.0 19.26 18.48 17.67 17.10 16.51 4.16 −22.41 0.00 12UGCS J083054.47+190119.4 16.13 15.47 14.76 14.21 13.84 −15.32 −128.89 0.00 12UGCS J084433.77+214430.7 17.77 17.01 16.30 15.74 15.32 −37.33 32.77 0.00 6UGCS J084650.44+214805.4 17.37 16.68 16.08 15.62 15.28 −75.34 −117.60 0.00 12UGCS J083301.71+213534.7 18.65 17.93 17.20 16.61 16.17 14.87 18.57 0.00 6UGCS J084306.24+214134.2 18.40 17.56 16.71 16.16 15.73 −38.63 −44.50 0.00 12UGCS J083141.80+183500.4 15.65 15.07 14.45 13.98 13.64 46.31 −110.20 0.00 12UGCS J083353.37+182609.4 19.20 18.17 17.24 16.64 16.18 6.73 −8.95 0.00 12UGCS J083955.10+222300.8 19.06 18.11 17.27 16.64 16.21 −11.29 −9.27 0.58 12UGCS J083110.12+181252.7 18.15 17.48 16.74 16.20 15.75 38.81 −45.95 0.00 12UGCS J083654.60+195415.7 18.75 17.96 17.10 16.53 15.96 −26.97 28.33 0.00 12UGCS J083648.03+194902.2 18.21 17.34 16.55 15.97 15.52 −98.98 −17.63 0.00 6UGCS J084714.47+194643.8 18.06 17.45 16.80 16.27 15.86 14.68 6.35 0.00 12UGCS J085052.56+195321.9 19.24 18.34 17.40 16.75 16.22 −5.74 −21.30 0.00 12UGCS J084652.65+172017.9 18.67 17.91 17.15 16.62 16.18 16.12 −30.63 0.00 12UGCS J084045.71+171218.3 19.09 18.17 17.20 16.60 16.17 −33.60 1.04 0.58 12UGCS J084452.78+171409.8 18.77 17.76 16.90 16.33 15.84 −44.67 −13.78 0.00 12UGCS J083900.61+204356.2 20.05 18.76 17.91 17.33 16.72 2.62 −71.34 0.00 12UGCS J083920.28+204629.5 19.34 18.49 17.65 16.95 16.51 −5.94 −12.50 0.00 12UGCS J083721.24+204306.1 19.73 18.66 17.56 16.84 16.33 25.55 9.35 0.00 12UGCS J083737.24+202902.6 19.71 18.60 17.39 16.64 16.04 −34.02 −61.35 0.00 12UGCS J083019.80+203418.8 18.95 17.92 17.11 16.59 16.13 −10.23 −93.17 0.00 12UGCS J083724.09+164812.9 18.55 17.81 17.10 16.53 16.10 −5.67 11.58 0.00 12
C© 2010 The Authors. Journal compilation C© 2010 RAS, MNRAS 408, 2457–2475
Low-mass stars and brown dwarfs in Praesepe 2475
Table D1 – continued
ID Z Y J H K μα μδ Prob Fit ordera
(mas yr−1)
UGCS J083954.96+202955.7 18.90 17.91 17.06 16.44 15.98 33.38 −54.56 0.00 12UGCS J084926.31+202127.0 18.64 17.76 17.00 16.54 16.08 −75.67 −30.17 0.00 12UGCS J085002.02+201725.9 19.28 18.56 17.64 17.05 16.53 −44.04 50.96 0.00 12UGCS J083203.66+202035.8 19.90 18.68 17.74 17.04 16.52 −31.90 −59.39 0.00 12UGCS J083531.32+201838.9 18.39 17.62 16.96 16.39 15.99 −17.01 20.43 0.00 12UGCS J083748.01+201448.5 18.09 17.25 16.51 15.94 15.53 −36.17 −44.57 0.00 12
aFor some objects not enough reference stars could be found to perform the quadratic fit. In this case the fit was reducedto a linear one (six free parameters) as indicated in the fit order column.
This paper has been typeset from a TEX/LATEX file prepared by the author.
C© 2010 The Authors. Journal compilation C© 2010 RAS, MNRAS 408, 2457–2475
![Matija Cuk´ 1 2 3 arXiv:1412.1776v1 [astro-ph.EP] 4 Dec 2014member orbital cluster (de la Fuente Marcos and de la Fuente Marcos, 2013, A. Christou, 2014, pers. comm.): Eureka, 2001](https://img.pdfslide.us/doc/110x75/6104d6a4d2c507507f6c4013/matija-cuk-1-2-3-arxiv14121776v1-astro-phep-4-dec-2014-member-orbital-cluster.jpg)