Embed Size (px)
Citation preview
©2010, TestAmerica Analytical Testing Corp. All rights reserv ed.
TestAmerica & DesignTM are trademarks of TestAmerica Analytical Testing Corp.
Mark Bruce
Patrick O’Meara
Low Level Mercury Sample Collection /
Analysis and Low Flow Sampling
Rev 2.2
MWEA 2010
Lab Practices Seminar
June15, 2010
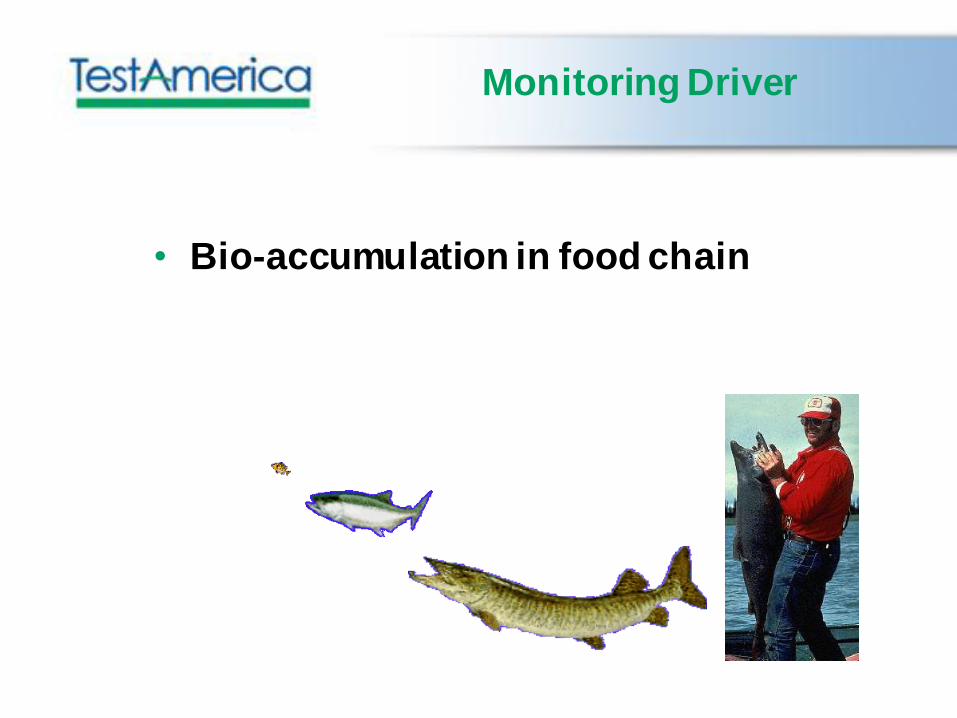
Monitoring Driver
• Bio-accumulation in food chain
Fish Stories
Water Regulations
• Great Lakes Water Quality Agreement 1987
– "Great Lakes Water Quality Initiative Criteria
Documents …” (EPA-820-B-95-008, March 1995).
• National Toxics Rule (40 CFR 131.36)
• Final Water Quality Guidance for
the Great Lakes System (1995)
5
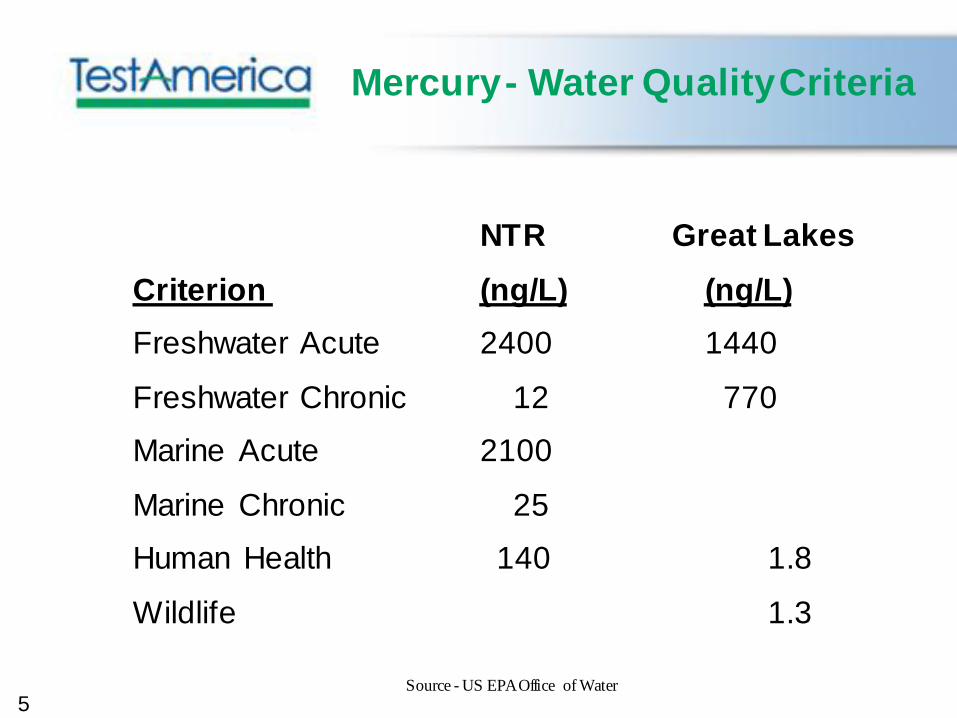
Mercury - Water Quality Criteria
NTR Great Lakes
Criterion (ng/L) (ng/L)
Freshwater Acute 2400 1440
Freshwater Chronic 12 770
Marine Acute 2100
Marine Chronic 25
Human Health 140 1.8
Wildlife 1.3
Source - US EPA Office of Water
6
Why is it hard to collect representative
water samples for mercury?
• Regulatory limits are low
• Ambient water concentrations are low
• Test method is very sensitive to low concentrations
• Mercury is a common contaminant in solids
• Hard to prevent exposure to solid materials
7
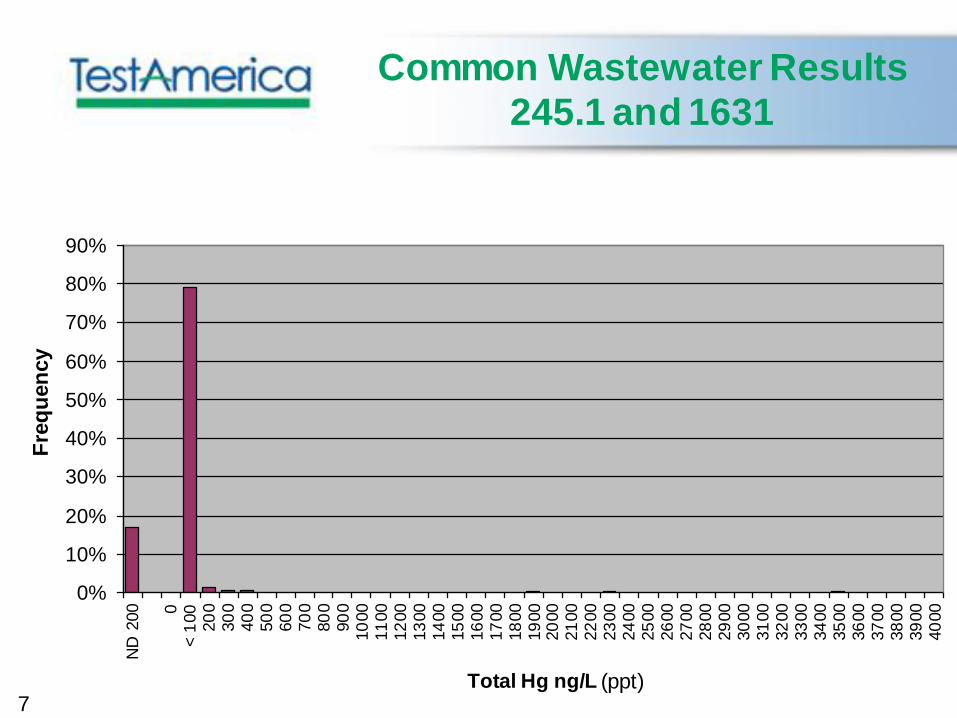
Common Wastewater Results
245.1 and 1631
0%
10%
20%
30%
40%
50%
60%
70%
80%
90%
ND
200 0
< 1
00
20
030
040
050
060
070
080
090
010
00
11
00
12
00
13
00
14
00
15
00
16
00
17
00
18
00
19
00
20
00
21
00
22
00
23
00
24
00
25
00
26
00
27
00
28
00
29
00
30
00
31
00
32
00
33
00
34
00
35
00
36
00
37
00
38
00
39
00
40
00
Total Hg ng/L (ppt)
Fre
qu
en
cy
8
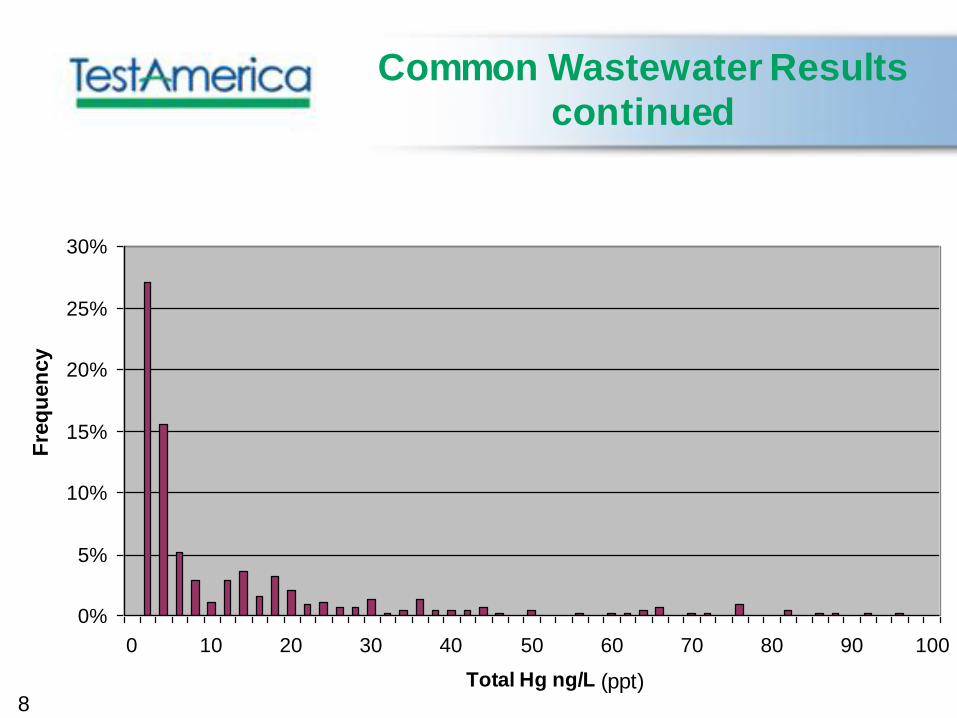
Common Wastewater Results
continued
0%
5%
10%
15%
20%
25%
30%
0 10 20 30 40 50 60 70 80 90 100
Total Hg ng/L (ppt)
Fre
qu
en
cy
9
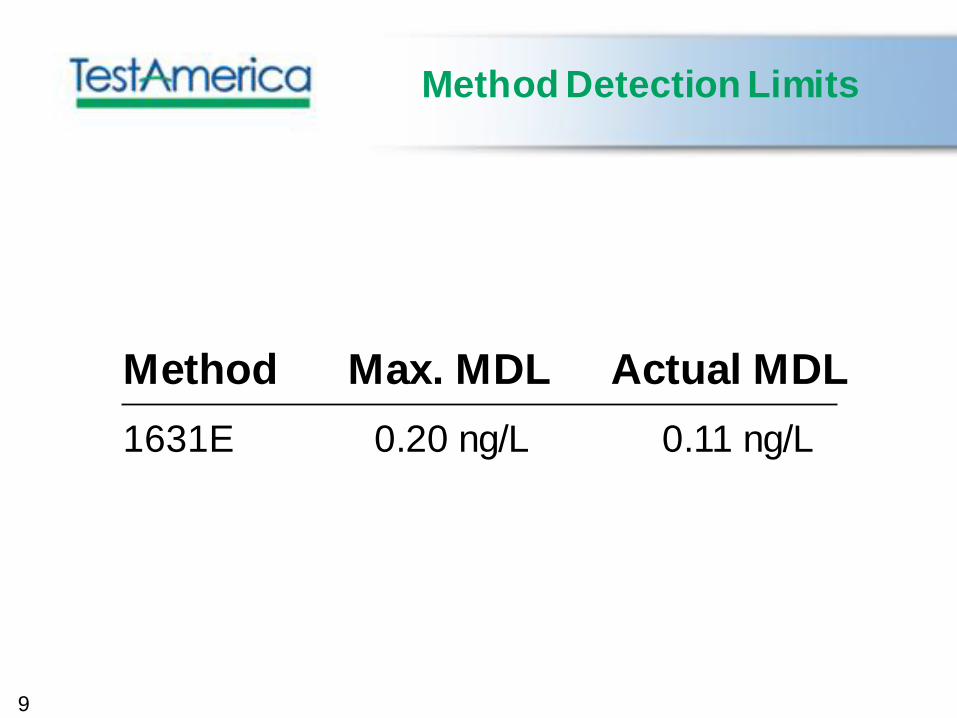
Method Detection Limits
Method Max. MDL Actual MDL
1631E 0.20 ng/L 0.11 ng/L
10
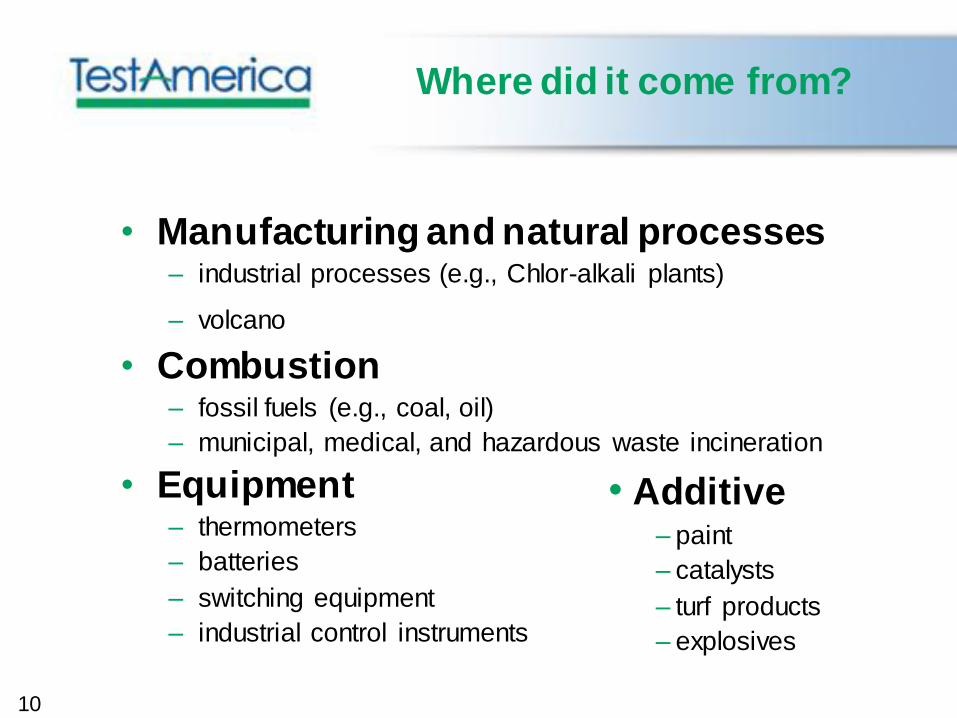
Where did it come from?
• Manufacturing and natural processes– industrial processes (e.g., Chlor-alkali plants)
– volcano
• Combustion– fossil fuels (e.g., coal, oil)
– municipal, medical, and hazardous waste incineration
• Equipment– thermometers
– batteries
– switching equipment
– industrial control instruments
• Additive– paint
– catalysts
– turf products
– explosives
11
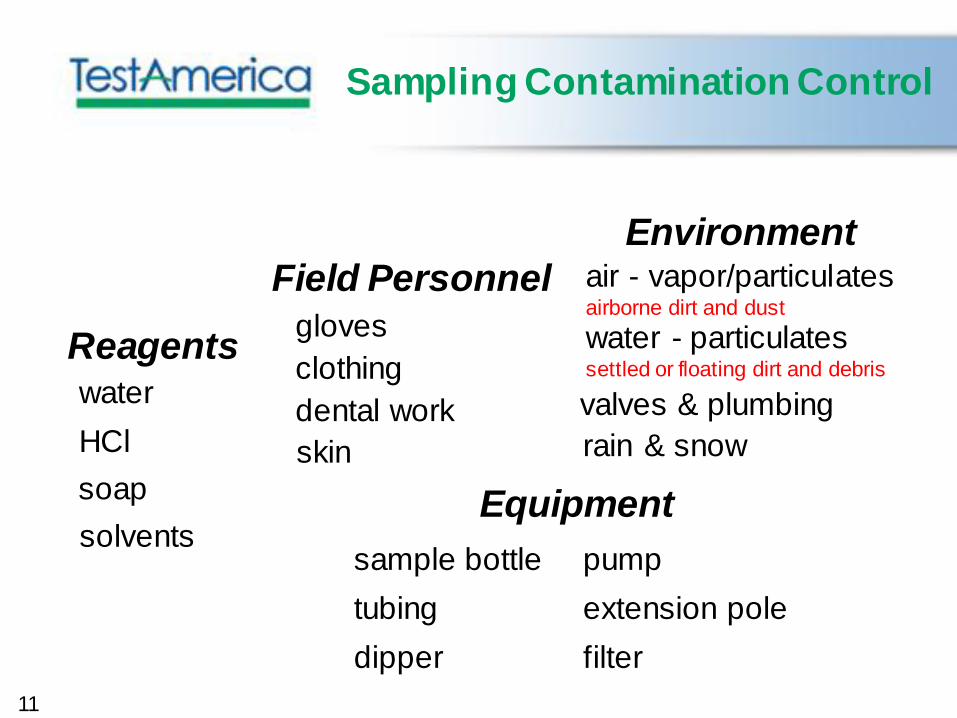
Sampling Contamination Control
HCl
clothing
gloves
water
Reagents
Environmentair - vapor/particulatesairborne dirt and dust
valves & plumbing
rain & snow
Field Personnel
dental work
Equipment
sample bottle pump
tubing extension pole
dipper filter
skin
water - particulatessettled or floating dirt and debris
soap
solvents
12
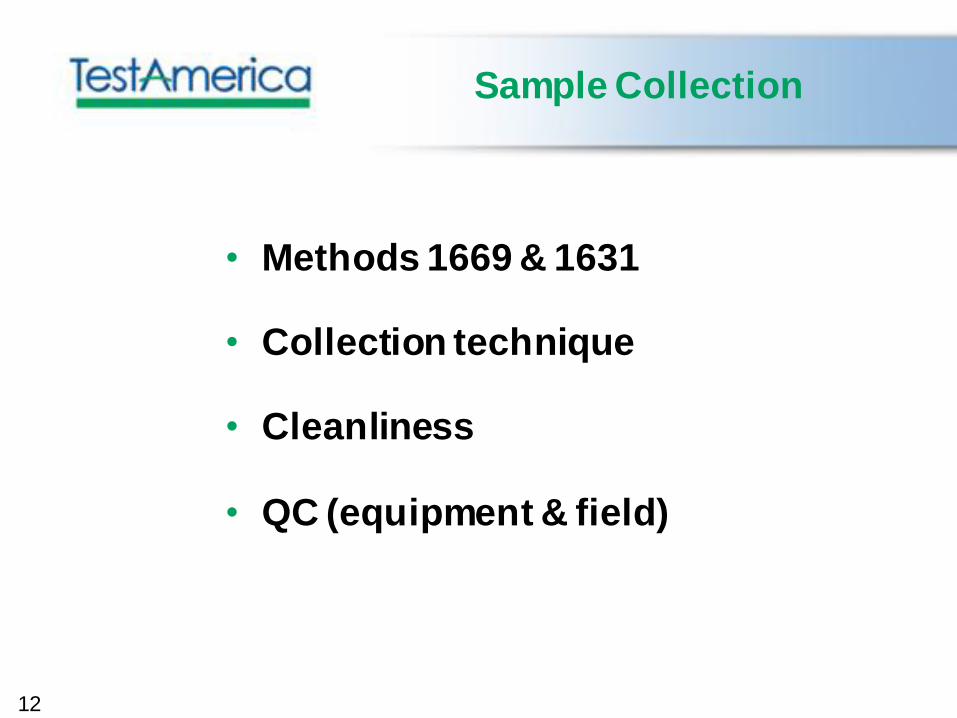
Sample Collection
• Methods 1669 & 1631
• Collection technique
• Cleanliness
• QC (equipment & field)
13
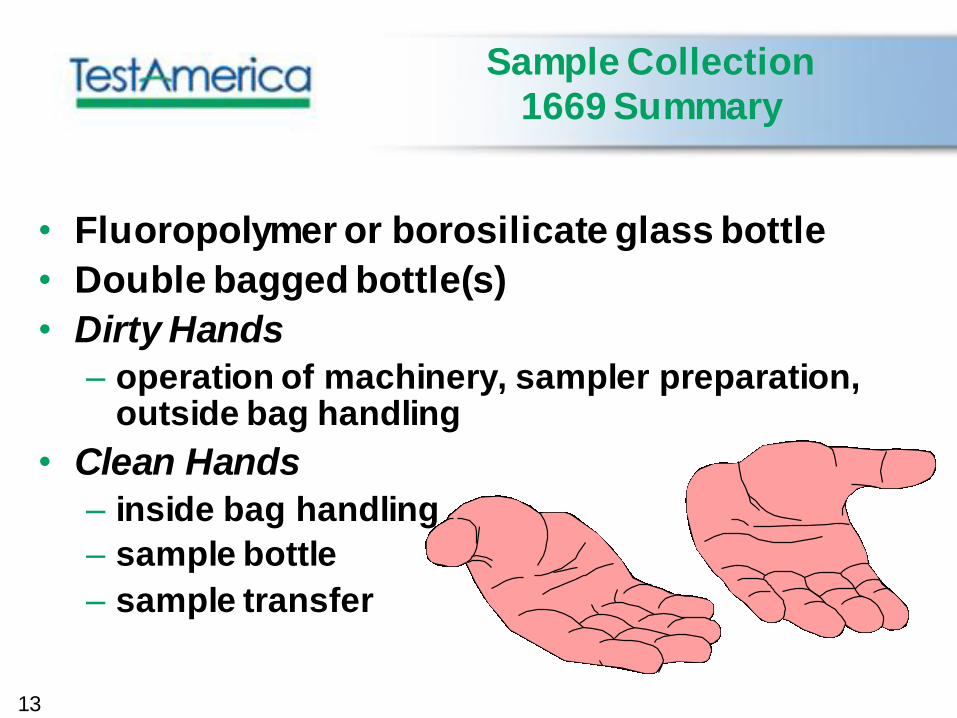
Sample Collection
1669 Summary
• Fluoropolymer or borosilicate glass bottle
• Double bagged bottle(s)
• Dirty Hands
– operation of machinery, sampler preparation, outside bag handling
• Clean Hands
– inside bag handling
– sample bottle
– sample transfer
14
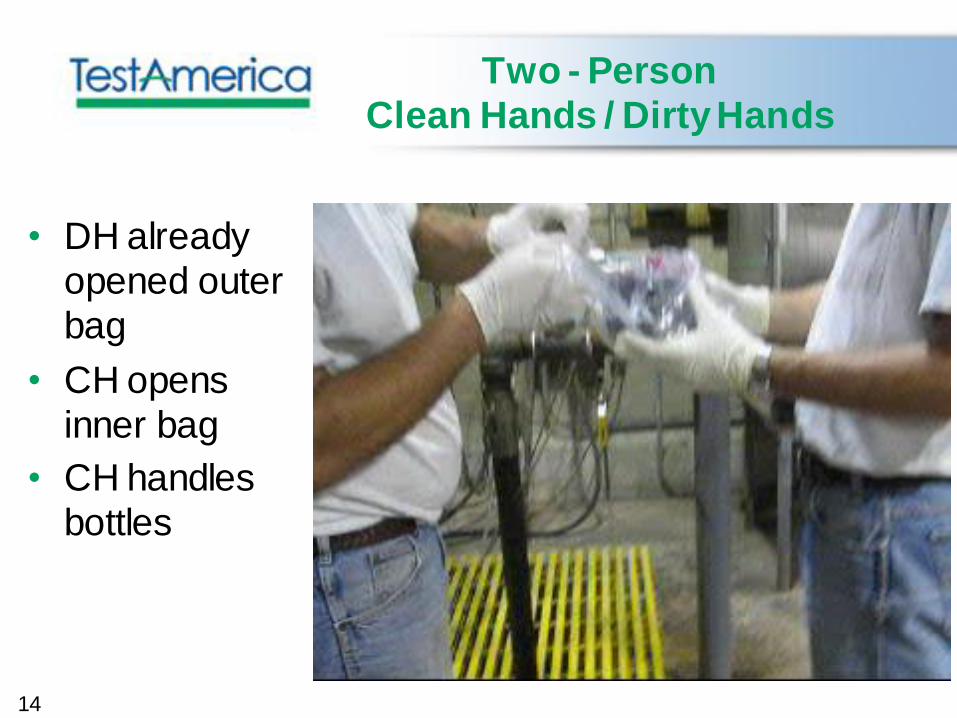
Two - Person
Clean Hands / Dirty Hands
• DH already
opened outer
bag
• CH opens
inner bag
• CH handles
bottles
15
1669 Collection Technique
• US EPA Office of Watervideo demonstrating “clean hands / dirty hands”
• Direct manual surface sampling (Sec. 8.2.5)
• Grab sampling device (8.2.6)
• Depth sampling with jar (8.2.7)
• Continuous flow sampling with peristaltic pump (8.2.8)
• In-line sample filtration (8.2.8.7)
• Avoid exposure to rain (or snow) 18 min. EPA video
17
1669 / 1631 Field & Equipment
QC “Requirements”
• Equipment blanks (1669 Sec. 9.3)
– bottle blanks
– sampling equipment blanks - all equipment
• Field blanks (10% frequency) (1669 Sec. 9.4)
– pretested water available from TestAmerica
• Field duplicate (10%frequency)(1669 Sec.9.5)
• MS/MSD (1 pair per 10 site samples) (1631 Sec. 9.3)
• Trip blank (not in methods, available from TestAmerica)
18
1669 / 1631 Cleanliness
• No metal / sample contact
• “Pretested” bottles, pump tubing, filters
• Equipment that contacts sample
– manufactured clean
– chemically cleaned
• soaked in 5-10% HCl
• rinsed with reagent water
– double bagged
• Portable “glove box”
19
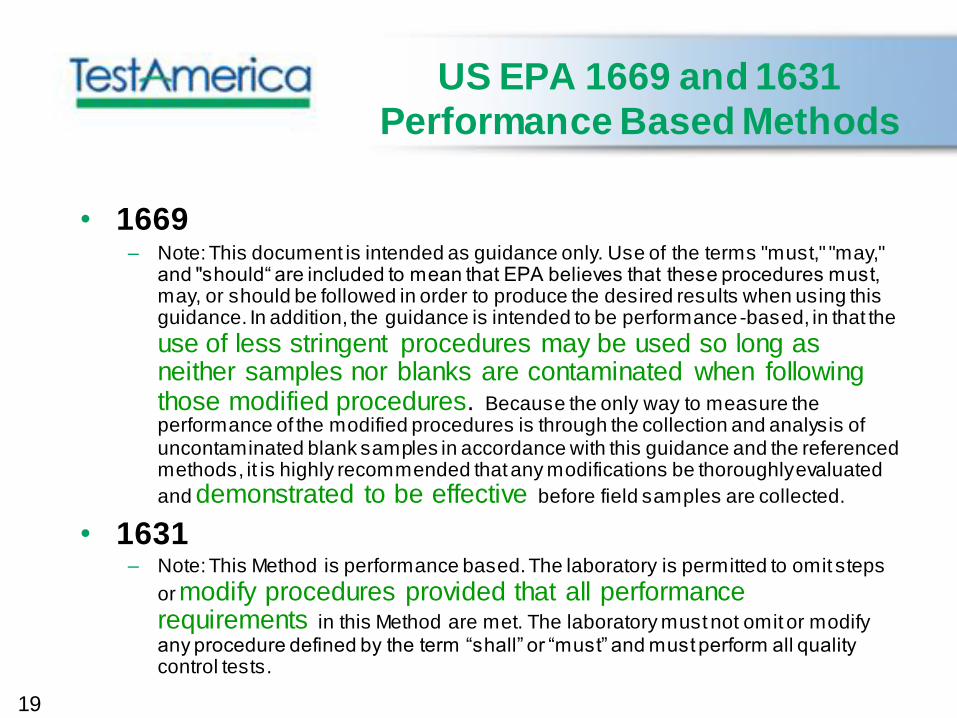
US EPA 1669 and 1631
Performance Based Methods
• 1669– Note: This document is intended as guidance only. Use of the terms "must," "may,"
and "should“ are included to mean that EPA believes that these procedures must, may, or should be followed in order to produce the desired results when using this guidance. In addition, the guidance is intended to be performance-based, in that the
use of less stringent procedures may be used so long as neither samples nor blanks are contaminated when following those modified procedures. Because the only way to measure the performance of the modified procedures is through the collection and analysis of uncontaminated blank samples in accordance with this guidance and the referenced methods, it is highly recommended that any modifications be thoroughly evaluated
and demonstrated to be effective before field samples are collected.
• 1631– Note: This Method is performance based. The laboratory is permitted to omit steps
or modify procedures provided that all performance requirements in this Method are met. The laboratory must not omit or modify any procedure defined by the term “shall” or “must” and must perform all quality control tests.
20
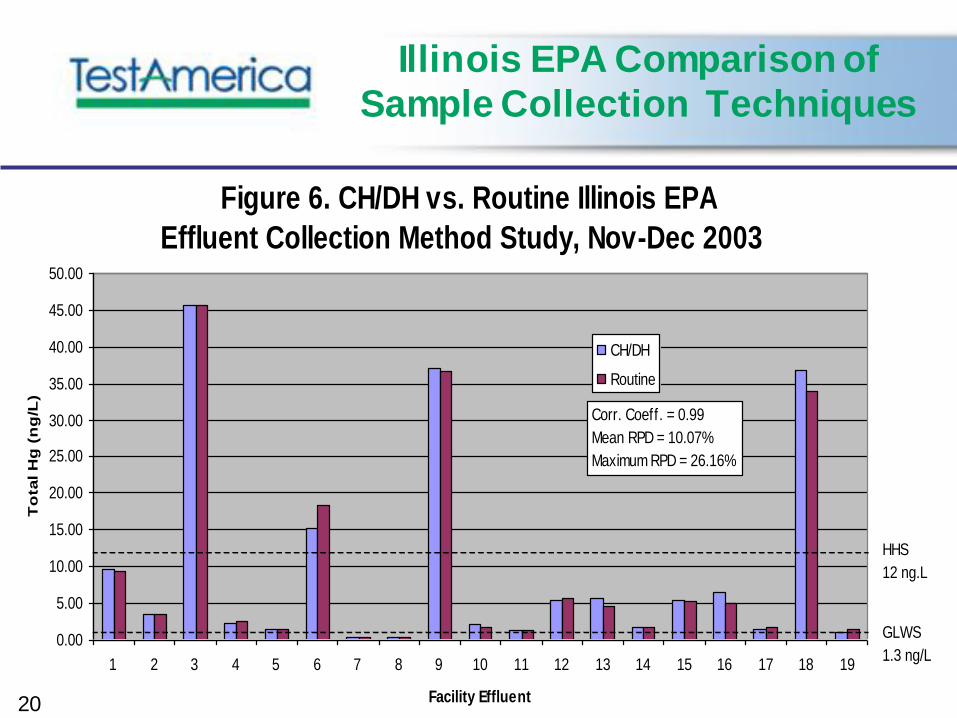
Illinois EPA Comparison of
Sample Collection Techniques
Figure 6. CH/DH vs. Routine Illinois EPA
0.00
5.00
10.00
15.00
20.00
25.00
30.00
35.00
40.00
45.00
50.00
1 2 3 4 5 6 7 8 9 10 11 12 13 14 15 16 17 18 19
Facility Effluent
To
tal H
g (
ng
/L)
CH/DH
Routine
Effluent Collection Method Study, Nov-Dec 2003
GLWS
1.3 ng/L
HHS
12 ng.L
Corr. Coeff. = 0.99
Mean RPD = 10.07%
Maximum RPD = 26.16%
21
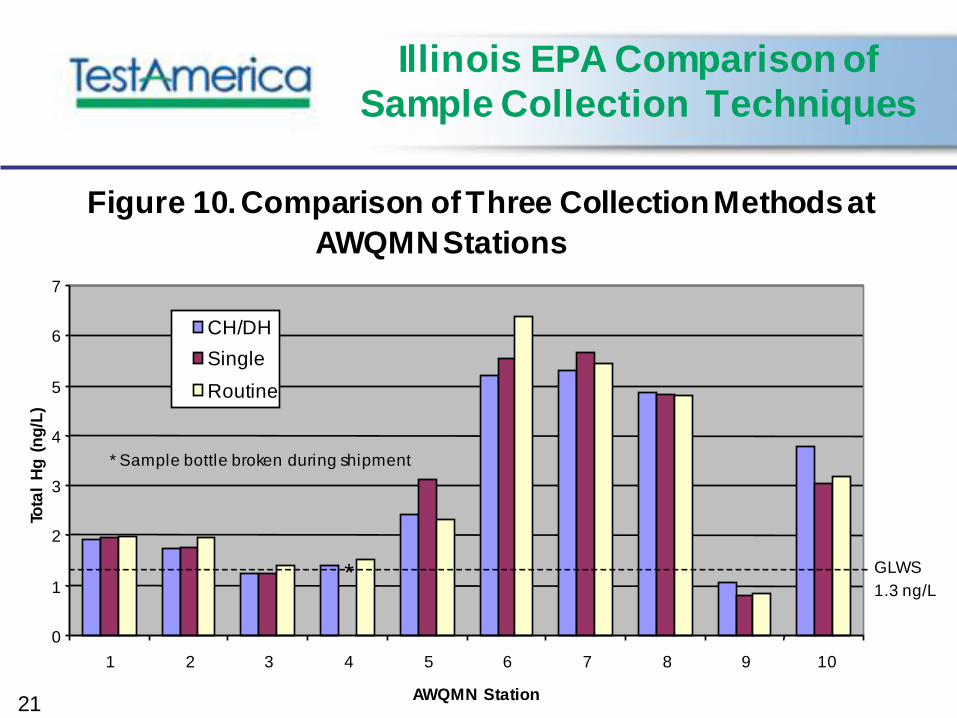
Illinois EPA Comparison of
Sample Collection Techniques
Figure 10. Comparison of Three Collection Methods at
AWQMN Stations
0
1
2
3
4
5
6
7
1 2 3 4 5 6 7 8 9 10
AWQMN Station
Tota
l H
g (
ng
/L)
CH/DH
Single
Routine
GLWS
1.3 ng/L*
* Sample bottle broken during shipment

22
One - Person
Clean Hands / Dirty Hands
• Simple
valve
collection
point
26
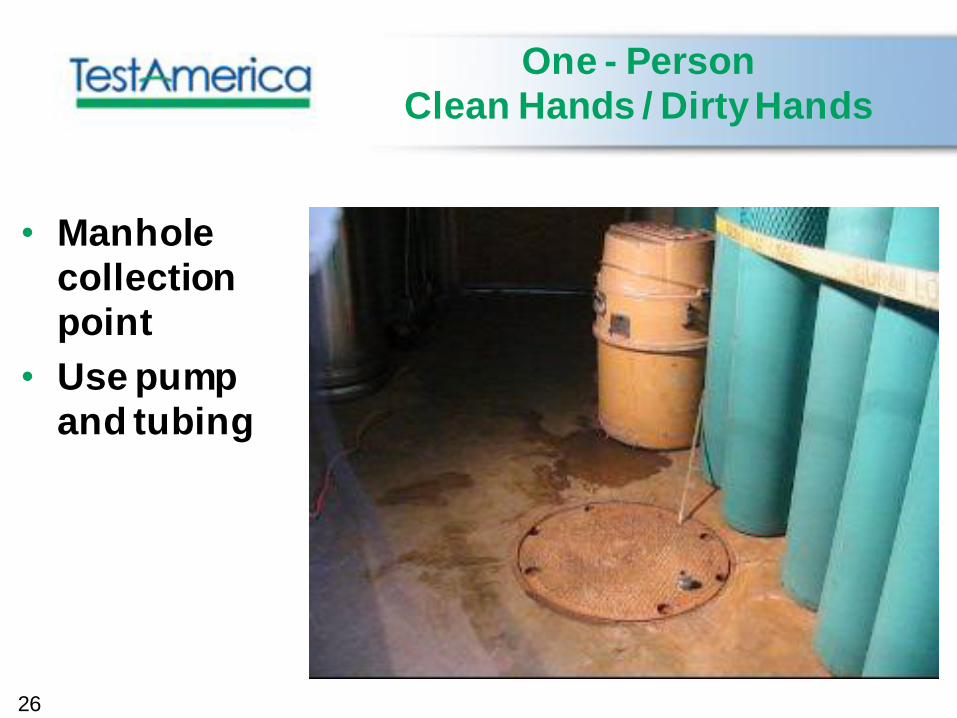
One - Person
Clean Hands / Dirty Hands
• Manhole
collection
point
• Use pump
and tubing
27
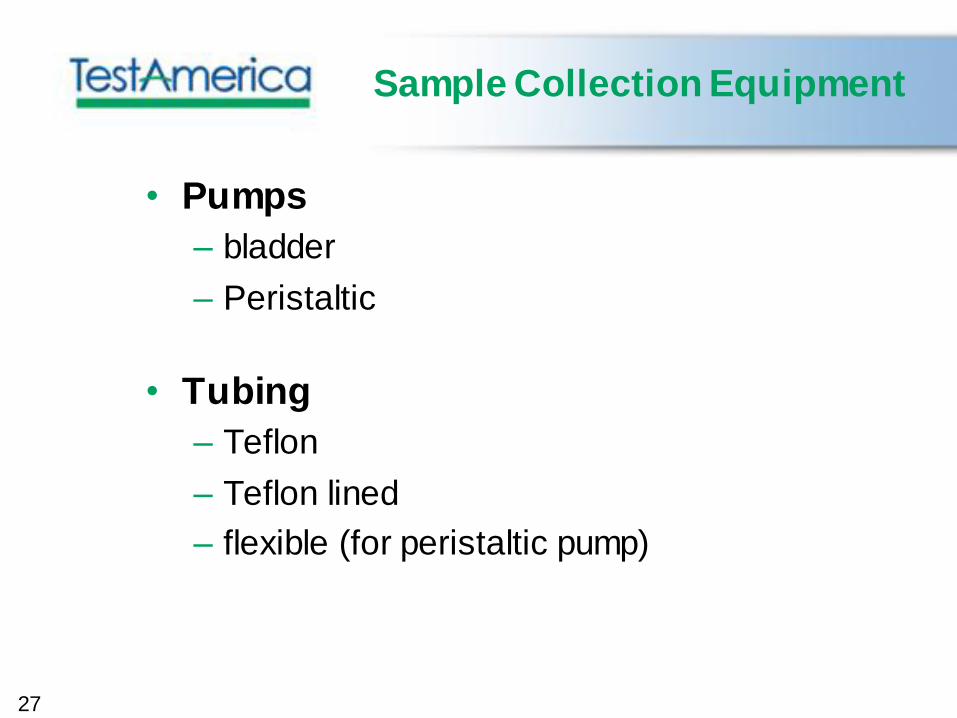
Sample Collection Equipment
• Pumps
– bladder
– Peristaltic
• Tubing
– Teflon
– Teflon lined
– flexible (for peristaltic pump)
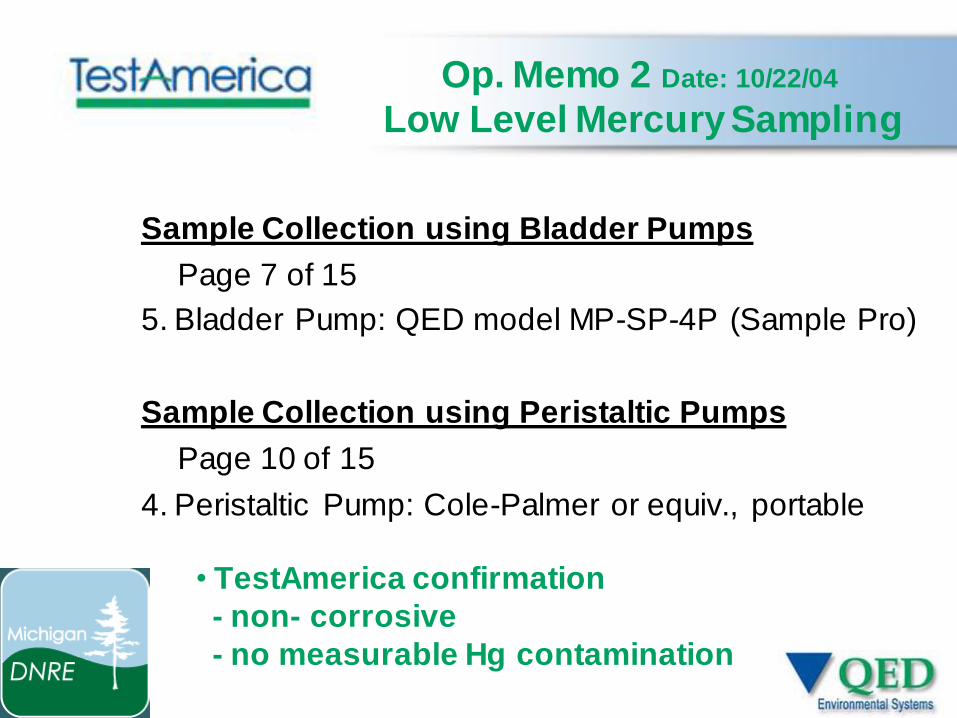
Op. Memo 2 Date: 10/22/04
Low Level Mercury Sampling
Sample Collection using Bladder Pumps
Page 7 of 15
5. Bladder Pump: QED model MP-SP-4P (Sample Pro)
Sample Collection using Peristaltic Pumps
Page 10 of 15
4. Peristaltic Pump: Cole-Palmer or equiv., portable
• TestAmerica confirmation
- non- corrosive
- no measurable Hg contamination
30
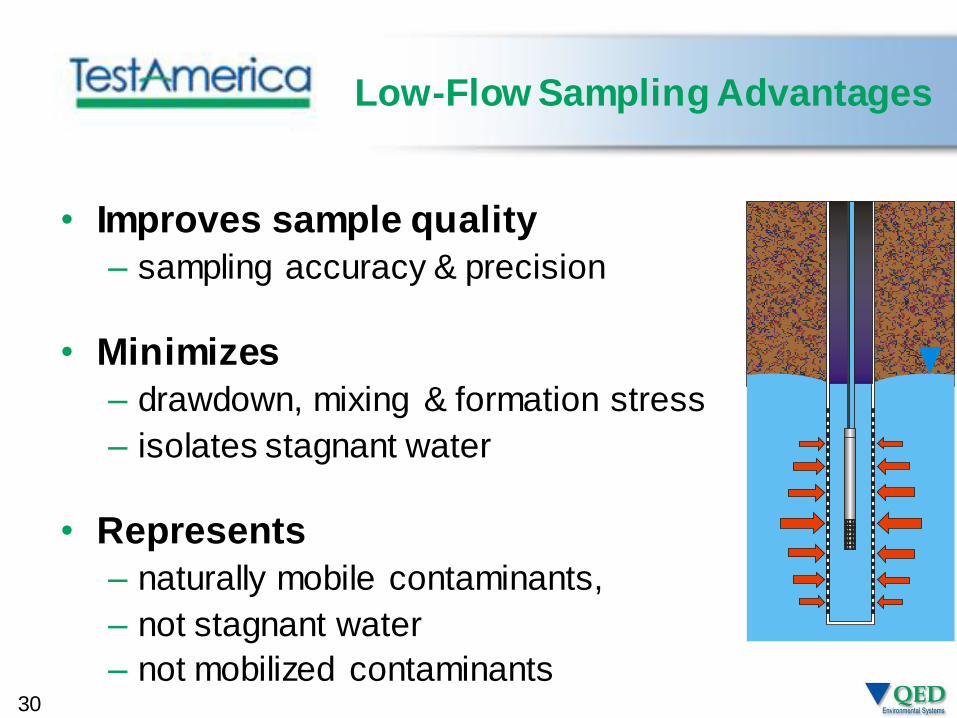
Low-Flow Sampling Advantages
• Improves sample quality
– sampling accuracy & precision
• Minimizes
– drawdown, mixing & formation stress
– isolates stagnant water
• Represents
– naturally mobile contaminants,
– not stagnant water
– not mobilized contaminants
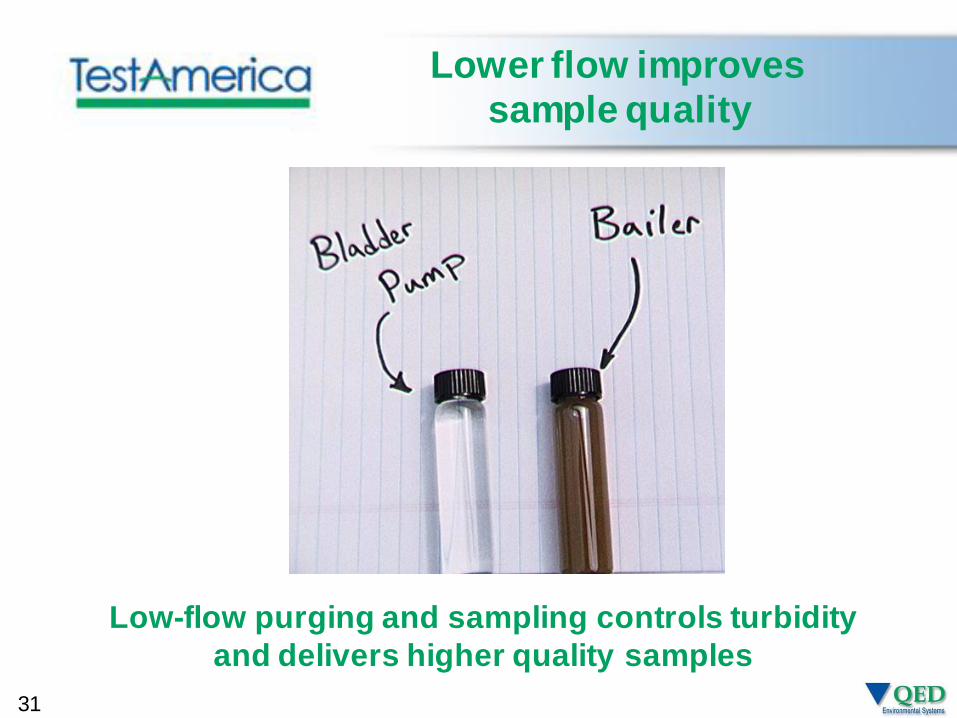
Lower flow improves
sample quality
Low-flow purging and sampling controls turbidity
and delivers higher quality samples
31
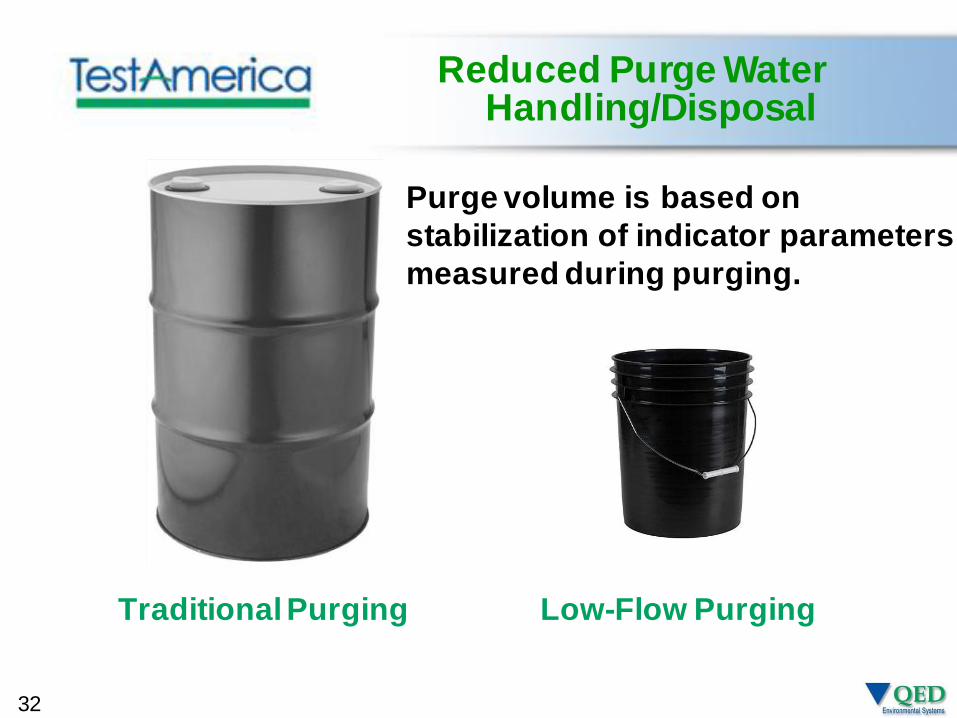
Reduced Purge Water Handling/Disposal
Traditional Purging Low-Flow Purging
32
Purge volume is based on
stabilization of indicator parameters
measured during purging.
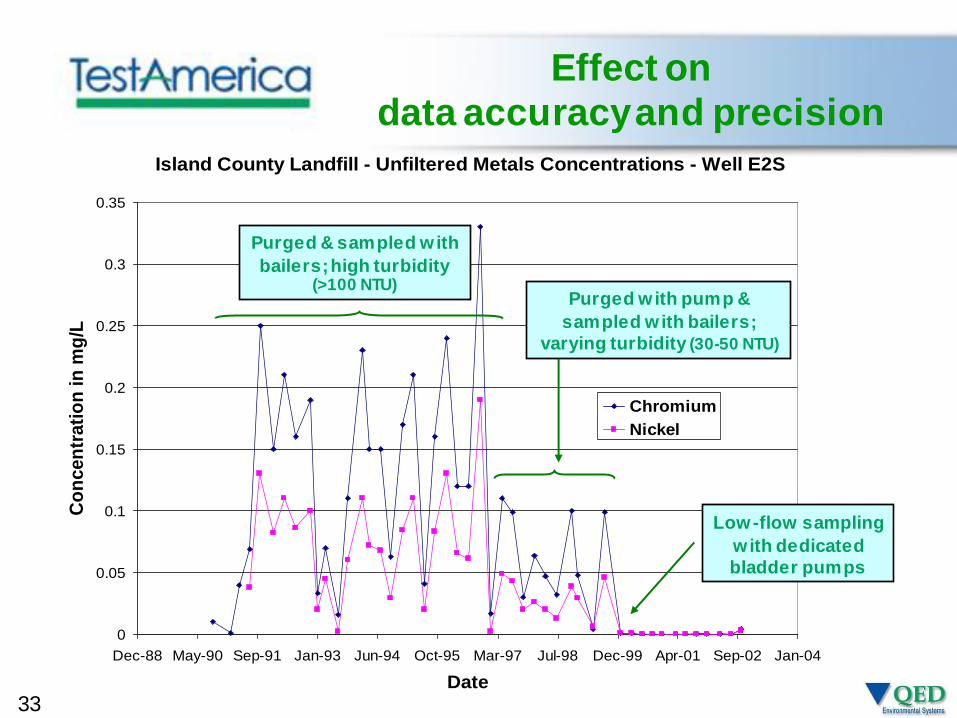
Island County Landfill - Unfiltered Metals Concentrations - Well E2S
0
0.05
0.1
0.15
0.2
0.25
0.3
0.35
Dec-88 May-90 Sep-91 Jan-93 Jun-94 Oct-95 Mar-97 Jul-98 Dec-99 Apr-01 Sep-02 Jan-04
Date
Co
ncen
trati
on
in
mg
/L
Chromium
Nickel
Low-flow sampling
with dedicated
bladder pumps
Effect on
data accuracy and precision
Purged & sampled with
bailers; high turbidity (>100 NTU)
Purged with pump &
sampled with bailers;
varying turbidity (30-50 NTU)
33
Low-Flow Sampling Limitations
• Low-yield wells
– longer purging times
– longer bottle filling
• Very-low-yield wells
– not stabilize at all
– practical lower limit is 50-100 mL/min.
34
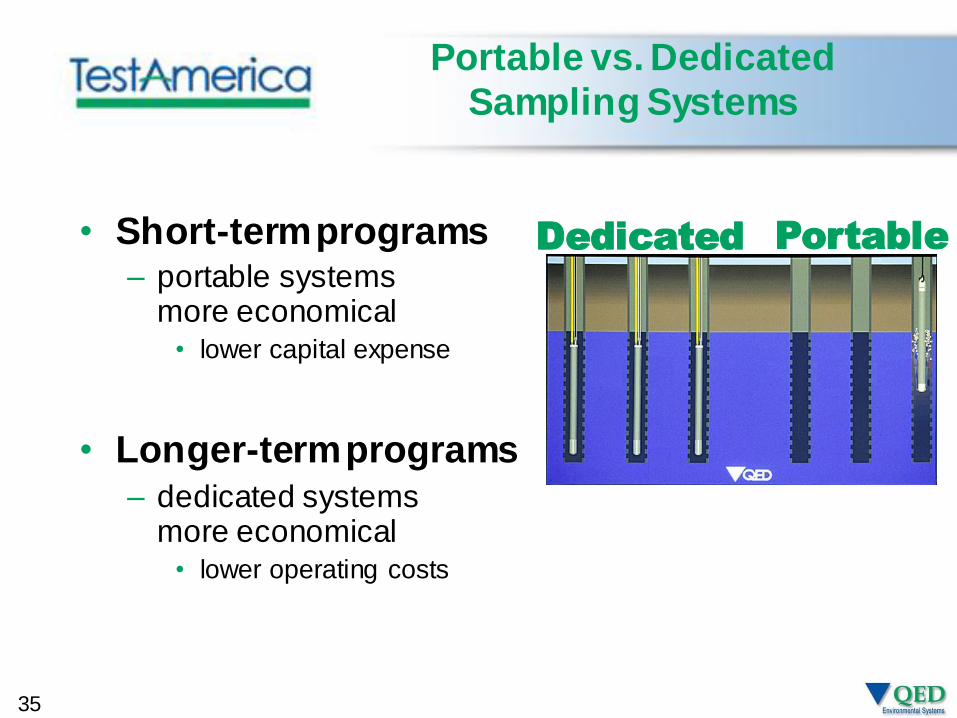
Portable vs. Dedicated
Sampling Systems
• Short-term programs– portable systems
more economical• lower capital expense
• Longer-term programs
– dedicated systems more economical
• lower operating costs
Dedicated Portable
35
36
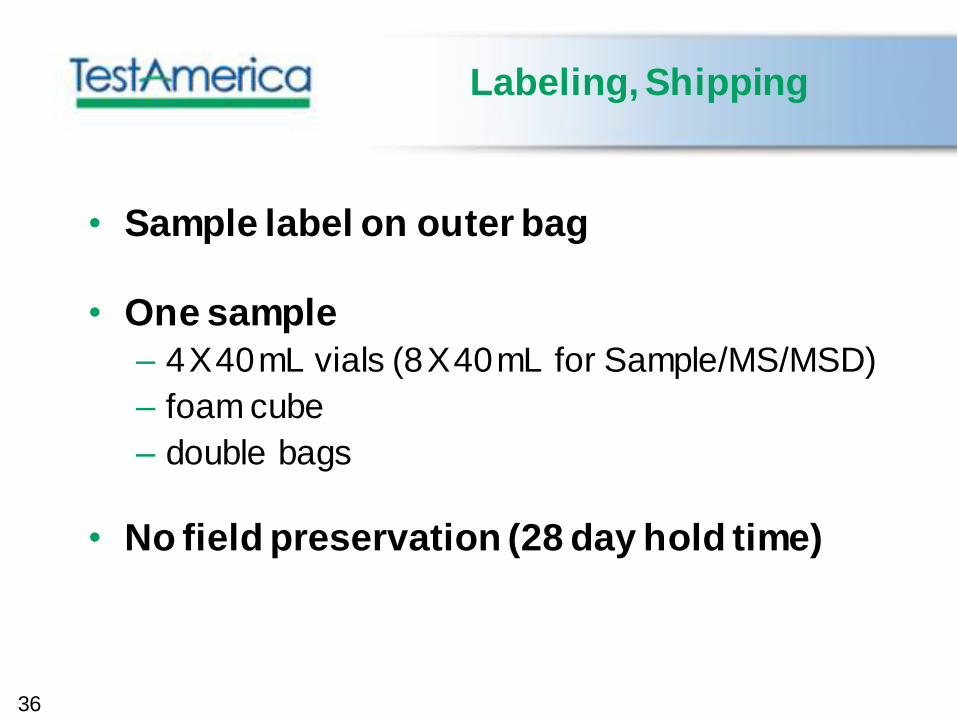
Labeling, Shipping
• Sample label on outer bag
• One sample
– 4X40mL vials (8X40mL for Sample/MS/MSD)
– foam cube
– double bags
• No field preservation (28 day hold time)
37
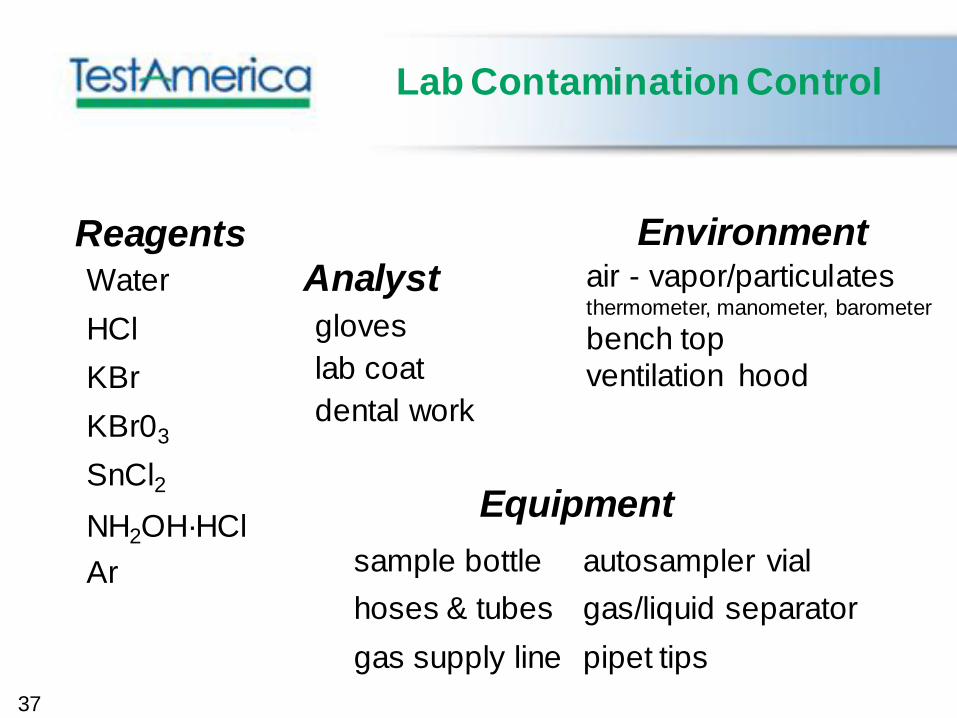
Lab Contamination Control
HCl
lab coat
gloves
Water
KBr
KBr03
SnCl2
NH2OH·HCl
Reagents Environmentair - vapor/particulatesthermometer, manometer, barometer
bench topventilation hood
Analyst
dental work
Equipment
sample bottle autosampler vial
hoses & tubes gas/liquid separatorAr
gas supply line pipet tips
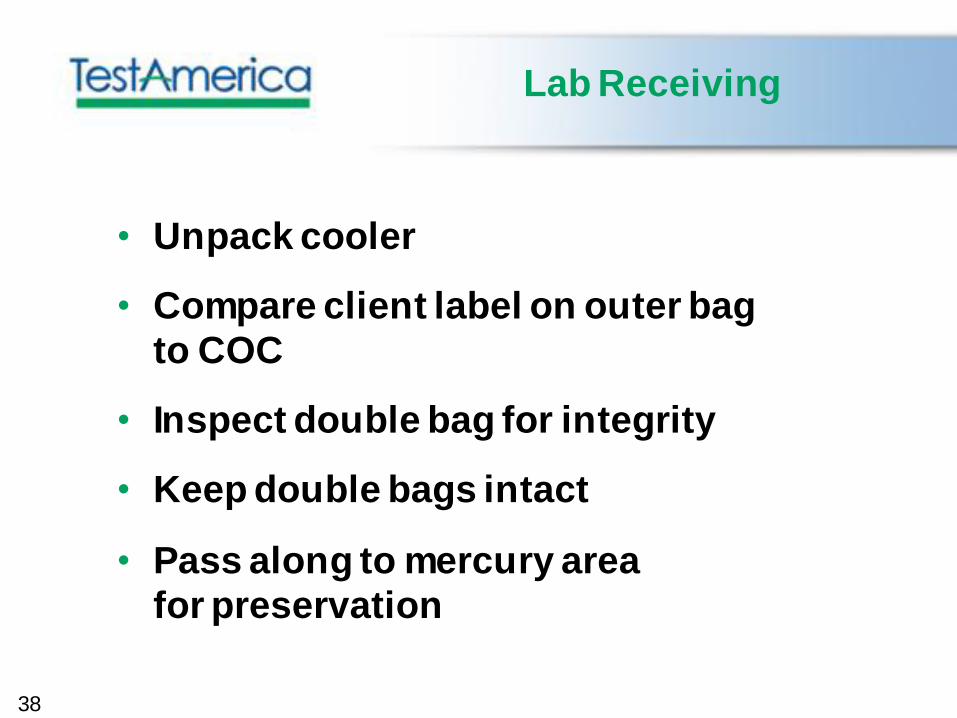
Lab Receiving
• Unpack cooler
• Compare client label on outer bag
to COC
• Inspect double bag for integrity
• Keep double bags intact
• Pass along to mercury area
for preservation
38
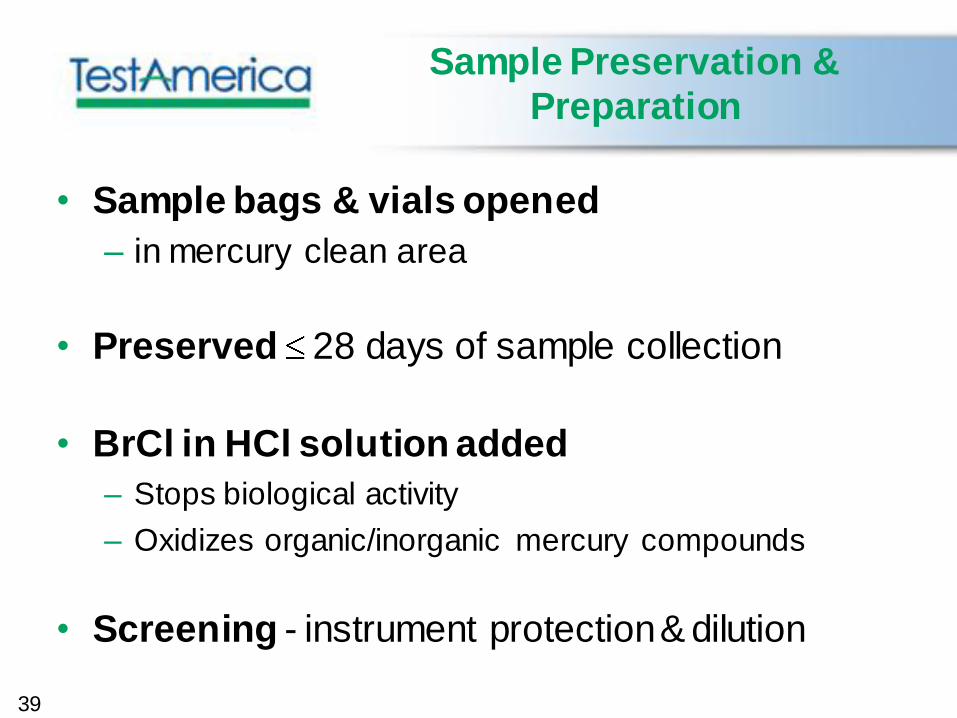
Sample Preservation &
Preparation
• Sample bags & vials opened
– in mercury clean area
• Preserved 28 days of sample collection
• BrCl in HCl solution added
– Stops biological activity
– Oxidizes organic/inorganic mercury compounds
• Screening - instrument protection& dilution
39
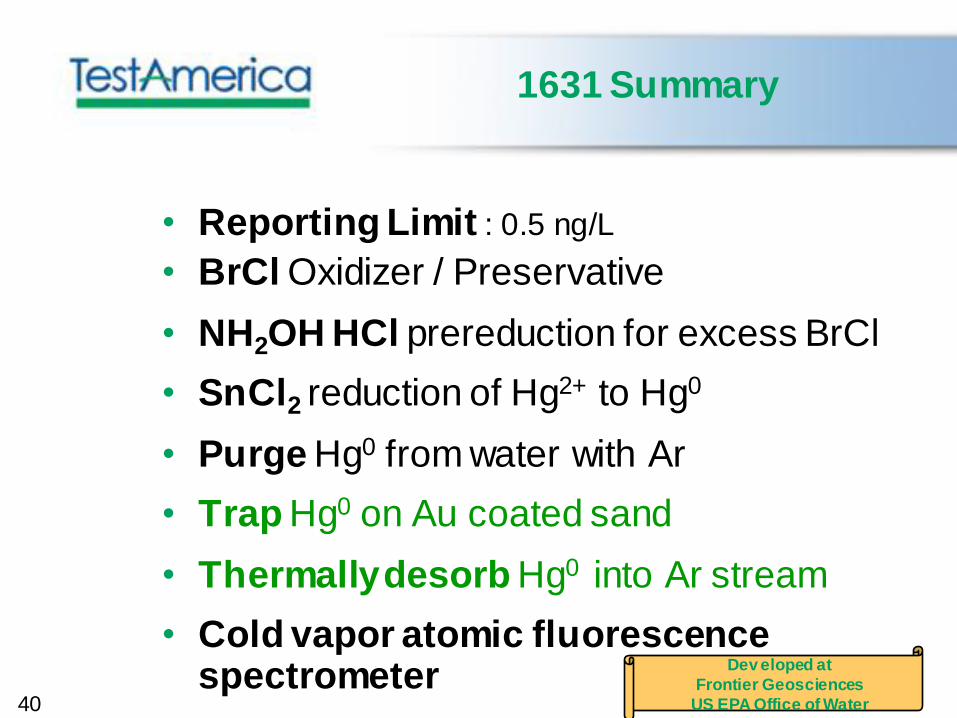
1631 Summary
• Reporting Limit : 0.5 ng/L
• BrCl Oxidizer / Preservative
• NH2OH HCl prereduction for excess BrCl
• SnCl2 reduction of Hg2+ to Hg0
• Purge Hg0 from water with Ar
• Trap Hg0 on Au coated sand
• Thermally desorb Hg0 into Ar stream
• Cold vapor atomic fluorescence spectrometer
Dev eloped at
Frontier Geosciences
US EPA Office of Water40
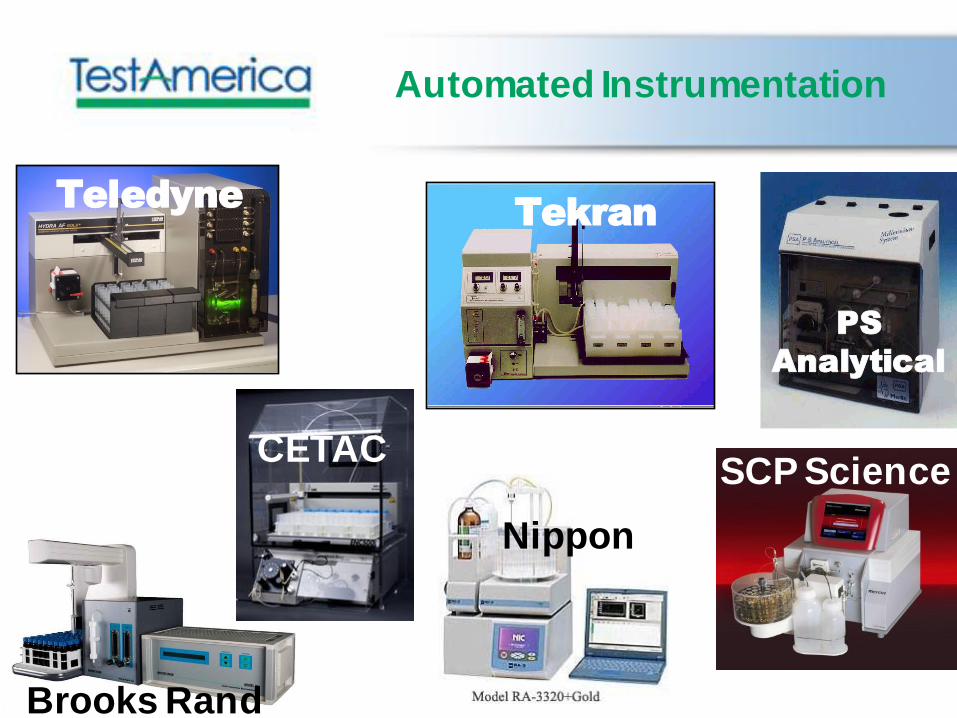
Automated Instrumentation
Teledyne
PS
Analytical
Tekran
Nippon
SCP Science
Brooks Rand
CETAC
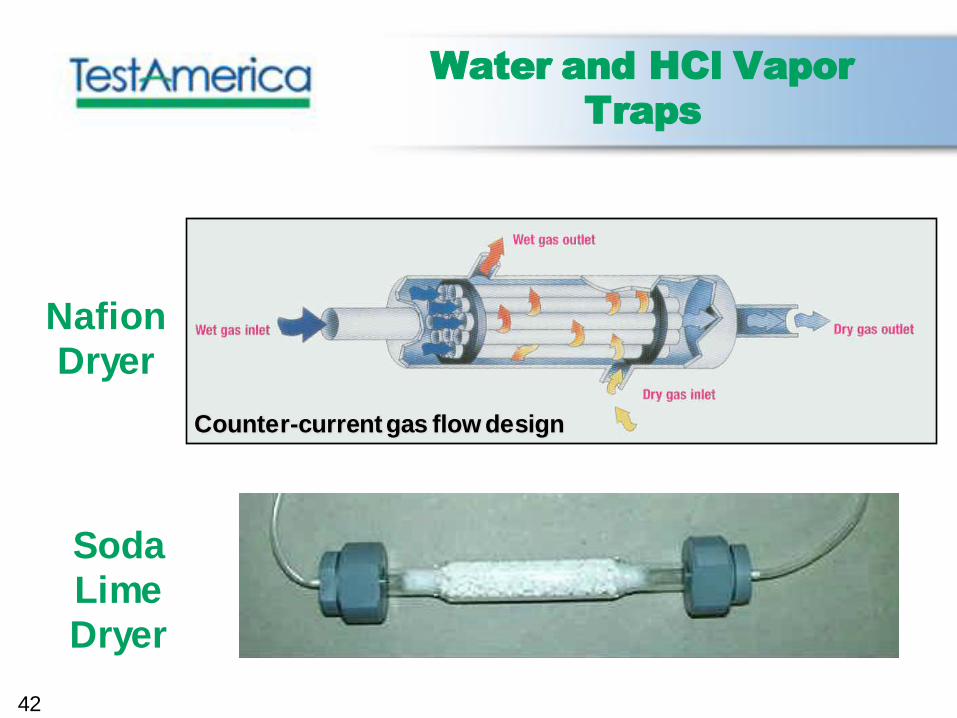
Water and HCl Vapor
Traps
Nafion
Dryer
Counter-current gas flow design
Soda
Lime
Dryer
42
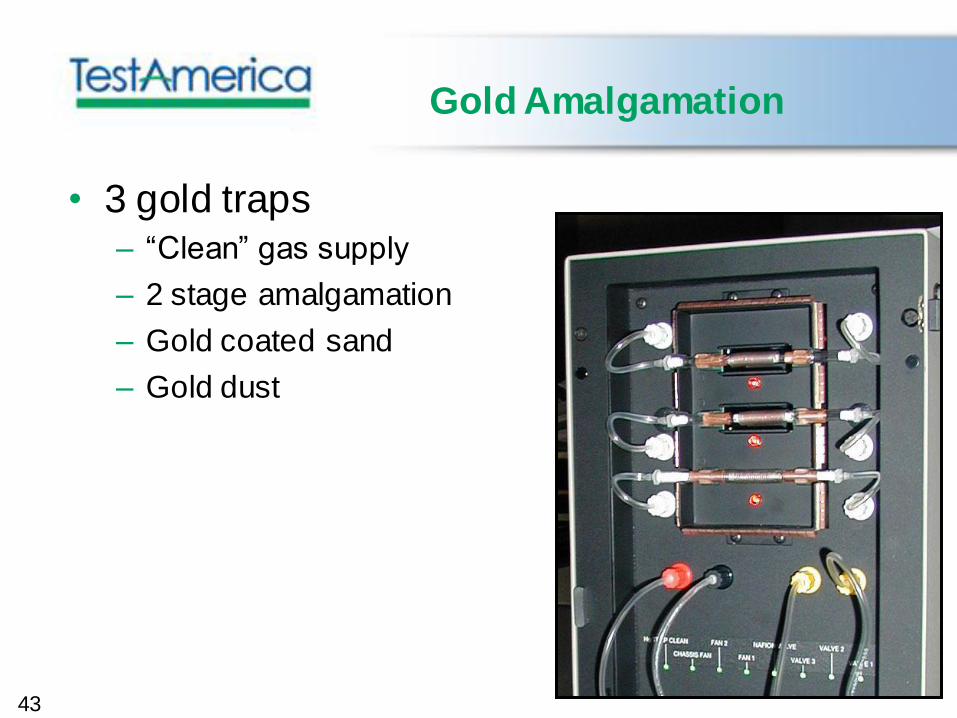
Gold Amalgamation
• 3 gold traps– “Clean” gas supply
– 2 stage amalgamation
– Gold coated sand
– Gold dust
43
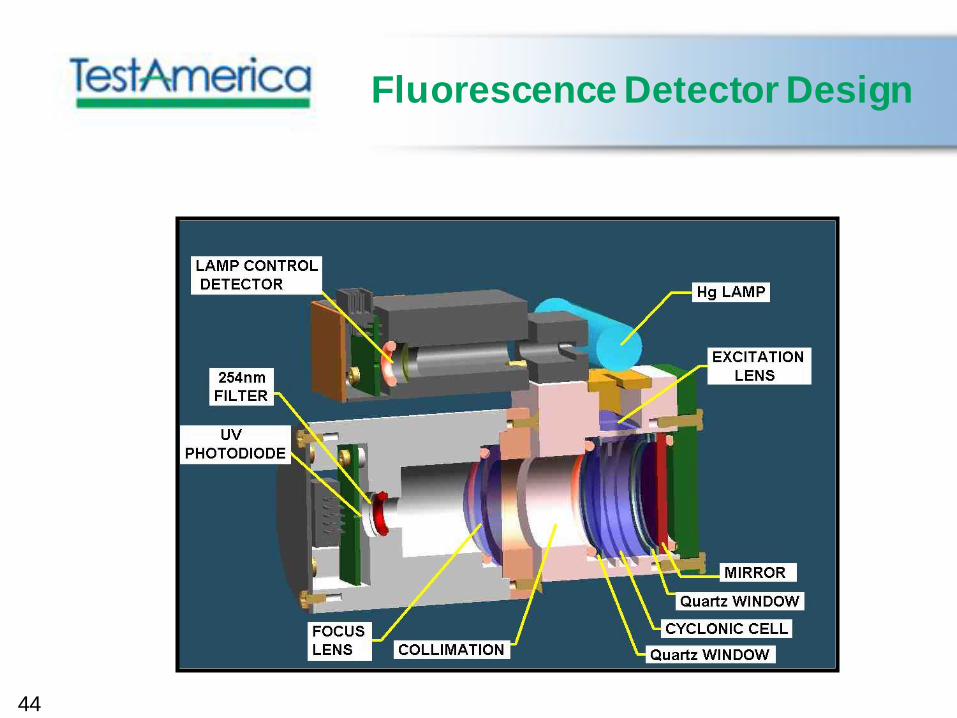
Fluorescence Detector Design
44
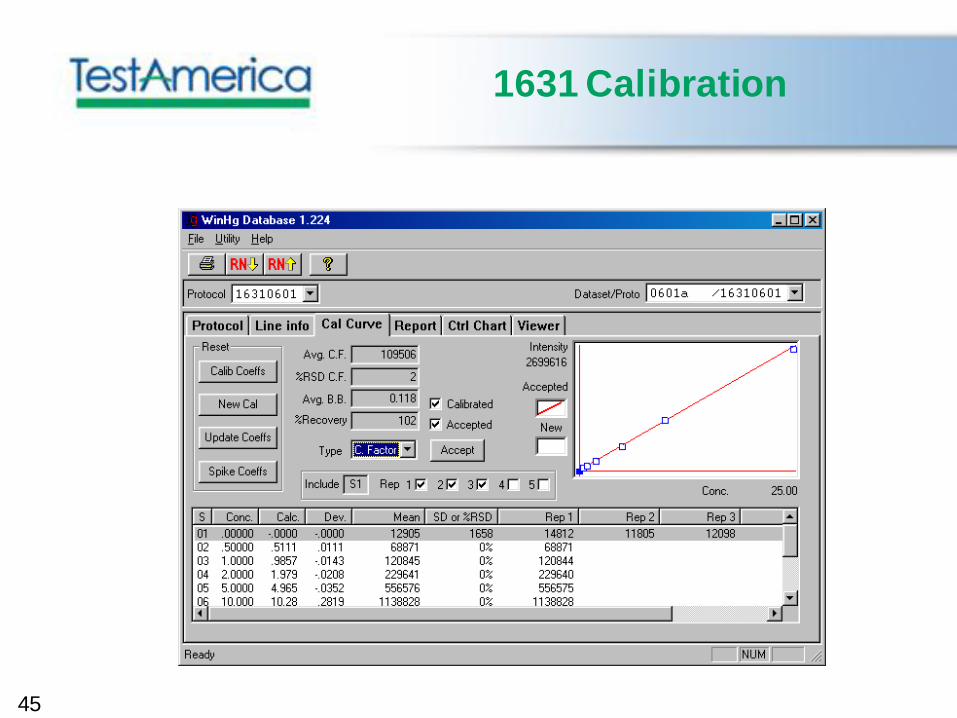
1631 Calibration
45
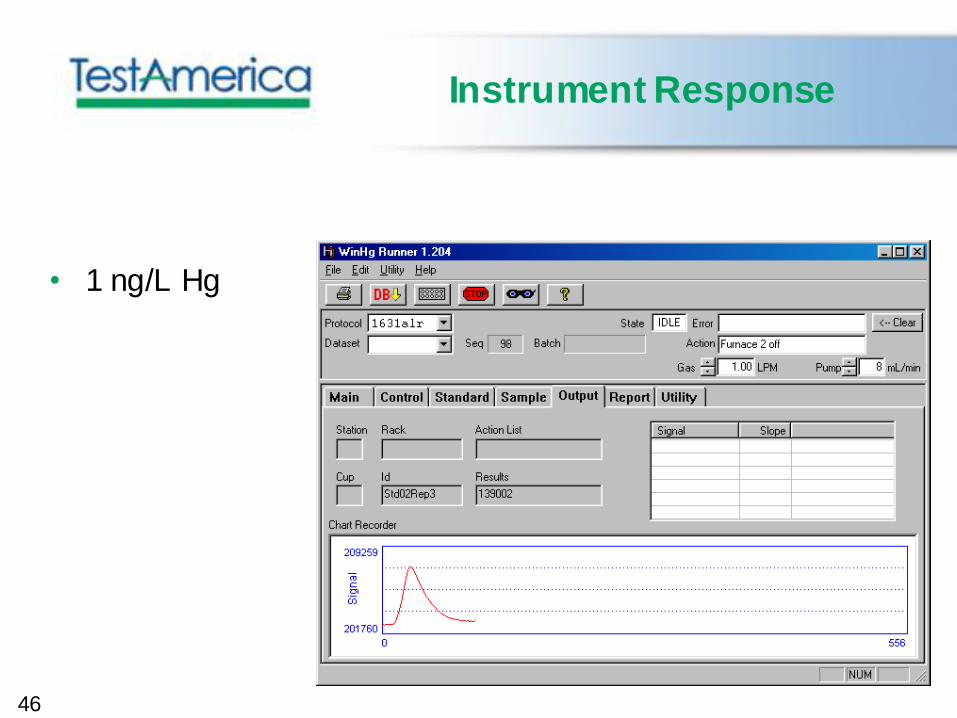
Instrument Response
• 1 ng/L Hg
46
Low Level Mercury Area
• Limited access
• Non-metallic (or coated) fixtures
• Designated Separate Spaces for:
– Incoming double bagged samples
– Sample preservation / screening preparation
– Sample storage
– Known low level area • prep of bottles, reagents, field water
– Standard preparation
– Instrument with filtered air autosampler
47
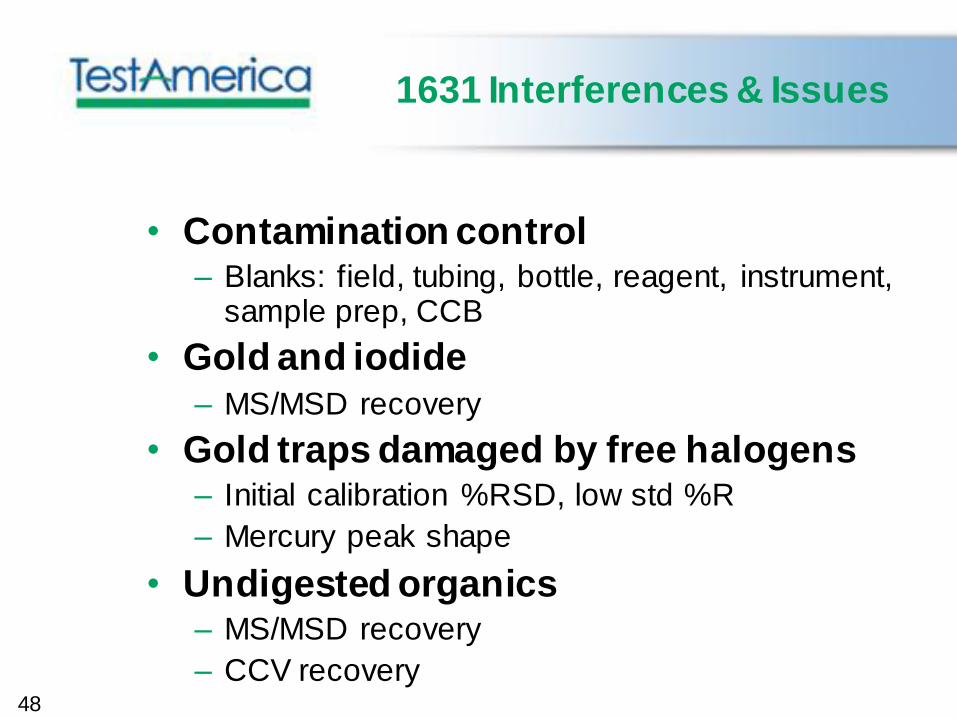
1631 Interferences & Issues
• Contamination control– Blanks: field, tubing, bottle, reagent, instrument,
sample prep, CCB
• Gold and iodide
– MS/MSD recovery
• Gold traps damaged by free halogens– Initial calibration %RSD, low std %R
– Mercury peak shape
• Undigested organics– MS/MSD recovery
– CCV recovery48
49
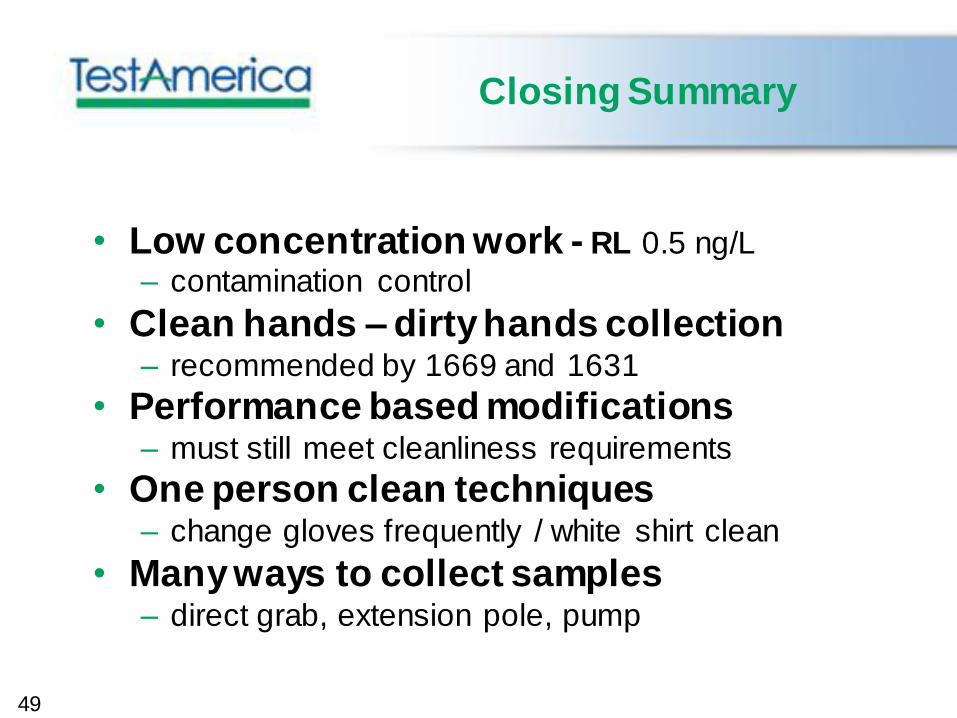
Closing Summary
• Low concentration work - RL 0.5 ng/L
– contamination control
• Clean hands – dirty hands collection– recommended by 1669 and 1631
• Performance based modifications– must still meet cleanliness requirements
• One person clean techniques– change gloves frequently / white shirt clean
• Many ways to collect samples– direct grab, extension pole, pump
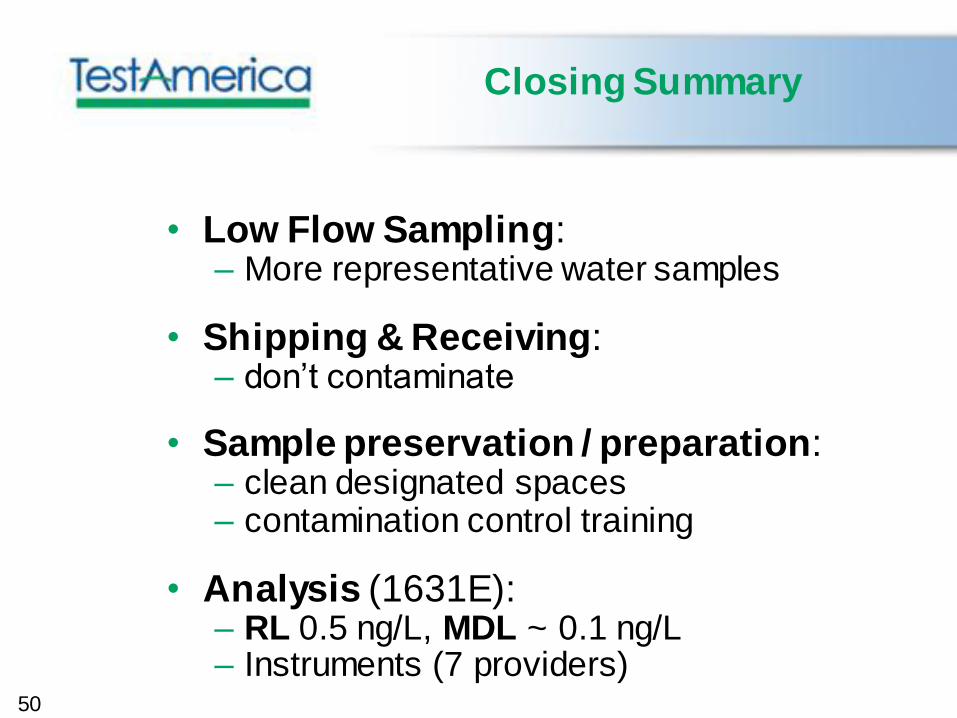
Closing Summary
• Low Flow Sampling: – More representative water samples
• Shipping & Receiving: – don’t contaminate
• Sample preservation / preparation: – clean designated spaces– contamination control training
• Analysis (1631E): – RL 0.5 ng/L, MDL ~ 0.1 ng/L– Instruments (7 providers)
50
LL Hg at NEMC
• National Environmental Monitoring Conference
– Tuesday, August 10, 2010
– Washington D.C.
– www.nemc.us
• Session
– Historical Perspective – Bill Telliard
– Sample Collection
– Sample Preparation
– Analysis and Instrumentation
– Discussion Mercury Analysis Issues51
Low Flow Sampling Webinar
Low-Flow Groundwater Sampling –
An Update on Proper Application and Use
Dave Kaminski
– origins of traditional well purging
– correlation of drawdown & indicator parameter
– relationship between screen length & pump location
– advances in MicroPurge® low-flow sampling
Thursday, June 24, 2010 1:30 PM - 2:30 PM EDT
www.qedenv.com
52
Acknowledgments
Will Cordell,
Joe Grant,
Marc Haines
Mike Henebry
53
54
Questions
Field work side shows