Embed Size (px)
Citation preview
Low Earth OrbiterSea Surface Temperature
Product User Manual
GBL SST (OSI-201-b)
NAR SST (OSI-202-b)
MGR SST (OSI-204-b)
IASI SST (OSI-208-b)
Version : 3.3
Date : 28/06/2018
Prepared by
Document Change record
Doc.version
Softwareversion
Date Author Change description
1.0 22/10/2007 First version.
1.1 30/10/2007 Version taking into account EUMETSAT comments on version1.0 : from Dominique Faucher on 23/10/07, Peter Schluess on24/10/07 and Hans Bonekamp on 25/10/07.
1.2 12/02/2008 Description of the GRIB ed 2 included in appendix A.2
1.3 31/07/2008 Section 5 presents the validation results (in place ofPreliminary validation results)
Appendix A1 : A1.1 accounts for the modifications ofthe NetCDF global attributes that were suggested byEUMETSAT. A1.2 describes the final names adoptedwhen the products became demonstrational.
1.4 26/08/2008 Section 5, access to data added.
1.5 09/01/2009 in the introduction data volume updated and explanation givenon product confidence levels
2.0 20/05/2009 The Metop/AVHRR Sea Surface Temperature Product UserMANUAL is replaced by the Low Earth Orbiter Sea SurfaceTemperature Product User Manual, addressing the productsderived from NOAA and MetOp AVHRR data, an in the futurefrom NPP/VIIRS data. The NAR SST over one unique area,replacing the NAR SST over 7 areas, is addressed in thecurrent PUM, while the old NAR SST over 7 sub-areas isaddressed in the NOAA NAR PUM.
2.1 04/11/2009 Version updated when NOAA-18 is replaced by NOAA-19.Introduction updated.Chapter on validation results removed (reference given to theValidation reports)
2.2 12/05/2010 Modification in GRIB2 NAR SST description (Appendix A.2)
2.3 05/06/2013 Modification in Appendix A.1
2.4 30/08/2013 Updated version to include NAR SST products derived fromNPP/VIIRS, and prepared for ORR
2.5 30/09/2013 Updated version taking into account NAR SST VIIRS ORRRIDs.Information concerning Surface Temperature over selectedlakes added in the section 1.1.
2.6 15/04/2014 Updated version to include IASI derived SST products. Fewchanges taking into account IASI SST OSI-208 ORR RIDs.
2.7 31/10/2014 IASI SST format updated : this product is available inL2PNetCDF only
3.0 20/11/2015 Updated version for the ORR of AVHRR derived products OSI-201-b / OSI-202-b / OSI-204-bInformation on processing chain removed because given in theATBD.
LML LEO SST PUM28/06/2018 Version 3.3 2/27
3.1 10/12/2015 Updated version taking into account the RIDs from reviewersof the Operational Readiness Review.
3.2 04/07/2016 Update of output formats and dissemination means
3.3 28/06/2018 SSPCH
Upcoming upgrade of GBL SST and MGR SST planned in July2018
Table of contents
1.Introduction..............................................................................................................................................41.1.The EUMETSAT Ocean and Sea Ice SAF......................................................................................41.2.Disclaimer........................................................................................................................................41.3.Overview..........................................................................................................................................51.4.Glossary..........................................................................................................................................61.5.Reference and applicable documents.............................................................................................7
1.5.1.Reference documents.............................................................................................................71.5.2.Applicable documents.............................................................................................................7
2.Metop/AVHRR and SNPP/VIIRS.............................................................................................................82.1.Overview of the processing chain and methods.............................................................................82.2.Quality levels...................................................................................................................................82.3.Elements of validation.....................................................................................................................9
3.Metop/IASI.............................................................................................................................................103.1.Overview and background.............................................................................................................103.2.Algorithm overview........................................................................................................................103.3.Algorithm description.....................................................................................................................103.4.Constraints, assumptions and limitations......................................................................................103.5.Implementation of IASI L2P at the EUMETSAT OSI SAF.............................................................11
4.Products description..............................................................................................................................114.1.Format............................................................................................................................................114.2.MGR SST and GBL SST (Metop/AVHRR)....................................................................................124.3.NAR SST derived from Metop AVHRR or NPP/VIIRS...................................................................124.4.5.3 IASI SST..................................................................................................................................13
5.Access to the products..........................................................................................................................135.1.Access to products in near-real time.............................................................................................135.2.Access to archived products.........................................................................................................14
6.References............................................................................................................................................147.Appendix A.1. L2P and L3C format description....................................................................................168.Appendix A.2: Format of the GRIB ed. 2 product..................................................................................189.Appendix A.3 : Accessing data by using the ECMWF GRIB API..........................................................2310.Appendix A.4 : Locating the NAR data by using PROJ4 library..........................................................25
LML LEO SST PUM28/06/2018 Version 3.3 3/27
1. Introduction
1.1. The EUMETSAT Ocean and Sea Ice SAF
The Satellite Application Facilities (SAFs) are dedicated centres of excellence for processing satellitedata – hosted by a National Meteorological Service – which utilise specialist expertise from institutesbased in Member States. EUMETSAT created Satellite Application Facilities (SAFs) to complement itsCentral Facilities capability in Darmstadt. The Ocean and Sea Ice Satellite Application Facility (OSISAF) is one of eight EUMETSAT SAFs, which provide users with operational data and softwareproducts. More on SAFs can be read at www.eumetsat.int.
The objective of the OSI SAF is the operational near real-time production and distribution of a coher-ent set of information, derived from earth observation satellites, and characterising the ocean surfaceand the energy fluxes through it: sea surface temperature, radiative fluxes, wind vector and sea icecharacteristics. For some variables, the OSI SAF is also aiming at providing long term data records forclimate applications, based on reprocessing activities.
The sea surface temperature products include global and regional products, both from geostationary(GEO) and low orbit satellites (LEO).
The OSI SAF consortium is hosted by Météo-France.
The LEO global SST processing and the GEO SST processing are performed at the Low and MidLatitudes processing facility (LML centre). The LML production subsytem is operated by Météo-France'sCentre for Satellite Meteorology (MF/CMS) in Lannion, France; Ifremer centre in Brest, France, is incharge of near real-time distribution of OSI SAF Low and Mid Latitudes products via a FTP server.
The characteristics of the products currently produced by the OSI SAF under pre-operational or op-erational status are provided in the Service Specification Document (SeSp) [RD-1]). The quality assess-ment of the OSI SAF products is done first just before becoming an operational/pre-operational productdistributed by the OSI SAF. This first assessment is explained in this scientific validation report [RD.1].Then continuous monitoring of the product quality is done by the OSI SAF team and presented in thehalf-yearly operations reports available on the OSI SAF web site project documentation. The quality as-sessment of the OSI SAF products is done against the target accuracy requirement defined in the OSISAF Service Specification [AD.6]. The target accuracy corresponds to the desired performance level(the breakthrough accuracy). If the values are not compliant to the target accuracy requirement, weconsider that the product is still useful/useable as long as the values are compliant to the threshold re-quirement.
Users are highly recommended to register on the OSI SAF web Site in order to get access to usefulinformation, documentation and links, news, service messages, and access to the help desk.
1.2. Disclaimer
All intellectual property rights of the OSI SAF products belong to EUMETSAT. The use of theseproducts is granted to every interested user, free of charge. If you wish to use these products, EUMET -SAT’s copyright credit must be shown by displaying the words “Copyright © <YYYY> EUMETSAT” oneach of the products used.
LML LEO SST PUM28/06/2018 Version 3.3 4/27
Note : The comments that we get from our users is an important input when defining developmentactivities and updates, and user feedback to the OSI SAF project team is highly valued.
1.3. Overview
This document is the product user manual the committed products described below:
- The GHRSST L3C Global Metop/AVHRR sub-skin Sea Surface Temperature (GBL SST) is a 12hourly synthesis on a 0.05° global grid, referenced OSI-201-b,
- The GHRSST L3C North Atlantic Regional (NAR) Sea Surface Temperature product consists inMetop/AVHRR and SNPP/VIIRS derived sub-skin Sea Surface Temperature over North Atlanticand European Seas at 2 km resolution four times a day, referenced OSI-202-b
- The GHRSST L2P full resolution Metop Sea Surface Temperature metagranules (MGR SST),referenced OSI-204-b, consist in Metop/AVHRR full resolution (1 km at nadir) sub-skin SeaSurface Temperature granules. Granules are disseminated every 3 minutes throughEUMETCast.
- The GHRSST L2P Metop/IASI Sea Surface Temperature files (IASI SST), referenced OSI-208-b, is a full resolution skin SST product based on Metop IASI data, in satellite projection from aresolution of 12km at nadir to 40km.
These products format is compliant with the Data Specification (GDS) version 2 from the Group for HighResolution Sea Surface Temperatures (GHRSST). These products will be referred to as GBL, NAR, MGR and IASI in this text, respectively. They includesurface temperatures over selected lakes. They are derived using the standard SST algorithms with nocommitment on the accuracy and validation.
Name Coverage Satelite Reso-lution
Generationfrequency
Formats Timeli-ness
Volume perunit : NetCDF
GBLSST
Global Metop 0.05° 2 per day NetCDF4 L3CGRIB2*
6h 40 MB
NARSST
EuropeanSeas
Metop 2 km 2 per day NetCDF4 L3CGRIB2*
6h 20-25 MB
NPP 2 km 2 per day NetCDF4 L3CGRIB2*
6h 20 MB
MGRSST
Global Metop Full res.(1 km)
Every granule NetCDF4 L2P 4h 2-5 MB
IASISST
Global Metop 12 to 40km
Every granule NetCDF4 L2P 4h 130 KB
* only until 12/01/2017
Table 1: Characteristics of the OSI SAF SST products
L2P or L3C are in the NetCDF4 with internal compression format. In L2P and L3C, “2” refers toproducts in satellite projection and “3” to gridded products.Products in NetCDF4 are compliant with the GHRSST recommendations GDS v2.0 for IR derivedproducts. As such the normalized Proximity Confidence Value (or quality level) scale fixes 6 values : 0 :unprocessed, 1 : cloudy , 2: bad, 3: suspect, 4: acceptable, 5 : excellent. Those values are goodpredictors of the errors. It is recommended not to use the confidence value 2 for quantitative use.Usable data are those with confidence values 3, 4 and 5.
LML LEO SST PUM28/06/2018 Version 3.3 5/27
1.4. Glossary
Auxiliary data Dynamic data that are used in the preparation of GHRSST L2P or L3C dataproducts including wind speed, surface solar irradiance, aerosol optical depth andsea ice.
AVHRR Advanced Very High Resolution RadiometerAVH1B, AVH1C Level-1 formats for AVHRR data. In AVH1B, calibration coefficients are included,
and in AVH1C calibration coefficients are applied to provide reflectances andbrightness temperatures
BT Brightness temperatureCMS Centre de Météorologie Spatiale (Météo-France)DMI Danish meteorological InstituteECMWF European Centre for Medium-range Weather ForecastingGDS GHRSST Data SpecificationGEO Geostationary Earth OrbitGHRSST Group for High Resolution Sea Surface TemperatureGBL GlobalGOES USA Geostationary Operational Environmental SatelliteGRIB GRIdded Binary formatGTS Global Transmission SystemIASI Infrared Atmospheric Sounding InterferometerIfremer Institut français de recherche pour l'exploitation de la mer : French Research
Institute for Exploitation of the SeaIR Infra-RedLEO Low Earth OrbiterL1B Levels from 0 to 4 have been defined by the remote sensing community to
describe the processing level of products. Level 0 represents raw data, while Level4 data have had the greatest amount of processing applied. Level 1B areunprocessed instrument data alongside ancillary information (Level 1A data) thathave been processed to sensor units.
L1C L1B + cloud maskL2 Level 2 products are retrieved environmental variables at the same resolution and
location as the level 1 source data.L2P Level 2 Pre-processed : On top of levels from L0 to L4 defined by the remote
sensing community to describe the processing level of products, the SSTcommunity has developed a set of SST definitions in the context of the GHRSST.L2P products are satellite SST observations together with a measure of uncertaintyfor each observation in a common GHRSST netCDF format. Auxiliary fields arealso provided for each pixel as dynamic flags to filter and help interpret the SSTdata.This family of data products provides the highest quality data obtained from asingle sensor for a given processing window. In satellite projection.
L2Pcore Level 2 Pre-processed Core: L2Pcore is defined like L2P but only with 6 mandatoryfields that form the core data content of a GHRSST L2P data file.
L3C Level 3 Collated : Gridding a single L2P file produces an "uncollated" L3 file (L3U).Multiple L2P files are gridded to produce either a "collated" L3 file (L3C) from asingle sensor or a "super-collated" L3 file from multiple sensors (L3S).L3C products are gridded and resulting from compositing several orbits or slotsfrom a single sensor.
MDS Match up datasetMET Norway Norwegian Meteorological InstituteMF Météo FranceMGR MetagranuleMSG Meteosat Second Generation
LML LEO SST PUM28/06/2018 Version 3.3 6/27
NAR North Atlantic RegionalNetCDF Network Common Data FormNOAA National Ocean and Atmosphere AdministrationSNPP or NPP Suomi National Polar-orbiting PartnershipNWP Numerical Weather PredictionReference data Pseudo static data and analysis products that are used by the GHRSST-PP (e.g.,
climatology maps, previous SST analysis (T-1))SDI Saharan Dust IndexSEVIRI Spinning Enhanced Visible and Infrared ImagerSSI Surface Solar IrradianceSSES Single Sensor Error StatisticsSST Sea Surface TemperatureVIIRS Visible Infrared Imaging Radiometer SuiteXML Extensible Mark-up Language
1.5. Reference and applicable documents
1.5.1. Reference documents
[RD.1] OSI SAFValidation report for OSI SAF Metop/AVHRR SSTSAF/OSI/CDOP2/M-F/SCI/TEC/234, http://osi-saf.eumetsat.int
[RD.2] OSI SAFAlgorithms Theoretical Basis Document for the Low Earth Orbiter Sea Surface Temperature Processing SAF/OSI/CDOP3/MF/SCI/MA/216, http://osi-saf.eumetsat.int
1.5.2. Applicable documents
[AD.1] GHRSST Data Processing Specification 2 release 5 (GDS_2.0r5)SAF/OSI/CDOP3/MF/MGT/PL/003, http://osi-saf.eumetsat.int
[AD.2] EUMETSATIASI Level 2 product guideEUM/OPS-EPS/MAN/04/0033, http://www.eumetsat.int/
[AD.3] EUMETSATIASI Level 2 Product Generation SpecificationEPS.SYS.SPE.990013, http://www.eumetsat.int/
[AD.4] EUMETSATSingle Sensor Error Statistic Scheme for IASI Level 2 Sea Surface TemperatureEUM/MET/DOC/11/0142, http://www.eumetsat.int/
[AD.5] OSI SAFProduct Requirement Document (PRD)SAF/OSI/CDOP2/M-F/MGT/PL/2-001, http://osi-saf.eumetsat.int
[AD.6] OSI SAFService Specification Document (SeSp)SAF/OSI/CDOP3/MF/MGT/PL/003, http://osi-saf.eumetsat.int
LML LEO SST PUM28/06/2018 Version 3.3 7/27
2. Metop/AVHRR and SNPP/VIIRS
This section presents a brief summary of the main features of the processing of the data.
2.1. Overview of the processing chain and methods
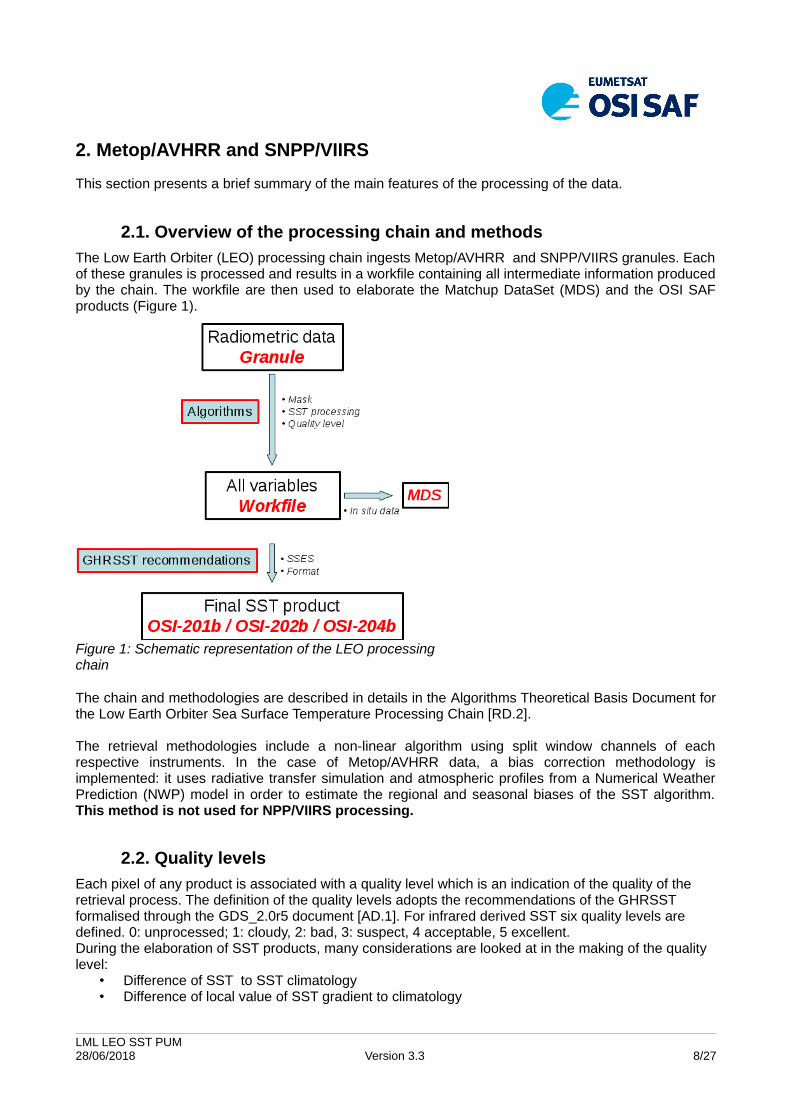
The Low Earth Orbiter (LEO) processing chain ingests Metop/AVHRR and SNPP/VIIRS granules. Eachof these granules is processed and results in a workfile containing all intermediate information producedby the chain. The workfile are then used to elaborate the Matchup DataSet (MDS) and the OSI SAFproducts (Figure 1).
Figure 1: Schematic representation of the LEO processing chain
The chain and methodologies are described in details in the Algorithms Theoretical Basis Document forthe Low Earth Orbiter Sea Surface Temperature Processing Chain [RD.2].
The retrieval methodologies include a non-linear algorithm using split window channels of eachrespective instruments. In the case of Metop/AVHRR data, a bias correction methodology isimplemented: it uses radiative transfer simulation and atmospheric profiles from a Numerical WeatherPrediction (NWP) model in order to estimate the regional and seasonal biases of the SST algorithm.This method is not used for NPP/VIIRS processing.
2.2. Quality levels
Each pixel of any product is associated with a quality level which is an indication of the quality of the retrieval process. The definition of the quality levels adopts the recommendations of the GHRSST formalised through the GDS_2.0r5 document [AD.1]. For infrared derived SST six quality levels are defined. 0: unprocessed; 1: cloudy, 2: bad, 3: suspect, 4 acceptable, 5 excellent.During the elaboration of SST products, many considerations are looked at in the making of the quality level:
• Difference of SST to SST climatology• Difference of local value of SST gradient to climatology
LML LEO SST PUM28/06/2018 Version 3.3 8/27
• Distance to cloud• Presence of dust aerosols• Risk of having sea ice• Satellite zenith angle• Value of the algorithm correction
Each of these considerations is synthesized into an indicator which is tested against a threshold for the elaboration of the quality level. If every test is passed successfully the quality level will be set to the highest value. For more details about the test indicators and quality levels, see [RD.2].
The most common source of degraded quality level is undetected clouds. Quality level 2 certainly contain cloudy pixels; quality level 3 may contain cloudy pixels whereas quality levels 4 and 5 are unlikely to contain remaining clouds.
Important notice:It is very important to filter the data according to the user objectives. For instance, if a user wants to compare different sources of data (in situ, climatologies, other products,…), it is recommended to only select quality level greater or equal to 2. On the other hand quality level 2 to 5 may be used for qualitative purposes such as visually detecting surface structure (thermal fronts, eddies,…).
2.3. Elements of validation
A detailed validation is presented in the Validation report for OSI SAF Metop/AVHRR SST [RD.2]. Only the global statics of the comparison of AVHRR SST against drifting buoys measurements for a limited period of time are presented in table 2. Results are presented per quality levels.
Day NightQuality level
number ofcases
Bias (K) standard deviation (K)
number of cases
bias (K) standard deviation (K)
5 13717 -0.04 0.39 15407 -0.01 0.324 16817 -0.10 0.50 17952 -0.10 0.463 40433 -0.26 0.59 26637 -0.41 0.602 46722 -2.01 2.04 63958 -3.37 2.11
Table 2: Global statistics of the comparison of AVHRR SST against drifting buoys measurements for theperiod 19/04/2015 – 30/10/2015
LML LEO SST PUM28/06/2018 Version 3.3 9/27
3. Metop/IASI
This section presents the physical and statistical basis for the retrieval of Sea Surface Temperature(SST) from the Infrared Atmospheric Sounding Interferometer (IASI) on the Metop satellites, referencingapplicable documents where appropriate. The IASI SST L2P is produced by the OSI SAF to becompliant with the specification from the Group for High Resolution Sea Surface Temperatures(GHRSST) [AD-1] based upon skin sea surface temperatures derived from IASI by EUMETSAT centralfacilities. These skin SSTs are produced from the EUMETSAT IASI L2 Product Processing Facility(PPF) and stored at EUMETSAT as IASI L2Pcore (reduced GHRSST format). Since the algorithmdevelopment is performed at EUMETSAT, this section references the algorithm description documentsavailable from EUMETSAT, and gives an overview of the additions to the product given by the OSI SAF.The applicable documents are listed in section 1.4 of this Product User Manual.
3.1. Overview and background
Skin sea surface temperatures from IASI have been produced at EUMETSAT in GHRSST DataSpecification 2.0 [AD-1] L2Pcore format since March 2011. The SSTs are the same as those availablesince April 2008 from the IASI L2 Product Processing Facility (PPF) at EUMETSAT [AD-2]. The IASIL2Pcore SSTs products contain skin SSTs, Sensor Specific Error Statistics [AD-4], quality levels, flagsand collocated model surface winds. These IASI L2Pcore SSTs are augmented by the OSI SAF toproduce full GHRSST-compliant L2P files, by the addition of other auxiliary data including sea-ice,aerosol and SST background fields.
Details of the IASI L2Pcore product, used as an input to the OSI SAF production of the full IASI L2P filecan be found in [AD-3] with further details contained in the product guide [AD-2]. Previous validationresults of the IASI skin sea surface temperatures are documented in August et al, 2012 and O’Carroll etal, 2012.
3.2. Algorithm overview
Details on the retrieval for Surface Temperature are given within section 5 of [AD.3].
An essential feature of the GHRSST L2P specification is the Sensor Specific Error Statistic (SSES)field. These are observational error estimates provided at pixel level as a bias and standard deviation,traditionally derived from comparisons with drifting buoys. Each observation is assigned a quality levelfrom 0 to 5, where 0 is missing data, 1 is bad data (such as cloud), 2 is the worst useable data, and 5 isthe best quality. The SSES bias and standard deviation are calculated for each quality level fromanalysing differences between satellite SSTs collocated with drifting buoys in a match-up database.Further details on the methodology and estimation of the SSES for IASI SSTs can be found in [AD.4].
3.3. Algorithm description
The theoretical description of the algorithm can be found in the EUMETSAT document “IASI Level 2Product Generation Specification” [AD.3]. A description of the SSES can be found in the EUMETSATdocument “Single Sensor Error Statistic Scheme for IASI Level 2 Sea Surface Temperatures” [AD.4].
3.4. Constraints, assumptions and limitations
The constraints, assumptions and limitations are included in the EUMETSAT document “IASI Level 2Product Generation Specification” [AD.3] in section 5.
LML LEO SST PUM28/06/2018 Version 3.3 10/27
3.5. Implementation of IASI L2P at the EUMETSAT OSI SAF
Core IASI SST files are produced at the EUMETSAT central facility. They are pulled in near real time toCMS via FTP.
At CMS, they are complemented with the following variables: DT_analysis (source : OSTIA) ; AerosolDynamic Indicator (source : NAAPS Aerosol Optical Depth) ; Sea Ice Fraction (source : OSI SAF).These ancillary data are the nearest in space and time to the input SST pixel among available datasetsat processing time. The maximum time offset between these ancillary data and the SST data are 36 hfor the DT_analysis, 24h for the Aerosol Dynamic Indicator and 72 h for the Sea Ice Fraction. NB : Thewind variable has been already filled up at EUMETSAT central facility.
They are formatted according to GDSV2.0 under product string : « IASI_SST_Metop_B ». This format isNetCDF4 with internal compression.
4. Products description
4.1. Format
All products are GDSv2 revision 5 [AD.1] compliant. This means that the products are delivered inNetCDF format and the following variables are available:
time : reference time of the file lat/lon: latitude/longitude grid in degree North/East or_latitude/or_longitude: Original latitude/longitude of the satellite measurement as provided in
the L2P l2p_mask: describes the land/ice/lake mask satellite_zenith_angle : The satellite zenith angle at the time of observation solar_zenith_angle : The solar zenith angle at the time of observation sea_surface_temperature : SST provided in Kelvin quality_level : pixel-wise quality level ranging from 0 to 5 sses_bias/sses_standard_deviation :estimate of the error characteristics at pixel level, derived
from exploiting the validation results against drifting buoys measurements. dt_analysis : Difference between the delivered SST and the last available OSTIA SST analysis
(previous day). wind_speed : 10 meter wind speed derived from ECMWF forecast sea_ice_fraction : Fractional ice cover from OSTIA analysis aerosol_dynamic_indicator : Information regarding the aerosol loading of the atmosphere. In our
case, it is the SEVIRI derived Saharan Dust Index or aerosol optical depth from NAAPS adi_dtime_from_sst :age of the aerosol information relative to the time of SST observation sources_of_adi :nature of the aerosol dynamic indicator. This information is essential for using
this indicator, since they can be distinct in nature (and units) depending on their origin.
The L2P or L3C format description is provided in appendix A.1.The GRIB format (provided only until 12/01/2017) description is provided in appendix A.2.
The SST match-up data set (containing collocated in-situ and satellite data) are available tointerested users on request.
LML LEO SST PUM28/06/2018 Version 3.3 11/27
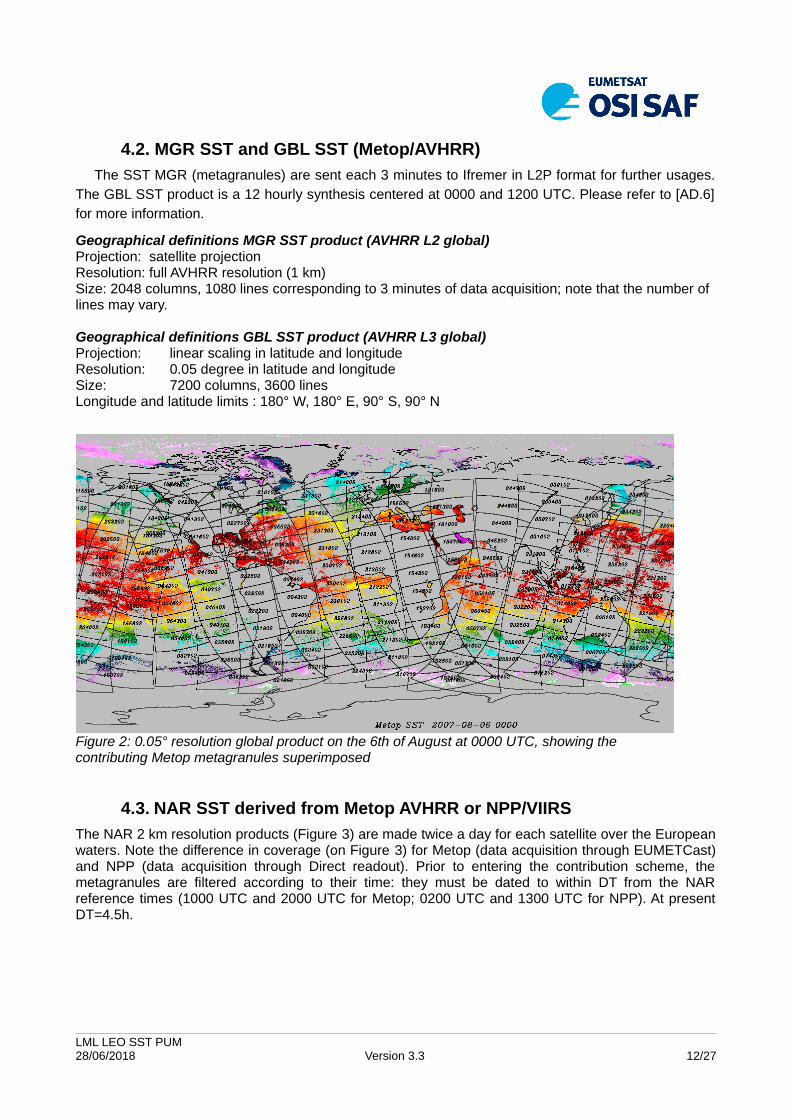
4.2. MGR SST and GBL SST (Metop/AVHRR)
The SST MGR (metagranules) are sent each 3 minutes to Ifremer in L2P format for further usages.The GBL SST product is a 12 hourly synthesis centered at 0000 and 1200 UTC. Please refer to [AD.6]for more information.
Geographical definitions MGR SST product (AVHRR L2 global)Projection: satellite projectionResolution: full AVHRR resolution (1 km)Size: 2048 columns, 1080 lines corresponding to 3 minutes of data acquisition; note that the number of lines may vary.
Geographical definitions GBL SST product (AVHRR L3 global)Projection: linear scaling in latitude and longitudeResolution: 0.05 degree in latitude and longitudeSize: 7200 columns, 3600 linesLongitude and latitude limits : 180° W, 180° E, 90° S, 90° N
Figure 2: 0.05° resolution global product on the 6th of August at 0000 UTC, showing the contributing Metop metagranules superimposed
4.3. NAR SST derived from Metop AVHRR or NPP/VIIRS
The NAR 2 km resolution products (Figure 3) are made twice a day for each satellite over the Europeanwaters. Note the difference in coverage (on Figure 3) for Metop (data acquisition through EUMETCast)and NPP (data acquisition through Direct readout). Prior to entering the contribution scheme, themetagranules are filtered according to their time: they must be dated to within DT from the NARreference times (1000 UTC and 2000 UTC for Metop; 0200 UTC and 1300 UTC for NPP). At presentDT=4.5h.
LML LEO SST PUM28/06/2018 Version 3.3 12/27
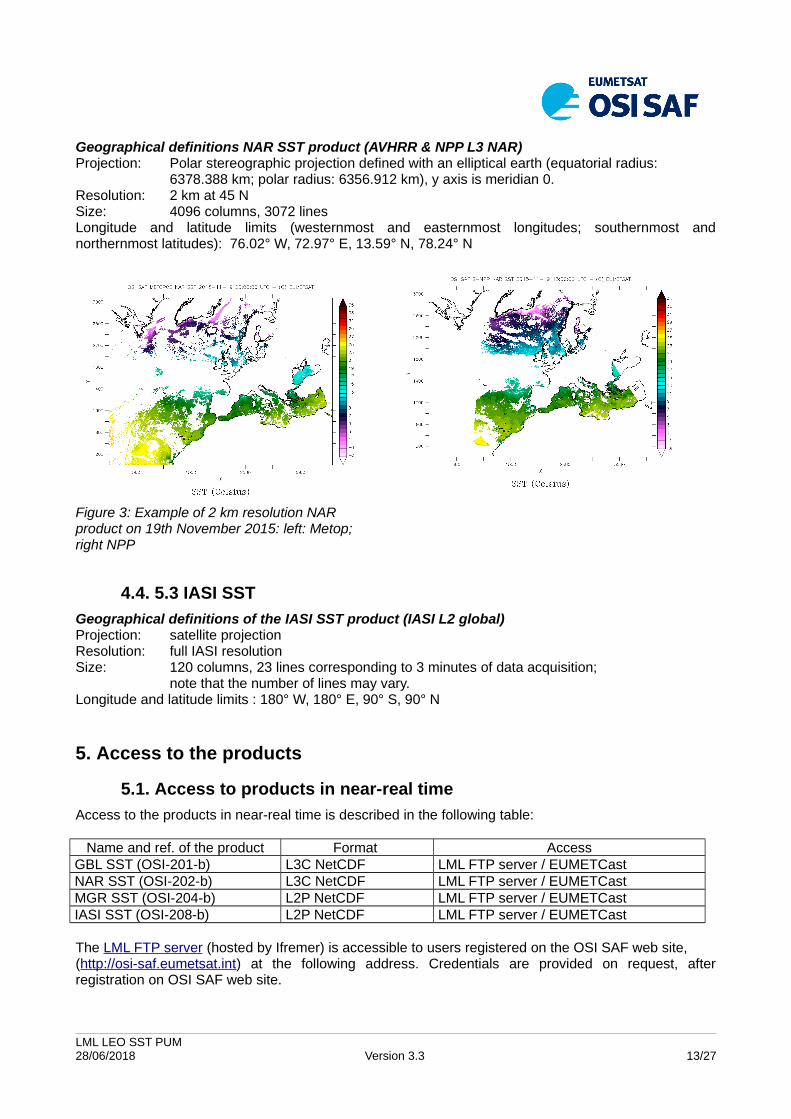
Geographical definitions NAR SST product (AVHRR & NPP L3 NAR)Projection: Polar stereographic projection defined with an elliptical earth (equatorial radius:
6378.388 km; polar radius: 6356.912 km), y axis is meridian 0.Resolution: 2 km at 45 NSize: 4096 columns, 3072 linesLongitude and latitude limits (westernmost and easternmost longitudes; southernmost andnorthernmost latitudes): 76.02° W, 72.97° E, 13.59° N, 78.24° N
Figure 3: Example of 2 km resolution NAR product on 19th November 2015: left: Metop; right NPP
4.4. 5.3 IASI SST
Geographical definitions of the IASI SST product (IASI L2 global)Projection: satellite projectionResolution: full IASI resolutionSize: 120 columns, 23 lines corresponding to 3 minutes of data acquisition;
note that the number of lines may vary.Longitude and latitude limits : 180° W, 180° E, 90° S, 90° N
5. Access to the products
5.1. Access to products in near-real time
Access to the products in near-real time is described in the following table:
Name and ref. of the product Format AccessGBL SST (OSI-201-b) L3C NetCDF LML FTP server / EUMETCastNAR SST (OSI-202-b) L3C NetCDF LML FTP server / EUMETCastMGR SST (OSI-204-b) L2P NetCDF LML FTP server / EUMETCastIASI SST (OSI-208-b) L2P NetCDF LML FTP server / EUMETCast
The LML FTP server (hosted by Ifremer) is accessible to users registered on the OSI SAF web site,(http://osi-saf.eumetsat.int) at the following address. Credentials are provided on request, afterregistration on OSI SAF web site.
LML LEO SST PUM28/06/2018 Version 3.3 13/27
EUMETCast is a multi-service dissemination system based on standard Digital Video Broadcast (DVB)technology. It uses commercial telecommunication geostationary satellites to multi-cast files (data andproducts) to a wide user community. More information on EUMETCast can be found on :http://www.eumetsat.int/website/home/Data/DataDelivery/EUMETCast/index.html
5.2. Access to archived products
Name and ref. of the product Format AccessGBL SST (OSI-201, OSI-201-b) L3C NetCDF LML FTP server / EDCGBL SST (OSI-201, OSI-201-b) GRIB2* EDCNAR SST (OSI-202, OSI-202-b) L3C NetCDF LML FTP server / EDCNAR SST (OSI-202, OSI-202-b) GRIB2* EDCMGR SST (OSI-204, OSI-204-b) L2P NetCDF LML FTP server IASI SST (OSI-208, OSI-208-b) L2P NetCDF LML FTP server / EDC
* only until 12/01/2017
The LML FTP server (hosted by Ifremer) is accessible to users registered on the OSI SAF web site,(http://osi-saf.eumetsat.int) at the following address. Credentials are provided on request, afterregistration on OSI SAF web site.
EDC is EUMETSAT Data Center (sometimes also called UMARF).More information on EDC can be found on :http://www.eumetsat.int/website/home/Data/DataDelivery/EUMETSATDataCentre/index.html
6. References
Andersen, S. and I. Belkin, (2006) Adaptation of global frontal climatologies for use in the OSI SAFglobal SST cloudmasking scheme. DMI technical report 06-14, http://osi-saf.org
Brisson, A., P.Le Borgne and A. Marsouin, (2002) Results of one year of preoperational productionof sea surface temperatures from GOES-8. Journal of Atmospheric and Oceanic Technology, 19 (10),1638-1652.
Casey, K. and P.Cornillon, (1999) A comparison of satellite and in situ-based sea surface temperat-ure climatologies. Journal of Climate, 12, 1848-1863.
Eastwood, S. and S. Andersen, (2007) Masking of Sea Ice for Metop SST retrieval. OSI SAF report,http://saf.met.no/documentation.
François, C., A. Brisson, P. Le Borgne and A. Marsouin, (2002) Definition of a radiosounding data-base for sea surface brightness temperature simulations, Application to sea surface temperature re-trieval algorithm determination. Remote Sensing of Environment, 81, 309-326.
Lavanant, L., (2007) Operational cloud masking for the OSI SAF global Metop SST production, pro-ceedings of the 2007 EUMETSAT conference, Amsterdam, The Netherlands, September 2007.
Lavanant, L., (2012) MAIA version 4 for NPP-VIIRS and NOAA/Metop-AVHRR cloud mask and clas-sification, EUMETSAT/NWPSAF scientific user manual
Le Borgne, P., (2006) Determination of SST algorithms for Metop-2/AVHRR, version 1, http://osi-saf.org
LML LEO SST PUM28/06/2018 Version 3.3 14/27
Le Borgne, P., G. Legendre and A. Marsouin, (2007) Operational SST retrieval from Metop/AVHRR,proceedings of the 2007 EUMETSAT conference, Amsterdam, The Netherlands, September 2007.
Le Borgne, P., G. Legendre, A. Marsouin and S. Péré (2008) Operational SST retrieval fromMetop/AVHRR, Validation Report
Le Borgne, P., G. Legendre, A. Marsouin and S. Péré (2009) Operational SST retrieval from the newNOAA/AVHRR processing chain, Validation Report
Le Borgne, P., G. Legendre, A. Marsouin and S. Péré (2013) Operational SST retrieval fromNPP/VIIRS, Validation Report
Le Borgne, P, S. Péré and H. Roquet, (2013) Night time detection of Saharan dust using infraredwindow channels: Application to NPP/VIIRS, Remote Sensing of Environment, Volume 137, October2013, Pages 264-273.
Merchant, C.J. and P. Le Borgne, (2004) Retrieval of sea surface temperature from space based onmodelling of infrared transfer: Capabilities and limitations, Journal of Atmospheric and Oceanic Techno-logy, 22, 1734-1746.
Merchant, C.J., O. Embury, P. Le Borgne and B. Bellec, (2006) Saharan dust in nighttime thermal im-agery: Detection and reduction of related biases in retrieved sea surface temperature, Remote Sensingof Environment, 104,15-30.
Poulter, D. and S. Eastwood, (2008) Validation of Metop SST products in Arctic waters, OSI-SAF re-port.
Roberts-Jones, J., Fiedler, E. K. and Martin, M., (2012) Daily, “Global, high resolution SST and seaice reanalysis using the OSTIA system”, Journal of Climate, 25, 6215-6232
US NAVY, 2003, Description of NAAPS (Navy Aerosol Analysis and Prediction System) Global Aero-sol Model), http://www.nrlmry.navy.mil/aerosol_web/Docs/globaer_model.html
LML LEO SST PUM28/06/2018 Version 3.3 15/27
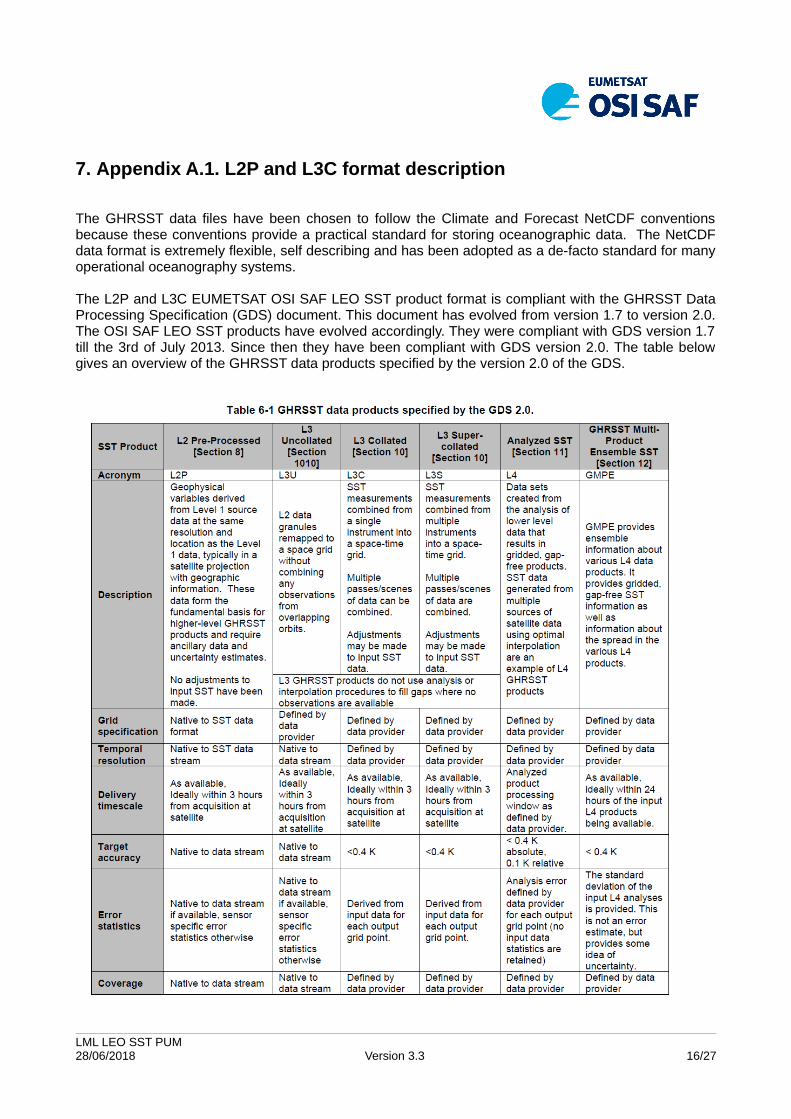
7. Appendix A.1. L2P and L3C format description
The GHRSST data files have been chosen to follow the Climate and Forecast NetCDF conventionsbecause these conventions provide a practical standard for storing oceanographic data. The NetCDFdata format is extremely flexible, self describing and has been adopted as a de-facto standard for manyoperational oceanography systems.
The L2P and L3C EUMETSAT OSI SAF LEO SST product format is compliant with the GHRSST DataProcessing Specification (GDS) document. This document has evolved from version 1.7 to version 2.0.The OSI SAF LEO SST products have evolved accordingly. They were compliant with GDS version 1.7till the 3rd of July 2013. Since then they have been compliant with GDS version 2.0. The table belowgives an overview of the GHRSST data products specified by the version 2.0 of the GDS.
LML LEO SST PUM28/06/2018 Version 3.3 16/27
The corresponding document is available through :https://www.ghrsst.org/documents/q/category/ghrsst-data-processing-specification-gds/operational/
Any future update of the GDS format will be found under this directory.
Users must be aware that GDS version 1.7 compliant data were compressed using bzip2 compression.The GDS version 2.0 products are NetCDF4 classic model files using internal compressionfeature.
LML LEO SST PUM28/06/2018 Version 3.3 17/27
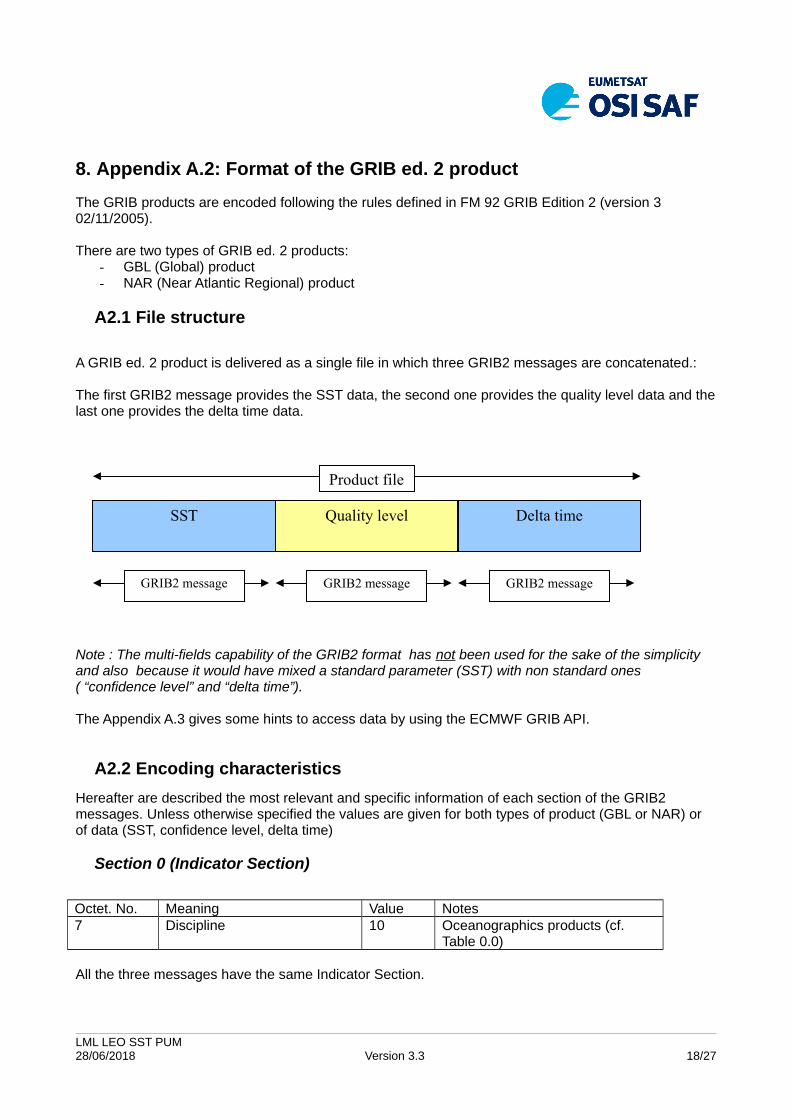
8. Appendix A.2: Format of the GRIB ed. 2 product
The GRIB products are encoded following the rules defined in FM 92 GRIB Edition 2 (version 3 02/11/2005).
There are two types of GRIB ed. 2 products:- GBL (Global) product- NAR (Near Atlantic Regional) product
A2.1 File structure
A GRIB ed. 2 product is delivered as a single file in which three GRIB2 messages are concatenated.:
The first GRIB2 message provides the SST data, the second one provides the quality level data and thelast one provides the delta time data.
Note : The multi-fields capability of the GRIB2 format has not been used for the sake of the simplicity and also because it would have mixed a standard parameter (SST) with non standard ones ( “confidence level” and “delta time”).
The Appendix A.3 gives some hints to access data by using the ECMWF GRIB API.
A2.2 Encoding characteristics
Hereafter are described the most relevant and specific information of each section of the GRIB2 messages. Unless otherwise specified the values are given for both types of product (GBL or NAR) or of data (SST, confidence level, delta time)
Section 0 (Indicator Section)
Octet. No. Meaning Value Notes7 Discipline 10 Oceanographics products (cf.
Table 0.0)
All the three messages have the same Indicator Section.
LML LEO SST PUM28/06/2018 Version 3.3 18/27
SST Quality level Delta time
Product file
GRIB2 message GRIB2 message GRIB2 message

Section 1 (Identification Section)
Octet. No. Meaning Value Notes6-7 Identification of
originating/generating centre211 Lannion (see Common Code Table C-1)
8-9 Identification of originating/generating sub-centre
0
12 Significance of Reference Time
3 Observation time (see Code Table 1.2)
13-19 Reference time of data variable and product specific
Individual pixels time can be derived from reference time by using the Delta Time message data.
For GBL products the reference hour is either 00:00 or 12:00 UTC.
For Metop02 NAR products the reference hour is either 10:00 or 20:00 UTCFor NOAA-19 NAR products the reference hour is either 03:00 or 13:00 UTCFor NPP NAR products the reference hour is either 02:00 or 13:00 UTCIn the past, for NOAA-18 NAR products the reference hour was either 02:00 or 12:00 UTC
All the three messages have the same Identification Section.
Section 2 (Local Use Section)
There is no section 2 in either message.
Section 3 (Grid Identification Section)
The “Grid Definition Template Number” (Octets No. 13-14) depends on the product type :
- for GBL product it is coded 0 : Latitude/longitude (see Code Table 3.1)- for NAR product it is coded 20 : Polar stereographic (see Code Table 3.1)
In both cases data have been organized such as the “scanning mode” flag is 0 (Points of first row scan in the +i direction, points of the first column scan in the –j direction).
For more details, see the “Grid characteristics” paragraph below.
All the three messages have the same Grid Identification Section.
LML LEO SST PUM28/06/2018 Version 3.3 19/27
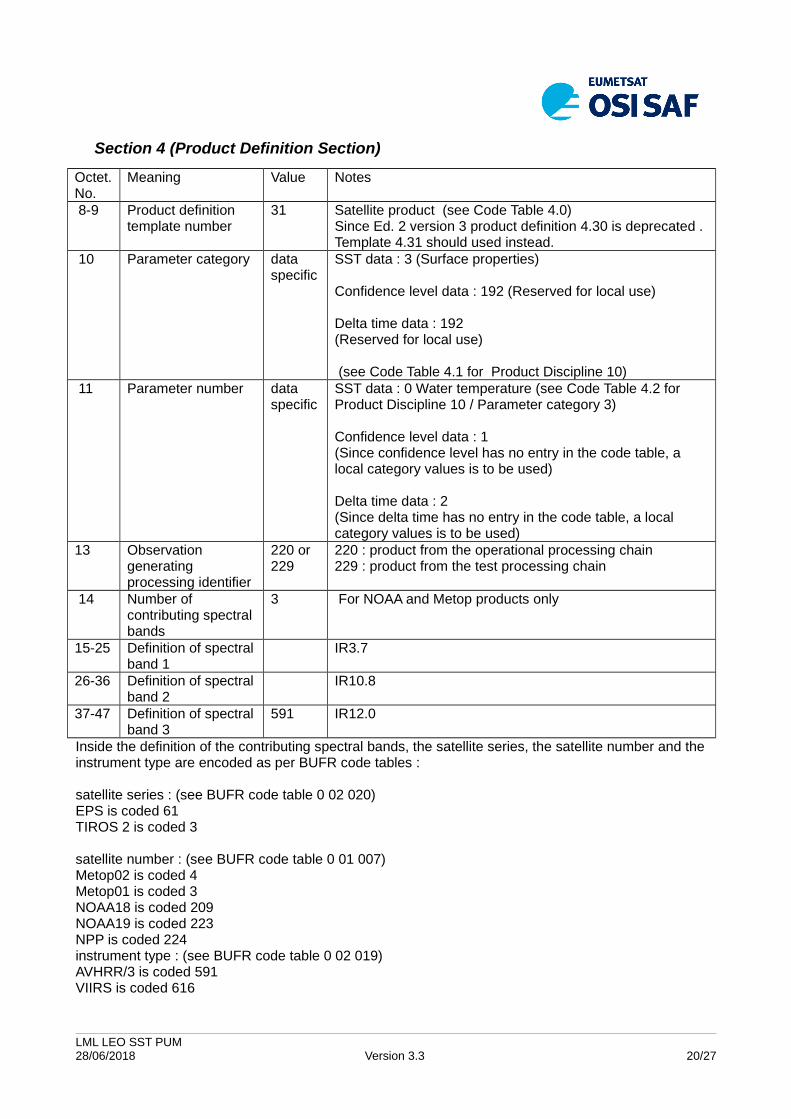
Section 4 (Product Definition Section)
Octet.No.
Meaning Value Notes
8-9 Product definition template number
31 Satellite product (see Code Table 4.0)Since Ed. 2 version 3 product definition 4.30 is deprecated . Template 4.31 should used instead.
10 Parameter category data specific
SST data : 3 (Surface properties)
Confidence level data : 192 (Reserved for local use)
Delta time data : 192(Reserved for local use)
(see Code Table 4.1 for Product Discipline 10) 11 Parameter number data
specificSST data : 0 Water temperature (see Code Table 4.2 for Product Discipline 10 / Parameter category 3)
Confidence level data : 1 (Since confidence level has no entry in the code table, a local category values is to be used)
Delta time data : 2(Since delta time has no entry in the code table, a local category values is to be used)
13 Observation generating processing identifier
220 or 229
220 : product from the operational processing chain229 : product from the test processing chain
14 Number of contributing spectral bands
3 For NOAA and Metop products only
15-25 Definition of spectralband 1
IR3.7
26-36 Definition of spectralband 2
IR10.8
37-47 Definition of spectralband 3
591 IR12.0
Inside the definition of the contributing spectral bands, the satellite series, the satellite number and the instrument type are encoded as per BUFR code tables :
satellite series : (see BUFR code table 0 02 020)EPS is coded 61TIROS 2 is coded 3
satellite number : (see BUFR code table 0 01 007)Metop02 is coded 4Metop01 is coded 3NOAA18 is coded 209NOAA19 is coded 223NPP is coded 224instrument type : (see BUFR code table 0 02 019)AVHRR/3 is coded 591VIIRS is coded 616
LML LEO SST PUM28/06/2018 Version 3.3 20/27

Section 5 (Data Representation Section)
Octet. No. Meaning Value Notes 10-11 Data Representation Template
Number0 Grid point data-simple packing
(see Code Table 5.0)
The product are encoded so that the Decimal scale factor and the Numbers of bits are invariant for a given data type. The following table gives these values for each data type.
Octet No. SST Confidence level Delta time18-19 Decimal scale factor 2 0 020 Number of bits 12 2 10
The reference value (Octet No 12-15) and the Binary scale factor (Octet No 16-17) may vary, though the binary scale factor should be 0 in most cases.
Section 6 (Bit Map Section)
The “Bit-map indicator” (Octet No. 6) is always 0 ( a bit-map applies to this product). All data are missing on land pixels and on the water pixels where SST has not been computed.
All the three messages have the same bit map section.
Section 7 (Data Section)
The section 7 provides the data according to the Data Representation Template number given in octets 10-11 of Section 5.
The following table gives the meanings of the three types of data :
data meaningsSST Water temperature ( in deg. K)Quality level An index value with the following meanings :
2: bad3: suspect4: acceptable5: excellent
(note: unprocessed and masked cases are set as missing values)Delta time Signed delta time (in minutes) from Reference time of Data (given in
Section 1).Individual pixel can be determined as follows :Pixel time = Reference time of Data + Delta time
LML LEO SST PUM28/06/2018 Version 3.3 21/27
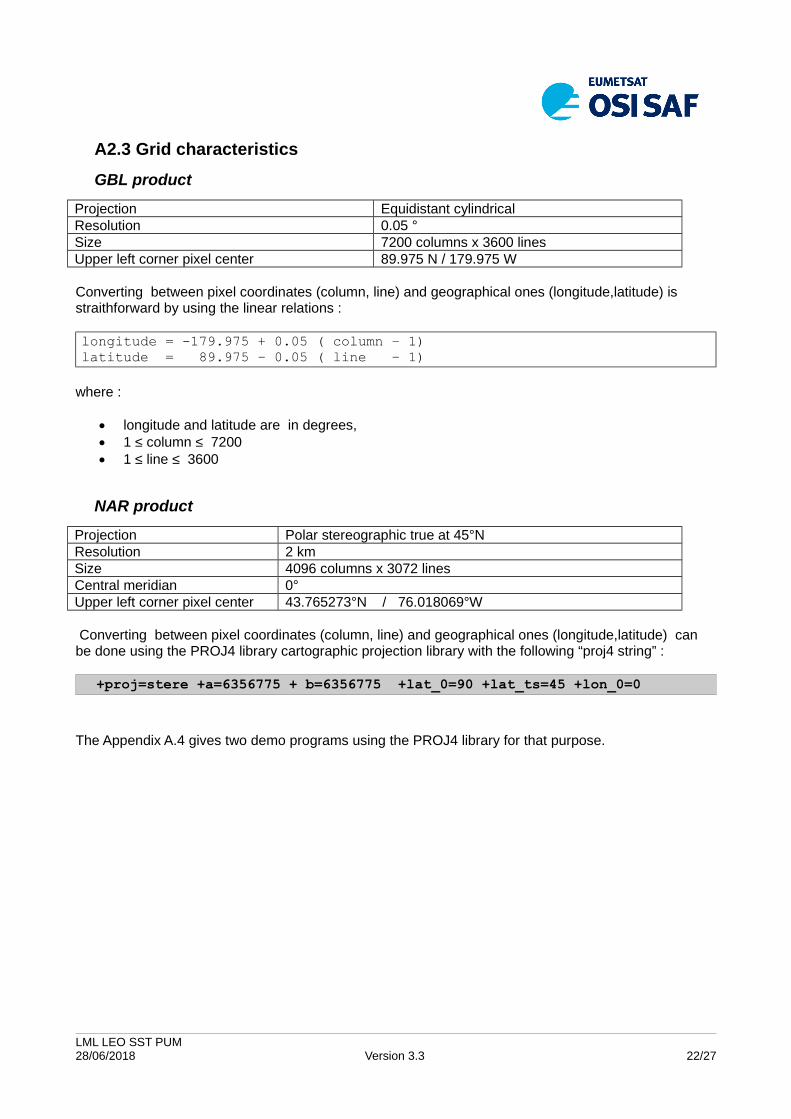
A2.3 Grid characteristics
GBL product
Projection Equidistant cylindrical Resolution 0.05 °Size 7200 columns x 3600 linesUpper left corner pixel center 89.975 N / 179.975 W
Converting between pixel coordinates (column, line) and geographical ones (longitude,latitude) is straithforward by using the linear relations :
longitude = -179.975 + 0.05 ( column – 1)latitude = 89.975 – 0.05 ( line – 1)
where :
longitude and latitude are in degrees, 1 ≤ column ≤ 7200 1 ≤ line ≤ 3600
NAR product
Projection Polar stereographic true at 45°NResolution 2 kmSize 4096 columns x 3072 linesCentral meridian 0°Upper left corner pixel center 43.765273°N / 76.018069°W
Converting between pixel coordinates (column, line) and geographical ones (longitude,latitude) can be done using the PROJ4 library cartographic projection library with the following “proj4 string” :
+proj=stere +a=6356775 + b=6356775 +lat_0=90 +lat_ts=45 +lon_0=0
The Appendix A.4 gives two demo programs using the PROJ4 library for that purpose.
LML LEO SST PUM28/06/2018 Version 3.3 22/27
9. Appendix A.3 : Accessing data by using the ECMWF GRIB API
The ECMWF GRIB API is an application program interface accessible from C and FORTRAN programsdeveloped for encoding and decoding WMO FM-92 GRIB edition 1 and edition 2 messages. A usefulset of command line tools is also provided to give quick access to grib messages.
For more details see :
https://software.ecmwf.int/wiki/display/GRIB/Home
The following examples have been tested with the 1.3.0 version of the GRIB API.
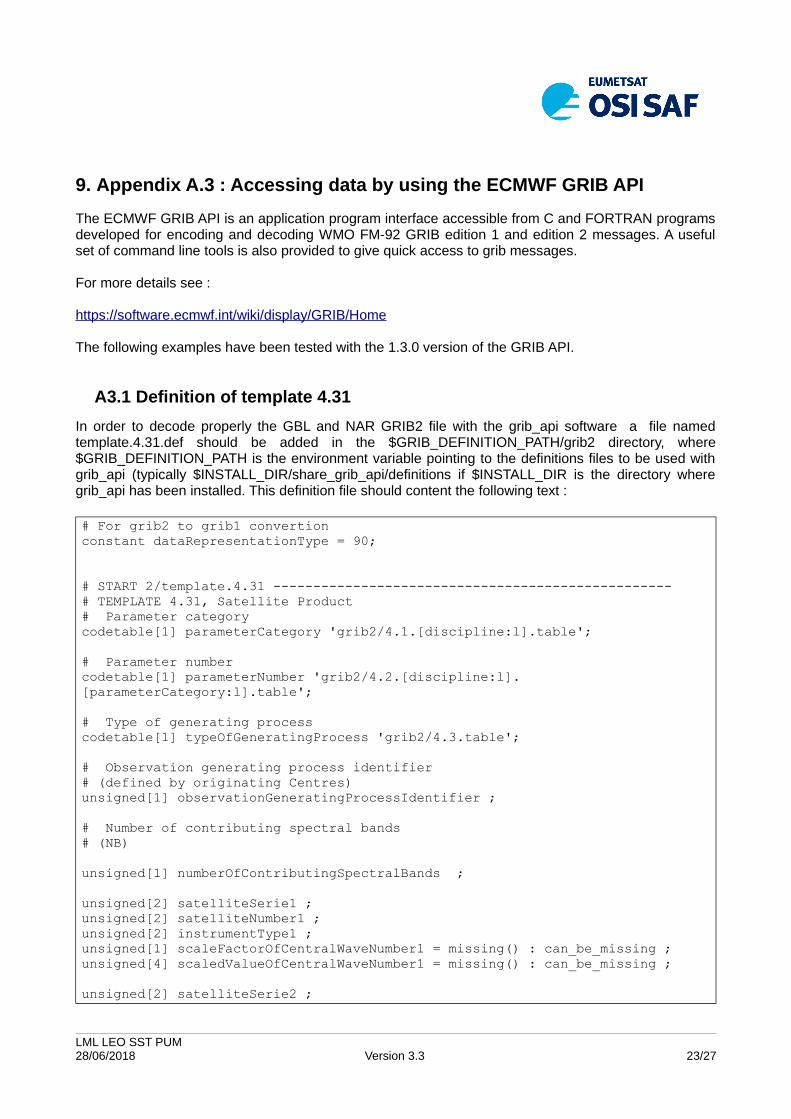
A3.1 Definition of template 4.31
In order to decode properly the GBL and NAR GRIB2 file with the grib_api software a file namedtemplate.4.31.def should be added in the $GRIB_DEFINITION_PATH/grib2 directory, where$GRIB_DEFINITION_PATH is the environment variable pointing to the definitions files to be used withgrib_api (typically $INSTALL_DIR/share_grib_api/definitions if $INSTALL_DIR is the directory wheregrib_api has been installed. This definition file should content the following text :
# For grib2 to grib1 convertionconstant dataRepresentationType = 90;
# START 2/template.4.31 --------------------------------------------------# TEMPLATE 4.31, Satellite Product# Parameter categorycodetable[1] parameterCategory 'grib2/4.1.[discipline:l].table';
# Parameter numbercodetable[1] parameterNumber 'grib2/4.2.[discipline:l].[parameterCategory:l].table';
# Type of generating processcodetable[1] typeOfGeneratingProcess 'grib2/4.3.table';
# Observation generating process identifier# (defined by originating Centres) unsigned[1] observationGeneratingProcessIdentifier ;
# Number of contributing spectral bands# (NB) unsigned[1] numberOfContributingSpectralBands ;
unsigned[2] satelliteSerie1 ;unsigned[2] satelliteNumber1 ; unsigned[2] instrumentType1 ; unsigned[1] scaleFactorOfCentralWaveNumber1 = missing() : can_be_missing ;unsigned[4] scaledValueOfCentralWaveNumber1 = missing() : can_be_missing ;
unsigned[2] satelliteSerie2 ;
LML LEO SST PUM28/06/2018 Version 3.3 23/27
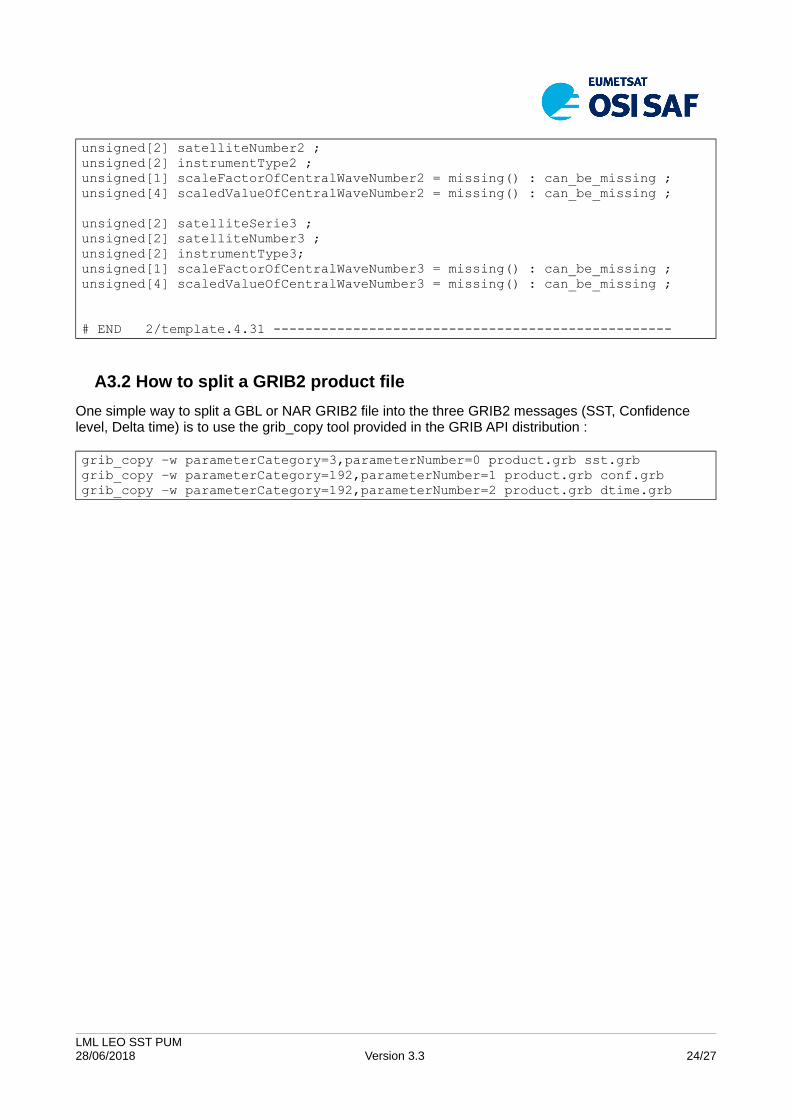
unsigned[2] satelliteNumber2 ; unsigned[2] instrumentType2 ; unsigned[1] scaleFactorOfCentralWaveNumber2 = missing() : can_be_missing ;unsigned[4] scaledValueOfCentralWaveNumber2 = missing() : can_be_missing ;
unsigned[2] satelliteSerie3 ;unsigned[2] satelliteNumber3 ; unsigned[2] instrumentType3; unsigned[1] scaleFactorOfCentralWaveNumber3 = missing() : can_be_missing ;unsigned[4] scaledValueOfCentralWaveNumber3 = missing() : can_be_missing ;
# END 2/template.4.31 --------------------------------------------------
A3.2 How to split a GRIB2 product file
One simple way to split a GBL or NAR GRIB2 file into the three GRIB2 messages (SST, Confidence level, Delta time) is to use the grib_copy tool provided in the GRIB API distribution :
grib_copy –w parameterCategory=3,parameterNumber=0 product.grb sst.grbgrib_copy –w parameterCategory=192,parameterNumber=1 product.grb conf.grbgrib_copy –w parameterCategory=192,parameterNumber=2 product.grb dtime.grb
LML LEO SST PUM28/06/2018 Version 3.3 24/27
10. Appendix A.4 : Locating the NAR data by using PROJ4 library
PROJ4 is a cartographic library accessible from C.
For more details see :
http://proj.maptools.org/
The following examples have been tested with the 4.5.0 version of the PROJ4 library. As they are demoprograms no check of the return values is performed.
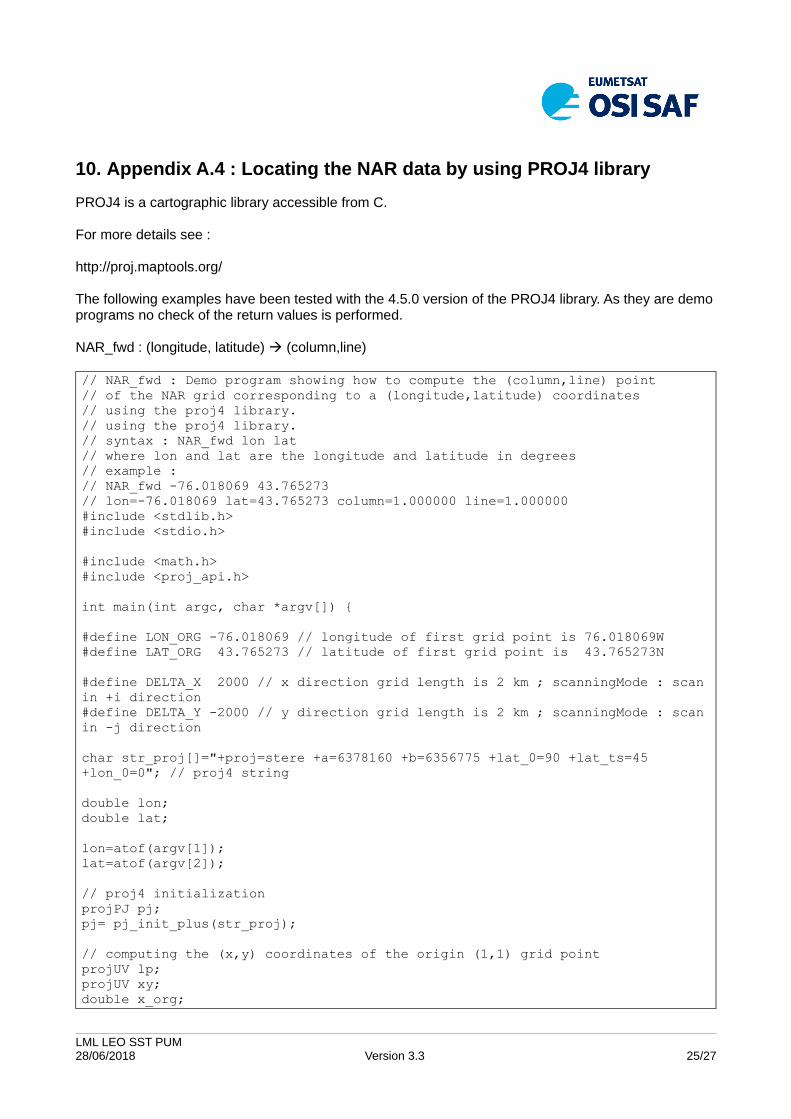
NAR_fwd : (longitude, latitude) (column,line)
// NAR_fwd : Demo program showing how to compute the (column,line) point // of the NAR grid corresponding to a (longitude,latitude) coordinates // using the proj4 library.// using the proj4 library.// syntax : NAR_fwd lon lat // where lon and lat are the longitude and latitude in degrees // example :// NAR_fwd -76.018069 43.765273// lon=-76.018069 lat=43.765273 column=1.000000 line=1.000000#include <stdlib.h>#include <stdio.h>
#include <math.h>#include <proj_api.h>
int main(int argc, char *argv[]) {
#define LON_ORG -76.018069 // longitude of first grid point is 76.018069W #define LAT_ORG 43.765273 // latitude of first grid point is 43.765273N
#define DELTA_X 2000 // x direction grid length is 2 km ; scanningMode : scanin +i direction#define DELTA_Y -2000 // y direction grid length is 2 km ; scanningMode : scanin -j direction
char str_proj[]="+proj=stere +a=6378160 +b=6356775 +lat_0=90 +lat_ts=45 +lon_0=0"; // proj4 string
double lon; double lat;
lon=atof(argv[1]);lat=atof(argv[2]);
// proj4 initializationprojPJ pj; pj= pj_init_plus(str_proj);
// computing the (x,y) coordinates of the origin (1,1) grid point projUV lp;projUV xy;double x_org;
LML LEO SST PUM28/06/2018 Version 3.3 25/27
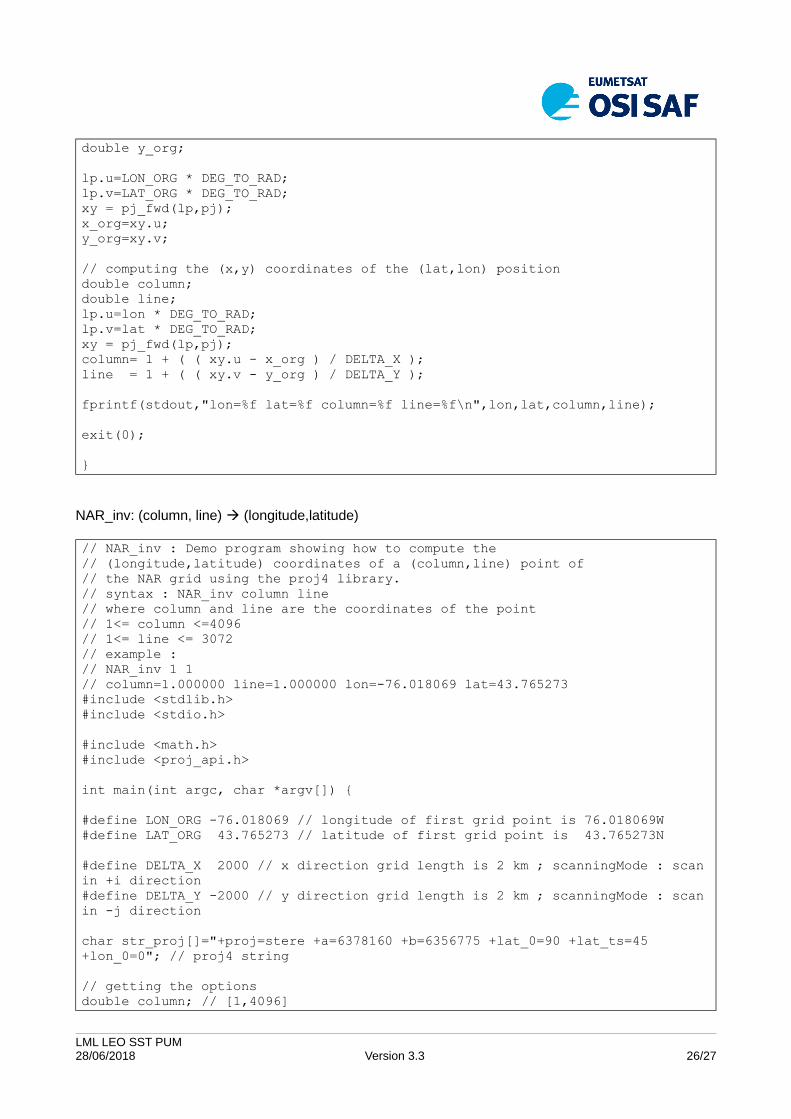
double y_org;
lp.u=LON_ORG * DEG_TO_RAD;lp.v=LAT_ORG * DEG_TO_RAD;xy = pj_fwd(lp,pj);x_org=xy.u;y_org=xy.v;
// computing the (x,y) coordinates of the (lat,lon) position double column;double line;lp.u=lon * DEG_TO_RAD;lp.v=lat * DEG_TO_RAD;xy = pj_fwd(lp,pj);column= 1 + ( ( xy.u - x_org ) / DELTA_X );line = 1 + ( ( xy.v - y_org ) / DELTA_Y );
fprintf(stdout,"lon=%f lat=%f column=%f line=%f\n",lon,lat,column,line);
exit(0);
}
NAR_inv: (column, line) (longitude,latitude)
// NAR_inv : Demo program showing how to compute the // (longitude,latitude) coordinates of a (column,line) point of // the NAR grid using the proj4 library.// syntax : NAR_inv column line// where column and line are the coordinates of the point// 1<= column <=4096// 1<= line <= 3072// example :// NAR_inv 1 1// column=1.000000 line=1.000000 lon=-76.018069 lat=43.765273#include <stdlib.h>#include <stdio.h>
#include <math.h>#include <proj_api.h>
int main(int argc, char *argv[]) {
#define LON_ORG -76.018069 // longitude of first grid point is 76.018069W #define LAT_ORG 43.765273 // latitude of first grid point is 43.765273N
#define DELTA_X 2000 // x direction grid length is 2 km ; scanningMode : scanin +i direction#define DELTA_Y -2000 // y direction grid length is 2 km ; scanningMode : scanin -j direction
char str_proj[]="+proj=stere +a=6378160 +b=6356775 +lat_0=90 +lat_ts=45 +lon_0=0"; // proj4 string
// getting the optionsdouble column; // [1,4096]
LML LEO SST PUM28/06/2018 Version 3.3 26/27
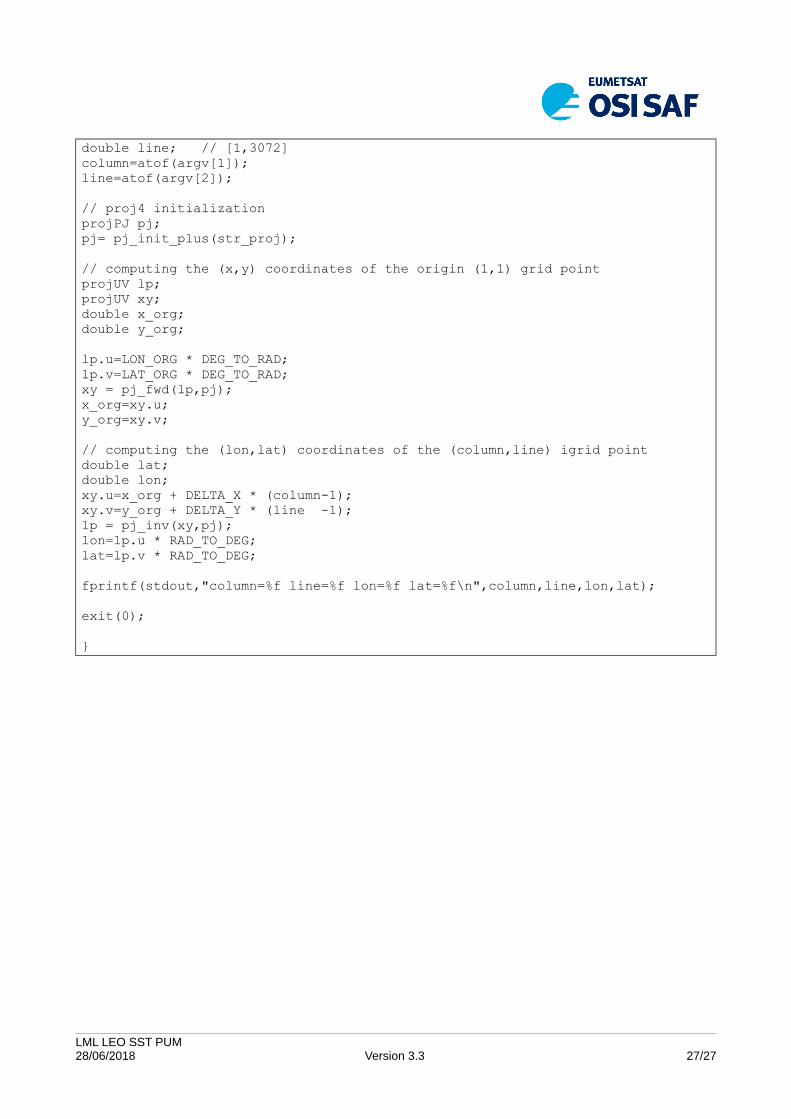
double line; // [1,3072]column=atof(argv[1]);line=atof(argv[2]);
// proj4 initializationprojPJ pj; pj= pj_init_plus(str_proj);
// computing the (x,y) coordinates of the origin (1,1) grid point projUV lp;projUV xy;double x_org;double y_org;
lp.u=LON_ORG * DEG_TO_RAD;lp.v=LAT_ORG * DEG_TO_RAD;xy = pj_fwd(lp,pj);x_org=xy.u;y_org=xy.v;
// computing the (lon,lat) coordinates of the (column,line) igrid pointdouble lat;double lon;xy.u=x_org + DELTA_X * (column-1);xy.v=y_org + DELTA_Y * (line -1);lp = pj_inv(xy,pj);lon=lp.u * RAD_TO_DEG;lat=lp.v * RAD_TO_DEG;
fprintf(stdout,"column=%f line=%f lon=%f lat=%f\n",column,line,lon,lat);
exit(0);
}
LML LEO SST PUM28/06/2018 Version 3.3 27/27