Embed Size (px)
Citation preview
FHWA-SA-09-020
U.S. Department of Transportation
Federal Highway Administration
Low-Cost Safety Enhancements for Stop-Controlled and Signalized Intersections

2
Table of Contents
1. Introduction ........................................................................................................................................................... 4
2. Stop-Controlled Intersections ............................................................................................................................ 5
Signing and Pavement Marking Enhancements ........................................................................................................................................5Crash Problem ....................................................................................................................................................................................................5Countermeasures .............................................................................................................................................................................................5Countermeasure Crash Reduction Factors, Threshold Levels, Additional Implementation Factors, and Estimated Cost Ranges .......................................................................................................................................................................6
J-Turn Treatments at Stop-Controlled Intersections on Multi-Lane Divided Arterial Highways .................................8Crash Problem ....................................................................................................................................................................................................8Countermeasures .............................................................................................................................................................................................8Countermeasure Crash Reduction Factors, Threshold Levels, Additional Implementation Factors, and Estimated Cost Ranges .......................................................................................................................................................................8
3. Signalized Intersections ....................................................................................................................................... 9
Traffic Signal, Signing, and Pavement Marking Countermeasures at Signalized Intersections .....................................9Crash Problem ....................................................................................................................................................................................................9Countermeasures .............................................................................................................................................................................................9Countermeasure Crash Reduction Factors, Threshold Levels, Additional Implementation Factors, and Estimated Cost Ranges ....................................................................................................................................................................10
4. Lighting at Unlit or Poorly Lit Intersections ................................................................................................... 12
Crash Problem .................................................................................................................................................................................................12Countermeasures ..........................................................................................................................................................................................12Countermeasure Crash Reduction Factors, Threshold Levels, Additional Implementation Factors, and Estimated Cost Ranges ....................................................................................................................................................................12
5. High-Frictions Surfaces ...................................................................................................................................... 13
Crash Problem .................................................................................................................................................................................................13Countermeasures ..........................................................................................................................................................................................13Countermeasure Crash Reduction Factors, Threshold Levels, Additional Implementation Factors, and Estimated Cost Ranges ....................................................................................................................................................................13
6. Speed Reduction Countermeasures on High Speed Approaches to Intersections ................................ 14
Crash Problem .................................................................................................................................................................................................14Countermeasures ..........................................................................................................................................................................................14Countermeasure Crash Reduction Factors, Threshold Levels, Additional Implementation Factors, and Estimated Cost Ranges ....................................................................................................................................................................15
7. Multiple Countermeasures Applied at the Same Intersection ................................................................... 16
8. The Systematic Approach—Concept .............................................................................................................. 17
9. Systematic Deployment—The Process ........................................................................................................... 19
10. Summary ............................................................................................................................................................... 19

3
List of Tables
Table 1: Crash Reduction Factors, Typical Crash Thresholds, Additional Application Factors, and Estimated Implementation Cost Ranges for Countermeasures at Stop-Controlled Intersections .............................7
Table 2: Crash Reduction Factors, Typical Crash Thresholds, Additional Application Factors, and Estimated Implementation Cost Ranges for Countermeasures at J-Turn Stop-Controlled Intersections .................8
Table 3: Crash Reduction Factors, Typical Crash Thresholds, Additional Application Factors, and Estimated Implementation Cost Ranges for Countermeasures at Signalized Intersections .....................................10
Table 4: Crash Reduction Factors, Typical Crash Thresholds, Additional Application Factors, and Estimated Implementation Cost Ranges for Lighting Countermeasures at Unlit or Poorly Lit Intersections ........12
Table 5: Crash Reduction Factors, Typical Crash Thresholds, Additional Application Factors, and Estimated Implementation Cost Ranges for Skid Resistance Countermeasures at Intersections with High Rates of Low-Friction Crashes ...................................................................................................................13
Table 6: Crash Reduction Factors, Typical Crash Thresholds, Additional Application Factors, and Estimated Implementation Cost Ranges for Countermeasures at Stop-Controlled Intersections with High-Speed Approaches ......................................................................................................................................15
Table 7: Example of a Typical State Distribution of Crashes at Rural State Stop-Controlled Intersections (5 Years Crash Data) ...............................................................................................................................................18
Table 8: Example of Typical State Crash Severity for Various Intersection Types .....................................................18
List of Figures
Figure 1: Examples of Basic Low-Cost Countermeasures for Stop-Controlled Intersections – Double Up Oversize Warning Signs, Double STOP Signs, Traffic Island on Stop Approach (if feasible), Street Name Signs, Stop Bars, and Double Warning Arrow at the Stem of T-Intersections ......................6
Figure 2: Turn Restrictions at Multi-Lane Highways.. ........................................................................................................8
Figure 3: Example Intersection with Basic 12 inch Lens, Back Plates and a Signal Head per Lane ..........................9
Figure 4: New Design for Intersection Lighting Layout ..................................................................................................12
Figure 5: New Design for Wide Roadway Intersection Lighting Layout. .....................................................................12
Figure 6: Lane Narrowing Using Rumble Strips................................................................................................................14
Figure 7: Intersection Categories for Low-Cost Countermeasure Consideration. .....................................................17
4
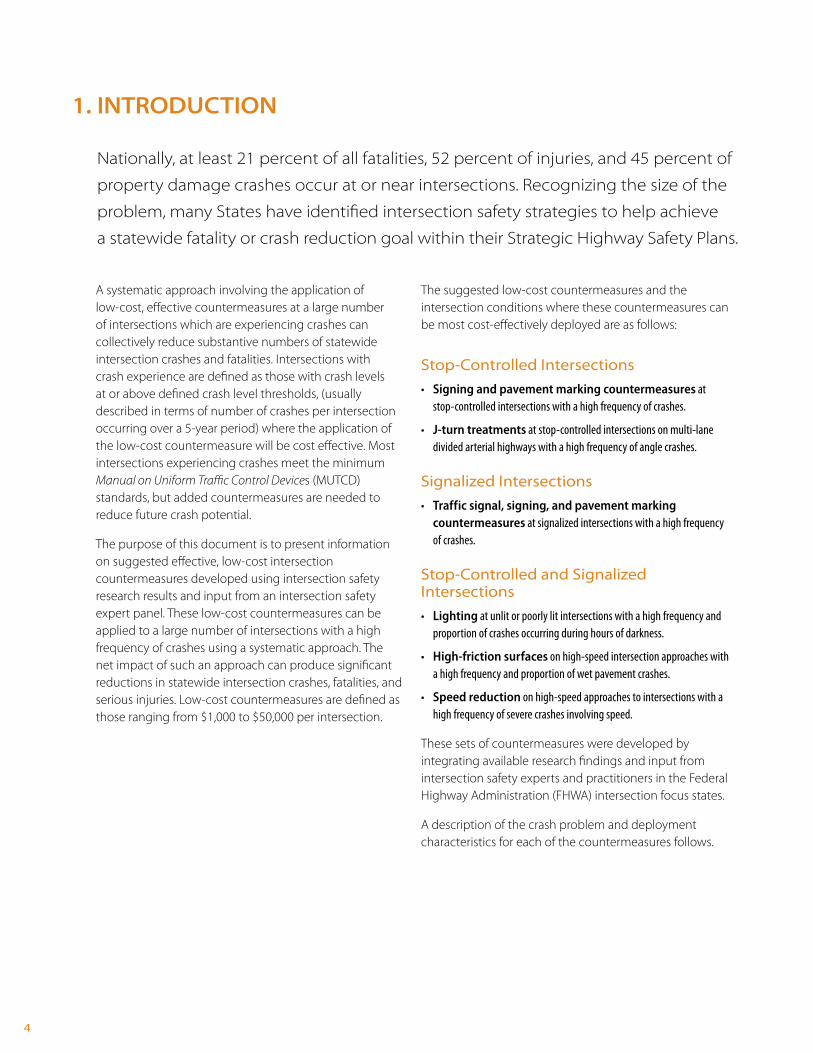
1. INTRODUCTION
Nationally, at least 21 percent of all fatalities, 52 percent of injuries, and 45 percent of
property damage crashes occur at or near intersections. Recognizing the size of the
problem, many States have identified intersection safety strategies to help achieve
a statewide fatality or crash reduction goal within their Strategic Highway Safety Plans.
A systematic approach involving the application of low-cost, effective countermeasures at a large number of intersections which are experiencing crashes can collectively reduce substantive numbers of statewide intersection crashes and fatalities. Intersections with crash experience are defined as those with crash levels at or above defined crash level thresholds, (usually described in terms of number of crashes per intersection occurring over a 5-year period) where the application of the low-cost countermeasure will be cost effective. Most intersections experiencing crashes meet the minimum Manual on Uniform Traffic Control Devices (MUTCD) standards, but added countermeasures are needed to reduce future crash potential.
The purpose of this document is to present information on suggested effective, low-cost intersection countermeasures developed using intersection safety research results and input from an intersection safety expert panel. These low-cost countermeasures can be applied to a large number of intersections with a high frequency of crashes using a systematic approach. The net impact of such an approach can produce significant reductions in statewide intersection crashes, fatalities, and serious injuries. Low-cost countermeasures are defined as those ranging from $1,000 to $50,000 per intersection.
The suggested low-cost countermeasures and the intersection conditions where these countermeasures can be most cost-effectively deployed are as follows:
Stop-Controlled Intersections
• Signing and pavement marking countermeasuresatstop-controlledintersectionswithahighfrequencyofcrashes.
• J-turn treatmentsatstop-controlledintersectionsonmulti-lanedividedarterialhighwayswithahighfrequencyofanglecrashes.
Signalized Intersections
• Traffic signal, signing, and pavement marking countermeasuresatsignalizedintersectionswithahighfrequencyofcrashes.
Stop-Controlled and Signalized Intersections
• Lightingatunlitorpoorlylitintersectionswithahighfrequencyandproportionofcrashesoccurringduringhoursofdarkness.
• High-friction surfacesonhigh-speedintersectionapproacheswithahighfrequencyandproportionofwetpavementcrashes.
• Speed reductiononhigh-speedapproachestointersectionswithahighfrequencyofseverecrashesinvolvingspeed.
These sets of countermeasures were developed by integrating available research findings and input from intersection safety experts and practitioners in the Federal Highway Administration (FHWA) intersection focus states.
A description of the crash problem and deployment characteristics for each of the countermeasures follows.

5
2. STOP-CONTROLLED INTERSECTIONS Signing and Pavement Marking Enhancements
Crash Problem
The major crash type at stop-controlled intersections is a right angle crash involving a vehicle entering the intersection from the stop approach and a vehicle on the through approach. In these crashes, most of the vehicles on the stop approach stop or at least slow down to under 10 mph before pulling out. However, many drivers involved in these crashes make poor decisions regarding the available safe gaps between vehicles on the through road. Inattentive or distracted drivers, speeding, and physical limitations of the intersection contribute to future crash potential.
Countermeasures
The set of low-cost countermeasures for stop-controlled intersections is designed to increase drivers’ alertness to the presence of the intersection and reduce potential conflicts with other entering vehicles. These countermeasures are primarily intended for deployment at stop-controlled intersections with either single through lanes or multiple undivided through lanes. Countermeasures have been classified as basic or supplemental. Basic countermeasures are those that are usually very low in unit cost and effective in terms of reducing future crash potential and should be considered at all intersections having crashes above a defined crash threshold. Supplemental countermeasures are targeted to intersections with crash levels considerably above the crash threshold or the intersection has specific types of crashes that the countermeasure can address.
Basic CountermeasuresThe basic set of countermeasures should be considered as a package of minor improvements consisting of all of the following:
Low-Cost Countermeasures for the Through Approach• Doubledup(leftandright),oversizeadvanceintersectionwarningsigns,withstreetnamesignplaques.
Low-Cost Countermeasures for the Stop Approach• Doubledup(leftandright),oversizeadvance“StopAhead”intersectionwarningsigns.
• Doubledup(leftandright),oversizeSTOPsigns.
• Installationofaminimum6ft.wideraisedsplitterislandonthestopapproach(ifnopavementwideningisrequired.).
• Properlyplacedstopbar.
• Removalofanyfoliageorparkingthatlimitssightdistance.
• DoublearrowwarningsignatstemofT-intersections.
Supplemental Countermeasures—Intersections with Higher Crash Frequencies In addition to the basic package of countermeasures, additional individual countermeasures can be considered based upon higher frequencies of crashes beyond the crash threshold for basic countermeasures or at intersections that have crash types that the countermeasure can address.
• Installationofaminimum6ft.wideraisedsplitterislandonstopapproachwhichrequirespavementwidening.(SeeFHWA-HRT-08-063forfurtherdesignandperformanceinformation.).
• Eithera)flashingsolar-poweredLEDbeaconsonadvanceintersectionwarningsignsandSTOPsignsorb)flashingoverheadintersectionbeacons.
• Dynamicwarningsigntoadvisethroughtrafficthatastoppedvehicleispresentandmayentertheintersection.
• TransverserumblestripsacrossthestopapproachlanesinruralareaswherenoiseisnotaconcernandrunningSTOPsignsisaproblem.(Use“StopAhead”pavementmarkingsifnoiseisaconcern.).
• Dynamicwarningsigntoadvisehigh-speedapproachtrafficthatastoppedconditionisahead;usethiscountermeasurewhenvehiclesrunningtheSTOPsignisaproblem.
• Extensionofthethroughedgelineusingshortskippatternmayassistdriverstostopatanoptimumpoint;thiscountermeasuresisusedonintersectionswithverywidethroatsinwhichstoppeddrivershavedifficultystoppingatthecorrectlocation.
• Reflectivestripesonsignpostsmaybeusedonsignswithdegradedconspicuityduetosignclutterorcompetingbackgroundfeaturestoincreaseattentiontothesign,particularlyatnight.
Supplemental countermeasures should be considered in addition to the basic set of countermeasures and not in lieu of the basic countermeasures on those intersections with higher crash frequencies or those that possess certain physical characteristics that the countermeasure is designed to impact.

6
Figure 1: Examples of Basic Low-Cost Countermeasures for Stop-Controlled Intersections – Double Up Oversize Warning Signs, Double STOP Signs, Traffic Island on Stop Approach (if feasible), Street Name Signs, Stop Bars, and Double Warning Arrow at the Stem of T-Intersections
Countermeasure Crash Reduction Factors, Threshold Levels, Additional Implementation Factors, and Estimated Cost Ranges
Suggested Mountable Curb
It is assumed that the existing traffic control devices at intersections under consideration for improvement are MUTCD compliant and usually consist of a single standard size intersection warning sign for each through direction of travel and “Stop Ahead” and STOP signs on the stop approaches. Even with these signs a high frequency of crashes may exist at the intersection. Applying the complete set of sign and markings, defined previously under “Basic Countermeasures,” to the intersection is estimated to reduce future crashes by 30 percent (crash reduction factor (CRF) of 40). This estimate was developed by an expert intersection safety panel using past effectiveness research findings in combination with engineering judgment.
Crash reduction factors for supplemental stop-controlled intersection countermeasures have been taken from the FHWA Toolbox of Countermeasures and Their Potential Effectiveness to Make Intersections Safer and other FHWA publications. The CRFs, typical crash thresholds for application, additional implementation factors, and estimated cost ranges for each of the countermeasures are provided in Table 1.

CountermeasureCrash
Reduction Factor
Typical Urban Crash
Threshold
Typical Rural Crash Threshold
Additional Implementation
Factors
Typical Imple-mentation
Cost Range per Intersection
Installation of a 6 ft. or greater raised divider on stop approach (installed separately as a supplemental counter measure )
15% 20 crashes in 5 years
10 crashes in 5 years
$25,000 to $75,000 (pavement widening but no ROW required)
Widening required to install island
Dynamic warning sign which advises through traffic that a stopped vehicle is at the intersection and may enter the intersection
Unknown 20-30 crashes in 5 years
10-20 crashes in 5 years
$10,000 to $25,000
5 angle crashes in 5 years and inadequate sight distance from the stop approach
Dynamic warning sign on the stop approach to advise high-speed approach traffic that a stopped condition is ahead
Unknown 8 running STOP sign crashes in 5 years
5 running STOP sign crashes in 5 years
$10,000 to $25,000
Inadequate stopping sight distance on the stop approach
Reflective stripes on sign posts may increase attention to the sign, particularly at night
Unknown 10 crashes in 5 years
5 crashes in 5 years
Less than $1,000Sign visibility or conspicuity significantly degraded particularly at night
Extension of the through edge line using short skip pattern may assist drivers to stop at the optimum point
Unknown 10 crashes in 5 years
5 crashes in 5 years
Less than $1,000Wide throat and observed vehicles stopping too far back from the intersection
Transverse rumble strips across the stop approach lanes in rural areas where noise is not a concern and running STOP signs is a problem (“Stop Ahead” pavement marking legend if noise is a concern)
28% (transverse rumble strips) 15% (“Stop Ahead” pavement markings)
5 running STOP sign crashes in 5 years
3 running STOP sign crashes in 5 years
$3,000 to $10,000
Inadequate stopping sight distance on the stop approach
Either a) flashing solar powered LED beacons on advance intersection warning signs and STOP signs or b) flashing overhead intersection beacons
10% (13% for right angle crashes)
15-20 crashes in 5 years
8-10 crashes in 5 years
$5,000 to $15,000
None
Basic set of sign and marking improvements
10 crashes in 5 years
4-5 crashes in 5 years
$5,000 to $8,000None40%
7
Table 1: Crash Reduction Factors, Typical Crash Thresholds, Additional Application Factors, and Estimated Implementation Cost Ranges for Countermeasures at Stop-Controlled Intersections
The entire set of basic signing and marking countermeasures should be the primary improvement considered at stop-controlled intersections with a high frequency of crashes. One exception is stop-controlled intersections on divided multi-lane highways in which J-turn treatments (see next section) are the preferred countermeasure.
Additional supplemental countermeasures beyond the basic sign and marking enhancements should be considered at those intersections which either have much higher levels of crashes beyond the basic sign and marking crash thresholds
or have other intersection crash concerns identified in Table 1 that may be addressed by a given countermeasure.
The crash threshold levels in Table 1 may be adjusted to reflect the following: entering traffic volumes (low volume intersections may have a lower threshold); and/or differences in severity rates (e.g., fatalities per 100 crashes) between urban and rural stop-controlled intersections. Refer to the Systematic Approach section of this document for further information on adjusting crash thresholds.

8
J-Turn Treatments at Stop-Controlled Intersections on Multi-Lane Divided Arterial Highways
Crash Problem
The major crash type at stop-controlled divided arterial highway intersections is a crash involving a vehicle entering the intersection from the stop approach and a vehicle travelling on the through approach, usually on the far side of the intersection from the right. The crash typically occurs after the vehicle from the stop approach has entered the divided median portion of the intersection and is attempting either to cross or turn left onto the far side of the arterial. While sign and marking countermeasures may impact this problem, they are not considered as effective as eliminating the through and left-turn movement from the stop approach and replacing them with a right-turn only J-treatment using a median break downstream.
Countermeasures
The low-cost countermeasure for multi-lane divided arterial intersections is to eliminate left-turn and through movements from the stop approach, forcing all vehicles to turn right. This is accomplished by adding minor channelization to the stop approach and in the median and supplementing the channelization with appropriate signs and markings. Drivers desiring to turn left or proceed through the intersection can make a U-turn a short distance downstream and continue on with their intended movements. Further information on J-turn designs and performance may be obtained from National Cooperative Highway Research Program (NCHRP) Project 15-30. This treatment is also referred to as either Superstreet or a Restricted Crossing U-turn intersection.
Countermeasure Crash Reduction Factors, Threshold Levels, Additional Implementation Factors, and Estimated Cost Ranges
Crash reduction factors for left-turn restrictions from stop approaches to divided highways have been taken from NCHRP Project 15-30, which included an evaluation of J-turn projects in North Carolina. Those evaluations concluded that there was a 100 percent decrease in cross-path crashes, a range of 72 to 84 percent reduction of frontal impact crashes, and an overall intersection reduction of total crashes of 43 to 53 percent.
Figure 2: Turn Restrictions at Multi-Lane Highways
CountermeasureCrash Reduction
Factor
Typical Urban Crash
Threshold
Typical Rural Crash Threshold
Additional Intersection
Concern
Implementation Cost Range per
Intersection
J-turn modifications on high-speed divided arterials
4 angle crashes in 5 years*
4 angle crashes in 5 years*
$5,000 to $50,000
Ability to make U-turn within about ¼ to ½ mile of intersection
100% cross path, 72-84% frontal impact,43-53% all crashes
* If a highway section has a series of stop-controlled intersections with a high collective number of angle crashes, it is preferable to treat the problem on a system basis addressing all of the stop-controlled intersections rather than improving a few intersections that have isolated high numbers of angle crashes.
Table 2: Crash Reduction Factors, Typical Crash Thresholds, Additional Application Factors, and Estimated Implementation Cost Ranges for Countermeasures at J-Turn Stop-Controlled Intersections
24 Total J-Turn Conflict Points
4 Crossing12 @ Main Intersection10 Merge8 Weaving10 Diverge4 @ U-Turns

9
3. SIGNALIZED INTERSECTIONS Traffic Signal, Signing, and Pavement Marking Countermeasures at Signalized Intersections
Crash Problem
The major severe crash type at signalized intersections is a right-angle crash where one vehicle violates the red signal. Rear-end crashes occur with a much higher frequency but are much less severe than angle crashes. Two other concerns at signalized intersections are crashes involving left turn-opposing flow crashes and pedestrian crashes.
Countermeasures
The low-cost countermeasures for signalized intersections are identified below. Countermeasures have been classified as basic or supplemental. Basic countermeasures are those that are usually very low in unit cost and effective in terms of reducing future crash potential. Supplemental countermeasures are targeted to intersections with specific crash concerns.
Basic Countermeasures• Twelve-inchLEDlensesonallsignalheads.
• Backplatesonallsignalheads(optionalreflectorizedborder).
• Aminimumofonetrafficsignalheadperapproachlane.
• TrafficsignalyellowchangeintervalandallredintervaltimingadjustedtobeinaccordancewiththeInstituteofTransportationEngineers(ITE)timingstandards.
• Eliminationofanylatenightflashingoperations.
The basic set of countermeasures should be considered as a package of minor improvements consisting of all of the above countermeasures.
Supplemental for Special Conditions In addition to the basic package of countermeasures, additional individual countermeasures can be considered based upon higher frequencies of crashes beyond the crash threshold for basic countermeasures or at intersections that have specific crash types that the countermeasure can address.
• Potentialchangeofpermittedandprotectedleft-turnphasestoprotected-onlyforintersectionswhichhavehighnumbersofleftturn-opposingflowcrashes,threeormoreopposingapproachlanes,orhighopposingvolumeswithfewacceptableturninggaps.
• Advancecrossstreetnamesignsforhigh-speedapproachesonarterialhighways.
• Advanceleftandright“SignalAhead”oversizewarningsignsforisolatedtrafficsignalsorintersectionswherethesignalheadsarenotreadilyvisibleduetoalignmentorsightdistanceobstructions.
• Supplementalsignalheadswherenormallyplacedsignalheadsmaybedifficulttoidentifydueto:sightdistancelimitations,horizontalcurvature,orotherobstructions;or,exceptionallywideintersectionswhereanearsidesignalisneeded.
• Advancedetectioncontrolsystemsatisolatedhigh-speedsignalizedintersectionsthathavered-lightrunninganglecrashes.
• Signalcoordinationcountermeasuresonhigh-volumearterialswithcloselyspacedtrafficsignalsandfrequentmainlinestoppingduetopoorornosignalcoordination.
• Pedestriancountdownsignals,atintersectionswithhighpedestrianactivityormultiplepedestriancrashes.
• Exclusivepedestrianphasingatintersectionswithnumerouspedestrian-turningvehicleconflicts.
• Highervisibilitycrosswalksandadvancedpedestrianwarningsignsatintersectionswithhighpedestrianactivityormultiplepedestriancrashes.
Figure 3: Example Intersection with Basic 12 inch Lens, Back Plates and a Signal Head per Lane

10
CountermeasureCrash
Reduction Factor
Typical Urban Crash Threshold
Typical Rural Crash Threshold
Additional Implementation Factors
Implemen-tation Cost Range per
Intersection
Change of permitted and protected left-turn phase to protected-only
41-48% of left turn crashes
5 left turn movement crashes; 3 or more opposing through lanes; minimal turning gaps available
5 left turn movement crashes; 3 or more opposing through lanes; minimal turning gaps available
$5,000 to $10,000
None
Advance left and right “Signal Ahead” warning signs for isolated traffic signals
22% 20 crashes in 5 years
10 crashes in 5 years
$1,000Isolated traffic signal with one or more miles between signals; or traffic signals that are not readily visible due to highway alignment or obstructions
Supplemental signal face per approach
28% 20 crashes in 5 years
10 crashes in 5 years
$5,000 to $15,000
Signal faces obstructed by horizontal alignment; or exceptionally wide intersections (>100 ft) where a near side signal is needed
Advance detection control systems
Signal coordination
Pedestrian countdown signals
40% (injuries)
32%
25% (pedestrian crashes)
5 angle crashes in 5 years
20 crashes in 5 years per intersection
2 pedestrian crashes in 5 years
5 angle crashes in 5 years
10 crashes in 5 years per intersection
2 pedestrian crashes in 5 years
$15,000
$5,000 to $50,000
$5,000 to $15,000
Isolated high-speed (45mph or greater) signalized intersections
Arterials with closely spaced (about 1/2 mile maximum) signals
None
Advance cross street name signs for high-speed approaches on arterial highways
Unknown 20 crashes in 5 years
10 crashes in 5 years
$1,000 to $5,000
High-speed approaches on four or more lane arterial highways
Basic set of signal and sign improvements
20 crashes in 5 years
10 crashes in 5 years
$5,000 to $30,000
None30%
Countermeasure Crash Reduction Factors, Threshold Levels, Additional Implementation Factors, and Estimated Cost Ranges
It is assumed that the existing traffic signals at the intersection are MUTCD compliant and consist of at least dual signal heads on each approach. The estimated crash reduction factor for the combined basic countermeasures is a 30 percent reduction in all crashes. This estimate was developed by an expert intersection safety panel using past effectiveness research findings for individual countermeasures combined with engineering judgment.
Crash reduction factors for supplemental enhancements for special conditions have been taken from the FHWA Toolbox of Countermeasures and Their Potential Effectiveness to Make Intersections Safer and other FHWA research publications and are indicated in Table 3.

11
CountermeasureCrash
Reduction Factor
Typical Urban Crash Threshold
Typical Rural Crash Threshold
Additional Implementation
Factors
Implemen-tation Cost Range per
Intersection
Pedestrian Ladder or cross-hatched crosswalk and advanced pedestrian warning signs
15% (pedestrian crashes) for signs Unknown for crosswalk
2 pedestrian crashes in 5 years
2 pedestrian crashes in 5 years
$1,000 to $3,000
None
Separate Pedestrian Phasing
2 pedestrian crashes in 5 years involving a turning vehicle
2 pedestrian crashes in 5 years involving a turning vehicle
$5,000 to $15,000
None34% (pedestrian crashes)
Table 3: Crash Reduction Factors, Typical Crash Thresholds, Additional Application Factors, and Estimated Implementation Cost Ranges for Countermeasures at Signalized Intersections
The typical crash threshold levels in Table 3 may be refined to reflect the following: entering traffic volumes (low-volume intersections may have a lower threshold); and/or differences in severity rates (e.g., fatalities per 100 crashes) between urban and rural signalized intersections. Further information on adjusting thresholds may be found in the “Systematic Approach” section of this document.
The basic set of signal and signing countermeasures should be the primary improvement considered at signalized intersections with a high frequency of crashes.
Additional supplemental countermeasures beyond the basic signal and sign enhancements should be considered at those intersections which either have much higher levels of crashes beyond the basic signal and sign improvement crash thresholds or have other intersection concerns identified in Table 3 that may be addressed by a given countermeasure.

12
4. LIGHTING AT UNLIT OR POORLY LIT INTERSECTIONS
Crash Problem
Crashes that occur during darkness are typically more severe than daylight crashes. Major problems associated with unlit or poorly lit intersections (e.g. only one light per intersection) include reduced ability to recognize that an intersection is being approached, reduced ability to navigate turning movements properly, and degradation of the ability to recognize other vehicles and pedestrians in or entering the intersection.
Countermeasure Crash Reduction Factors, Threshold Levels, Additional Implementation Factors, and Estimated Cost Ranges
The crash reduction factor at unlit intersections with high frequencies and rates of night crashes is 50 percent of night crashes. The crash reduction factor for improving lighting at poorly lit intersections is estimated by an expert safety panel as 25 percent of night crashes.
Typical threshold crash levels for considering lighting countermeasures at intersections are provided in Table 4.
Countermeasures
The low-cost countermeasure for unlit or poorly lit intersections with a high frequency and rate of night crashes is lighting. Typical example layouts for intersection lighting are shown in Figures 4 and 5. States should follow their design policy for intersection lighting installations.
Figure 4: New Design for Intersection Lighting Layout
Source: Federal Highway Administration, Informational Report on Lighting Design for Midblock Crosswalks, FHWA-HRT-08-053 (Washington, DC: April 2008).
Figure 5: New Design for Wide Roadway Intersection Lighting Layout
CountermeasureCrash Reduction
FactorTypical Urban
Crash ThresholdTypical Rural
Crash Threshold
Additional Intersection
Concern
Implementation Cost Range per
Intersection
New or upgraded Lighting
10 night crashes in 5 years and a night /total crash ratio above the statewide average for urban unlit intersections
5 night crashes in 5 years and a night/total crash ratio above the statewide average for rural unlit intersections
$5,000 to $15,000
None50% (NEW), 25% (UPGRADED)of night crashes
Table 4: Crash Reduction Factors, Typical Crash Thresholds, Additional Application Factors, and Estimated Implementation Cost Ranges for Lighting Countermeasures at Unlit or Poorly Lit Intersections
13
Countermeasure Crash Reduction Factors, Threshold Levels, Additional Implementation Factors, and Estimated Cost Ranges
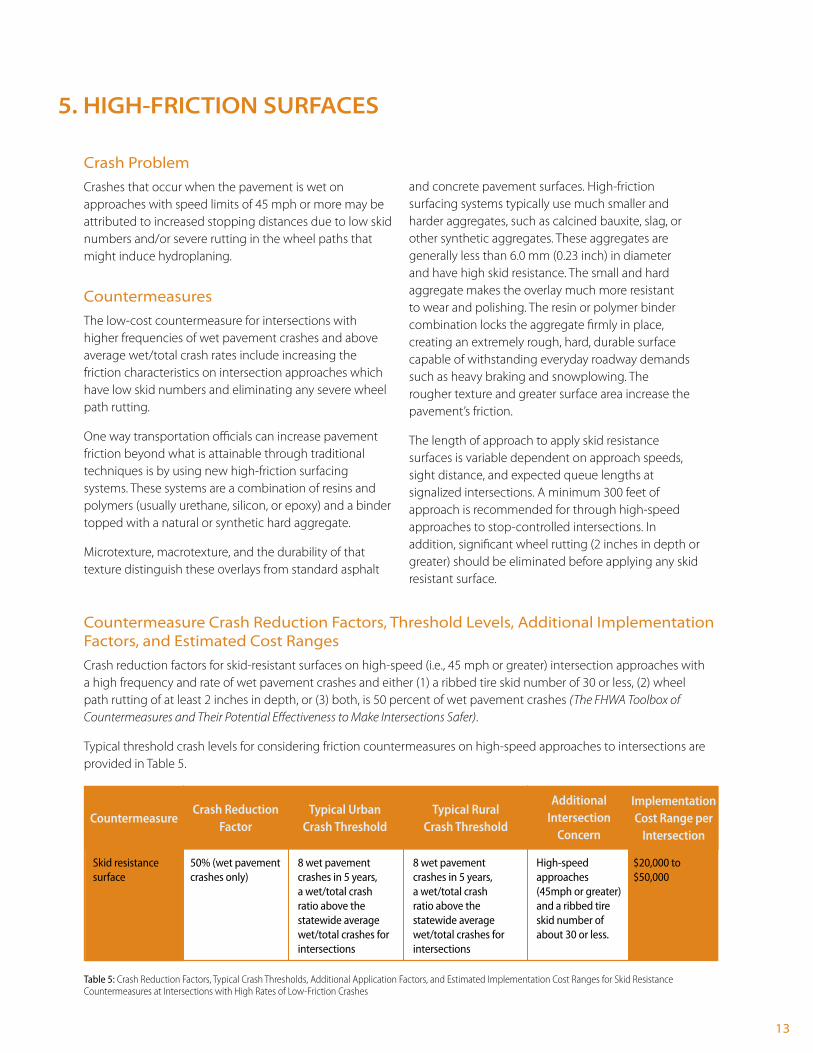
Crash reduction factors for skid-resistant surfaces on high-speed (i.e., 45 mph or greater) intersection approaches with a high frequency and rate of wet pavement crashes and either (1) a ribbed tire skid number of 30 or less, (2) wheel path rutting of at least 2 inches in depth, or (3) both, is 50 percent of wet pavement crashes (The FHWA Toolbox of Countermeasures and Their Potential Effectiveness to Make Intersections Safer).
Typical threshold crash levels for considering friction countermeasures on high-speed approaches to intersections are provided in Table 5.
CountermeasureCrash Reduction
FactorTypical Urban
Crash ThresholdTypical Rural
Crash Threshold
Additional Intersection
Concern
Implementation Cost Range per
Intersection
Skid resistance surface
8 wet pavement crashes in 5 years, a wet/total crash ratio above the statewide average wet/total crashes for intersections
8 wet pavement crashes in 5 years, a wet/total crash ratio above the statewide average wet/total crashes for intersections
$20,000 to $50,000
High-speed approaches (45mph or greater) and a ribbed tire skid number of about 30 or less.
50% (wet pavement crashes only)
Table 5: Crash Reduction Factors, Typical Crash Thresholds, Additional Application Factors, and Estimated Implementation Cost Ranges for Skid Resistance Countermeasures at Intersections with High Rates of Low-Friction Crashes
5. HIGH-FRICTION SURFACES
Crash Problem
Crashes that occur when the pavement is wet on approaches with speed limits of 45 mph or more may be attributed to increased stopping distances due to low skid numbers and/or severe rutting in the wheel paths that might induce hydroplaning.
Countermeasures
The low-cost countermeasure for intersections with higher frequencies of wet pavement crashes and above average wet/total crash rates include increasing the friction characteristics on intersection approaches which have low skid numbers and eliminating any severe wheel path rutting.
One way transportation officials can increase pavement friction beyond what is attainable through traditional techniques is by using new high-friction surfacing systems. These systems are a combination of resins and polymers (usually urethane, silicon, or epoxy) and a binder topped with a natural or synthetic hard aggregate.
Microtexture, macrotexture, and the durability of that texture distinguish these overlays from standard asphalt
and concrete pavement surfaces. High-friction surfacing systems typically use much smaller and harder aggregates, such as calcined bauxite, slag, or other synthetic aggregates. These aggregates are generally less than 6.0 mm (0.23 inch) in diameter and have high skid resistance. The small and hard aggregate makes the overlay much more resistant to wear and polishing. The resin or polymer binder combination locks the aggregate firmly in place, creating an extremely rough, hard, durable surface capable of withstanding everyday roadway demands such as heavy braking and snowplowing. The rougher texture and greater surface area increase the pavement’s friction.
The length of approach to apply skid resistance surfaces is variable dependent on approach speeds, sight distance, and expected queue lengths at signalized intersections. A minimum 300 feet of approach is recommended for through high-speed approaches to stop-controlled intersections. In addition, significant wheel rutting (2 inches in depth or greater) should be eliminated before applying any skid resistant surface.
14
Crash Problem
Intersection approaches where drivers commonly enter the intersection at excessive speeds can potentially increase the severity of crashes. In addition, higher approach speeds may make it more difficult for some stopped drivers at stop-controlled intersections to identify safe gaps to enter the intersection. Another concern is intersections with high speeds on the through approaches and limited available sight distance from the stop approach.
Countermeasures
The countermeasures are primarily intended for consideration on the through approaches at stop- controlled intersections. However, they may also be considered, after careful analyses, for high-speed approaches at signalized intersections. Minimal information is available concerning the crash reduction factors for speed reduction countermeasures. A number of countermeasures have performed well under limited levels of deployment. However, additional deployments may yield different results. These countermeasures may be cautiously deployed and complemented with evaluations to determine if the desired results have or have not been obtained.
The low-cost countermeasures for intersections with a high frequency of high-speed vehicle crashes on approaches include a number of options, as follows:
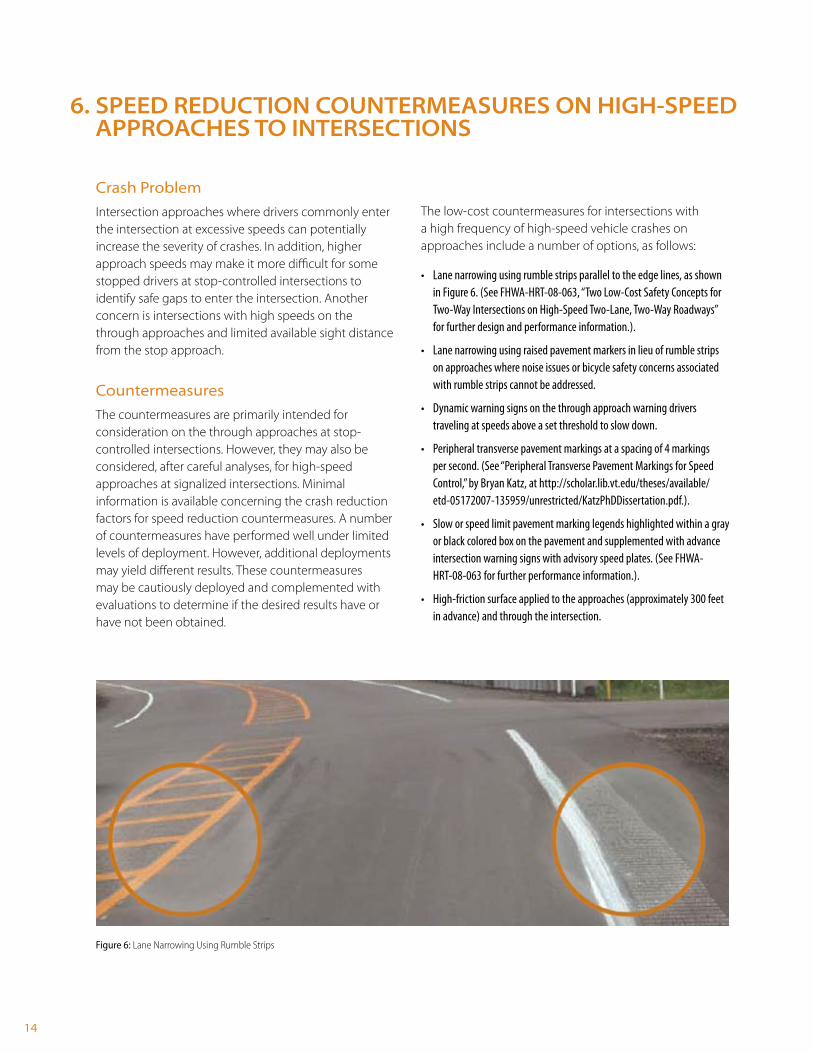
• Lanenarrowingusingrumblestripsparalleltotheedgelines,asshowninFigure6.(SeeFHWA-HRT-08-063,“TwoLow-CostSafetyConceptsforTwo-WayIntersectionsonHigh-SpeedTwo-Lane,Two-WayRoadways”forfurtherdesignandperformanceinformation.).
• Lanenarrowingusingraisedpavementmarkersinlieuofrumblestripsonapproacheswherenoiseissuesorbicyclesafetyconcernsassociatedwithrumblestripscannotbeaddressed.
• Dynamicwarningsignsonthethroughapproachwarningdriverstravelingatspeedsaboveasetthresholdtoslowdown.
• Peripheraltransversepavementmarkingsataspacingof4markingspersecond.(See“PeripheralTransversePavementMarkingsforSpeedControl,”byBryanKatz,athttp://scholar.lib.vt.edu/theses/available/etd-05172007-135959/unrestricted/KatzPhDDissertation.pdf.).
• Sloworspeedlimitpavementmarkinglegendshighlightedwithinagrayorblackcoloredboxonthepavementandsupplementedwithadvanceintersectionwarningsignswithadvisoryspeedplates.(SeeFHWA-HRT-08-063forfurtherperformanceinformation.).
• High-frictionsurfaceappliedtotheapproaches(approximately300feetinadvance)andthroughtheintersection.
6. SPEED REDUCTION COUNTERMEASURES ON HIGH-SPEED APPROACHES TO INTERSECTIONS
Figure 6: Lane Narrowing Using Rumble Strips

15
Countermeasure Crash Reduction Factors, Threshold Levels, Additional Implementation Factors, and Estimated Cost Ranges
Crash reduction factors based upon limited research, typical crash thresholds for application considerations, and additional intersection concerns that need to be addressed for each of the countermeasures are provided in Table 6.
Except for the high-friction surface countermeasure, countermeasures should be considered as singular treatments with the selection of the countermeasure based upon specific intersection characteristics, crash types and frequencies, costs, and crash reduction factors. The high-friction surface countermeasure may be combined with other countermeasures to yield more effective results.
CountermeasureCrash
Reduction Factor
Typical Urban Crash Threshold
Typical Rural Crash Threshold
Additional Intersection Concern
Implemen-tation Cost Range per
Intersection
Lane narrowing using pavement marking and shoulder rumble strips
Lane narrowing using pavement marking and raised pavement markers
Peripheral Transverse pavement markings
Dynamic speed warning sign on the through approach to reduce speed
“Slow” pavement markings
High-Friction Surface
10 speed-related crashes in 5 years
10 speed-related crashes in 5 years
10 speed-related crashes in 5 years
10 speed-related crashes in 5 years
10 speed-related crashes in 5 years
10 speed-related crashes in 5 years
5 speed-related crashes in 5 years
5 speed-related crashes in 5 years
5 speed-related crashes in 5 years
5 speed-related crashes in 5 years
5 speed-related crashes in 5 years
5 speed-related crashes in 5 years
$20,000 to $40,000
$5,000 to $10,000
$3,000 to $5,000
$10,000
$2,000 to $5,000
$20,000 to $50,000
Free of noise and bicycle issues – single through lane
Single through lane
31%
Unknown but probably less than 31%
Unknown
30%
Unknown
25% (All crashes)
Table 6: Crash Reduction Factors, Typical Crash Thresholds, Additional Application Factors, and Estimated Implementation Cost Ranges for Countermeasures at Stop-Controlled Intersections with High-Speed Approaches
16
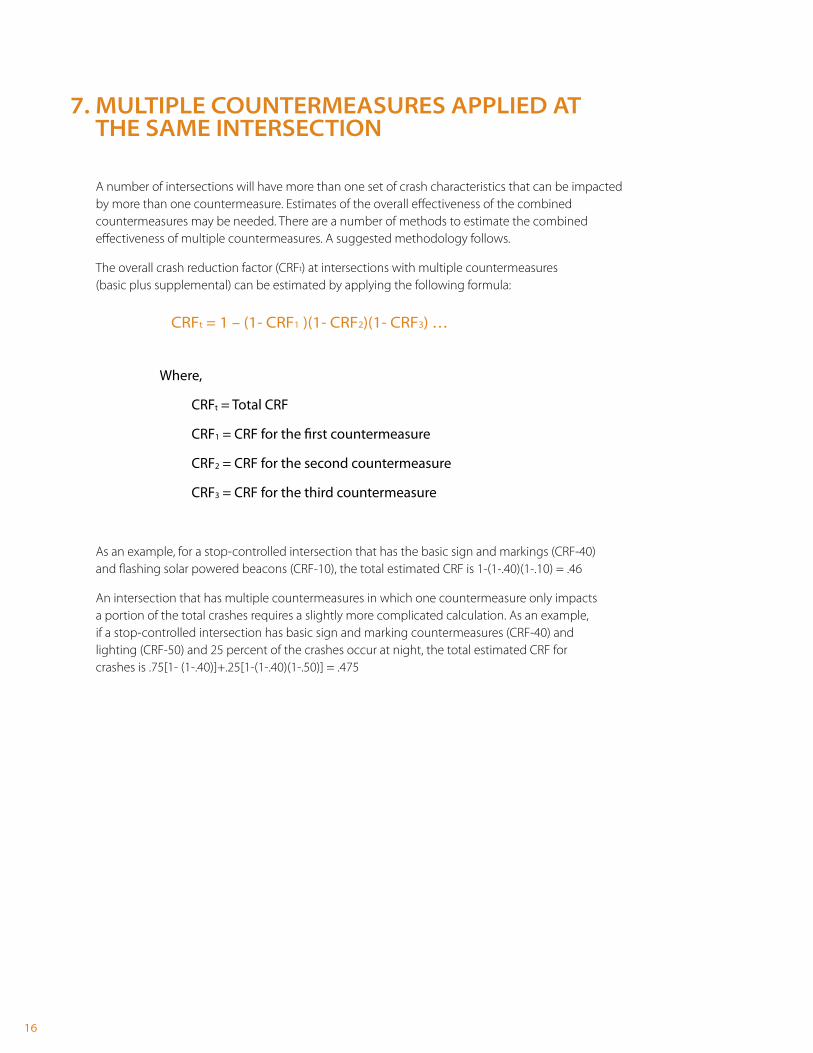
A number of intersections will have more than one set of crash characteristics that can be impacted by more than one countermeasure. Estimates of the overall effectiveness of the combined countermeasures may be needed. There are a number of methods to estimate the combined effectiveness of multiple countermeasures. A suggested methodology follows.
The overall crash reduction factor (CRFt) at intersections with multiple countermeasures (basic plus supplemental) can be estimated by applying the following formula:
CRFt = 1 – (1- CRF1 )(1- CRF2)(1- CRF3) …
Where,
CRFt = Total CRF
CRF1 = CRF for the first countermeasure
CRF2 = CRF for the second countermeasure
CRF3 = CRF for the third countermeasure
As an example, for a stop-controlled intersection that has the basic sign and markings (CRF-40) and flashing solar powered beacons (CRF-10), the total estimated CRF is 1-(1-.40)(1-.10) = .46
An intersection that has multiple countermeasures in which one countermeasure only impacts a portion of the total crashes requires a slightly more complicated calculation. As an example, if a stop-controlled intersection has basic sign and marking countermeasures (CRF-40) and lighting (CRF-50) and 25 percent of the crashes occur at night, the total estimated CRF for crashes is .75[1- (1-.40)]+.25[1-(1-.40)(1-.50)] = .475
7. MULTIPLE COUNTERMEASURES APPLIED AT THE SAME INTERSECTION

17
8. THE SYSTEMATIC APPROACH—CONCEPT
The systematic approach is the reverse of the conventional highway safety improvement program approach. The conventional approach starts with the identification of high-crash intersections and then selects countermeasures to impact crash patterns at the intersections. The systematic approach starts with defining a set of specific low-cost countermeasures and searches the crash data base to identify intersections where they can be deployed cost effectively on rural State, stop-controlled intersections.
Crash frequencies per intersection, expected crash severity (fatalities per 100 crashes), type of traffic control at the intersection (STOP sign, traffic signal), countermeasure costs, and the expected crash reductions resulting from the use of low-cost countermeasures all have to be considered to determine the optimum use of limited funds, particularly if the goal is to maximize the reduction of fatal or severe crashes at intersections.
Figure 7 identifies the eight intersection types in which low-cost countermeasures should be considered for application.
Each of these eight categories has a distinct distribution of crashes per intersection and severity (fatalities per 100 crashes) for each type of crash that a given low-cost countermeasure is designed to impact.
A minimum of 5 years of crash data is recommended to identify intersections with higher levels of crashes. Crashes are not uniformly distributed throughout the universe of intersections. A substantial portion of statewide intersection crashes may occur at only a very small number of intersections that have a higher frequency of crashes per intersection. (As an example, 25% of the statewide crash problem at rural stop-controlled intersections may be concentrated on only 3% of the rural stop-controlled intersections which have high frequencies of crashes). Low-cost countermeasures can be targeted to this small number of intersections and impact a substantial portion of the statewide crash problem.
Figure 7: Intersection Categories for Low-Cost Countermeasure Consideration
All Intersection Crashes
State Roads
Rural
Traffic Signal
Traffic Signal
Traffic Signal
Traffic Signal
STOP Sign
STOP Sign
STOP Sign
STOP Sign
Urban Rural Urban
Local Roads

18
A typical statewide distribution of rural State, stop-controlled intersections with one or more crashes over the past 5 years is shown in Table 7. Most States should be capable of developing similar tables from their Crash Data System using basic software such as ACCESS.
In the example above, there were 4,849 stop-controlled intersections that had at least one crash in the past 5 years. There are many more intersections on the State system, but the number of intersections with no crashes can not be identified from the crash data base. Overall there were 11,948 crashes at the 4,849 intersections. Of these intersections, 579 (12 percent of total) intersections had five or more crashes per intersection, resulting in 5,372 crashes, or almost 45 percent of all statewide crashes. At a higher threshold, 163 intersections had 10 or more crashes per intersection resulting in 2,685 crashes or over 22 percent of the statewide crashes. Once a minimum crash threshold is established, applying low-cost countermeasures at those intersections with crash frequencies at or above the threshold would impact a substantial portion of all statewide rural crashes at stop-controlled intersections on State roads.
In addition to identifying intersections with higher frequencies of crashes per intersection, the severity of crashes (fatalities per 100 crashes) can differ significantly by area (i.e., rural or urban) and type of traffic control and needs to be considered. For example, crashes at rural stop-controlled intersections are typically much more severe than crashes at either urban stop-controlled intersections or any type of signalized intersections.
The definition of severity used in the analysis should be aligned with the intersection goal of the Strategic Highway Safety Plan. If the goal of the Plan is to reduce intersection fatalities the severity should be defined in terms of fatalities per 100 crashes; if the goal is to reduce fatalities and incapacitating injuries, the severity should be defined in terms of fatalities and incapacitating injuries per 100 crashes.
The severity of any given crash is dependent on a number of factors, many of which are independent of the intersection characteristics. Factors such as the types of vehicles in the crash, the kinematics of the crash, and the age and gender of the drivers can greatly influence the potential for a crash to result in either property damage or a fatality. Statewide fatalities or fatalities and incapacitating injuries per 100 similar crashes for a given type of intersection and crash type provide a more stable estimate of the severity.
The severity of crashes varies significantly by ownership, urban/rural area, and type of traffic control. Table 8 provides an example of differences in severity (fatalities per 100 crashes) by type of traffic control, area, and ownership for a typical State.
As an example, if the application of low-cost countermeasures at State rural stop-controlled intersections is expected to prevent 100 crashes from occurring, 4.4 lives are projected to be saved. Similarly, if the same low-cost countermeasure applied at State urban stop-controlled intersections is also expected to prevent 100 crashes from occurring, only 1.14 lives are projected to be saved. If a State has a goal to reduce intersection fatalities and has 100 urban and 100 rural stop-controlled intersections each with five crashes per intersection, and can only improve 100 intersections it is clear that improving the rural intersections has more life saving potential; however, if the urban intersections had 20 crashes per intersection the decision to maximize lives saved becomes much more difficult.
Number of Crashes per Intersection
Number of Inter-sections
Cumulative Cumulative
100 and greater - - 0.00% - 0.00%
50 – 99 4 4 0.08% 266 2.23%
30 – 49 5 9 0.19% 448 3.75%
20 – 29 29 38 0.78% 1,095 9.16%
10 – 19 125 163 3.36% 2,685 22.47%
5 – 9 416 579 11.94% 5,372 44.96%
4 251 830 17.12% 6,376 53.36%
3 387 1,217 25.10% 7,537 63.08%
2 779 1,996 41.16% 9,095 76.12%
1 2,853 4,849 100.00% 11,948 100.00%
Total 4,849 4,849 100.00% 11,948 100.00%
Inte
rsec
tions
Perc
ent
Perc
ent
Cras
hes
Table 7: Example of a Typical State Distribution of Crashes at Rural State Stop-Controlled Intersections (5 Years Crash Data) Traffic Control Road Ownership
Fatalities per 100 Crashes
State Rural 4.40
State Urban 1.14
Local Rural 1.24
Local Urban 0.51
State Rural 1.60
State Urban 0.59
Local Rural 0.72
Stop
Stop
Stop
Stop
Signal
Signal
Signal
Signal Local Urban 0.39
Table 8: Example of Typical State Crash Severity for Various Intersection Types
19
9. SYSTEMATIC DEPLOYMENT—THE PROCESS
10. SUMMARY
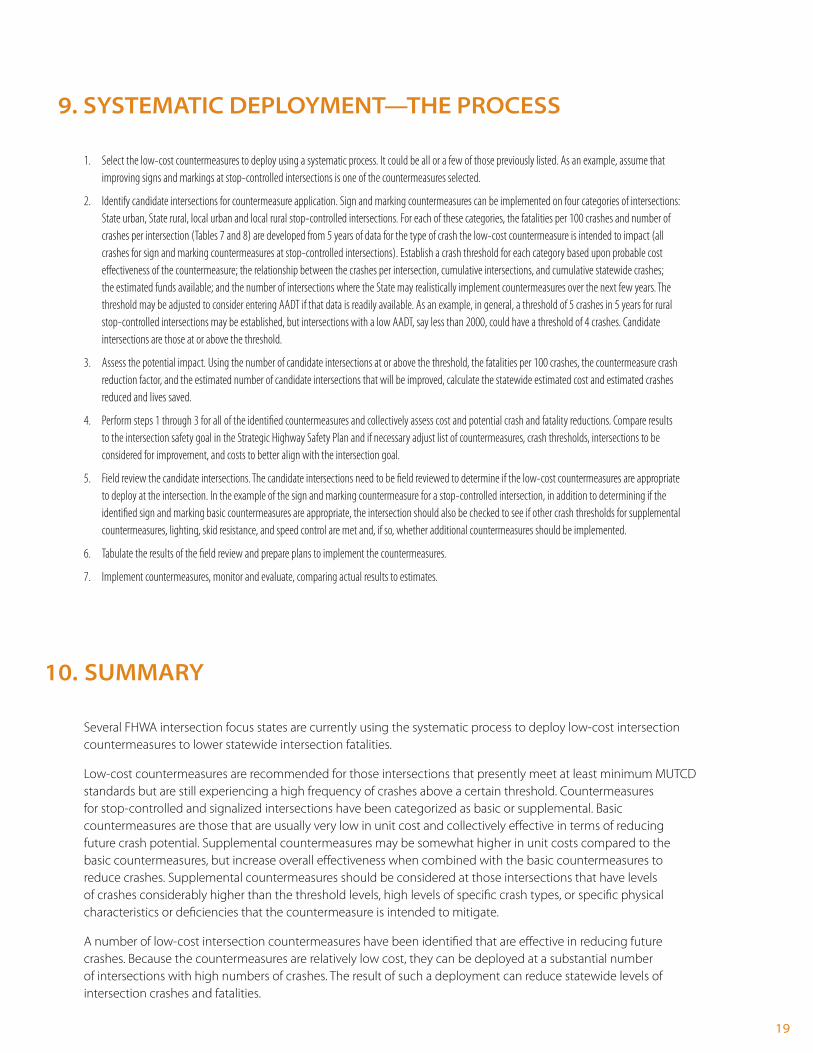
1. Select the low-cost countermeasures to deploy using a systematic process. It could be all or a few of those previously listed. As an example, assume that improving signs and markings at stop-controlled intersections is one of the countermeasures selected.
2. Identify candidate intersections for countermeasure application. Sign and marking countermeasures can be implemented on four categories of intersections: State urban, State rural, local urban and local rural stop-controlled intersections. For each of these categories, the fatalities per 100 crashes and number of crashes per intersection (Tables 7 and 8) are developed from 5 years of data for the type of crash the low-cost countermeasure is intended to impact (all crashes for sign and marking countermeasures at stop-controlled intersections). Establish a crash threshold for each category based upon probable cost effectiveness of the countermeasure; the relationship between the crashes per intersection, cumulative intersections, and cumulative statewide crashes; the estimated funds available; and the number of intersections where the State may realistically implement countermeasures over the next few years. The threshold may be adjusted to consider entering AADT if that data is readily available. As an example, in general, a threshold of 5 crashes in 5 years for rural stop-controlled intersections may be established, but intersections with a low AADT, say less than 2000, could have a threshold of 4 crashes. Candidate intersections are those at or above the threshold.
3. Assess the potential impact. Using the number of candidate intersections at or above the threshold, the fatalities per 100 crashes, the countermeasure crash reduction factor, and the estimated number of candidate intersections that will be improved, calculate the statewide estimated cost and estimated crashes reduced and lives saved.
4. Perform steps 1 through 3 for all of the identified countermeasures and collectively assess cost and potential crash and fatality reductions. Compare results to the intersection safety goal in the Strategic Highway Safety Plan and if necessary adjust list of countermeasures, crash thresholds, intersections to be considered for improvement, and costs to better align with the intersection goal.
5. Field review the candidate intersections. The candidate intersections need to be field reviewed to determine if the low-cost countermeasures are appropriate to deploy at the intersection. In the example of the sign and marking countermeasure for a stop-controlled intersection, in addition to determining if the identified sign and marking basic countermeasures are appropriate, the intersection should also be checked to see if other crash thresholds for supplemental countermeasures, lighting, skid resistance, and speed control are met and, if so, whether additional countermeasures should be implemented.
6. Tabulate the results of the field review and prepare plans to implement the countermeasures.
7. Implement countermeasures, monitor and evaluate, comparing actual results to estimates.
Several FHWA intersection focus states are currently using the systematic process to deploy low-cost intersection countermeasures to lower statewide intersection fatalities.
Low-cost countermeasures are recommended for those intersections that presently meet at least minimum MUTCD standards but are still experiencing a high frequency of crashes above a certain threshold. Countermeasures for stop-controlled and signalized intersections have been categorized as basic or supplemental. Basic countermeasures are those that are usually very low in unit cost and collectively effective in terms of reducing future crash potential. Supplemental countermeasures may be somewhat higher in unit costs compared to the basic countermeasures, but increase overall effectiveness when combined with the basic countermeasures to reduce crashes. Supplemental countermeasures should be considered at those intersections that have levels of crashes considerably higher than the threshold levels, high levels of specific crash types, or specific physical characteristics or deficiencies that the countermeasure is intended to mitigate.
A number of low-cost intersection countermeasures have been identified that are effective in reducing future crashes. Because the countermeasures are relatively low cost, they can be deployed at a substantial number of intersections with high numbers of crashes. The result of such a deployment can reduce statewide levels of intersection crashes and fatalities.

U.S. Department of Transportation
Federal Highway Administration
For More Information
Ed RiceIntersection Safety Team Leader, FHWA Office of Safety
2 0 2 . 3 6 6 . 9 0 6 4 P
May 2009FHWA-SA-09-020