Embed Size (px)
Citation preview

Science Report – Low-Cost Modifications of the Crump Weir to Improve Fish Passage i
Low-cost modifications of the Crump weir to improve fish passage Science Report SC010027
SCHO0608BOEZ-E-P

ii Science Report – Low-cost modifications of the Crump weir to improve fish passage
The Environment Agency is the leading public body protecting and improving the environment in England and Wales.
It’s our job to make sure that air, land and water are looked after by everyone in today’s society, so that tomorrow’s generations inherit a cleaner, healthier world.
Our work includes tackling flooding and pollution incidents, reducing industry’s impacts on the environment, cleaning up rivers, coastal waters and contaminated land, and improving wildlife habitats.
This report is the result of research commissioned and funded by the Environment Agency’s Science Programme.
Published by: Environment Agency, Rio House, Waterside Drive, Aztec West, Almondsbury, Bristol, BS32 4UD Tel: 01454 624400 Fax: 01454 624409 www.environment-agency.gov.uk ISBN: 978-1-84432-918-2 © Environment Agency – June 2008 All rights reserved. This document may be reproduced with prior permission of the Environment Agency. The views and statements expressed in this report are those of the author alone. The views or statements expressed in this publication do not necessarily represent the views of the Environment Agency and the Environment Agency cannot accept any responsibility for such views or statements. This report is printed on Cyclus Print, a 100% recycled stock, which is 100% post consumer waste and is totally chlorine free. Water used is treated and in most cases returned to source in better condition than removed. Further copies of this report are available from: The Environment Agency’s National Customer Contact Centre by emailing: [email protected] or by telephoning 08708 506506.
Author(s): David G Rhodes and Susan A Servais Dissemination Status: Publicly available Released to all regions Keywords: Fish pass, Crump weir, low cost, modifications Research Contractor: Cranfield University, Engineering Systems Dept., DCMT, Shrivenham, Swindon, SN6 8LA Environment Agency’s Project Manager: Greg Armstrong, Science Department Science Project Number: SC010027 Product Code: SCHO0608BOEZ-E-P

Science Report – Low-cost modifications of the Crump weir to improve fish passage iii
Science at the Environment Agency Science underpins the work of the Environment Agency. It provides an up-to-date understanding of the world about us and helps us to develop monitoring tools and techniques to manage our environment as efficiently and effectively as possible.
The work of the Environment Agency’s Science Department is a key ingredient in the partnership between research, policy and operations that enables the Environment Agency to protect and restore our environment.
The science programme focuses on five main areas of activity:
• Setting the agenda, by identifying where strategic science can inform our evidence-based policies, advisory and regulatory roles;
• Funding science, by supporting programmes, projects and people in response to long-term strategic needs, medium-term policy priorities and shorter-term operational requirements;
• Managing science, by ensuring that our programmes and projects are fit for purpose and executed according to international scientific standards;
• Carrying out science, by undertaking research – either by contracting it out to research organisations and consultancies or by doing it ourselves;
• Delivering information, advice, tools and techniques, by making appropriate products available to our policy and operations staff.
Steve Killeen
Head of Science

iv Science Report – Low-cost modifications of the Crump weir to improve fish passage
Executive summary 1. This three-year research project was carried out in response to the need for a low-cost strategy for improving fish passage over Crump or triangular profile weirs, as an alternative to expensive traditional fish pass solutions. It was co-funded by the Engineering and Physical Sciences Research Council (EPSRC) and the Environment Agency of England and Wales.
2. The aim was to develop a range of low-cost modifications to the Crump and other similar sloping weirs, and to investigate their effect upon flow gauging. A compromise between improving fish passage and preserving the hydrometric function was contemplated from the outset, and this dual theme runs through this report.
3. General solutions to the fish passage problem were sought, which would be applicable to many sites. However, the method adopted was a site-specific case study, with the benefit of realism and no loss of generality, and involved 1:5-scale physical modelling of the low weir at the Brimpton compound Crump site. Modelling by computational fluid dynamics was considered but rejected.
4. A multiplicity of quick-fit baffle arrangements, assembled from LEGO bricks, were trialled before the preferred geometry was accurately fabricated and tested. At this later stage, water depth profiles on the fish pathway were carefully measured with a wave probe and detailed velocity distributions were obtained in the plane of each baffle slot, using a Pitot and static tube combination. The velocities were compared with fish swimming speeds in the Environment Agency’s Swimit database. The self-cleansing properties of the modifications, and the hydraulic effect on the modifications of a slight increase in the downstream slope of the weir, were also investigated.
5. The trials led to the preferred baffle arrangement shown in Figure 5.1 at field scale and consisting of 200 mm high baffles, with 250 mm wide, full-depth, staggered slots. The baffles are fixed to the downstream face of the weir at 400 mm centres. The illustrated weir, with narrow aspect ratio, for geometrical reasons has one reflection of the fish pathway at the side wall. That reflection at the seventh baffle also served to check flow velocities, which between Baffle 1 and the tailwater thus satisfied the fish swimming criteria. So, with the pathway reflected every seventh baffle, such modifications would retard and significantly deepen the flow downstream of Baffle 1 of the modified Crump weir, providing fish passage for most adult species on the Environment Agency’s Swimit database (Environment Agency 2003), over a wide range of flow rates, at many sites. Moreover, it is likely that the fish swimming criteria would still be met in a weir of wider aspect ratio in which the fish pathway having the same oblique angle was instead straight, from the slot of Baffle 1 to the tailwater. However, flow conditions between the crest and the first baffle are challenging and may exceed the capabilities of some fish that would otherwise ascend successfully.
6. The modifications were found to be self-cleansing at the higher flow rates associated with the movement of suspended sediment and trash. Biological fouling was not investigated, but experience of such incidences at existing sites would indicate the significance of the problem and should be referred to. It is expected that air entrainment will be greater at field scale than in the laboratory model and might deter some fish passage. For that reason at least, field-scale trials will be required.
7. Two alternative sizes and locations of the first baffle are recommended. One of the arrangements is a little better for fish passage, but both should be subjected to field trials. In either case there will be a significant adjustment to the stage–discharge relationship of the standard Crump weir. However, acceptance of this effect upon the flow gauging function is essential, to mitigate the locally adverse conditions for fish passage upstream of the first baffle. Locating the first baffle far enough downstream to

Science Report – Low-cost modifications of the Crump weir to improve fish passage v
have minimal effect upon flow gauging would be detrimental to fish passage and leave minimal benefit from the modifications.
8. The effects on the weir discharge coefficient and drowned flow reduction factor of several different baffle arrangements, each parallel to the crest, were investigated for modular and non-modular flows respectively. Most effort was directed towards the effect of the single baffle acting in modular flow, but the single baffle in non-modular flow was also investigated, as were twin baffles and the complete baffle arrangement in both flow regimes. For modular flow conditions, Figure 4.8 shows the effect of the modifications upon the stage–discharge relationship, and Figure 4.9 the corresponding percentage reduction from the standard weir flow rate at the same head. However, more physical modelling remains to be done, especially in the non-modular flow regime, to provide a comprehensive calibration for the modified weir stage–discharge relationship. Such areas of work are identified and recommended.
9. In order to test the effectiveness of the proposed modifications and to make minor adjustments for optimizing fish passage, it is recommended that fish-movement studies should be carried out in the field on a non-gauging weir, modified as recommended in this study. The baffle arrangement should be fabricated as a light-weight, quick-fit assembly that can be easily adjusted or replaced. When the effectiveness of the modifications for fish passage has been confirmed, they will be immediately deployable on non-gauging weirs and, subject to further hydrometric physical modelling, later deployable on gauging weirs.
vi Science Report – Low-cost modifications of the Crump weir to improve fish passage
Acknowledgements The project was jointly funded by the Engineering and Physical Sciences Research Council (EPSRC) and the Environment Agency of England and Wales (EPSRC Grant Reference No. GR/R31614/01).
Dr D.G. Rhodes (Principal Investigator) and Dr S.A. Servais (Project Student) were respectively Senior Lecturer and Research Student at Cranfield University, Engineering Systems Department, DCMT, Shrivenham, Swindon, SN6 8LA. The Project Board was chaired by Mr G.S. Armstrong (National Fish Pass Officer, Environment Agency) with the following Environment Agency membership at different times, Mr H. Brown, Mr A. Fewings and Mr P. Power (succeeded by Mr R. Iredale).
Part of the work has been published in Rhodes and Servais (2003, 2004) and Servais et al. (2003, 2004). Further details of the project are reported by Servais (2006).
The authors are grateful to Prof J.G. Hetherington and Dr P.D. Smith (Cranfield University) for their support.

Science Report – Low-cost modifications of the Crump weir to improve fish passage vii
Contents Science at the Environment Agency iii
Executive summary iv
Acknowledgements vi
Contents vii
1 Introduction 1 1.1 Aim 1 1.2 Objectives 1 1.3 Memorandum of Understanding 1
2 Methods 3 2.1 General Approach 3 2.2 Equipment and Experimental Procedure 5
3 Results and observations 12 3.1 Modifications for fish passage 12 3.2 Hydrometric effect 26
4 Analysis and discussion 35 4.1 Modifications for fish passage 35 4.2 Hydrometric effect 46
5 Conclusions 61 5.1 Modifications for fish passage 61 5.2 Hydrometric effect 65
6 Recommendations 67 6.1 Modifications for fish passage 67 6.2 Hydrometric effect 68
References 70
Notation 72
List of abbreviations 73
Appendix A 74

viii Science Report – Low-cost modifications of the Crump weir to improve fish passage
List of tables and figures Table 4.1 Fineness ratios for a range of freshwater fish (eel and salmon from Turnpenny 1981; chub, dace, roach,
trout and bream from Clough 2003) 37 Table 4.2 Field-scale low-flows at Brimpton, and the corresponding low-weir flow rates per unit length of the low
weir 46 Table 4.3 Comparison of present single-baffle experiments with those of the Environment Agency (2005) 49 Table 4.4 Stage – discharge results calculated for British Standard Crump Weir and weir modified by uniformly
200 mm high baffles. The latter calculation applies equations 3 and 4 to obtain Cd/Cd,BS. The total head H1 covers the range 50 to 1400 mm with 100 equal intervals on the logarithmic scale. For the baffled weir, the two lowest heads are below the minimum of the range in which equation 3 applies. For the Brimpton Compound Crump Weir when the static head h > 0.3048 m, the high weir begins to act and the compound discharges are entered in blue. When the discharge Q >18 m3 s–1, drowned flow occurs and the notional modular flow discharges are entered in red 55
Table 4.5 Stage – discharge results calculated for British Standard Crump Weir and weir modified by 200 mm high baffles, except for 120 mm high first baffle. The latter calculation applies equations 5, 6 and 7 to obtain Cd/Cd,BS. The total head H1 is divided over the range 50 to 1400 mm into 100 equal intervals on the logarithmic scale, but truncated at H1 = 0.743307, near the limit of the data to which equation 7 was fitted. For the baffled weir, the first 13 heads are below the minimum of the range in which equation 5 applies. For the Brimpton Compound Crump Weir when the static head h > 0.3048 m, the high weir begins to act and the compound discharges are entered in blue. In accord with the limit of equation 7, the table does not reach drowned flow conditions. 58
Figure 2.1 Brimpton Weir on the River Enborne, Thames catchment. NGR SU568648 3 Figure 2.2 General arrangement of flume with model Crump weir installed 5 Figure 2.3 Flume with model Crump weir, photographed from upstream position adjacent to inlet contraction 6 Figure 2.4 Weir geometry with single baffle installation 9 Figure 2.5 Weir geometry with two-baffle installation 10 Figure 3.1 Centre Channel (left) and Baulk (right) 12 Figure 3.2 Zigzag Channel 14 Figure 3.3 Oblique Channel 14 Figure 3.4 Oblique Channel with increasing stagger and constant slot width 15 Figure 3.5 Velocity distributions on fish pathway in geometries of Figure 3.4 (baffle layouts 5 and 6 as Figure 3.4
left and right respectively) 15 Figure 3.6 V and narrow channel 16 Figure 3.7 Oblique Channel with increasing slot width and constant stagger 16 Figure 3.8 Velocity distributions on fish pathway in geometries of Figure 3.7 (baffle layout 5 and LEGO layout 1.1
as Figure 3.7 left and right respectively) 17 Figure 3.9 V-Channel optimized at 90-percentile low flow 18 Figure 3.10 Velocity distribution on fish pathway in geometry of Figure 3.9 (layout numbers as in Servais 2006) 19 Figure 3.11 General arrangement of Perspex model 19 Figure 3.12 Fish pathway on which free-surface profiles measured 20 Figure 3.13 Free-surface profiles on fish pathway shown in Figure 3.12 (unequal baffle 1) 20 Figure 3.14 Free-surface profiles on fish pathway shown in Figure 3.12, with equal and unequal baffle 1. Axes
rotated and vertical scale expanded. 21 Figure 3.15 Velocity distributions in baffle slot 12, at the 90-, 50-, 30- and 10-percentile low flows (green ≤ 1.1 m s–1,
yellow > 1.1 m s–1, ≤ 2.0 m s–1, red > 2.0 m s–1) 22 Figure 3.16 Velocity distributions in baffle slots 1 and 2, at the 90-percentile low flow, for two sizes of baffle 1 (green
≤ 1.1 m s–1, yellow > 1.1 m s–1, ≤ 2.0 m s–1) 23 Figure 3.17 Comparison of velocity distributions at crest and at flow minimum depth for unequal and equal sizes of
baffle 1 24 Figure 3.18 Velocity distributions in baffle slot 11, at the 90-, 50-, 30- and 10-percentile low flows, without and with
the flume tilted (green ≤ 1.1 m s–1, yellow > 1.1 m s–1, ≤ 2.0 m s–1, red > 2.0 m s–1) 25 Figure 3.19 Modular flows over unmodified weir: total head–discharge measurements 26 Figure 3.20 Modular flows over weir modified with single baffle, d/l = 0.2: non-dimensional total head–discharge
results 27 Figure 3.21 Modular flows over weir modified by single baffle, 0.24 ≥ d/l ≥ 0.067: non-dimensional total head–
discharge results 28 Figure 3.22 Modular flows over weir modified by two-baffle arrangement (d1/l1 = 0.2, d1/d2 = 1) compared with single
baffle modification: non-dimensional total head–discharge results 29 Figure 3.23 Modular flows over weir modified by two-baffle arrangement (d1/l1 = d2/l2 = 0.2, d1/d2 = 0.5 and d1/d2 =
0.6), compared with single baffle modification: non-dimensional total head–discharge results 30 Figure 3.24 Modular flows over weir modified by two-baffle arrangement and complete Perspex fish pass (d1/l1 =
d2/l2 = 0.2, d1/d2 = 0.6), compared with single baffle modification: non-dimensional total head–discharge results 31
Figure 3.25 Non-modular flows over unmodified weir: results plotted non-dimensionally, as head ratios (a) H2/H1 and (b) hp/H1 against drowned flow reduction factor f 32
Figure 3.26 Non-modular flows over weir modified with single baffle, d/l = 0.2: results plotted non-dimensionally, as head ratios H2/H1 and hp/H1 against drowned flow reduction factor f 33
Figure 3.27 Non-modular flows over weir modified by complete Perspex fish pass, compared with single baffle modification: results plotted non-dimensionally, as head ratio H2/H1 against drowned flow reduction factor f (Q1 and Q2 defined in notation and applied in Sections 2.2.3.8 and 4.2.17) 34
Figure 4.1 Matrices for the 90-percentile low flow with the 24 mm high baffle 1 39 Figure 4.2 Matrices for the 50-percentile low flow with the 24 mm high baffle 1 40 Figure 4.3 Matrices for the 30-percentile low flow with the 24 mm high baffle 1 40 Figure 4.4 Matrices for the 10-percentile low flow with the 24 mm high baffle 1 40

Science Report – Low-cost modifications of the Crump weir to improve fish passage ix
Figure 4.5 Velocity distributions at the weir crest and in the region of flow minimum depth between the weir crest and baffle 1 (unequal baffles 1 and 2) 43
Figure 4.6 Flow−duration data for Brimpton compound Crump weir 45 Figure 4.7 Modular flows over weir modified by single baffle: non-dimensional total head–discharge results of
present study compared with results of Environment Agency (2005) 49 Figure 4.8 Comparison of British Standard stage–discharge curve with stage–discharge curves of modified fully
baffled weirs, with 200 mm high first baffle and 120 mm high first baffle 52 Figure 4.9 Effect of fish pass modifications upon flow rates at same total head expressed as a percentage
difference from the flow rate of the unmodified British Standard weir 53 Figure 5.1 General arrangement of proposed fish-pass modifications at field scale, in plan and elevation, showing
cross-sectional details 64 Figure A.1 Graphical representation of fitted equation A.1, with the original data 74 Figure A.2 Contours of Cd/CdBS together with fitted equation A.2 (shaded areas extrapolated out of range of data)76

Science Report – Low-cost modifications of the Crump weir to improve fish passage 1
1 Introduction
Traditional solutions to fish passage problems at weirs and dams have normally been purpose-built conduits that bypass the obstruction and provide favourable hydraulic conditions for fish swimming in the upstream direction. Such fish passes are expensive to build, especially when added to an existing hydraulic structure. Within the Environment Agency’s hydrometric network, and more widely among privately operated installations, there are many weirs thought to be detrimental to fish passage. These include a large proportion of Crump or triangular-profile weirs, too many to be remedied by expensive traditional fish pass solutions (Environment Agency 2001a). In response to the need for an alternative, low-cost strategy, a three-year research project into low-cost modifications to the Crump weir to improve fish passage was co-funded by the Engineering and Physical Sciences Research Council (EPSRC) and the Environment Agency, and carried out at the Cranfield University Shrivenham Campus. The following aim and objectives were included in the Case for Support submitted to the EPSRC.
1.1 Aim Using physical modelling, to develop a range of low-cost modifications to the Crump weir and other similar sloping weirs in order to facilitate fish passage, and to investigate the effect upon the hydrometric function.
1.2 Objectives a. To retard and significantly deepen the supercritical sheet flow on the downstream
face of the weir in order to provide suitable velocities and flow depths for the passage of a variety of fish species and sizes.
b. To investigate the effect of the proposed modifications upon the hydrometric function, under modular and non-modular flow conditions, and upon the transition between the two.
c. To ensure that structural modifications are self-cleansing, and will not silt up or trap debris.
d. To formulate design guidelines and make recommendations that are generally applicable to Crump weirs and sloping weirs of similar design, having a range of gradients of the downstream face, and not limited to a particular site.
1.3 Memorandum of Understanding Subsequently, a Memorandum of Understanding was agreed with the Environment Agency, having the following objectives:
1. To identify and model potential solutions for improving fish passage conditions on sloping weirs.
2. To describe the effects of scale, and of changing physical variables such as slope, baffle dimensions, depth.

2 Science Report – Low-cost modifications of the Crump weir to improve fish passage
3. To identify the implications for gauging accuracy and reliability where such structures are used for hydrometric purposes.
4. To identify and apply the most promising solutions in carefully identified field situations.
5. To produce technical design guidance.
In carrying out this project, we have been guided by both the Objectives and the Memorandum of Understanding.

Science Report – Low-cost modifications of the Crump weir to improve fish passage 3
2 Methods
2.1 General approach 2.1.1 Every triangular-profile weir site has a unique combination of layout, catchment hydrology and fish colony. Nevertheless, in spite of such site-specific features, the potential for general solutions to the fish passage problem was recognized from the outset, and the requirement for such solutions was a primary concern when devising the methodology of this investigation. However, it seemed that any general solutions would have to be deduced from one or more case studies, either real or notional. Consequently, if those solutions were to be tested in the field, it would help in the assessment of their performance if such cases were real and coincided with the test sites. A site-specific study was therefore the chosen route to the generalized solution.
Figure 2.1 Brimpton Weir on the River Enborne, Thames catchment. NGR SU568648
2.1.2 A brief pilot study (Sarker et al. 2001) into low-cost modifications had previously been carried out on a physical model of the low weir of the compound Crump weir at Brimpton (Figure 2.1) on the River Enborne, Thames catchment, with some earlier work on the impact of this weir upon coarse fish and their spawning migrations (Pinniger 1998). Also, the Brimpton weir had been constructed mainly to the British Standard specification and operated within the Environment Agency’s hydrometric network. Moreover, the weir location was within an hour’s travelling distance from Cranfield University’s Shrivenham Campus, where the authors were based. For those

4 Science Report – Low-cost modifications of the Crump weir to improve fish passage
reasons, the Brimpton weir was chosen for the site-specific study, and the low weir in particular because of its relevance to fish passage at all stages of the river.
2.1.3 It was envisaged that the study would be chiefly of a hydraulic nature, investigating each flow structure in relation to fish swimming capabilities, for a multiplicity of potential solutions and a range of flow rates. A field study was precluded by the absence of flow control under field conditions, by considerations of health and safety at a remote river site and by the practical difficulty of carrying out the range of trial modifications and the very large number of detailed measurements at full scale on a river. Of the modelling options, computational fluid dynamics (CFD) was rejected for two reasons. Firstly, the flow complexity (accelerating, three-dimensional, free-surface, separated and impinging flows, with a slotted multiple-fin-type boundary condition) would have been an immense challenge to commercially available CFD, and alone the results of the numerical analysis would not have been widely accepted with confidence. Secondly, physical experiment was likely to be quicker than CFD in carrying out this parametric study involving many cases, even on a very fast computer. Achieving for every case numerical convergence of every dependent variable, with low residuals and steady values, together with grid-dependence testing, would have been extremely time-consuming. Therefore, physical modelling in the laboratory was adopted as the chosen method.
2.1.4 The choice of a uniform scale of 1:5 was influenced by the laboratory flume width of 0.613 m (about two foot) in relation to the 3.048 m (10 foot) length of the low weir at Brimpton, and was also appropriate to the other dimensions of the flume. Analysis of the hydraulic measurements was determined by the significance of Froude number; for example scaling between model and field velocities was based on identical Froude numbers. Reynolds number dependence, as it directly affected the flow structure, was considered small enough (except at the very lowest flows) to be ignored. It was recognized that air entrainment at field scale would be significant, yet unpredictable from the model-scale experiments contemplated. Indeed, given the complex mechanism of air entrainment (induced by turbulent eddies emerging at the free surface and opposed by gravity and surface tension, with Reynolds number, Froude number and Weber number effects respectively), it was considered impossible to design 1:5 model-scale experiments that could be reliably scaled up to field conditions. Therefore the measurement of air entrainment was consigned to later full-scale experimentation on the adopted solution, to be carried out in the field because it was not feasible within the laboratory facilities available to us.
2.1.5 The aim of low cost was pursued in practical terms by a search for simple bolt-on solutions which would avoid breaking out the concrete fabric of the existing weir and would be easily reversible. An important consideration was the impact of such modifications upon flow gauging, and the conflict between maximizing fish passage and minimizing the hydrometric effect was obvious from the outset. For example, this conflict of interest was a factor that weighed against the baulk concept as an appropriate low-cost solution. Accordingly, the two themes of fish passage improvement and its impact upon the weir hydrometry run throughout this report.
2.1.6 On the one hand, the investigation of fish passage improvement was a search for some form of baffle arrangement on the downstream face of the weir, which would dissipate energy and thicken and retard the flow so as to promote hydraulic conditions favourable to fish passage. Consequently, many such geometries were trialled and eliminated before a preferred solution was found and thoroughly tested. On the other hand, the investigation of the hydrometric effect was guided by the concept that, for an installation with baffles parallel to the weir crest and of equal height, it would be the baffle located nearest to the crest that would have the dominant influence.
Consequently most of the research effort into the hydrometric effect was directed towards quantifying the extent to which the presence of a single baffle would modify the
Science Report – Low-cost modifications of the Crump weir to improve fish passage 5
stage–discharge relationship of the Crump weir. That effort was concentrated on the modular flow regime in which the weir discharge dependence on head is limited to that upstream, though attention was also given to the non-modular flow regime in which the discharge depends on both upstream and downstream head. Subsequently, it was realized that our focus on the effect of a single baffle was too narrow. For the purposes of fish passage, unequal heights of the two baffles nearest the crest had also to be considered, and they were found to be significantly different in their hydrometric effect from that of a single baffle.
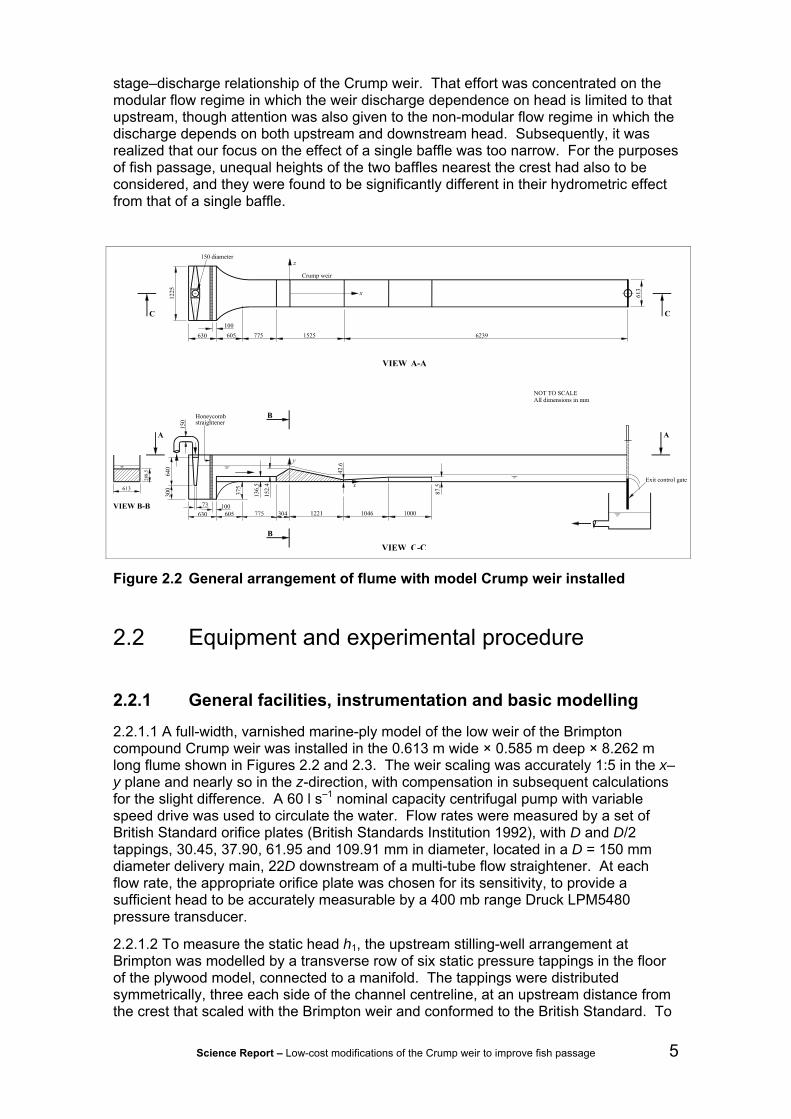
Figure 2.2 General arrangement of flume with model Crump weir installed
2.2 Equipment and experimental procedure
2.2.1 General facilities, instrumentation and basic modelling
2.2.1.1 A full-width, varnished marine-ply model of the low weir of the Brimpton compound Crump weir was installed in the 0.613 m wide × 0.585 m deep × 8.262 m long flume shown in Figures 2.2 and 2.3. The weir scaling was accurately 1:5 in the x–y plane and nearly so in the z-direction, with compensation in subsequent calculations for the slight difference. A 60 l s–1 nominal capacity centrifugal pump with variable speed drive was used to circulate the water. Flow rates were measured by a set of British Standard orifice plates (British Standards Institution 1992), with D and D/2 tappings, 30.45, 37.90, 61.95 and 109.91 mm in diameter, located in a D = 150 mm diameter delivery main, 22D downstream of a multi-tube flow straightener. At each flow rate, the appropriate orifice plate was chosen for its sensitivity, to provide a sufficient head to be accurately measurable by a 400 mb range Druck LPM5480 pressure transducer.
2.2.1.2 To measure the static head h1, the upstream stilling-well arrangement at Brimpton was modelled by a transverse row of six static pressure tappings in the floor of the plywood model, connected to a manifold. The tappings were distributed symmetrically, three each side of the channel centreline, at an upstream distance from the crest that scaled with the Brimpton weir and conformed to the British Standard. To

6 Science Report – Low-cost modifications of the Crump weir to improve fish passage
measure the crest head hp, a similar row of six static pressure tappings, connected to a manifold, was located at the crest of the model in conformity with the British Standard arrangement for crest tappings, even though crest tappings had not been installed at Brimpton. The alternative provision at Brimpton of downstream water level gauging to measure h2, was modelled by a third transverse row of six static pressure tappings in the floor of the plywood model, at a distance from the crest that scaled with the similar dimension to the standpipe/stilling well in the field.
Figure 2.3 Flume with model Crump weir, photographed from upstream position adjacent to inlet contraction
2.2.1.3 The head h1 upstream of the weir relative to the crest was measured by a Druck LPM5480 20 mb range pressure transducer, between a manifold connected to the upstream static-pressure tappings and a reservoir with its water level set at crest level (Rhodes and Servais 2003). For non-modular flow gauging, whether using the crest tappings or the downstream gauging section, the same reservoir provided the reference crest level for the head measurements downstream of the crest. The tailgate at the flume exit was used to control the water level downstream of the model weir.
2.2.1.4 Accurate positioning of instrumentation in the flow was achieved by means of a motorized three-axis traverse gear. Depending on the application, various degrees of software control were implemented, from push-button stepping between two locations to automatic traverses on two-dimensional grids with data collection. The DC voltage outputs of the various sensors were sampled by an Advantech PCL-818HG analogue to digital converter.
2.2.2 Modifications for fish passage
2.2.2.1 The trial of many baffle arrangements was facilitated by building them from LEGO, in units two, three or four bricks high mounted on LEGO board. Single bricks were of various lengths, 15.8 mm wide and 9.6 mm high (not including the fixing studs);

Science Report – Low-cost modifications of the Crump weir to improve fish passage 7
therefore the baffle heights were multiples of the latter dimension, plus the 1.9 mm studs on the top brick. Also for speed of application, spot samples of velocity at key points were taken using a 10 mm diameter velocity propeller meter: the Pitot tube/ static tube combination used to begin with (Servais et al. 2003) was considered too slow for this purpose. To eliminate all but the most promising baffle arrangements, measurements were initially carried out at only one flow rate, corresponding to the 90-percentile low flow at Brimpton (3.77 l s–1 at model scale, and measured with the 37.9 mm diameter orifice plate). That was chosen as the threshold below which impeded fish passage would be tolerable. For these experiments at the 90-percentile low flow, the baffle height mostly used was 30.6 mm (three bricks). To save time, the adequacy of water depth for fish passage was at this stage assessed by visual inspection and the depth was not actually measured.
2.2.2.2 From these trials, two preferred baffle arrangements were subjected to a wider range of flows and further adjustments were made to the baffle heights and locations. This wider range of flows was again expressed in terms of percentile low-flow at Brimpton (10-, 25-, 30-, 50-, 60-, 70-, 90-percentile low-flows, as described by Servais 2006). Flows higher than the 37.3-percentile low flow at Brimpton were shared by the high and low weirs of the compound Crump weir, and in modelling such flows over the laboratory weir, it was the low-weir flow (deduced from the compound flow) that was applied at model scale.
2.2.2.3 For each trial baffle arrangement, the LEGO bricks were installed and the geometry of the layout was recorded. The head of a pin, driven into the centre of the weir crest, served as the origin of the traverse-gear coordinate system and, at the start of a velocity traverse, the base of the velocity propeller meter was lined up with the pin by eye. Spot samples of velocity were then taken at key points in the flow and the coordinates automatically recorded. These were mainly on the fish pathway, in the plane of each slot, on the slot axis, at about one-third baffle-height from the weir face. Other measurements of velocity were taken at intermediate points on the fish pathway, halfway between the rows of baffles. These model flow velocities were scaled up to field conditions and compared with the fish swimming speed database (Environment Agency 2003).
2.2.2.4 The baffle arrangement found to provide the most favourable swimming conditions was then selected for further tests over a range of flow rates (90-, 50-, 30- and 10-percentile low flows at Brimpton). It was re-fabricated with a 10 mm thick black Perspex base and clear Perspex baffles, reproducing the LEGO geometry but with the baffle crests and slot sides radiused, as required at field scale to prevent injury to the fish and to reduce aeration. The adopted four-brick baffle height in LEGO was rounded to 40 mm in the Perspex. Clear Perspex was chosen to transmit the light sheet to be used for particle tracking velocimetry (PTV) and the black Perspex provided a suitable background against which the illuminated particles would be visible to the video camera. To remove the 10 mm step produced by the black Perspex base, the weir crest was raised by 5.7 mm by means of a 10 mm thick brass plate, machined to shape and size. Consequently the weir crest tappings were covered over and inaccessible when the Perspex and brass assembly was in place.
2.2.2.5 Velocity measurement by PTV actually proved unsuccessful because of the very high flow velocities and the resulting short residence times of the particles in successive video frames. However, the limited flow visualization provided by the PTV system did reveal streamline flows through the plane of each slot, and thus confirmed that the slot flows would be measurable using a Pitot tube. The slot flows presented the most strenuous conditions for the fish swimming upstream and it was therefore decided to measure the velocity distribution in each slot at every flow rate, and to do that using a Pitot tube/static tube combination for accuracy and positional resolution.
2.2.2.6 Although each velocity distribution was to be measured using automatic traverse and data collection, given the 13 baffle slots and four different flow rates, the

8 Science Report – Low-cost modifications of the Crump weir to improve fish passage
process was expected to be very time-consuming. For that reason, new 2.05 mm diameter Pitot and static tubes were fabricated with the static tube mounted 12.5 mm above the Pitot tube, the static tube holes and the Pitot tube orifice being in the same transverse plane normal to the downstream face of the weir. That arrangement allowed the combination to be freely traversed full-width across the slot. Its limitation was that, because the maximum height of the Pitot tube was determined by the need to keep the static tube submerged, the vertical extent of the measurable velocity field was reduced to an elevation some 13 mm or more below the free surface.
2.2.2.7 The velocity distributions were measured at various intervals, with Δy´ ≈ 6 mm and Δz´ ≈ 8 mm, on a rectangular grid bounded by the slot sides, the face of the weir and the upper limit of travel of the Pitot tube/static tube combination. The differential pressure was sensed using the 20 mb pressure transducer, the DC voltage output (range 0 to 10 volts) being sampled for 60 seconds at 200 Hz and averaged prior to conversion into velocity. After moving to and before sampling at each location, a pause time of 60 seconds was employed to allow the system hydraulics to settle.
2.2.2.8 The free surface profile and, by deduction, the water depth distribution along the fish pathway through the slots were measured by means of a twin-wire wave probe and monitor (supplied by HR Wallingford Ltd) in conjunction with the motorized three-axis traverse gear. The method had been developed in response to the problem of accurately and quickly measuring the average position of a free surface that fluctuated with large amplitude (Rhodes and Servais 2003). In the original work, good spatial resolution in plan had been achieved by means of a miniaturized wave probe with a 2.3 mm dimension between centres of the wires. In our case, for the purpose of obtaining an averaged free-surface position more representative of the slot width, a wave probe was used with a 14 mm dimension between wires. The free surface position was sampled at approximately 30 mm intervals along the fish pathway, the routine at each location consisting of a 10 second pause time after which the DC voltage output (range –5 to +5 V) was sampled for 15 seconds at 200 Hz and then averaged.
2.2.2.9 All of the measurements reported so far were carried out on the model of the low weir of the Brimpton compound Crump weir, designed mainly to the British Standard specification with 1:2 upstream slope and 1:5 downstream slope. It was intended to also investigate the performance of the preferred baffle arrangement (as described in Sections 2.2.2.1 to 2.2.24) when installed on other triangular-profile weirs with non-standard downstream slopes. However, the priority was a thorough investigation of the British Standard weir, and as the programme developed it became apparent that there would not be time to reconstruct the model with different slopes and carry out the necessary measurements. Consequently, the extension of the work to triangular-profile weirs of non-standard design was accommodated in only a very limited way by tilting the flume, with the Perspex baffle arrangement in place, so as to change the downstream slope of the weir. Constrained by the flume design, tilting the flume merely increased the downstream slope by about 10 per cent from 1:5 to 1:4.55, a change in angle from 11.3° (to the horizontal) to 12.4°. Nevertheless, a survey of velocity distributions and free-surface profiles along the fish pathway was carried out at the 90-, 50-, 30- and 10-percentile low flow rates and the results were compared with those of the standard weir.
2.2.2.10 For the reasons discussed later (Section 4.1.20), it was considered that siltation within the baffle arrangement was unlikely to occur, and so attention to the self-cleansing properties of the modifications was focused on whether or not they would trap floating debris. Three kinds of debris were modelled and tested separately in each of the 90-, 50-, 30- and 10-percentile low flows, using the following materials: straight softwood dowel of 6, 15 and 20 mm diameter, in lengths of 36, 72, 144, 288 and 575 mm, with two items of each size; three 216 × 184 mm rectangular plastic bags; five twigs (tree structures) with 190 to 340 mm long main stems of 6 to 9 mm maximum thickness, and with three to nine branches 80 to 400 mm long.

Science Report – Low-cost modifications of the Crump weir to improve fish passage 9
2.2.2.11 The dowels, previously soaked in water for some hours, were introduced in bulk at the 50-, 30- and 10-percentile low-flow rates at the downstream end of the flume entry contraction. At the 90-percentile low-flow rate, because of the tendency to log-jam, the introduction was gradual, starting with the shortest lengths and adding longer lengths at intervals. The plastic bags were introduced at the entry contraction and, having been filled with water, they were transported by the stream in an expanded and neutrally-buoyant state. The twigs, also pre-soaked, were introduced at the entry contraction, one at a time and their orientation relative to the weir crest allowed to vary randomly. At each flow rate, ten trials were carried out with the dowels and ten with the twigs; five were carried out with the plastic bags. In each trial the progress of the debris through the weir was observed and recorded.
2.2.3 Hydrometric effect
2.2.3.1 The hydrometric experiments were firstly carried out under modular flow conditions, and secondly under non-modular or drowned flow conditions. In each case, stage–discharge measurements were carried out for the unmodified weir and then for the weir modified by the addition of a single baffle downstream of the crest and parallel to it. For modular flows, additional experiments were carried out with the weir modified by the addition of two baffles of the same and different sizes, and finally by fitting the complete baffle arrangement. For non-modular flows, the complete baffle arrangement was installed but not the two-baffle arrangements.
Figure 2.4 Weir geometry with single baffle installation
2.2.3.2 Thus, the hydrometry of the model weir was first investigated in its unmodified condition under modular flow conditions. The purpose was one of quality control, to show that the combination of the model weir geometry and the measurement system would produce a stage–discharge curve that conformed to BS 3680 (1986) (British Standards Institution 1986). The flow rate, adjusted in increments from about 4 to 56 l s–1, was measured by the 61.95 and 109.91 mm diameter orifice plates in combination

10 Science Report – Low-cost modifications of the Crump weir to improve fish passage
with the 400 mb pressure transducer, sampled at 200 Hz for 60 seconds and the data averaged. The upstream static head h1 relative to the weir crest level (varying from about 25 to 125 mm) was measured as described in Section 2.2.1.3 by the 20 mb pressure transducer, sampled at 200 Hz for 60 seconds before averaging. After each increment in flow rate, the system was allowed to settle for five minutes before measurements were taken, which gave sufficient time for the components of storage volume (headwater, weir flow, tailwater and sump) to reach steady values.
2.2.3.3 The effect of a single baffle was investigated with the underlying assumption that geometrically similar baffle arrangements would consist of baffles with geometrically similar cross-sections that subtended identical angles at the crest (that is, gave identical values of the ratio d/l in Figure 2.4). Using the procedure described in Section 2.2.3.2, modular flow stage–discharge measurements were carried out for the nominal values of d/l = 0.24, 0.2, 0.183, 0.167, 0.133, 0.1 and 0.067. In order to test the underlying assumption of similarity, a full set of stage–discharge measurements was carried out at d/l = 0.2 for each of five geometrically similar baffle cross-sections with d = 20, 30, 40, 50 and 60 mm. Varying the baffle size also gave the practical benefits of extending the range of the non-dimensional variable H1/d (by means of the smaller baffles) and improving the relative precision of the measurements (by means of the larger baffles). This was exploited for each of the other geometries (d/l = 0.183, 0.167, 0.133, 0.1 and 0.067) by measuring two or more stage–discharge data sets, each with a different size of baffle.
Figure 2.5 Weir geometry with two-baffle installation
2.2.3.4 The effect of two baffles was tested under modular flow conditions using the general arrangement shown in Figure 2.5, in which similar geometries were defined in terms of the combination of ratios d1/l1, d2/l2 and d1/d2. By this stage of the project, the ratio d1/l1 = 0.2 had been conceived as the likely first choice for fish passage, and it was decided to test the alternatives d1/d2 = 1 (identical baffle size) and d2/l2 = 0.2 (identical angle subtended at the crest by the first two baffles), in each case with d1/l1 = 0.2.

Science Report – Low-cost modifications of the Crump weir to improve fish passage 11
• The two identical baffles were of size d1 = d2 = 20 mm and were located at 40 mm centres, giving d2/l2 = 0.143.
• The identical angle condition, d1/l1 = d2/l2 = 0.2 was achieved by a pair of baffles with d1 = 24 mm and d2 = 40 mm, not geometrically similar in cross-section but identical to the first two baffles of the preferred baffle arrangement fabricated in Perspex. For this baffle-pair d1/d2 = 0.6.
Stage–discharge measurements were carried out as before (Section 2.2.3.2), this time for the two baffle pairs. Finally, under modular flow conditions, the stage–discharge relationship for the complete Perspex fish pass installation was measured.
2.2.3.5 For most of the work carried out under non-modular (drowned flow) conditions, the flow rate was set to the nominal value of 39.5 l s–1, close to the modelled 10-percentile low-flow at Brimpton. In successive measurements, the head- and tailwaters of the weir were elevated in increments, which had the effect of lowering the water level in the sump and increasing the pumping head. That caused the flow rate to drift downwards slightly, but not so as to affect the experimental results expressed in non-dimensional terms. After each adjustment in the water levels, the flow rate was accurately measured using the 109.91 mm diameter orifice plate and 400 mb pressure transducer, with the usual sampling frequency and sampling period with time-averaging.
2.2.3.6 As for modular flow, for non-modular flow the unmodified weir was first of all investigated. With a nominal flow rate of 39.5 l s–1, the tailwater of the weir was elevated in successive increments by raising the tailgate. With each increment, after the usual five minutes’ settling period (Section 2.2.3.2), the flow rate, upstream static head h1, static head at the crest hp and tailwater static head h2 were measured. The static heads were in each case measured relative to weir crest level, using the 20 mb pressure tranducer with the usual sampling routine and time-averaging.
2.2.3.7 There was not time to carry out as many single-baffle experiments for non-modular flow as for modular flow. To investigate the effect of a single baffle, one of the geometrically similar baffles of size d = 40 mm was installed with d/l = 0.2. With a nominal flow rate of 39.5 l s–1, the tailwater adjustments and measurements of flow rate and static heads described in Section 2.2.3.6 were repeated.
2.2.3.8 Finally, under non-modular flow conditions, the full Perspex optimum fish-pass modifications were investigated. As mentioned in Section 2.2.2.4, the weir crest tappings were inaccessible when the Perspex and brass assembly was in place, and therefore only the upstream and tailwater static heads, h1 and h2 respectively, were measured together with the flow rate, as described in Section 2.2.3.6. Two nominal flow rates of Q1 = 39.5 l s–1 and Q2 = 47 l s–1 were used in this final case to confirm that the results in non-dimensional terms were independent of flow rate.

12 Science Report – Low-cost modifications of the Crump weir to improve fish passage
3 Results and observations
3.1 Modifications for fish passage
3.1.1
Figures 3.1 to 3.4 illustrate the fundamental baffle arrangements investigated, 31 variations of which were fabricated with LEGO bricks and tested at the 90-percentile low flow. The starting point of this systematic investigation was the centre channel baffle arrangement, in which baffles of equal height were arranged parallel to the weir crest, with constant spacing between successive baffles (Figure 3.1). A succession of full-depth rectangular slots, one in each baffle, was designed to create an axial fish-pathway on the longitudinal centre-line of the weir. Next, in order to achieve slot-flow velocities lower than those measured in the centre channel arrangement, a logical development was to skew the fish pathway in an oblique channel arrangement by staggering successive slots (Figure 3.3). That had a beneficial effect upon the velocity distribution, but resulted in a fish pathway at such an angle to the weir axis that the fish entry point was no longer in the weir tailwater but partway up the weir apron slope. That problem in turn was solved by the V-channel arrangement in which the oblique fish pathway was reflected about the side wall (Figure 3.4). After some refinement that arrangement was adopted as the preferred solution. The results and observations that follow describe the systematic investigation in detail and include our consideration of three other baffle configurations: the baulk arrangement (Figure 3.1), the addition of a second narrow channel (Figure 3.6), and the zigzag arrangement (Figure 3.2).
Figure 3.1 Centre channel (left) and baulk (right)

Science Report – Low-cost modifications of the Crump weir to improve fish passage 13
3.1.2
The centre channel arrangement (Figure 3.1) was a variant of the twin side-channel layout tested by Sarker et al. (2001) who, using 30.4 mm high thin-plate baffles with twin 32 mm wide full-depth slots, found that a 60 mm baffle spacing maximized flow thickness. In the present case also, using LEGO baffles three bricks high (28.7 mm plus 1.9 mm studs), a single 64 mm wide central channel and a baffle spacing of 64 mm (the nearest to 60 mm that could be obtained with LEGO), it was found that water depths for fish passage were significantly improved (Servais et al. 2003). The water depth along the central channel was quite consistent, having an average value of nearly 36 mm (180 mm at field scale). However, the maximum velocity measured at each slot, and at transverse planes mid-way between successive pairs of slots, increased systematically in the downstream direction, from about 0.5 m s–1 (1.1 m s–1 at field scale) at the first baffle to about 1.3 m s–1 (2.9 m s–1 at field scale) between Baffles 7 and 8, the downstream limit of the traverse gear for that set-up. The velocity gradient was still positive at that location, indicating yet higher velocities at Baffles 8 to 13.
3.1.3
The traditional baulk design consists of a baffle of rectangular cross-section, mounted obliquely on the downstream face of the weir and stretching from the crest to the toe (Fort and Brayshaw 1961; Salmon Advisory Committee 1997). At the upstream end of the baulk, a notch formed in the crest directs some of the weir flow onto the baulk, which creates a shallow-sloping, low-velocity channel up which the fish can progress. An ‘enhancing baulk’, consisting of another baffle located on and aligned with the crest, shelters the oblique baulk flow from the crest flow, which would otherwise impinge on the low-velocity channel, transferring high momentum flux and disrupting fish passage. The enhancing baulk also augments the flow through the notch. Because of the geometric constraints of the rectangular grid of the LEGO board, in our experiments the oblique baffle had to be modelled like a staircase, as shown by the solid rectangles in Figure 3.1. The formation of a notch in the crest was avoided on the grounds that in the field its construction would be expensive, as would be the reinstatement of the crest if the notch were no longer required. The shelter of an enhancing baulk was partially achieved in the model by a series of upstream baffles, parallel to the crest, shown as open rectangles in Figure 3.1. Downstream of the oblique baffle, the open rectangles in Figure 3.1 represent extra baffles installed to moderate velocities in the flow overtopping the baulk. For the reasons discussed in Sections 4.1.5 and 4.1.6, only a cursory inspection of the baulk arrangement was carried out, in which a maximum velocity of about 0.65 m s–1 (1.5 m s–1 at field scale) was measured in the oblique channel.

14 Science Report – Low-cost modifications of the Crump weir to improve fish passage
Figure 3.2 Zigzag channel
3.1.4
The zigzag arrangement, named after the right hand column of staggered slots in Figure 3.2, was tested firstly without the addition of the wider channel shown on the left hand side of the diagram. However, velocities in the slots were found to be higher than the 0.5 m s−1 model-scale fish passage criterion discussed later (Section 4.1.2), and the wider channel was subsequently added. This reduced velocities in the staggered slots, but velocities in the wider channel were high, reaching a maximum of 1.4 m s−1 at model-scale. The latter resulted in a large recirculation eddy downstream of the last baffle, a likely problem for fish approaching from downstream.
Figure 3.3 Oblique channel

Science Report – Low-cost modifications of the Crump weir to improve fish passage 15
Figure 3.4 Oblique channel with increasing stagger and constant slot width
-250
-200
-150
-100
-50
0-1200 -1000 -800 -600 -400 -200 0 200
Cross-section of weir
Hei
ght (
mm
)
0
0.2
0.4
0.6
0.8
1
1.2
1.4
Wat
er v
eloc
ities
at m
odel
sca
le (m
/s)
crest extrapolated y lego Sample point Most fish will succeed Baffle layout 5 Baffle layout 6
Figure 3.5 Velocity distributions on fish pathway in geometries of Figure 3.4 (baffle layouts 5 and 6 as Figure 3.4 left and right respectively)

Science Report – Low-cost modifications of the Crump weir to improve fish passage 16
Figure 3.6 V and narrow channel
Figure 3.7 Oblique channel with increasing slot width and constant stagger

Science Report – Low-cost modifications of the Crump weir to improve fish passage 17
-250
-200
-150
-100
-50
0-1200 -1000 -800 -600 -400 -200 0 200
Cross-section of weir
Hei
ght (
mm
)
0
0.2
0.4
0.6
0.8
1
1.2
1.4
Wat
er v
eloc
ities
at m
odel
sca
le (m
/s)
extrapolated y lego crest Sample point Most fish will succeed Baffle layout 5 Lego Layout 1.1
Figure 3.8 Velocity distributions on fish pathway in geometries of Figure 3.7 (baffle layout 5 and LEGO layout 1.1 as Figure 3.7 left and right respectively)
3.1.5
Tests on the oblique channel arrangement (Figure 3.3) indicated that 64 mm, face-to-face, was the optimum spacing between the rows of baffles, in that it was the largest dimension that maintained a near-maximum flow depth. This result agreed with that previously found for the centre channel arrangement, the latter being the zero-angle limiting case of the oblique channel, and was consistent with Armstrong’s (2002) advice on baffle spacing. By increasingly staggering successive slots and thus increasing the obliqueness of the fish pathway relative to the flume axis, it was found that flow velocities through the slots were reduced, and significantly so. For the geometries shown in Figure 3.4, Figure 3.5 shows the effect upon the velocity distribution of increasing the stagger with a constant slot width of 32 mm. However, because of the narrow aspect ratio (width:length) of the downstream face of the Brimpton low-crest weir, as a result of increasing the stagger the oblique fish pathway reached the side wall partway up the slope, some distance short of the tailwater, before an acceptable velocity distribution had been achieved. That problem was addressed by the V-channel configuration (Figure 3.6), in which the fish pathway was reflected about the side wall, preserving the same oblique angle but directed in the opposite transverse-direction. For a particular oblique fish pathway, the slot width was varied from 32 mm in increments of 8 mm, with the optimum velocity distribution achieved at a slot width of 48 mm (Figures 3.7 and 3.8). Also, guidance in the choice of slot width was provided by Armstrong (2002).
3.1.6
Experiments with the oblique and V-channels were extended by the addition of a second narrow channel, with its own internal baffle system, designed to accommodate smaller fish with much lower swimming speeds. Figure 3.6 shows such a channel next to the right-hand wall. In its various combinations with the oblique and V-channels, at

18 Science Report – Low-cost modifications of the Crump weir to improve fish passage
the 90-percentile low-flow the second narrow channel behaved as a pool and weir fish pass with very low velocities. However, with an increase in flow rate, it was soon drowned out and subjected to much higher velocities.
3.1.7
The baffle arrangement in LEGO that was finally adopted is shown in Figure 3.9. With certain modifications, it was re-fabricated in Perspex (Figure 3.11) and installed on the model Crump weir. As well as the minor modifications reported in Section 2.2.2.4 (baffle height 40 mm with crest and slot sides radiused), the slot width was rounded up to 50 mm and the stagger to 40 mm (sideways displacement of slots). Also, the Perspex baffles were machined and polished 15 mm thick, and their spacing of 65 mm face-to-face gave a centre-to-centre dimension of 80 mm.
Figure 3.9 V-Channel optimized at 90-percentile low flow

Science Report – Low-cost modifications of the Crump weir to improve fish passage 19
-250
-200
-150
-100
-50
0
50
-1200 -1000 -800 -600 -400 -200 0 200
Cross-section of weir
Hei
ght (
mm
)
0
0.2
0.4
0.6
0.8
1
1.2
1.4
1.6
Wat
er v
eloc
ities
at m
odel
sca
le (m
/s)
lego crest sample point Most fish will succeed Q90 Q75 Q60 Q50 Q30
Initial baffle distance = 12 studs (125mm =0.625m in prototype)
DISCHARGE (model scale => field scale)3.76 l/s (approx Q90 = 3.77 l/s => 0.209 m^3/s)5.63 l/s (approx Q75 = 5.86 l/s => 0.325 m^3/s)8.92 l/s (approx Q60 = 9.33 l/s => 0.517 m^3/s)15.47 l/s (approx Q50 = 13.11 l/s => 0.727 m^3/s)23.22 l/s (approx Q30 = 22.91 l/s => 1.27 m^3/s)
Figure 3.10 Velocity distribution on fish pathway in geometry of Figure 3.9 (layout numbers as in Servais 2006)
Figure 3.11 General arrangement of Perspex model

20 Science Report – Low-cost modifications of the Crump weir to improve fish passage
Figure 3.12 Fish pathway on which free-surface profiles measured
0 1 2 3 4 5 6
−2.5
−2
−1.5
−1
−0.5
0
0.5
1
1.5
2
Fie
ld−
scal
e y−
coor
dina
tes
rela
tive
to c
rest
(m
)
Field−scale x−coordinates relative to crest (m)
0 200 400 600 800 1000 1200
−500
−400
−300
−200
−100
0
100
200
300
400
Mod
el y
−co
ordi
nate
s re
lativ
e to
cre
st (
mm
)
Model x−coordinates relative to crest (mm)
Weir profileQ10Q30Q90Q50Perspex baffles
Figure 3.13 Free-surface profiles on fish pathway shown in Figure 3.12 (unequal baffle 1)
3.1.8
With the unequal first baffle arrangement, Figure 3.13 shows at model scale and at field scale the free-surface profiles measured at the 90-, 50-, 30- and 10-percentile low flows using the twin-wire wave probe. Figure 3.12 shows in plan the fish pathway on which the profiles were obtained. At the four flow rates, the average water depths downstream of the first baffle were at model scale 41, 54, 64 and 81 mm respectively

Science Report – Low-cost modifications of the Crump weir to improve fish passage 21
(at field scale 205, 270, 320 and 405 mm). Figure 3.14 shows the same free surface profiles at model scale, with the coordinate parallel to the sloping bed x' drawn horizontally, and with an exaggerated scale normal to the bed. Also shown are the free surface profiles for the equal first baffle arrangement. In the latter arrangement, there is a standing wave spanning the first three baffles at the 50-, 30- and 10-percentile low flows, whereas for the unequal baffle arrangement the standing wave is less evident at the two highest flow rates. The standing wave at the 50-percentile low flow for the unequal baffle arrangement may be responsible for the high velocities in Baffle Slot 3 mentioned in Section 4.1.13. Upstream of Baffle 1, at the 50-, 30- and 10-percentile flows, the flow is always deeper with the unequal baffle arrangement by an amount varying from about 4 mm to 15 mm at model scale, 20 to 75 mm at field scale. Only at the 90-percentile low flow are the water depths upstream of the first baffle slightly bigger with the equal baffle arrangement, becoming markedly so between the first two baffles, that is by about 10 mm model scale or 50 mm field scale. For both baffle arrangements, at the 10- and 30-percentile low flows, there is a standing wave downstream of Baffle 7, probably induced by the change in direction of the fish pathway at that baffle. The wave peaks for the two baffle arrangements are similar but out of phase, with the pair of wave peaks for the unequal baffle arrangement being located about one baffle space upstream of the other pair.
0 200 400 600 800 1000 12000
10
20
30
40
50
60
70
80
90
100
Coordinate parallel to weir x′ (mm)
Coo
rdin
ate
norm
al to
bed
y′ (
mm
)
Unequal Q10Equal Q10Unequal Q30Equal Q30Unequal Q50Equal Q50Unequal Q90Equal Q90Unequal baffle (starting at 120mm)Equal baffle (starting at 200mm)
Figure 3.14 Free-surface profiles on fish pathway shown in Figure 3.12, with equal and unequal baffle 1. Axes rotated and vertical scale expanded.
3.1.9
All 48 velocity distributions, in Slots 1 to 12 at the 90-, 50-, 30- and 10-percentile low flows, are reported by Servais (2006) for the unequal baffle arrangement. These velocity distributions show large variations between different slots at the same flow rate and between different flow rates at the same slot. Any trend in the velocity distributions with flow rate is subject to exceptions and difficult to discern. However, Figure 3.15,

22 Science Report – Low-cost modifications of the Crump weir to improve fish passage
showing at field scale the distributions in Slot 12 at the 90-, 50-, 30- and 10-percentile low flows, does illustrate a general tendency for the velocity distributions to become less favourable to fish passage as the flow rate increases from the 90-percentile to the 50-percentile low flow, and then to become more favourable with further increase through the 30- and 10-percentile low flows. Most combinations of slot number and flow rate reveal areas of the slot in which the velocity distributions fall below 1.1 m s–1 at field scale, the velocity criterion for successful fish passage discussed later in Section 4.1.2. Slot 13 was out of the range of the traverse gear and therefore no velocity distribution could be measured. However, Baffle 13 was drowned by even the lowest tailwater and it could therefore be inferred that velocity conditions in the slot would be at least as favourable as those further upstream. In Figure 3.15, the areas of the slots covered by the velocity distributions reflect the constraints upon the Pitot-tube traverse imposed by the different water depths at the two flows and their unsteadiness. At the 90-percentile low flow, only the bottom 60 per cent of the slot depth was measured, while at the 10-percentile low flow the measurements extended to some 150 per cent of the slot depth.
0 50 100 150 200 2500
50
100
150
200
250
300
350
238.9 mmSample Depth: 132.7mm
w (mm) [Δ w = 40 mm]
h (m
m)
[ Δ h
= 3
0.6
mm
]
Contour Interval =0.1 ms−1
0.6
0.7
0.7
0.8
0.9
0.9
1
1
1
1.1
1.1
1.1
1.2
1.2
1.2
1.3
1.3
1.3
1.4
1.4
1.4
1.5
1.5
(Baffle 11 water depth)
0 50 100 150 200 2500
50
100
150
200
250
300
350
244.1 mmSample Depth: 163.4mm
w (mm) [Δ w = 40 mm]
h (m
m)
[ Δ h
= 2
5.5
mm
]Contour Interval =0.1 ms−1
11.11.21.3
1.3
1.3
1.4
1.4
1.4
1.5
1.5
1.6
1.6
1.7
1.7
1.8
1.8
1.9
1.9
2
2
2.1
2.1
2.2
2.2
2.32.3
2.42.4
2.52.5
2.62.6
1.5
2.7
2.8
(Used Baffle 11 data!)
(a) 90-percentile (b) 50-percentile
0 50 100 150 200 2500
50
100
150
200
250
300
350
295.4 mmSample Depth: 204.0mm
1.2
1.2
1.2
1.3
1.3
1.3
1.4
1.4
1.4
1.4
1.5
1.51.5
1.5 1.6
1.61.6
1.6
1.7
1.7
1.7
1.8
1.8
1.8
1.8
1.9
1.9
1.9
1.9
2
2
2
2
1.1
1.1
1.1
2.1
2.1
1
1
1
2.2
2.2
2.3
2.3
0.9
0.9
2.1
2.1
2.42.5
2.2
2.6
0.8
2.3
2.7
2.4
h (m
m)
[ Δ h
= 3
2.3
mm
]
w (mm) [Δ w = 40 mm]
Contour Interval =0.1 ms−1
(Baffle 11 water data)
0 50 100 150 200 2500
50
100
150
200
250
300
350
1.3
1.3
1.3
1.3 1.4
1.4
1.4
1.4
1.51.5
1.5
1.6
1.6
1.6
1.7
1.7
1.7 1.8
1.8
1.8
1.8
1.9
1.9
1.9
1.9
2
2
2
2
2.12.1
2.1
1.2
1.2
1.21.
2
2.2
2.2
2.2
2.3
2.3
2.3
1.1 1.1
1.1
2.42.4
2.4
2.5
2.5
2.5
1
1
1
2.6
2.6
2.6
2.7
2.7
0.9
0.9
2.8
2.8
0.8 0.8
2.9
1.51.6
2.5
32.9
1.7
2.6
1.8
3
2.7
2
h (m
m)
[ Δ h
= 4
0.7
mm
]
w (mm) [Δ w = 40 mm]
Contour Interval =0.1 ms−1
(Baffle 11 water level)
(a) 30-percentile (b) 10-percentile
Figure 3.15 Velocity distributions in Baffle Slot 12, at the 90-, 50-, 30- and 10-percentile low flows (green ≤ 1.1 m s–1, 1.1 m s–1 < yellow ≤ 2.0 m s–1, red > 2.0 m s–1)

Science Report – Low-cost modifications of the Crump weir to improve fish passage 23
3.1.10
In the Perspex baffle arrangement, two sizes of Baffle 1 were tested, 24 mm high and 40 mm high, and in each case the baffle was located with d/l = 0.2. As already mentioned in Section 3.1.8, for both sizes of Baffle 1 and for all four flow rates Figure 3.14 shows the free surface profiles on the fish pathway in Figure 3.12. For the 90-percentile low-flow, Figure 3.16 shows the velocity distributions at the slot of Baffle 1, for both baffle sizes, and the corresponding velocity distributions at Baffle 2. Servais (2006) reports the corresponding results at the 50-, 30- and 10-percentile low flows. Figure 3.17 shows for both sizes of Baffle 1 the velocity profiles normal to the bed at two stations, at the crest and between the crest and Baffle 1 at the position of minimum depth of flow, both for the 50-percentile low flow.
0 50 100 150 200 2500
50
100
150
200
250
300
350
170.7 mmSample Depth: 94.3mm
w (mm) [Δ w = 37 mm]
h (m
m)
[ Δ h
= 2
1 m
m]
Contour Interval =0.1 ms−1
0.6
0.70.8
0.80.9
0.9
0.9
1 1
1
1.1
1.1
1.21.3
1.1
0 50 100 150 200 2500
50
100
150
200
250
216.5 mmSample Depth: 137.9mm
w (mm) [Δ w = 22.9 mm]
h (m
m)
[ Δ h
= 2
1.2
mm
]
Contour Interval =0.1 ms−1
1
1.1
1.1
1.2
1.2
1.2
1.3
1.3
1.3
1.4
1.41.51.6
1.7
a) Baffle 1 (unequal) b) Baffle 1 (equal)
0 50 100 150 200 2500
50
100
150
200
250
300
350
219.5 mmSample Depth: 132.7mm
w (mm) [Δ w = 40 mm]
h (m
m)
[ Δ h
= 3
0.6
mm
]
Contour Interval =0.1 ms−1
0.7
0.7
0.7
0.8
0.8
0.8
0.9
0.9
0.9
0.9
1
1
1.1
0.6
0.6
0.6
1.2
1.20.5
0.5
11
0.4
0.4
1.1
1.3
1.2
0.3
1.3
0.2
0 50 100 150 200 2500
50
100
150
200
250
300
350
231.9 mmSample Depth: 163.4mm
w (mm) [Δ w = 40 mm]
h (m
m)
[ Δ h
= 2
5.5
mm
]
Contour Interval =0.1 ms−1
0.7
0.80.8
0.90.9
0.9
11
11
1.1
1.1
1.1
1.1
1.1
1.2
1.2
1.2
1.2
1
c) Baffle 2 (unequal) d) Baffle 2 (equal)
Figure 3.16 Velocity distributions in Baffle Slots 1 and 2, at the 90-percentile low flow, for two sizes of Baffle 1 (green ≤ 1.1 m s–1, 1.1 m s–1 < yellow ≤ 2.0 m s–1)

24 Science Report – Low-cost modifications of the Crump weir to improve fish passage
3.1.11
Figure 3.18 shows the velocity distributions in Slot 11 at the 90-, 50-, 30- and 10-percentile low flows, with the flume tilted to give a downstream slope on the weir of 1:4.55 (Section 2.2.2.9). The measurements were taken with the smaller 24 mm high Baffle 1 in place, because this arrangement was thought to be more beneficial to fish passage. Also shown in Figure 3.18 are the velocity distributions in Slot 11 with the standard downstream slope of 1:5. For the tilted flume, Servais (2006) reports the velocity distributions in all of the slots at the 50-percentile low flow rate.
0 0.2 0.4 0.6 0.8 1 1.2 1.4 1.6 1.8 2
0
50
100
150
Velocity (ms−1)
Coo
rdin
ate
norm
al to
bed
y ′
(mm
)
Velocity at crestVelocity at minimum depth
0 0.2 0.4 0.6 0.8 1 1.2 1.4 1.6 1.8 2
0
50
100
150
Velocity (ms−1)
Coo
rdin
ate
norm
al to
bed
y ′
(mm
)
Velocity at crestVelocity at minimum depth
a) 50-percentile: Unequal baffles 1 and 2 b) 50-percentile: equal baffles 1 and 2
Figure 3.17 Comparison of velocity distributions at crest and at flow minimum depth for unequal and equal sizes of baffle 1
0 50 100 150 200 2500
50
100
150
200
250
300
350
238.9 mmSample Depth: 132.7mm
w (mm) [Δ w = 40 mm]
h (m
m)
[ Δ h
= 3
0.6
mm
]
Contour Interval =0.1 ms−1
0.3
0.4
0.5
0.6
0.6
0.7
0.7
0.8
0.8 0.
9
11
1
1.1
1.1
1.11.2 1.
2
1.1
1.2
0 50 100 150 200 2500
50
100
150
200
250
300
350
239.9 mmSample Depth: 132.7mm
w (mm) [Δ w = 40 mm]
h (m
m)
[ Δ h
= 3
0.6
mm
]
Contour Interval =0.1 ms−1
0.40.5
0.7
0.8
0.80.9
1
1
1.1
1.1
1.1
1.1
1.2
1.2
1.2
1.3
1.3
1.2
1.2
(a) 1:5 90-percentile b) 1:4.55 90-percentile

Science Report – Low-cost modifications of the Crump weir to improve fish passage 25
0 50 100 150 200 2500
50
100
150
200
250
300
350
244.1 mmSample Depth: 127.5mm
w (mm) [Δ w = 40 mm]
h (m
m)
[ Δ h
= 2
9.3
mm
]
Contour Interval =0.1 ms−1
0.30.40.50.60.70.8 0.91
1.11.2 1.2
1.3
1.3
1.4
1.4
1.5
1.5
1.6
1.6
1.6
1.7
1.7
1.7
1.8
1.8
1.81.9
1.9
2
2
1.9
2.12.1 2.2
2.2
2
2.3
0 50 100 150 200 2500
50
100
150
200
250
300
350
242.8 mmSample Depth: 153.0mm
w (mm) [Δ w = 40 mm]
h (m
m)
[ Δ h
= 3
5.6
mm
]
Contour Interval =0.1 ms−1
0.30.40.50.60.70.80.911.1
1.21.3 1.31.4 1.4
1.51.5
1.6
1.6
1.6
1.7
1.7
1.7
1.8
1.8
1.8
1.9
1.91.9
1.9
2
2
2.1
2.1 2
2
2.2
2.3
2.1
2.4
2.2
2.5
2.1
2.6
c) 1:5 50-percentile d) 1:4.55 50-percentile
0 50 100 150 200 2500
50
100
150
200
250
300
350
295.4 mmSample Depth: 254.9mm
w (mm) [Δ w = 40 mm]
h (m
m)
[ Δ h
= 4
0.7
mm
]
Contour Interval =0.1 ms−1
0.9
1
1
11.1
1.1
1.1
1.2
1.2
1.2
1.3
1.3
1.3
1.4
1.4
1.4
1.5
1.5
1.5
1.6
1.61.6
1.6
1.7
1.7
1.7
1.8
1.8 1.8
1.9
1.9
1.9
1.9
2
22
2
2.1
2.1
2.1
2.1
2.2
2.22.2
2.2
2.3
2.3
2.3
2.3
2.4
2.4
2.42.42.5
2.52.6 2.62.7 2.72.8 2.82.9 2.93
33
2.5
1.7
3.1
0 50 100 150 200 2500
50
100
150
200
250
300
350
298.4 mmSample Depth: 204.0mm
w (mm) [Δ w = 40 mm]
h (m
m)
[ Δ h
= 3
2.3
mm
]
Contour Interval =0.1 ms−1
1.1
1.1
1.1
1.2
1.2
1.2
1.3
1.3
1.3
1.4
1.4
1.4
1.51.5
1.5
1.6
1.6
1.61.7
1.7
1.7
1.8
1.8
1.8
1.9
1.9
1.9
2
2
2
2
2.1
2.1
2.1
2.1
2.2
2.2
2.2
2.2
2.3
2.3
2.3
2.3
2.4
2.4
2.4
1
1
12.5
2.5
2.6
2.6
0.9
0.9
2.7
0.8
1.6
e) 1:5 30-percentile f) 1:4.55 30-percentile
0 50 100 150 200 2500
50
100
150
200
250
300
350
w (mm) [Δ w = 40 mm]
h (m
m)
[ Δ h
= 4
2.5
mm
]
Contour Interval =0.1 ms−1
1
1.1
1.1
1.1
1.2
1.2
1.2
1.3
1.3
1.3
1.4
1.4
1.4
1.5
1.5
1.5
1.6
1.6
1.6
1.6
1.7
1.7
1.7
1.8
1.8
1.8
1.8
1.9
1.9
1.9
1.9
2
2
2
2
2.1
2.1
2.12.1
2.2
2.2
2.2
2.3
2.3
2.3
2.4
2.4
2.5
2.5
2.6
2.62.7
2.72.8
2.8
11
1
2.9
2.93
33
0.9
0.9
3.13.1
2.2
3.2
0.8
2.4
2.32.4
3.3
2.5
2.5
0 50 100 150 200 2500
50
100
150
200
250
300
350
1.2
1.2
1.2
1.41.4
1.4
1.6
1.6
1.6
1.8
1.8
1.8
2
2
2
2
2.2
2.2
2.2
2.42.4
2.4
2.6
2.6
2.6
2.8
2.8
1
1
1
33
3
3.23.2
2.4
3.4
1.6
0.8
h (m
m)
[ Δ h
= 4
0.7
mm
]
w (mm) [Δ w = 40 mm]
Contour Interval =0.1 ms−1
g) 1:5 10-percentile h) 1:4.55 10-percentile
Figure 3.18 Velocity distributions in Baffle Slot 11, at the 90-, 50-, 30- and 10-percentile low flows, without and with the flume tilted (green ≤ 1.1 m s–1, 1.1 m s–1 < yellow ≤ 2.0 m s–1, red > 2.0 m s–1)

26 Science Report – Low-cost modifications of the Crump weir to improve fish passage
3.1.12
The tendency to trap debris increased with decreasing flow rate, with the 90-percentile low flow presenting a serious problem for all three types of trash modelled. Increasing the discharge to the 50-percentile low flow gave free passage over the baffles to all but one or two of the dowels in each experiment, and to all of the plastic bags. At that flow rate, only the tree structures presented a serious problem which was mitigated by the 30-percentile low flow and almost completely removed by the 10-percentile low flow. At the 10-percentile low flow, no dowels or plastic bags were trapped. Servais (2006) reports in detail on the experiments.
3.2 Hydrometric effect
0 50 100 1500
10
20
30
40
50
60
70
Total head, H (mm)
Dis
char
ge, Q
(l/s
)
BS3680−4B:1986Measurements
Figure 3.19 Modular flows over unmodified weir: total head–discharge measurements
3.2.1
Figure 3.19 shows the results of the stage–discharge measurements described in Section 2.2.3.2 for the unmodified weir under modular flow conditions. The rms (root

Science Report – Low-cost modifications of the Crump weir to improve fish passage 27
mean square) discrepancy in flow rate between the model data and the British Standards equation (British Standards Institution 1986) was only 0.54 per cent.
3.2.2
The results of the single-baffle tests, carried out under modular flow conditions on five sizes of baffle with d/l = 0.2 (Section 2.2.3.3), are shown in Figure 3.20 in which the measurements are plotted non-dimensionally. Figure 3.21 shows the complete set of single-baffle results for the range of d/l = 0.24, 0.2, 0.183, 0.167, 0.133, 0.1 and 0.067.
0 1 2 3 4 5 6 70.6
0.65
0.7
0.75
0.8
0.85
0.9
0.95
1
H1/d
Q/Q
BS =
Cd/C
d BS
(1.772, 0.978)
Baffle: 20mm Orifice: 109.91mmBaffle: 30mm Orifice: 109.91mmBaffle: 40mm Orifice: 61.95mmBaffle: 40mm Orifice: 109.91mmBaffle: 50mm Orifice: 109.91mmBaffle: 60mm Orifice: 61.95mmBaffle: 60mm Orifice: 109.91mmEquations 3 and 4
Figure 3.20 Modular flows over weir modified with single baffle, d/l = 0.2: non-dimensional total head–discharge results
3.2.3
The results of the two-baffle tests, under modular flow conditions for d1/l1 = 0.2 and identical baffle heights, d1/d2 = 1 (d1 = d2 = 20 mm), described in Section 2.2.3.4, are shown in Figure 3.22, which includes the results of a single baffle installation for comparison. Figure 3.23 shows the results of the two-baffle tests for different sized baffles, with d1/l1 = d2/l2 = 0.2, d1/d2 = 0.5 and d1/d2 = 0.6, including the single-baffle data for comparison. Figure 3.24 shows the test results with the complete Perspex fish pass installed, together with the results of the double-baffle test having the same baffle heights as the first two baffles in the fish pass (d1 = 24 mm and d2 = 40 mm: d1/d2 = 0.6), and the results for the single baffle. Discussion of the double-baffle arrangements occurs in Sections 4.2.9 to 4.2.13

28 Science Report – Low-cost modifications of the Crump weir to improve fish passage
3.2.4
For non-modular flow conditions, Figure 3.25 shows the hydrometric results for the unmodified weir, plotted non-dimensionally as head ratio against drowned flow reduction factor. There are two graphs, representing the two sets of measurements based on the static heads h2 in the tailwater and hp at the crest respectively.
3.2.5
Similarly, Figure 3.26, for non-modular flow conditions and the single-baffle modification, shows two graphs corresponding to the two static heads h2 and hp. However, with the complete Perspex fish pass in position the crest tappings were inaccessible (Sections 2.2.2.4 and 2.2.3.8) and so hp was not measured. Therefore Figure 3.27, for non-modular flows with the Perspex fish pass modification in place, shows only the one graph corresponding to the tailwater head measurements h2.
0 1 2 3 4 5 6 70.6
0.65
0.7
0.75
0.8
0.85
0.9
0.95
1
H1/d
Q/Q
BS =
Cd/C
d BS
H1/d =1.68
0.24
0.2
0.183
0.167
0.133
0.1
0.067
Figure 3.21 Modular flows over weir modified by single baffle, 0.24 ≥ d/l ≥ 0.067: non-dimensional total head–discharge results

Science Report – Low-cost modifications of the Crump weir to improve fish passage 29
0 1 2 3 4 5 6 70.6
0.65
0.7
0.75
0.8
0.85
0.9
0.95
1
H1/d
1
Q/Q
BS =
Cd/C
d BS
(1.793 , 0.972)
(1.977 , 0.966)
d1/d2 = N/A : 20mm single baffle
d1/d2 = 1: 20mm + 20mm baffles
Figure 3.22 Modular flows over weir modified by two-baffle arrangement (d1/l1 = 0.2, d1/d2 = 1) compared with single baffle modification: non-dimensional total head–discharge results

30 Science Report – Low-cost modifications of the Crump weir to improve fish passage
0 1 2 3 4 5 6 70.6
0.65
0.7
0.75
0.8
0.85
0.9
0.95
1
H1/d
Q/Q
BS =
Cd/C
d BS
P1
P1 = (1.793 , 0.972)
P2
P2 = (1.064 , 0.888)
P3
P3 = (2.255 , 0.882)
d1/d2 = N/A : 20mm single baffle
d1/d2 = 0.60: 24mm + 40mm baffles
d1/d2 = 0.50: 20mm + 40mm baffles
Figure 3.23 Modular flows over weir modified by two-baffle arrangement (d1/l1 = d2/l2 = 0.2, d1/d2 = 0.5 and d1/d2 = 0.6), compared with single baffle modification: non-dimensional total head–discharge results

Science Report – Low-cost modifications of the Crump weir to improve fish passage 31
0 1 2 3 4 5 6 70.6
0.65
0.7
0.75
0.8
0.85
0.9
0.95
1
H1/d
Q/Q
BS =
Cd/C
d BS
P1
P2
P1 = (0.99, 0.907)
P2 = (2.281, 0.876)
d1/d2 = N/A: 20mm single baffle
d1/d2 = 0.60: 24mm + 40mm baffles
d1/d2 = 0.60: Fish pass (24+40+...)
Equations 5 to 7
Figure 3.24 Modular flows over weir modified by two-baffle arrangement and complete Perspex fish pass (d1/l1 = d2/l2 = 0.2, d1/d2 = 0.6), compared with single baffle modification: non-dimensional total head–discharge results

32 Science Report – Low-cost modifications of the Crump weir to improve fish passage
0.3 0.4 0.5 0.6 0.7 0.8 0.9 10.55
0.6
0.65
0.7
0.75
0.8
0.85
0.9
0.95
1
1.05
f = Q/Qmodular
H2/H
1
f = 1Equations 8 and 9Standard Crump
(a)
0.3 0.4 0.5 0.6 0.7 0.8 0.9 10.2
0.3
0.4
0.5
0.6
0.7
0.8
0.9
1
f= Q/Qmodular
h p/H1
Equation 10Standard Crump
(b)
Figure 3.25 Non-modular flows over unmodified weir: results plotted non-dimensionally, as head ratios (a) H2/H1 and (b) hp/H1 against drowned flow reduction factor f

Science Report – Low-cost modifications of the Crump weir to improve fish passage 33
0.3 0.4 0.5 0.6 0.7 0.8 0.9 10.55
0.6
0.65
0.7
0.75
0.8
0.85
0.9
0.95
1
1.05
f = Q/Qmodular
H2/H
1
f = 1Equations 8 and 9Standard CrumpSingle baffle
(a)
0.3 0.4 0.5 0.6 0.7 0.8 0.9 10.2
0.3
0.4
0.5
0.6
0.7
0.8
0.9
1
f= Q/Qmodular
h p/H1
Equation 10Standard CrumpSingle baffle
(b)
Figure 3.26 Non-modular flows over weir modified with single baffle, d/l = 0.2: results plotted non-dimensionally, as head ratios H2/H1 and hp/H1 against drowned flow reduction factor f

34 Science Report – Low-cost modifications of the Crump weir to improve fish passage
0.3 0.4 0.5 0.6 0.7 0.8 0.9 10.55
0.6
0.65
0.7
0.75
0.8
0.85
0.9
0.95
1
1.05
f = Q/Qmodular
H2/H
1
f = 1Equations 8 and 9Standard CrumpSingle baffleQ1 perspex fish passQ2 perspex fish pass
Figure 3.27 Non-modular flows over weir modified by complete Perspex fish pass, compared with single baffle modification: results plotted non-dimensionally, as head ratio H2/H1 against drowned flow reduction factor f (Q1 and Q2 defined in notation and applied in Sections 2.2.3.8 and 4.2.17)

Science Report – Low-cost modifications of the Crump weir to improve fish passage 35
4 Analysis and discussion
4.1 Modifications for fish passage
4.1.1
As described in Section 2.2.2.1, at the early trials stage the matter of adequate water depth for fish passage was mostly treated by visual inspection: if the free surface profile on the fish pathway through the slots was about as high as or higher than the crests of the baffles, that was deemed satisfactory. Detailed measurements of the free surface profile were reserved for the favoured solution modelled later in Perspex.
4.1.2
For the spot measurements by velocity propeller meter, described in Section 2.2.2.1, the adopted criterion for fish passage was that the velocity measured at model scale should be less than 0.5 m s–1 (1.1 m s–1 at field scale). This was deduced from the fish swimming speed database (Environment Agency 2003), in which it was found that most freshwater fish greater than 100 mm in body length had a burst speed capability in excess of 1.1 m s–1. Accordingly, a trial baffle arrangement was rejected if the spot measurements of velocity substantially exceeded that criterion.
4.1.3
Among the trial arrangements using LEGO-brick baffles, the first to be investigated was the centre channel geometry (Figure 3.1). Unlike the cursory inspections of the other arrangements, this geometry was subjected to more detailed study for the purposes of developing and testing the wave-probe instrumentation for later free-surface profile measurement. Also, more detailed velocity profiles were measured using the Pitot and static tube combination, in this case with the tubes displaced transversely at the same elevation (Servais et al. 2003). The field-scale average water depth of 180 mm, on the fish pathway through the slots, reported in Section 3.1.2 would have been adequate, but the axial distribution of the maximum velocity in the central channel, at field scale accelerating from 1.1 m s–1 at the first baffle slot to greater than 2.9 m s–1 downstream, was prohibitive to most freshwater fish species. For that reason, the centre channel geometry was rejected as a potential solution. It was surprising that the water depth in the central channel remained nearly constant along its length, whilst the maximum velocity almost trebled between the upstream and downstream extremities. This showed that the volumetric flow rate through the central channel was increasing in the downstream direction, continuously augmented by transverse flow.
4.1.4
At field scale, the face-to-face baffle spacing of 320 mm (64 mm at model scale) that produced the optimum flow depth in the centre channel geometry would be sufficient to accommodate many species and sizes of adult freshwater fish, sheltering behind the baffles with sufficient room in which to turn. In the oblique and V-channel
36 Science Report – Low-cost modifications of the Crump weir to improve fish passage
arrangements discussed later, optimum flow depths were achieved by the same baffle spacing, providing the same benefit in terms of shelter.
4.1.5
In Section 3.1.3, a brief description is given of the principles behind the design and operation of the baulk, and our very limited investigation of that arrangement is reported. The baulk concept was initially attractive because of its simplicity and, but for the notch in the weir crest, its otherwise low cost. However, other considerations rendered it unsuitable as a low-cost modification to the Crump weir. In the baulk design reported by Fort and Brayshaw (1961), because of the very wide aspect ratio of the downstream face of their weir, the enhancing baulk blocked only a portion of their weir crest, the rest of the crest being free to discharge. Consequently, only part of their weir flow would have issued through the notch and onto the oblique baulk. In contrast, the Brimpton model would have required an enhancing baulk full-width (except at the notch), forcing all of the flow onto the top end of the oblique baulk. As well as the major impact upon the hydrometric function, the high velocities down the baulk would have rendered it impassable to fish.
4.1.6
Therefore, in this study the enhancing baulk was replaced by rows of baffles subject to overtopping even at low flows (Figure 3.1), in an effort to mitigate the hydrometric effect and to distribute the flow onto the oblique baulk. That arrangement still afforded some shelter to the oblique baulk flow by removing momentum flux from the weir flow. It also reduced the baulk flow velocity by reducing the slot flow and adding weir flow more evenly along the baulk. However, the structure that had evolved by this stage was quite different from the traditional baulk, and now resembled the oblique channel arrangement. Consequently, although the maximum velocity of 0.65 m s–1 (1.5 m s–1 at field scale) measured on the baulk might have been reduced to an acceptable value by finely adjusting the baffle arrangement, it was considered more fruitful to abandon the baulk concept in favour of the oblique channel and its derivative, the V-channel.
4.1.7
For the oblique channel, as shown in Figures 3.4 and 3.5, increasing the stagger with a constant slot width reduced the velocities distributed along the fish pathway through the slots. The mechanism was two-fold. Firstly, with increasing stagger, each slot received a diminishing proportion of its flow directly from the slot immediately upstream and an increasing proportion from the flow overtopping the upstream baffle. Secondly, with increasing stagger, a higher proportion of the flow issuing from a slot impinged upon the baffle immediately downstream. Both mechanisms, associated with abrupt discontinuities in the alignment of the solid boundary relative to the flow, created regions of flow separation which drained energy flux from the fish pathway flow at relatively low mean velocities.
4.1.8
As shown in Figures 3.7 and 3.8, increasing the slot width from 32 to 48 mm also reduced the velocities distributed along the fish pathway, measured in the plane of each slot. That was partly because the baffle arrangements in Figure 3.7 each had a stagger identically equal to the slot width, and therefore increasing the slot width

Science Report – Low-cost modifications of the Crump weir to improve fish passage 37
increased the obliqueness of the fish pathway which diminished its gradient. Also, it was evident that each slot flow was driven by the upstream head alone or by its differential head relative to that downstream. The upstream head was controlled by the weir flow over the baffle in which the slot was located. A wider slot carried a larger proportion of the flow and therefore reduced the head on the baffle, thus reducing the velocity through the slot.
4.1.9
As stated in Section 3.1.5, increasing the stagger in the oblique channel was limited by the aspect ratio (channel width/length of glacis) of the downstream face of the weir. However, by reflecting the fish pathway about the side wall, the oblique angle was preserved in a new arrangement referred to here as the V-channel. The V-channel thus consisted of a fundamental arrangement that could accommodate any number of reflections of the fish pathway, from zero (the oblique channel) upwards. Two observations are pertinent here:
1. A reflection of the fish pathway was effective in checking the flow velocity and so, if the velocity criterion for fish passage had not been exceeded anywhere upstream of a reflection, the whole fish pathway would comply.
2. The slot-flow accelerations in the downstream direction were negligible around Baffles 5, 6 and 7 and, at a similar stage downstream of the reflection, at Baffles 11 and 12. Consequently, it is likely that the velocity criterion would still be met if in a wider weir the number of baffles between the crest and the first reflection (or between reflections) exceeded the number used in this study.
Thus, the V-channel arrangement offers the prospect of a low-cost solution to the fish passage problem at Crump weirs, applicable not only to Brimpton but more widely. The solution had still to be adjusted in terms of the slot width and stagger that would best comply with the velocity criterion, but thereafter could be accommodated in any Crump weir by including as many reflections of the fish pathway as necessary to provide a suitable entry point for the fish. For a weir of wide enough aspect ratio, no reflection of the fish pathway would be necessary, the arrangement thus corresponding to the straight oblique channel.
4.1.10
As stated in Section 3.1.7, the V-channel development culminated in the LEGO arrangement of Figure 3.9. By that stage the provision of a second narrow channel had been rejected for the reasons given in Section 3.1.6. The baffle arrangement substantially adopted as the preferred solution (though with two sizes of the first baffle, 24 and 40 mm, yet to be tested) was then fabricated in Perspex as described in Sections 2.2.2.4 and 3.1.7.
Table 4.1 Fineness ratios for a range of freshwater fish (eel and salmon from Turnpenny 1981; chub, dace, roach, trout and bream from Clough 2003)
Species Fineness Ratio F
Roach 3.51 Dace 4.83 Chub 4.39 Brown trout 4.37

38 Science Report – Low-cost modifications of the Crump weir to improve fish passage
Species Fineness Ratio F
Grayling* 2.99 Bream 2.99 Elvers 16 Eel 16 *Set equal to F for bream
4.1.11
Unlike the cursory inspections of water depth in most of the LEGO-brick baffle arrangements, for the Perspex model detailed free-surface profiles were measured as reported in Sections 2.2.2.8 and 3.1.8 and illustrated in Figure 3.13 (24 mm high first baffle) and Figure 3.14 (24 and 40 mm high first baffles). According to Hertel (1969), a fish is subjected to the minimum wave drag when its centre of gravity is immersed to a depth of greater than three times its body diameter (idealized as a circular cross-section). That would correspond to a water depth of greater than about three and a half times its body diameter. The minimum water depth averaged along the fish pathway between Baffles 1 and 12 occurred at the 90-percentile low flow, for example in Figure 3.13 with a value of 41 mm at model scale equivalent to 205 mm at field scale. The latter water depth would allow minimum drag conditions for fish body diameters of less than 59 mm and provide possible swimming conditions, though less than optimum, for body diameters of up to about 200 mm, which is 50 mm less than the slot width. According to the relationship for salmonids between maximum cross-sectional area A and body length L,
(1) 2 02182.0 LA =
cited by Beach (1984), the respective fish body diameters would correspond to body lengths of 350 mm and 1,200 mm. Assuming Equation 1 to approximate for most freshwater fish, adequate water depths for minimum drag would thus be available to all sizes of roach, dace, chub, brown trout, bream, barbel and smelt and to most grayling, at the 90-percentile low flow. For eels and elvers, the body length is about 16 times the diameter (Cihar 1998) and minimum drag conditions would apply to all sizes, at the 90-percentile low flow. At the 50-percentile (median) low flow, the corresponding average water depth was 270 mm at field scale, providing minimum drag conditions for body diameters of less than 77 mm or body lengths of less than 460 mm, thus accommodating the largest grayling. Less than optimum swimming conditions could be exploited by yet larger fish, though constrained by the slot width of 250 mm. It was therefore concluded that the proposed modifications provided adequate water depths for fish passage in all flows equal to or exceeding the 90-percentile low flow.
4.1.12
The velocity criterion for fish passage adopted in the early trials using propeller meter spot measurements was 0.5 m s–1 or 1.1 m s–1 at field scale (Section 4.1.2). As illustrated by the examples in Figure 3.15, for the Perspex model more detailed velocity distributions were obtained in each slot, and the fish passage velocity criterion was modified accordingly. Rather than employing a single threshold velocity, the whole fish swimming speed database (Environment Agency 2003) was used, including its temperature dependence (at 10 °C and 15 °C). Fish passage through a slot, by a particular species, of a specified size, at a prescribed temperature, was deemed possible:

Science Report – Low-cost modifications of the Crump weir to improve fish passage 39
a) if an area within the slot could be found that enclosed a group of velocity measurements equal to or less than the burst swimming speed of the fish;
b) if that area exceeded the maximum cross-sectional area of the fish.
This critical area was calculated at each slot as a fraction of the slot area over which velocities had been measured. The fraction was defined as the ratio of the number of velocity measurements less than the burst speed to the total number of velocity measurements taken at the slot. The ratio thus approximated the proportion of the velocity-mapped slot area that would allow a given species and size of fish to pass upstream. The critical slot area was then compared with the fish cross-sectional area. This was assumed to be circular of radius R cm, where
(2) 2.1656.0209.0 FL
LR
++=
and L, the body length, is in cm. F is called the species fineness ratio and values are given in Table 4.1. Equation 2 was originally derived by Turnpenny (1981) for the calculation of the free gap size R that would be required in a mesh or bar screen to exclude a fish of length L. The present application was an adaptation by the authors, which for salmon gave a slightly smaller estimate of the fish cross-sectional area than Equation 1.
3456789
10121517202223253035 Pass38 Fail55 N/A78
Roach Dace Chub Btrout G_Ling Bream Barbel Smelt Elvers Eels
KEY
Fish Species
Fish
leng
th [m
m]
3456789
10121517202223253035 Pass38 Fail55 N/A78
Roach Dace Chub Btrout G_Ling Bream Barbel Smelt Elvers Eels
KEY
Fish Species
Fish
leng
th [m
m]
a) 10 °C b) 15 °C
Figure 4.1 Matrices for the 90-percentile low flow with the 24 mm high Baffle 1

40 Science Report – Low-cost modifications of the Crump weir to improve fish passage
3456789
10121517202223253035 Pass38 Fail55 N/A78
Roach Dace Chub Btrout G_Ling Bream Barbel Smelt Elvers Eels
KEY
Fish Species
Fish
leng
th [m
m]
3456789
10121517202223253035 Pass38 Fail55 N/A78
Roach Dace Chub Btrout G_Ling Bream Barbel Smelt Elvers Eels
KEY
Fish Species
Fish
leng
th [m
m]
a) 10 °C b) 15 °C
Figure 4.2 Matrices for the 50-percentile low flow with the 24 mm high Baffle 1
3456789
10121517202223253035 Pass38 Fail55 N/A78
Roach Dace Chub Btrout G_Ling Bream Barbel Smelt Elvers Eels
KEY
Fish Species
Fish
leng
th [m
m]
3456789
10121517202223253035 Pass38 Fail55 N/A78
Roach Dace Chub Btrout G_Ling Bream Barbel Smelt Elvers Eels
KEY
Fish Species
Fish
leng
th [m
m]
a) 10 °C b) 15° C
Figure 4.3 Matrices for the 30-percentile low flow with the 24 mm high baffle 1
3456789
10121517202223253035 Pass38 Fail55 N/A78
Roach Dace Chub Btrout G_Ling Bream Barbel Smelt Elvers Eels
KEY
Fish Species
Fish
leng
th [m
m]
3456789
10121517202223253035 Pass38 Fail55 N/A78
Roach Dace Chub Btrout G_Ling Bream Barbel Smelt Elvers Eels
KEY
Fish Species
Fish
leng
th [m
m]
a) 10 °C b) 15 °C
Figure 4.4 Matrices for the 10-percentile low flow with the 24 mm high Baffle 1

Science Report – Low-cost modifications of the Crump weir to improve fish passage 41
4.1.13
The results of this analysis were displayed in two-dimensional matrix format, shown for example in Figure 4.1 which indicates the combination of fish species and length that satisfies the velocity criterion (black rectangles), the combination that does not (grey rectangles) and the combination for which no data were available (white rectangles). The set of matrices shown in Figures 4.1, 4.2, 4.3 and 4.4 was produced for the combined effect of Baffles 1 to 12, with one matrix for each flow rate and temperature. In Figure 4.2, the low incidence of favourable swimming conditions reflects the adverse velocity field measured in the slot of Baffle 3 at the 50-percentile low flow. At the 90-, 30- and 10-percentile low flows, Figures 4.1, 4.3 and 4.4 show that, except for elver, all of the fish species in the Swimit database (Environment Agency 2003), over a wide range of sizes, could theoretically pass between Baffles 1 and 12.
4.1.14
According to Larinier (1992), the fish burst speed is that which requires such effort that it can be sustained only for a limited period, from seconds to tens of seconds, depending on the fish length and the water temperature. Solomon and Beach (2004) are more prescriptive and define for the burst speed duration a rule of thumb of 20 seconds (also Environment Agency 2001b). For a fish to ascend through all the baffle slots without interruption, given a burst speed sustainable for 20 s, it would have to travel the necessary distance (L say) at a speed in excess of the average local current velocity by an amount ΔV, where 20/LV =Δ . For the velocity criteria used in the matrices, that would be within the capabilities of many of the larger fish on many of the Crump weirs in England and Wales. For example, below the low weir at Brimpton, L ≈ 8.0 m and therefore ΔV ≈ 0.4 m s–1. In a flow that met the original velocity criterion of 1.1 m s–1 at field scale, fish with a burst speed in excess of 1.5 m s–1 could therefore ascend continuously from the tailwater up to Baffle 1. However, fish with a lower burst speed that still exceeded 1.1 m s–1 would have to rest at intervals and make progress intermittently. During such intervals, the fish could hold in the shelter of the inter-baffle spaces which would provide a low current-velocity and enough room in which to turn.
4.1.15
Determination of the position and height of Baffle 1 involves a compromise between maximizing fish passage and minimizing the hydrometric effect. The nearer to the crest its location, and up to a certain limit the higher the baffle, the better it is for fish passage. However, such conditions affect the weir discharge coefficient and force the stage–discharge relationship to diverge from the British Standard. Also, there is an associated increase in the weir afflux, which can impact land and surface-water drainage upstream. Given those considerations, we thought that the crest of Baffle 1 ought not to be substantially higher than the crest of the Crump weir, and consequently chose to study the limiting case of d/l = 0.2, in which the crest of Baffle 1 was nominally at weir crest level. Actually, with d/l = 0.2, the highest point of Baffle1 was located above the weir crest by an amount Δ = 3.88 × 10⁻³ × d, for the baffle cross-section with thickness w = d/2.5.
4.1.16
Baffle 1 was modelled with d/l = 0.2, using firstly the adopted standard 40 mm high baffle (200 mm at field scale) and then secondly a smaller 24 mm high baffle (120 mm at field scale). Thus, both 24 mm and 40 mm high baffles were installed at different

42 Science Report – Low-cost modifications of the Crump weir to improve fish passage
times as Baffle 1, together with the rest of the baffle arrangement in the Perspex model. In Figure 3.14, at the 50-, 30- and 10-percentile low flows, the 24 mm Baffle 1 produced a greater depth between itself and the crest, the extra depth being approximately 4 mm to 12 mm (20 mm to 60 mm at field scale). Only at the 90-percentile low flow was the water depth upstream of Baffle 1 slightly greater with the 40 mm baffle. However, that is significant because at the 90-percentile low flow fish swimming conditions are especially challenging and such extra depth is the more beneficial. Moreover, at the 90-percentile low flow, the water depths at the crest were identical for both sizes of Baffle 1, implying identical discharge coefficients at that flow.
4.1.17
On the other hand, when the velocity contours in the slots of Baffles 1 and 2 are compared at the 90-percentile low flow (Figure 3.16), more favourable conditions are produced by the 24 mm baffle: in that case Baffle 2, at the same location as the 40 mm Baffle 1, has the better velocity distribution at that location and also the 24 mm baffle imposes a favourable velocity distribution much nearer to the crest. Figure 3.17 shows velocity distributions normal to the bed on a vertical plane through the longitudinal axis of the first slot, at the field-scale 50-percentile low flow. In that case there is little difference in effect: at the crest, the smaller Baffle 1 provides slightly more favourable conditions, while at the minimum depth just downstream of the crest the larger baffle gives the slightly better velocity distribution.

Science Report – Low-cost modifications of the Crump weir to improve fish passage 43
0 0.2 0.4 0.6 0.8 1 1.2 1.4 1.6 1.8 2
0
20
40
60
80
100
120
Velocity (ms−1)
Coo
rdin
ate
norm
al to
bed
y ′
(mm
)
Velocity at crestVelocity at min depth
0 0.2 0.4 0.6 0.8 1 1.2 1.4 1.6 1.8 2
0
20
40
60
80
100
120
Velocity (ms−1)
Coo
rdin
ate
norm
al to
bed
y ′
(mm
)
Velocity at crestVelocity at minimum depth
a) 90-percentile b) 50-percentile
0 0.2 0.4 0.6 0.8 1 1.2 1.4 1.6 1.8 20
50
100
150
200
250
300
350
Velocity (ms−1)
Coo
rdin
ate
norm
al to
bed
y ′
(mm
)
Velocity at crest
0 0.2 0.4 0.6 0.8 1 1.2 1.4 1.6 1.8 20
50
100
150
200
250
300
350
Velocity (ms−1)
Coo
rdin
ate
norm
al to
bed
y ′
(mm
)
Velocity at crest
c) 30-percentile d) 10-percentile
Figure 4.5 Velocity distributions at the weir crest and in the region of flow minimum depth between the weir crest and baffle 1 (unequal baffles 1 and 2)
4.1.18
Also from Figure 3.17, it is evident that progress upstream by the fish beyond Baffle 1 and across the weir crest poses an additional challenge. Figure 4.5 shows, for the unequal baffles (small baffle 1), the field-scale velocity distributions measured at the weir crest and downstream in the region of minimum flow depth between the weir crest and Baffle 1, at the 90- and 50-percentile low flows. Figure 4.5 also shows the 30- and 10-percentile low flows at the weir crest only. Unlike the slot flows in which there were areas that met the velocity criterion at all flow rates and at all baffles (except Baffle 3, which did not comply at the 50-percentile low flow), upstream of Baffle 1 with higher flow rates the velocity conditions became increasingly adverse, and at the minimum depth exceeded 1.1 m s–1 at every flow rate. Nevertheless, to swim this final stage of ascent would be within the burst speed capability of many of the larger fish. Also, there is some evidence of a swimming speed capability higher than the burst speed, held in reserve and exploitable for very short durations (Armstrong 2003). Progress across the
44 Science Report – Low-cost modifications of the Crump weir to improve fish passage
weir by the smaller fish would depend on the existence and adequacy of such a reserve, or alternatively the ability to exploit the narrow region of low velocity flow in the side wall boundary layer. Similarly, this reserve capability would be exploitable through the baffle slots and, in combination with rest intervals, could secure the passage of some of the fish that did not have a sufficient burst speed.
4.1.19
As discussed in Section 2.2.2.9, only a very limited steepening of the existing model weir was possible. The effect, on the velocity distribution in Slot 11 for example, of a 10 per cent increase in the steepness angle of the downstream face of the weir, at the 90-, 50-, 30- and 10-percentile low flows is shown in Figure 3.18. The steeper slope gives a slightly worse velocity distribution at the 90- and 50- percentile low flows but the effect is barely detectable at higher flows.
4.1.20
As mentioned in Section 2.2.2.10, it was concluded that siltation would not be a problem. This was based on the following reasoning: any species of sedimentary material reaching the baffled apron of the Crump weir would first have been convected past the upstream stilling well of the weir and up the ramp of 1:2 slope (for the British Standard weir); those upstream flow regimes would be of such low velocity and turbulence intensity compared with the conditions between the baffles, including the regions of separated flow, as to effectively filter out any material with the potential to deposit among the baffles. This hypothesis was supported by the progress of the heavier fractions of the Pliolite particles used in the PTV experiments: some sedimentation was observed on the horizontal bed upstream of the weir crest, but none occurred between the baffles.
4.1.21
As reported in Section 3.1.12, at the 90-percentile low flow all three types of trash were problematical. However in the field, at such a low flow, the quantity of trash transported by the river water would be small and probably negligible in effect. High flows would of course transport a greater quantity of trash picked up by the river in spate, and the experiments indicated that tree structures would give the most persistent problems. However, on the present evidence, even they would be alleviated at the highest flows.
4.1.22
Treatment of the subject of weir fouling by algal growth was not included in the original brief. Indeed to have included it would have introduced practical challenges very difficult to meet by physical modelling at laboratory scale. Such biological fouling was therefore not investigated and is an issue outstanding. However, much could be learned from experience at existing installations, whether low-cost modifications such as at Hurn Weir in Dorset or other hydraulic structures subject to similar flows. Correlation of algal growth development and resistance to abrasion with such variables as light intensity, water chemistry, water and air temperatures and water current velocities would seem to be a potentially fruitful avenue of study, while practical lessons on, for example, effective cleaning regimes would be more readily available.

Science Report – Low-cost modifications of the Crump weir to improve fish passage 45
4.1.23
In Figure 4.6, flow duration data for Brimpton weir is displayed for the months of April to June, the period in which coarse fish are generally more active and mobile. The data set was derived from mean daily flows measured during the period 1991 or 1992 (depending on the month) to 2002 and from mean monthly flows measured during the period 1968 to 1990 or 1991. The method used was to rank separately for each month the mean daily flows and then apply that distribution to the mean monthly data. For all three months, these synthetic daily flows were combined with the measured daily flows to produce a data set of 35 (years) × 91 (days) = 3,185 items for the years 1968 to 2002. The data set was then ranked and the percentiles determined.
0 0.5 1 1.5 2 2.5 3 3.5 4 4.5 50
10
20
30
40
50
60
70
80
90
100
Q ( m3 s−1)
Per
cen
t dur
atio
n ≥
Q
Apr−June (1968−2002)
Jan−Dec (1967−1999)
92.1
7.5
Figure 4.6 Flow duration data for Brimpton compound Crump weir
Also shown in Figure 4.6 are the percentile low flows at Brimpton, supplied by the Environment Agency and based on year-round measurements (January to December) taken in the years 1967 to 1999. The 90-percentile low-flow value is equal to the 92.1-percentile for April to June and the 10-percentile low flow-value is equal to the 7.50-percentile for April to June. As previously discussed, the fish pass modifications were tested and found to be satisfactory over the year-round percentile flow range of 90 to 10 per cent, that is, for 80 per cent of the time. During the months of April to June at Brimpton, a satisfactory performance could therefore be expected for at least 85 per cent of the time, corresponding to the 92.1- to 7.50-percentile interval.

46 Science Report – Low-cost modifications of the Crump weir to improve fish passage
Table 4.2 Field-scale low flows at Brimpton and the corresponding low-weir flow rates per unit length of the low weir
Percentile low flow
Compound flow rate (m3 s–1)
Low-weir flow rate
(m3 s–1)
Low-weir length (m)
Flow rate per unit length
(m2 s–1)
10 2.82 2.086 3.048 0.684 30 1.27 1.206 0.396 50 0.727 0.727 0.239 90 0.209 0.209 0.0686
4.1.24
The 90-, 50-, 30- and 10-percentile low flows used in the model studies were:
a) the low-weir flow rates of the Crump weir at Brimpton, deduced from the percentile low flows over the compound weir (Section 2.2.2.2) and applied at model scale;
b) in terms of percentile low flows, unique to the hydrology of Brimpton weir.
In order to be applicable to any Crump weir site, those flow values are presented in Table 4.2 as low-weir flow rates per unit length of the low-weir crest at Brimpton. Thus the conclusions drawn, with regard to the performance of the fish pass modifications in the 90- to 10-percentile flow range at Brimpton, would apply equally to any Crump weir subject to flow rates per unit length in the range 0.0686 m2 s–1 to 0.684 m2 s–1 (a ten-fold increase). Flows within this range, which occur at Brimpton for 80 per cent of the time (Section 4.1.23), would allow fish passage at any other site but for a different proportion of the time, depending on the local catchment hydrology and whether the weir was single or compound.
4.1.25
Given the small-scale physical modelling employed, with field-scale and model Froude numbers identical, it was impossible to reproduce at model scale the same conditions with respect to air entrainment. Air entrainment will be greater at field scale and possibly detract from the beneficial effect of the modifications, for example as a result of swimming thrust reduction in the less dense two-phase flow, obscured vision and disorientation.
4.2 Hydrometric effect
4.2.1
As stated in Section 2.2.3.1, the hydrometric measurements were carried out under modular and non-modular conditions, initially on the unmodified weir and later with the weir modified by the addition of one or more baffles, and by the whole fish pass arrangement.

Science Report – Low-cost modifications of the Crump weir to improve fish passage 47
4.2.2
The stage–discharge measurements for the unmodified weir under modular flow conditions (Sections 2.2.3.2 and 3.2.1 and Figure 3.19) were designed to prove the equipment, and to indicate the degree of precision that might be expected in the subsequent work with single and multiple baffles installed. The rms discrepancy of 0.54 per cent in flow rate between the model Crump weir data and the standard equation (British Standards Institution 1986) represented a flow-dependent error, varying from about one per cent at low flows to less than 0.25 per cent at high flows. Therefore, although the overall level of precision was satisfactory, greater confidence can be attributed to the discharge coefficients measured at high flows than to those at low flows. This is important when assessing the discharge coefficient for the baffled weir at low flows and high d/l, where the discharge coefficient varies rapidly with non-dimensional head.
4.2.3
The assumption that geometrically similar single-baffle arrangements would consist of geometrically similar baffles located with identical values of d/l (section 2.2.3.3) is substantiated by Figure 3.20. For d/l = 0.2, the ratio of discharge coefficients Cd/CdBS is plotted against the non-dimensional total head H1/d, and the measurements with five different baffle heights are distributed closely around a single curve. Further support is provided over the whole range of d/l by Figure 3.21, in which at each d/l the measurements were taken at two or more baffle heights. Again, at each d/l, the measurements are clustered around a single curve.
4.2.4
At d/l = 0.24 and 0.2 in Figure 3.21 the data sets could reasonably be partitioned about H1/d ≈ 1.7, at which they share roughly the same peak value of Cd/CdBS and each side of which the curves have distinct shapes. Those features, which do not occur at lower values of d/l, can be explained in terms of the slight elevation Δ of the baffle crest above weir crest level at the two highest values of d/l, (Δ/d = 0.171 for d/l = 0.24 and Δ/d = 0.00388 for d/l = 0.2). Consequently, at very low flows, control is exercised by the baffle crest. However, because the total head H1 is still measured relative to the weir crest, for the same total head H1, the discharge is less than that over the unmodified weir. At very low flows, the discharge coefficient of the single-baffled weir is significantly depressed, with values as low as 50 per cent of the British Standard value measured in our experiments. As the head on the weir increases, the effect of Δ becomes proportionately less and the discharge coefficient rises towards the British Standard value. Beyond the peak in Cd/CdBS, except for d/l = 0.067 all of the curves tend to fall to a minimum in Cd/CdBS before rising again. It is likely that the peak at d/l = 0.24 and d/l = 0.2 represents a transfer of control from the baffle crest to the separation bubble developed by the weir crest, which at all flows exercises control at lower values of d/l and in the unmodified weir. As the separation bubble increases in size with increasing head, the bubble is distorted by the presence of the baffle and Cd/CdBS decreases. Beyond the minimum in Cd/CdBS, the separation bubble engulfs the baffle which thereafter has a diminishing effect upon the bubble shape, resulting in the upward trend in Cd/CdBS.

48 Science Report – Low-cost modifications of the Crump weir to improve fish passage
4.2.5
The rest of the data in Figure 3.21, for d/l ≤ 0.183, do not exhibit the prominent rising limb to a peak in Cd/CdBS. Instead these curves assume a much flatter approach, with Cd/CdBS ≈ 0.97-0.98 and less sensitive to d/l, before taking on the common shape and falling towards a minimum. The value of the minimum in Cd/CdBS increases and occurs at higher values of H1/d as d/l decreases. These observations suggest a rationale for optimizing d/l for fish passage and flow measurement: d/l should be as high as possible to benefit fish passage, and could be as high as 0.183 (or possibly higher, though less than 0.2) with little detrimental effect upon the weir discharge coefficient Cd until H1/d > 1.7. For H1/d < 1.7, in the range 0.183 ≤ d/l ≤ 0.2, Figure 3.21 shows that Cd/CdBS must be sensitive to d/l, which would be optimal at its largest value that preserved the flat limb with Cd/CdBS ≈ 0.97-0.98. For H1/d > 1.7, the two curves for d/l = 0.183 and d/l = 0.2 are nearly coincident and therefore relatively insensitive to d/l. Therefore the optimal d/l lies in the range 0.183 ≤ d/l ≤ 0.2, and should be as high as will preserve a flat and stable calibration curve in the range H1/d < 1.7. Such a calibration curve would lie very close to that of d/l = 0.183 in Figure 3.21.
4.2.6
The optimization process would require additional modelling and, given that the fish pass regime was determined for d/l = 0.2, a slightly lower value of d/l would alter that too, implying the need for yet further modelling. Although extra modelling of these hydrometric and fish passage effects might be ideal, it is considered that the present fish pass design could be moved downstream as far as d/l = 0.183 without serious detrimental effect on fish passage or significant deviation from the single-baffle calibration curve with d/l = 0.183. However, the sole achievement of such an alteration of the fish pass design and hydrometric conditions from d/l = 0.2 to d/l = 0.183, or to an intermediate value, would be no more than a very small reduction in afflux throughout the modular flow range. Therefore, as far as modular flows are concerned, these considerations confirm the suitability of d/l = 0.2 from both the aspects of fish passage and flow measurement, the latter requiring an appropriate modification to the British Standards calibration curve.
4.2.7
The Environment Agency (2005) has reported similar work on single-baffle installations. Its parameters are summarized in Table 4.3, together with details from our study for comparison. Both studies were carried out with rounded baffles but having different cross-sectional aspect ratios, the 2005 study using baffles that were thicker in relation to their height (thickness w = d/1.5 compared with w = d/2.5 in the present study). Figure 4.7 shows the results of the 2005 study, plotted in terms that facilitate comparison with our results, which are also shown. In the present study the ratio d/l is used in which l, the dimension from the crest to the baffle centreline, is preferred to l', the dimension to the upstream face of the baffle, as used in the 2005 study. The two sets of results are inconsistent, for it is impossible to interpolate between the constant d/l curves of the present data and obtain the 2005 data. The latter is high in terms of Cd/CdBS compared with our set of measurements, which could be due to the dissimilar baffle cross-sectional geometries.

Science Report – Low-cost modifications of the Crump weir to improve fish passage 49
Table 4.3 Comparison of present single-baffle experiments with those of the Environment Agency (2005)
d (mm) d/l H1/d
Environment Agency (2005) 10, 20, 30, 40
0.0779, 0.115, 0.152 2.5-30
Present study 20, 30, 4050, 60
0.067, 0.1, 0.133, 0.167,0.183, 0.2, 0.24 0.3-7
0 5 10 15 20 25 300.6
0.65
0.7
0.75
0.8
0.85
0.9
0.95
1
H1/d
Q/Q
BS =
Cd/C
d(B
S)
H1/d =1.68
Cranfield University
0.24
0.2
0.183
0.167
0.133
0.1
0.067
HR Wallingford (d/l)
0.152
0.115
0.078
0.040
Figure 4.7 Modular flows over weir modified by single baffle: non-dimensional total head–discharge results of present study compared with results of Environment Agency (2005)
4.2.8
Higher flow rates were available to the 2005 study, which are reflected in the much higher limit of H1/d = 30. However, for the field-scale baffle heights of 200 mm recommended in the present study, its much lower limit of H1/d = 7 would adequately describe many UK weirs, which reach drowned-flow conditions before H1 = 1,400 mm. The values of d/l tested were fewer in the 2005 study, and their maximum d/l = 0.152 (much lower than the d/l = 0.24 of our study) reflects the emphasis in the 2005 report of minimizing the defect relative to the unmodified Crump weir stage–discharge relationship. That is exemplified by its recommended formulae for single-baffle

50 Science Report – Low-cost modifications of the Crump weir to improve fish passage
installation conditions that affect the Crump weir coefficient of discharge by less than one per cent (Equations 5.1 and 5.2 in Environment Agency 2005). However, our study shows that the low d/l ratios resulting from the application of those formulae at high H1/d (where d = 200 mm) would give values of l too high, and so fail to achieve the primary objective of the modifications, to improve fish passage. For example, when H1 = 1 m and d/w = 1.5, l' = 2.33 m and l = 2.39 m, which would make the modifications ineffective at low flows. Rather, for there to be a substantial benefit to fish passage, a significant modification of hydrometric conditions has to be accepted, with flow-gauging accuracy maintained by recalibration of the modified weir’s discharge coefficient. In this respect, the 2005 study has a significant contribution to make and to that end in Appendix A further analysis has been carried out on the 2005 data.
4.2.9
In the double baffle arrangement represented by Figure 3.22, the two baffles are of equal height (d1/l1 = 0.2 and d1/d2 = 1) and it might be expected that the second baffle, in the lee of the first, would be of less influence or even insignificant in its effect upon the baffled-weir discharge coefficient. Comparison with the results for a single baffle in Figure 3.22, for H1/d greater than that at the peak in Cd/CdBS, largely confirms that expectation: the curves coincide until the minimum in Cd/CdBS and thereafter diverge by about one per cent. The disparate results for lower values of H1/d however are contrary to physical reasoning, given the very low heads and consequential lack of influence of the second baffle. This discrepancy between the two sets of data is most likely caused by experimental error, given the difficulty of reproducing the set-up conditions and measuring the small differential pressures at such very low heads. Therefore, for fish-pass modifications in which d1/l1 = 0.2 and where the baffle heights were identical, the corresponding single-baffle relationship between Cd/CdBS and H1/d, shown in Figure 3.20, could reasonably provide the calibration curve, as described in the next section.
4.2.10
Thus for the baffle cross-sectional aspect ratio d/w = 2.5 used in the present work, for d1/l1 = 0.2 and d1/d2 = 1 (modifications with constant baffle heights), polynomial least squares fitting to the two limbs of the curve in Figure 3.20 gave the following calibration equations, which are plotted in red on the same graph and apply at field scale to the uniformly 200 mm high baffle arrangement (where the first baffle is 200 mm high).
For 1.7715 ≥ H1/d ≥ 0.269
57482.01 5566.1 2
1 5164.2
31 0013.2
41 77895.0
51 11971.0
dBS
d
++−
+−=
⎟⎟⎠
⎞⎜⎜⎝
⎛⎟⎟⎠
⎞⎜⎜⎝
⎛
⎟⎟⎠
⎞⎜⎜⎝
⎛⎟⎟⎠
⎞⎜⎜⎝
⎛⎟⎟⎠
⎞⎜⎜⎝
⎛
d
H
d
H
d
H
d
H
d
H
C
C
(3)
For 1.7715 < H1/d < 6.84

Science Report – Low-cost modifications of the Crump weir to improve fish passage 51
18632.01 4947.12
1 0398.13
1 34276.0
41 059244.0
51 0052128.0
61 00018470.0
dBS
d
++−+
−+−=
⎟⎟⎠
⎞⎜⎜⎝
⎛⎟⎟⎠
⎞⎜⎜⎝
⎛⎟⎟⎠
⎞⎜⎜⎝
⎛
⎟⎟⎠
⎞⎜⎜⎝
⎛⎟⎟⎠
⎞⎜⎜⎝
⎛⎟⎟⎠
⎞⎜⎜⎝
⎛
d
H
d
H
d
H
d
H
d
H
d
H
C
C
(4)
4.2.11
In comparing our results with the single-baffle measurements carried out by the Environment Agency (2005), the interpolating formula of Equation A.1 (Appendix A) was derived by non-linear regression analysis. Applying to a baffle cross-sectional aspect ratio d/w = 1.5 and the ranges 0.0395 ≤ d/l ≤ 0.152 and H1/d > 2.5, the latter measurements do not capture the distinctly different shape of the curve at low heads (H1/d < 1.77). Also, to apply those results to the preferred fish-pass arrangement would require extrapolation to d/l = 0.2, adding considerable uncertainty to the estimate of the discharge coefficient.
4.2.12
The double-baffle arrangement represented in Figure 3.23 has the baffle crests aligned with the weir crest to give d1/l1 = d2/l2 = 0.2. In this case, there is the likelihood of some influence by the second baffle upon the baffled weir discharge coefficient, which is borne out by the significant difference between the single-baffle and double-baffle results. Not only are the two double-baffle data sets significantly displaced downwards (lower Cd/CdBS) from the single-baffle data, but for d1/d2 = 0.6 there are two peaks in Cd/CdBS. Therefore for fish-pass modifications with the first two baffles of constant d/l, the corresponding single-baffle relationship between Cd/CdBS and H1/d would not be applicable as the calibration curve, but rather it would be necessary to provide a special calibration for that geometry. That conclusion is reinforced by Figure 3.24 which shows the calibration data set for the complete fish-pass arrangement to be significantly displaced downwards (lower Cd/CdBS) from the single-baffle data. The fish-pass results are also somewhat different from the double-baffle data with the same d1/d2 = 0.6.
4.2.13
Although those two sets of measurements differ and are rather sparse, with reference to Figure 3.24 the following equations have been fitted to the double-baffle data (blue square symbols) combined with the data from the complete fish pass (red triangular symbols), but excluding the single-baffle data (black open symbols). These equations would apply at field scale to the non-uniform baffle arrangement, with the first baffle 120 mm high and the rest 200 mm high.
For 0.98994 ≥ H1/d1 ≥ 0.658
(5) 69827.01 21061.0dBS
d += ⎟⎟⎠
⎞⎜⎜⎝
⎛d
H
C
C
For 0.98994 < H1/d1 < 2.2814

52 Science Report – Low-cost modifications of the Crump weir to improve fish passage
(6) 0769.11 23600.02
1 064816.0dBS
d +−= ⎟⎟⎠
⎞⎜⎜⎝
⎛⎟⎟⎠
⎞⎜⎜⎝
⎛d
H
d
H
C
C
For 2.2814 ≤ H1/d1 < 6.03
(7) 0656.11 13534.02
1 026476.03
1 0015886.0dBS
d +−+−= ⎟⎟⎠
⎞⎜⎜⎝
⎛⎟⎟⎠
⎞⎜⎜⎝
⎛⎟⎟⎠
⎞⎜⎜⎝
⎛d
H
d
H
d
H
C
C
4.2.14
Figure 4.8 shows at field scale the stage–discharge curve of the British Standard Crump weir unmodified and the stage–discharge curves of the weir modified by 200 mm high baffle arrangements with d/l = 0.2, in which the first baffle is 200 mm or 120 mm high. For the same discharge per unit length of weir, and up to a field-scale head of 1.2 m, the modifications increase the head on the weir by up to about 0.1 m with the 200 mm high first baffle. With the 120 mm high first baffle, the model results (though scaling up to a maximum head of only 0.75 m) give a similar increase on the head of the unmodified weir. Figure 4.9 shows, for the same total head 1H , the percentage reduction in discharge per unit length of weir caused by the modifications, with the first baffle either 200 mm high or 120 mm high. The data used to plot the curves is set out in Tables 4.4 and 4.5, for the 200 mm and 120 mm high first baffles respectively. Tables 4.4 and 4.5 are located at the end of Section 4.
0 0.5 1 1.5 2 2.5 3 3.50
0.2
0.4
0.6
0.8
1
1.2
1.4
Discharge / unit width (m2s−1)
H1 (
m)
BS 3680−4B:1986Modified: 200 mm first baffleModified: 120 mm first baffle
Figure 4.8 Comparison of British Standard stage–discharge curve with stage–discharge curves of modified fully baffled weirs, with 200 mm high first baffle and 120 mm high first baffle

Science Report – Low-cost modifications of the Crump weir to improve fish passage 53
0 0.5 1 1.50
2
4
6
8
10
12
14
16
18
H1 [m]
100
(QB
S−
Qm
od)/
QB
S
200 mm first baffle120 mm first baffle
Figure 4.9 Effect of fish-pass modifications upon flow rates at same total head expressed as a percentage difference from the flow rate of the unmodified British Standard weir
4.2.15
The non-modular flow results for the unmodified weir are presented in Figure 3.25, together with the following empirical relationships between the drowned flow reduction factor f and the head ratios H2/H1 and hp/H1 in the respective graphs (Herschy et al. 1977)
(9) 93.01
2 1
2 403.8686.8
(8) 93.01
20.75
0647.00.4
1
2 817.0 035.1
>−=
<<−=
⎟⎟⎠
⎞⎜⎜⎝
⎛
⎥⎥⎥
⎦
⎤
⎢⎢⎢
⎣
⎡
⎟⎟⎠
⎞⎜⎜⎝
⎛
H
H
H
Hf
HH
HH
f
and
(10)
256.05.1
1
p945.0 04.1⎥⎥⎥
⎦
⎤
⎢⎢⎢
⎣
⎡
⎟⎟⎠
⎞⎜⎜⎝
⎛−=
H
hf
As in the case of the modular flow results for the unmodified weir, comparison of our measurements with authoritative empirical formulae served the purpose of quality control. Thus the minor discrepancies in Figure 3.25, consisting of a slight underestimate and overestimate of f in the 1/2 HH and 1/p Hh data respectively,

54 Science Report – Low-cost modifications of the Crump weir to improve fish passage
detracted little from the overall agreement and consequent grounds for confidence in the later measurements with one or more baffles installed.
4.2.16
Figure 3.26 shows the non-modular flow results for the weir having a single baffle located at d/l = 0.2. The presence of the baffle had a marked effect upon the drowned flow reduction factor, evident when the present measurements are again compared with Equations 8-10. The application of those equations to the modified weir would either significantly overestimate or significantly underestimate the drowned flow reduction factor f in its 1/2 HH and 1/p Hh dependence respectively. The measured range of f was limited by the equipment, and it was therefore not possible to confirm whether or not the slight trend with decreasing f towards better agreement actually persisted. Therefore Figure 3.26, while highlighting the significance of the single-baffle modification, does not provide sufficient information for a set of calibration curves to be used in the field.
4.2.17
As discussed previously (Sections 2.2.2.4, 2.2.3.8 and 3.2.5), with the complete Perspex fish pass in position the crest tappings were inaccessible, hp could not be measured and so Figure 3.27 shows only the one graph, with f plotted against the head ratio H2/H1. Given the marked difference between the single-baffle measurements and Equations 8 and 9 in Figure 3.26, the close agreement in Figure 3.27 between the same formulae and the measurements with the complete fish pass in position is surprising. However, confidence in this result is reinforced by the data consisting of two sets of measurements at quite different nominal flow rates (Q1 = 39.5 l s–1 and Q2 = 47 l s–1). The agreement between the two sets of measurements also serves to confirm that the results in non-dimensional terms were independent of flow rate. However, again, the range of f is too limited to be of use in providing a calibration curve for field application.
4.2.18
Fouling of the baffle arrangement has already been considered in the context of fish passage, and is clearly an issue relevant to flow gauging. The evidence discussed in Sections 4.1.20 and 4.1.21 indicates that sediment deposition and fouling by trash carried in suspension are unlikely, and no worse in effect than would occur on the unmodified weir. However, as discussed in Section 4.1.22, fouling by biological growth was not investigated and at least in the short term, an appropriate remedy would be to survey experience at existing installations.

Science Report – Low-cost modifications of the Crump weir to improve fish passage 55
Table 4.4 Stage–discharge results calculated for British Standard Crump weir and weir modified by uniformly 200 mm high baffles. The latter calculation applies Equations 3 and 4 to obtain Cd/Cd,BS. The total head H1 covers the range 50 to 1,400 mm with 100 equal intervals on the logarithmic scale. For the baffled weir, the two lowest heads are below the minimum of the range in which Equation 3 applies. For the Brimpton Compound Crump weir when the static head h > 0.3048 m, the high weir begins to act and the compound discharges are entered in blue. When the discharge Q >18 m3 s–1, drowned flow occurs and the notional modular flow discharges are entered in red.
200 mm HIGH FIRST BAFFLE
BRIMPTON COMPOUND WEIR
SINGLE WEIR OR LOW WEIR ACTING ALONE
1H (m) d
H1 BSd,
d
CC
)sm(
13
BS−
Q
)sm(
13
mod−
Q
)sm(
length /
12
BS
−
Q
)sm(
length /
12
mod
−
Q
%100 BS
modBS
×
−Q
0.05 0.25000 ― 0.066950 ― 0.021965 ― ― 0.051694 0.25847 ― 0.070402 ― 0.023098 ― ― 0.053446 0.26723 0.84547 0.074032 0.062592 0.024289 0.020535 15.4535 0.055257 0.27628 0.85066 0.077848 0.066222 0.025541 0.021726 14.9346 0.057129 0.28564 0.85582 0.081860 0.070057 0.026857 0.022985 14.4187 0.059065 0.29532 0.86094 0.086077 0.074108 0.028241 0.024314 13.9065 0.061066 0.30533 0.86602 0.090512 0.078385 0.029696 0.025717 13.3991 0.063135 0.31568 0.87103 0.095174 0.0829 0.031225 0.027198 12.8973 0.065274 0.32637 0.87599 0.100075 0.087665 0.032833 0.028761 12.4021 0.067486 0.33743 0.88086 0.105228 0.092692 0.034524 0.030411 11.9145 0.069773 0.34886 0.88565 0.110646 0.097994 0.036301 0.03215 11.4354 0.072137 0.36068 0.89035 0.116342 0.103585 0.03817 0.033984 10.9660 0.074581 0.37291 0.89494 0.122330 0.109477 0.040134 0.035918 10.5071 0.077108 0.38554 0.89941 0.128625 0.115687 0.0422 0.037955 10.0599 0.079721 0.39860 0.90376 0.135243 0.122227 0.044371 0.040101 9.6253 0.082422 0.41211 0.90797 0.142201 0.129114 0.046654 0.04236 9.2044 0.085215 0.42607 0.91203 0.149516 0.136364 0.049054 0.044739 8.7979 0.088102 0.44051 0.91594 0.157207 0.143992 0.051577 0.047241 8.4070 0.091087 0.45544 0.91969 0.165292 0.152017 0.05423 0.049874 8.0325 0.094174 0.47087 0.92326 0.173792 0.160455 0.057018 0.052643 7.6752 0.097365 0.48682 0.92665 0.182728 0.169325 0.05995 0.055553 7.3358 0.100664 0.50332 0.92986 0.192123 0.178647 0.063032 0.058611 7.0150 0.104075 0.52037 0.93288 0.201999 0.18844 0.066273 0.061824 6.7135 0.107601 0.53801 0.93570 0.212382 0.198725 0.069679 0.065199 6.4316 0.111247 0.55623 0.93831 0.223298 0.209524 0.073261 0.068741 6.1698 0.115016 0.57508 0.94073 0.234774 0.220859 0.077026 0.07246 5.9282 0.118913 0.59457 0.94294 0.246839 0.232755 0.080984 0.076363 5.7068 0.122943 0.61471 0.94496 0.259522 0.245237 0.085145 0.080458 5.5057 0.127108 0.63554 0.94677 0.272856 0.258331 0.08952 0.084754 5.3246 0.131415 0.65708 0.94838 0.286874 0.272067 0.094119 0.089261 5.1629 0.135868 0.67934 0.94981 0.301611 0.286474 0.098954 0.093988 5.0201 0.140472 0.70236 0.95106 0.317104 0.301586 0.104037 0.098945 4.8953 0.145231 0.72616 0.95214 0.333392 0.317436 0.109381 0.104146 4.7874 0.150152 0.75076 0.95306 0.350515 0.334063 0.114998 0.109601 4.6953 0.15524 0.77620 0.95384 0.368516 0.351506 0.120904 0.115323 4.6174 0.1605 0.80250 0.95449 0.387440 0.36981 0.127113 0.121329 4.5522

56 Science Report – Low-cost modifications of the Crump weir to improve fish passage
200 mm HIGH FIRST BAFFLE
BRIMPTON COMPOUND WEIR
SINGLE WEIR OR LOW WEIR ACTING ALONE
1H (m) d
H1 BSd,
d
CC
)sm(
13
BS−
Q
)sm(
13
mod−
Q
)sm(
length /
12
BS
−
Q
)sm(
length /
12
mod
−
Q
%100 BS
modBS
×
−Q
0.165938 0.82969 0.95504 0.407335 0.389021 0.13364 0.127632 4.4977 0.171561 0.85780 0.95550 0.428251 0.409192 0.140502 0.134249 4.4521 0.177374 0.88687 0.95589 0.450238 0.430377 0.147716 0.1412 4.4131 0.183384 0.91692 0.95623 0.473354 0.452635 0.1553 0.148502 4.3787 0.189598 0.94799 0.95655 0.497655 0.476033 0.163273 0.156179 4.3465 0.196022 0.98011 0.95688 0.523202 0.500639 0.171654 0.164252 4.3143 0.202664 1.01332 0.95722 0.550059 0.526528 0.180465 0.172745 4.2798 0.209531 1.04765 0.95761 0.578293 0.55378 0.189729 0.181686 4.2409 0.21663 1.08315 0.95806 0.607975 0.582479 0.199467 0.191102 4.1956
0.223971 1.11985 0.95860 0.639179 0.612715 0.209704 0.201022 4.1423 0.23156 1.15780 0.95922 0.671983 0.644583 0.220467 0.211477 4.0796
0.239406 1.19703 0.95996 0.706469 0.678181 0.231781 0.2225 4.0063 0.247517 1.23759 0.96080 0.742724 0.71361 0.243676 0.234124 3.9220 0.255904 1.27952 0.96176 0.780837 0.750977 0.25618 0.246384 3.8262 0.264575 1.32288 0.96283 0.820904 0.790392 0.269326 0.259315 3.7192 0.27354 1.36770 0.96401 0.863026 0.831966 0.283145 0.272955 3.6013
0.282808 1.41404 0.96529 0.907308 0.875818 0.297673 0.287342 3.4730 0.292391 1.46195 0.96668 0.953860 0.922077 0.312946 0.302519 3.3344 0.302298 1.51149 0.96817 1.002799 0.970883 0.329002 0.318531 3.1850 0.312541 1.56270 0.96980 1.060021 1.028181 0.345881 0.335434 3.0228 0.323131 1.61565 0.97159 1.130247 1.098763 0.363626 0.353296 2.8434 0.33408 1.67040 0.97364 1.209879 1.179171 0.38228 0.372205 2.6382
0.345399 1.72700 0.97609 1.298265 1.268985 0.401891 0.392283 2.3931 0.357103 1.78551 0.97776 1.395262 1.366625 0.422507 0.41311 2.2267 0.369203 1.84601 0.97484 1.500940 1.466879 0.44418 0.433004 2.5189 0.381713 1.90856 0.97138 1.615484 1.574752 0.466965 0.453599 2.8649 0.394646 1.97323 0.96742 1.739161 1.690415 0.490917 0.474921 3.2609 0.408018 2.04009 0.96300 1.872294 1.814108 0.516097 0.497004 3.7022 0.421843 2.10922 0.95819 2.015258 1.946127 0.542568 0.519884 4.1836 0.436137 2.18068 0.95303 2.168467 2.086824 0.570396 0.543606 4.6994 0.450915 2.25457 0.94759 2.332376 2.236606 0.599651 0.568225 5.2434 0.466193 2.33097 0.94194 2.507476 2.395935 0.630406 0.593805 5.8086 0.481989 2.40995 0.93615 2.694295 2.565332 0.662737 0.620419 6.3880 0.498321 2.49160 0.93029 2.893398 2.74538 0.696726 0.648156 6.9739 0.515206 2.57603 0.92444 3.105383 2.936723 0.732457 0.677113 7.5586 0.532663 2.66331 0.91869 3.330890 3.140073 0.770019 0.707406 8.1342 0.550711 2.75356 0.91310 3.570593 3.356211 0.809508 0.739161 8.6927 0.569371 2.84686 0.90776 3.825207 3.585984 0.85102 0.772523 9.2266 0.588663 2.94332 0.90274 4.095487 3.830314 0.894661 0.807648 9.7285 0.608609 3.04305 0.89811 4.382232 4.090189 0.940538 0.844709 10.1915 0.629231 3.14615 0.89393 4.686284 4.366663 0.988768 0.883889 10.6097 0.650552 3.25276 0.89025 5.008531 4.660856 1.03947 0.925385 10.9780 0.672594 3.36297 0.88710 5.349909 4.973941 1.092771 0.969402 11.2923 0.695384 3.47692 0.88453 5.711405 5.307138 1.148804 1.016149 11.5500 0.718946 3.59473 0.88253 6.094060 5.661709 1.207709 1.065839 11.7498

Science Report – Low-cost modifications of the Crump weir to improve fish passage 57
200 mm HIGH FIRST BAFFLE
BRIMPTON COMPOUND WEIR
SINGLE WEIR OR LOW WEIR ACTING ALONE
1H (m) d
H1 BSd,
d
CC
)sm(
13
BS−
Q
)sm(
13
mod−
Q
)sm(
length /
12
BS
−
Q
)sm(
length /
12
mod
−
Q
%100 BS
modBS
×
−Q
0.743307 3.71653 0.88111 6.498967 6.038939 1.269634 1.118682 11.8922 0.768492 3.84246 0.88024 6.927279 6.440129 1.334734 1.17488 11.9792 0.794532 3.97266 0.87988 7.380212 6.866583 1.40317 1.234628 12.0143 0.821453 4.10727 0.88000 7.859042 7.319601 1.475115 1.298101 12.0027 0.849287 4.24643 0.88052 8.365115 7.800469 1.550747 1.365462 11.9509 0.878063 4.39032 0.88137 8.899846 8.310462 1.630256 1.436852 11.8662 0.907815 4.53908 0.88246 9.464724 8.850856 1.713841 1.512401 11.7564 0.938575 4.69288 0.88373 10.061317 9.422948 1.80171 1.592229 11.6295 0.970377 4.85189 0.88510 10.691274 10.02809 1.894084 1.67646 11.4924 1.003257 5.01629 0.88652 11.356330 10.66776 1.991192 1.765236 11.3506 1.037251 5.18625 0.88796 12.058309 11.3436 2.093278 1.858743 11.2070 1.072397 5.36198 0.88941 12.799131 12.05752 2.200597 1.957233 11.0618 1.108733 5.54366 0.89091 13.580815 12.81176 2.313417 2.061043 10.9119 1.146301 5.73150 0.89251 14.405486 13.6089 2.43202 2.170612 10.7513 1.185141 5.92571 0.89430 15.275377 14.45187 2.556703 2.286457 10.5728 1.225298 6.12649 0.89632 16.192838 15.34365 2.687776 2.409102 10.3709 1.266815 6.33408 0.89855 17.160340 16.28681 2.825568 2.538904 10.1481 1.309739 6.54870 0.90078 18.180482 17.28244 2.970423 2.675712 9.9242 1.354118 6.77059 0.90250 19.255998 18.32829 3.122703 2.818252 9.7523
1.4 7.00000 0.90262 20.389762 19.4156 3.282788 2.963094 9.7411

58 Science Report – Low-cost modifications of the Crump weir to improve fish passage
Table 4.5 Stage–discharge results calculated for British Standard Crump weir and weir modified by 200 mm high baffles, except for 120 mm high first baffle. The latter calculation applies Equations 5, 6 and 7 to obtain Cd/Cd,BS. The total head H1 is divided over the range 50 to 1,400 mm into 100 equal intervals on the logarithmic scale, but truncated at H1 = 0.743307, near the limit of the data to which Equation 7 was fitted. For the baffled weir, the first 13 heads are below the minimum of the range in which Equation 5 applies. For the Brimpton Compound Crump weir when the static head h > 0.3048 m, the high weir begins to act and the compound discharges are entered in blue. In accord with the limit of Equation 7, the table does not reach drowned flow conditions.
120 mm HIGH FIRST BAFFLE
BRIMPTON COMPOUND WEIR
SINGLE WEIR OR LOW WEIR ACTING ALONE
1H (m) d
H1 BSd,
d
CC
)sm(
13
BS−
Q
)sm(
13
mod−
Q
)sm(
length /
12
BS
−
Q
)sm(
length /
12
mod
−
Q
%100 BS
modBS
×
−Q
0.050000 0.416667 ― 0.066950 ― 0.021965 ― ― 0.051694 0.430785 ― 0.070402 ― 0.023098 ― ― 0.053446 0.445381 ― 0.074032 ― 0.024289 ― ― 0.055257 0.460472 ― 0.077848 ― 0.025541 ― ― 0.057129 0.476075 ― 0.081860 ― 0.026857 ― ― 0.059065 0.492206 ― 0.086077 ― 0.028241 ― ― 0.061066 0.508883 ― 0.090512 ― 0.029696 ― ― 0.063135 0.526126 ― 0.095174 ― 0.031225 ― ― 0.065274 0.543953 ― 0.100075 ― 0.032833 ― ― 0.067486 0.562384 ― 0.105228 ― 0.034524 ― ― 0.069773 0.581440 ― 0.110646 ― 0.036301 ― ― 0.072137 0.601141 ― 0.116342 ― 0.038170 ― ― 0.074581 0.621509 ― 0.122330 ― 0.040134 ― ― 0.077108 0.642568 0.833603 0.128625 0.107222 0.042200 0.035178 16.6406 0.079721 0.664341 0.838188 0.135243 0.113359 0.044371 0.037191 16.1820 0.082422 0.686851 0.842929 0.142201 0.119866 0.046654 0.039326 15.7080 0.085215 0.710124 0.847830 0.149516 0.126765 0.049054 0.041589 15.2179 0.088102 0.734185 0.852898 0.157207 0.134081 0.051577 0.043990 14.7111 0.091087 0.759062 0.858137 0.165292 0.141843 0.054230 0.046536 14.1872 0.094174 0.784782 0.863554 0.173792 0.150079 0.057018 0.049238 13.6456 0.097365 0.811373 0.869155 0.182728 0.158819 0.059950 0.052106 13.0856 0.100664 0.838865 0.874945 0.192123 0.168097 0.063032 0.055150 12.5066 0.104075 0.867288 0.880931 0.201999 0.177947 0.066273 0.058382 11.9080 0.107601 0.896675 0.887120 0.212382 0.188409 0.069679 0.061814 11.2891 0.111247 0.927058 0.893519 0.223298 0.199521 0.073261 0.065460 10.6492 0.115016 0.958469 0.900135 0.234774 0.211328 0.077026 0.069333 9.98772 0.118913 0.990946 0.906654 0.246839 0.223797 0.080984 0.073424 9.33589 0.122943 1.024522 0.903116 0.259522 0.234379 0.085145 0.076896 9.68971 0.127108 1.059237 0.899612 0.272856 0.245465 0.089520 0.080533 10.0402 0.131415 1.095127 0.896153 0.286874 0.257083 0.094119 0.084345 10.3860 0.135868 1.132234 0.892753 0.301611 0.269264 0.098954 0.088341 10.7261 0.140472 1.170598 0.889425 0.317104 0.282040 0.104037 0.092533 11.0589 0.145231 1.210262 0.886185 0.333392 0.295447 0.109381 0.096931 11.3829 0.150152 1.251270 0.883049 0.350515 0.309522 0.114998 0.101549 11.6965 0.155240 1.293667 0.880037 0.368516 0.324308 0.120904 0.106400 11.9978

Science Report – Low-cost modifications of the Crump weir to improve fish passage 59
120 mm HIGH FIRST BAFFLE
BRIMPTON COMPOUND WEIR
SINGLE WEIR OR LOW WEIR ACTING ALONE
1H (m) d
H1 BSd,
d
CC
)sm(
13
BS−
Q
)sm(
13
mod−
Q
)sm(
length /
12
BS
−
Q
)sm(
length /
12
mod
−
Q
%100 BS
modBS
×
−Q
0.160500 1.337501 0.877168 0.387440 0.339850 0.127113 0.111499 12.2847 0.165938 1.382820 0.874463 0.407335 0.356200 0.133640 0.116863 12.5552 0.171561 1.429675 0.871946 0.428251 0.373412 0.140502 0.122510 12.8069 0.177374 1.478117 0.869644 0.450238 0.391547 0.147716 0.128460 13.0372 0.183384 1.528201 0.867583 0.473354 0.410674 0.155300 0.134735 13.2433 0.189598 1.579981 0.865794 0.497655 0.430867 0.163273 0.141360 13.4222 0.196022 1.633517 0.864310 0.523202 0.452209 0.171654 0.148362 13.5706 0.202664 1.688866 0.863167 0.550059 0.474792 0.180465 0.155772 13.6850 0.209531 1.746090 0.862402 0.578293 0.498721 0.189729 0.163622 13.7615 0.216630 1.805254 0.862058 0.607975 0.524110 0.199467 0.171952 13.7960 0.223971 1.866422 0.862179 0.639179 0.551087 0.209704 0.180803 13.7839 0.231560 1.929663 0.862814 0.671983 0.579796 0.220467 0.190222 13.7204 0.239406 1.995047 0.864016 0.706469 0.610401 0.231781 0.200263 13.6003 0.247517 2.062646 0.865841 0.742724 0.643081 0.243676 0.210984 13.4178 0.255904 2.132535 0.868351 0.780837 0.678040 0.256180 0.222454 13.1669 0.264575 2.204793 0.871611 0.820904 0.715510 0.269326 0.234747 12.8409 0.273540 2.279499 0.875694 0.863026 0.755747 0.283145 0.247948 12.4326 0.282808 2.356736 0.872934 0.907308 0.792020 0.297673 0.259849 12.7086 0.292391 2.436590 0.870075 0.953860 0.829930 0.312946 0.272287 12.9946 0.302298 2.519150 0.867318 1.002799 0.869745 0.329002 0.285349 13.2703 0.312541 2.604508 0.864675 1.060021 0.917367 0.345881 0.299075 13.5347 0.323131 2.692758 0.862157 1.130247 0.977481 0.363626 0.313503 13.7864 0.334080 2.783997 0.859778 1.209879 1.046502 0.382280 0.328676 14.02434 0.345399 2.878329 0.857549 1.298265 1.123777 0.401891 0.344641 14.2473 0.357103 2.975857 0.855484 1.395262 1.209164 0.422507 0.361448 14.4539 0.369203 3.076689 0.853594 1.500940 1.302737 0.444180 0.379150 14.6429 0.381713 3.180938 0.851893 1.615484 1.404694 0.466965 0.397804 14.8130 0.394646 3.288719 0.850392 1.739161 1.515313 0.490917 0.417472 14.9631 0.408018 3.400152 0.849105 1.872294 1.634941 0.516097 0.438220 15.0919 0.421843 3.515361 0.848041 2.015258 1.763973 0.542568 0.460120 15.1982 0.436137 3.634473 0.847213 2.168467 1.902855 0.570396 0.483247 15.2810 0.450915 3.757622 0.846630 2.332376 2.052076 0.599651 0.507683 15.3394 0.466193 3.884943 0.846300 2.507476 2.212168 0.630406 0.533513 15.3724 0.481989 4.016578 0.846231 2.694295 2.383702 0.662737 0.560828 15.3794 0.498321 4.152674 0.846425 2.893398 2.567291 0.696726 0.589726 15.3599 0.515206 4.293381 0.846887 3.105383 2.763584 0.732457 0.620308 15.3138 0.532663 4.438855 0.847614 3.330890 2.973270 0.770019 0.652679 15.2411 0.550711 4.589259 0.848602 3.570593 3.197073 0.809508 0.686950 15.1423 0.569371 4.744759 0.849843 3.825207 3.435752 0.851020 0.723233 15.0183 0.588663 4.905527 0.851321 4.095487 3.690094 0.894661 0.761644 14.8705 0.608609 5.071744 0.853018 4.382232 3.960916 0.940538 0.802296 14.7008 0.629231 5.243592 0.854905 4.686284 4.249054 0.988768 0.845303 14.5121 0.650552 5.421263 0.856948 5.008531 4.555355 1.039470 0.890772 14.3078 0.672594 5.604954 0.859102 5.349909 4.880673 1.092771 0.938802 14.0924 0.695384 5.794869 0.861312 5.711405 5.225848 1.148804 0.989479 13.8715

60 Science Report – Low-cost modifications of the Crump weir to improve fish passage
120 mm HIGH FIRST BAFFLE
BRIMPTON COMPOUND WEIR
SINGLE WEIR OR LOW WEIR ACTING ALONE
1H (m) d
H1 BSd,
d
CC
)sm(
13
BS−
Q
)sm(
13
mod−
Q
)sm(
length /
12
BS
−
Q
)sm(
length /
12
mod
−
Q
%100 BS
modBS
×
−Q
0.718946 5.991219 0.863509 6.094060 5.591696 1.207709 1.042868 13.6518 0.743307 6.194222 0.865612 6.498967 5.978982 1.269634 1.099011 13.4415

Science Report – Low-cost modifications of the Crump weir to improve fish passage 61
5 Conclusions Physical modelling has been used to develop a range of low-cost modifications to the Crump weir and other similar sloping weirs, for the purpose of improving fish passage, and to investigate the effect of the modifications upon flow measurement.
5.1 Modifications for fish passage
5.1.1
The V-channel arrangement, shown in Figure 5.1 in its particular application at Brimpton weir, constitutes the basic design of the low-cost modifications. It consists of 200 mm high baffles, with full depth 250 mm wide staggered slots, fixed to the downstream face of the weir at 400 mm centres. The first baffle downstream from the crest can be either a standard 200 mm baffle located 1,000 mm from the crest or a 120 mm high baffle 600 mm from the crest: the first arrangement is identical to the second arrangement with the 120 mm high baffle removed.
5.1.2
The V-channel arrangement will accommodate reflections of the fish pathway about the side walls, as many reflections as are necessary to preserve the oblique angle of the fish pathway and provide a continuous route from the tailwater to the crest. Many Crump weirs are of such width in relation to their height as to require (for geometrical reasons) no reflection of the fish pathway at all. In those cases, as mentioned in Section 4.1.9, it is likely that the velocity criterion would still be met on the resulting straight oblique route. Therefore, though developed from a site-specific model of Brimpton weir, the low-cost modifications are widely applicable and thus meet the main requirement of objective (d) in Section 1.2. For application at other sites, equivalence to the Brimpton low weir is expressed in terms of the same flow rate per unit length of weir crest, as given in Table 4.2. So, for example, a flow rate per unit length of weir crest of 0.0686 m2 s–1 at another site will give the same fish passage conditions prevailing at the 90-percentile low flow at the Brimpton weir.
5.1.3
The proportion of time during which the modifications provide successful fish passage will depend upon the site and its catchment hydrology. At Brimpton weir, it is estimated that satisfactory levels of fish passage will be achieved during the critical April-June period for at least 85 per cent of the time.
5.1.4
As required by objective (a) in Section 1.2, the modifications will retard and significantly deepen the supercritical sheet flow, with the benefit most evident at the lowest flows. For example, at the Brimpton 90-percentile low flow 3.5 m downstream from the crest of the standard unmodified weir, the estimated depth-averaged velocity is 3.9 m s–1 and the water depth 17.5 mm (estimated by means of Figure 14 in Beach 1984 and
62 Science Report – Low-cost modifications of the Crump weir to improve fish passage
checked by method used in Herschy et al. 1977). In contrast, along the fish pathway of the modified weir, there are substantial flow cross-sectional areas in the baffle slots in which the velocity is reduced to 1.1 m s–1, and the water depth downstream of the first baffle is nowhere less than 162 mm.
5.1.5
The modifications will provide adequate water depths for fish passage in all flows equal to or exceeding the 90-percentile low flow at Brimpton, or its equivalent at other sites (0.0686 m2 s−1 in Table 4.2).
5.1.6
Except for elver, all of the fish species in the Swimit database (Environment Agency 2003), over a wide range of sizes, will be able to pass through all of the baffles at the Brimpton 90-, 30- and 10-percentile low flows or their equivalent at other sites (Table 4.2). At the 50-percentile low flow, the more adverse velocity field at the slot of Baffle 3 would present a local obstruction to bream and smelt, in addition to elver.

Science Report – Low-cost modifications of the Crump weir to improve fish passage 63
Figure 5.1 General arrangement of proposed fish-pass modifications at field scale, in plan and elevation, showing cross-sectional details

64 Science Report – Low-cost modifications of the Crump weir to improve fish passage
5.1.7
Fish passage will or will not be continuous without interruption from tailwater to crest, depending on the length of the fish pathway and whether the fish has a sufficient burst speed to traverse it in less than 20 seconds. Fish with a lower burst speed that is still sufficient to achieve passage through each slot may however be able to progress intermittently, sheltering between adjacent baffles as necessary during periods of rest.
5.1.8
Upstream of the first baffle, the locally adverse velocity conditions will be beyond the burst speed capabilities of many of the fish that will have successfully negotiated the fish pathway through the baffles downstream. To progress past the weir crest, such fish will have to draw upon a reserve capability, exceeding their normal burst speed and exploitable for very short durations. There is evidence for such a capability, which will also serve the smaller fish in progressing through the baffle slots.
5.1.9
The first baffle was sized and located so as to give a ratio d/l = 0.2, with the baffle crest nominally at weir crest level, though (at field scale) actually 0.8 mm and 0.48 mm above the crest for the 200 mm and 120 mm baffles respectively. Such an arrangement minimizes the locally adverse conditions for fish passage upstream of the first baffle, but implicit in this is the acceptance of a significant effect upon the Crump weir discharge coefficient (Section 5.2.1) if used on a gauging weir.
5.1.10
Two alternative sizes for the first baffle were investigated, d = 200 mm and d = 120 mm, located at l = 1 m and l = 600 mm respectively. The smaller first baffle provided a slightly better upstream velocity field for fish passage.
5.1.11
In this study, the baffles had a cross-sectional aspect ratio of d/w = 2.5, which is therefore the proven geometry. However, it is likely that a comparable fish-pass performance could be achieved by similar modifications with the same baffle heights, centre-to-centre dimensions and slot widths, but using the baffle cross-sectional aspect ratio of d/w = 1.5 reported by the Environment Agency (2005) and previously installed on the Hurn flat-vee weir.
5.1.12
Siltation between the baffles will not be a problem at any flow rate. For suspended or floating trash, the modifications should be self-cleansing at the higher flow rates associated with the transport of such material in rivers and, if not, will create conditions no worse than those on an unmodified weir. No work has been done to investigate

Science Report – Low-Cost Modifications of the Crump Weir to Improve Fish Passage 65
biological fouling, but a survey of experience at existing sites would be informative if not having already been carried out.
5.1.13
Air entrainment will be greater than at model scale and might detract from the beneficial effect of the fish-pass modifications.
5.1.14
A small increase in the downstream gradient of the weir from the British Standard 1:5 to a gradient of 1:4.55 will have minimal effect on the flow velocity field through the baffled apron. The effects of larger variations of the downstream slope are not known, because the investigation required by objective (d) in Section 1.2 was only partly carried out. However, it is likely that significant increases or reductions in the downstream slope would cause substantial reductions or increases in the water depth respectively, in the latter case perhaps allowing the use of a smaller baffle height.
5.1.15
Supplementing the fish pathway of the V-channel arrangement with an additional narrow pool-and-weir channel for small fish was unsuccessful and is not recommended.
5.1.16
The baulk concept, though attractive for its simplicity, is for some Crump weirs inappropriate. Except for weir aprons of very wide aspect ratio, the enhancing baulk occupies too much of the channel width and forces too much of the weir flow onto the entry to the oblique baulk.
5.2 Hydrometric effect
5.2.1
As mentioned in Section 5.1.9, implicit in the fish-pass modifications that are recommended is the acceptance of a significant effect upon the Crump weir discharge coefficient. To reduce that effect, to less than say one per cent, would require the first baffle to be sited with a very low value of d/l. Then, upstream of the first baffle, the fish would have to traverse an extensive region of flow with inadequate water depths and severely adverse velocities. Therefore, given the necessarily high value of d/l needed for fish passage, new calibration equations different from those given by the British Standard will have to be implemented, for modular and non-modular (drowned flow) conditions.

66 Science Report – Low-cost modifications of the Crump weir to improve fish passage
5.2.2
Single-baffle experiments confirm that the modified weir discharge coefficient, as a multiple of the unmodified weir discharge coefficient, is a function of d/l and the non-dimensional total head H1/d.
5.2.3
In the modified baffle arrangement, a value of d1/l1 = 0.2 locates the first baffle crest nominally at weir crest level, which we have assumed to be the upper limit of an acceptable baffle crest elevation. This geometry provides satisfactory fish passage and the single-baffle discharge coefficient is well-defined as a function of H1/d by Equations 3 and 4 for the 200 mm first baffle (d1/l1 = 0.2 and d1/d2 = 1). Equations 5-7 for the 120 mm first baffle (d1/l1 = d2/l2 = 0.2, d1/d2 = 0.6) are derived from sparse data sets for a baffle pair and multiple baffles and are less accurate. In both cases the baffle cross-sectional aspect ratio is that used in the present work with d/w = 2.5.
5.2.4
For the same total head, the effect of the 120 mm first baffle upon the discharge is markedly greater than the effect of the 200 mm first baffle (Figure 4.9). However, for the same flow rate per unit length of weir, the corresponding total heads are for practical purposes not significantly different (Figure 4.8).
5.2.5
In non-modular flow, the relationship between drowned flow reduction factor f and head ratio is significantly affected by the presence of a single baffle at d/l = 0.2, whether the
head ratio is in terms of 1/2 HH or 1/p Hh. For the ratio 1/2 HH , f is over-estimated by
Equations 8 and 9 for the unmodified weir; for the ratio 1/p Hh, f is under-estimated by
Equation 10 for the unmodified weir.
5.2.6
In non-modular flow over the complete fish pass, the present work indicates that f is
quite well predicted in terms of 1/2 HH by equation 9. The measurements in the range applicable to Equation 8 were too sparse to be conclusive. No conclusion is possible
for the estimate of f in terms of 1/p Hh because ph
could not be measured with the complete fish-pass modifications in place.

Science Report – Low-Cost Modifications of the Crump Weir to Improve Fish Passage 67
6 Recommendations
6.1 Modifications for fish passage
6.1.1
For modifications to (non-gauging) sloping weirs that have no hydrometric significance, the design outlined in Sections 6.1.1.1 to 6.1.1.3 should be subjected to field-scale trials as soon as possible.
6.1.1.1 The oblique or V-channel arrangements of Figure 5.1 are recommended to meet the requirement for low-cost modifications to improve fish passage over the Crump weir and similar sloping weirs with a downstream slope (or glacis gradient) ≤ 1:5. The basic design, though developed on a model of Brimpton Weir, is adaptable to a wide range of sites by means of zero (oblique) or more (V-channel) reflections of the fish pathway about the side walls. At any Crump weir site, the performance of the modified weir can be predicted by inferring the same fish passage conditions at the same flow rates per unit length of weir (Table 4.2).
6.1.1.2 Although there is evidence that with no reflections of the fish pathway fish swimming criteria are still likely to be met, that claim should be verified by laboratory or field experiment. Subject to the latter, the oblique arrangement with no reflection of the fish pathway would be applicable to weirs of very wide aspect ratio.
6.1.1.3 To optimize fish passage, the first baffle should be located with d1/l1 = 0.2. A smaller value of d1/l1 will aggravate fish swimming conditions upstream of Baffle 1, though it is likely that downstream of Baffle 1 conditions would be little affected. However, because of the hydrometric benefits of a smaller ratio d1/l1, field trials in which d1/l1 is reduced to determine the effect on fish passage upstream of the first baffle would be beneficial, and these should be carried out as part of the work described in Section 6.1.1.5. The choice of first baffle height, between the arrangement d1/d2 = 1 (equal baffle heights) and the arrangement d1/l1 = d2/l2 = 0.2 (smaller Baffle 1), slightly favours the latter. However, both arrangements should be retained as options, and subjected to trials in the field.
6.1.1.4 The conclusions drawn from this work are based upon a baffle cross-sectional aspect ratio d/w = 2.5, which at laboratory scale has proved effective. However, we recognize that an aspect ratio of d/w = 1.5 was used on the Hurn flat-vee weir and in the single baffle study by the Environment Agency (2005). We therefore recommend that the option of d/w = 1.5 be retained as an alternative baffle cross-section, in case other considerations favour it. We think that a comparable fish-pass performance could be achieved by the latter baffle cross-section, deployed in the same V-channel arrangement (Section 6.1.1.1).
6.1.1.5 Fish-movement studies should be carried out in the field on a non-gauging weir, similar to the Crump weir, modified as recommended in Sections 6.1.1.1 to 6.1.1.3, to test the effectiveness of the modifications. The opportunity should be taken to refine the size and location of the first baffle and determine the best baffle cross-sectional geometry. To that end, the baffle arrangement should be fabricated as a lightweight integral component mounted on a board that could be craned into position, moved up- or downstream or easily replaced by an alternative configuration. Multiple adjustments or substitutions of baffle arrangements could be achieved rapidly, and studies carried out over short time-scales during which fish colonization and swimming preferences

68 Science Report – Low-cost modifications of the Crump weir to improve fish passage
could reasonably be assumed constant. The field trials would also assess the effect of significantly different weir slopes, validate the self-cleansing facility of the modifications and identify any problem with air entrainment.
6.1.1.6 The field trials previously recommended apply to installations scaled up from the laboratory model, with the view to only minor adjustments. However, that should not preclude further experiment, and the opportunity could be taken to test more radical changes to the design. For example, deploying the modifications over a part-width of the weir apron and separating them from the standard weir flow by means of a higher vertical baffle with a longitudinal axis might be beneficial, and would be more easily applied to non-gauging weirs, without hydrometric constraints.
6.2 Hydrometric effect
6.2.1
Subject to a successful outcome of the trials on non-gauging weirs recommended in Section 6.1.1, the Environment Agency should adopt the recommended design to modify and recalibrate its gauging weirs. Substantial benefits to fish passage can be achieved at such weirs by means of low-cost modifications, but will require the location of Baffle 1 so close to the crest as to significantly affect the stage–discharge curve. Although the present results, and those of the Environment Agency (2005), for one or more baffles provide insights into the effect upon the weir discharge coefficient, physical modelling of the stage–discharge relationship should be extended to provide a set of definitive calibration equations for the full baffle arrangement, under both modular and non-modular flow conditions.
6.2.1.1 If the baffle arrangement with d1/l1 = 0.2 and d1/d2 = 1 (equal baffle heights) and the baffle cross-sectional aspect ratio d/w = 2.5 is adopted, Equations 3 and 4 could be used to estimate (to ± one per cent) the modified discharge coefficient under modular flow conditions, provided that H1 ≤ 1.4 (that is H1/d ≤ 7, within the range of the data in Figure 3.20).
6.2.1.2 For the modifications with unequally sized Baffles 1 and 2 (d1/l1 = d2/l2 = 0.2, d1/d2 = 0.6), Equations 5-7 should not be applied in the field because of their inadequate basis data set (Figure 3.24). However, the set of calibration curves in Figure 3.24, which is markedly different from that in Figure 3.20, serves to highlight the significantly different hydraulic effect of the two baffle arrangements, even though sharing the same value of d1/l1 = 0.2. Therefore, additional physical modelling under modular flow conditions is recommended to determine a reliable calibration curve for the multiple baffle arrangement in which Baffles 1 and 2 are unequally sized (d1/l1 = d2/l2 = 0.2, d1/d2 = 0.6).
6.2.1.3 If the cross-sectional aspect ratio d/w = 1.5 (Environment Agency 2005) were adopted in preference to the (d/w = 2.5) cross-section used in the present study, extra physical modelling would be required to extend the data to d/l = 0.2 and H1/d ≤ 2.5 for application to the equal baffle arrangement (d1/l1 = 0.2 and d1/d2 = 1). Such modelling would be better carried out with multiple baffles. The other baffle arrangement (d1/l1 = d2/l2 = 0.2, d1/d2 = 0.6) would also require a programme of physical modelling, in which multiple baffles would be essential.
6.2.1.4 For non-modular flows over the adopted baffle arrangement, physical modelling should be carried out to comprehensively define the calibration curves for drowned flow reduction factor f in terms of the independent variables 1/2 HH and 1/p Hh . The

Science Report – Low-Cost Modifications of the Crump Weir to Improve Fish Passage 69
complete baffle arrangement should be used because its effect cannot be modelled by a single baffle.
6.2.1.5 As noted in Section 4.2.14, for the flow ranges modelled, the upstream head on the unmodified weir is increased by up to about 0.1 m at field scale by the installed baffle arrangements, with either the 200 mm or 120 mm sizes of Baffle 1. Where it is proposed to deploy such modifications in a flood-risk area, their effect on upstream water levels should be carefully taken into account.
70 Science Report – Low-cost modifications of the Crump weir to improve fish passage
References ARMSTRONG, G.S., 2002. Some principle guidelines/criteria for improving fish movement at crump weirs using low-cost baffle solutions or other methods. Unpublished private communication.
ARMSTRONG, G.S., 2003. Low Cost Solutions Project Board Meeting, 3 April 2003, unpublished notes by S.A. Servais.
BEACH, M.H., 1984. Fish pass design—criteria for the design and approval of fish passes and other structures to facilitate the passage of migratory fish in rivers. Fisheries Research Technical Report No. 78, Ministry of Agriculture, Fisheries and Food, Directorate of Fisheries Research, Lowestoft.
BRITISH STANDARDS INSTITUTION, 1986. Measurement of liquid flow in open channels. Part 4: Weirs and flumes―Part 4B: Triangular profile weirs. BS 3680-4B:1986.
BRITISH STANDARDS INSTITUTION. 1992. Measurement of fluid flow in closed channels. Part 1: Pressure differential devices―Section 4: Guide to the use of devices specified in Sections 1.1 and 1.2. BS 1042–1.1:1992, incorporating Amendment No. 1.
CIHAR, J., 1998. A field guide in colour to freshwater fish. Blitz Editions, Leicester.
CLOUGH, S., 2003. Personal communication. Addressed to G.S. Armstrong, Environment Agency, February, 2003.
ENVIRONMENT AGENCY, 2001a. Problem gauging sites. Excel spreadsheet.
ENVIRONMENT AGENCY, 2001b. Swimming speeds in fish: literature review. Turnpenny, A.W.H., Blay, S.R., Carron, J.J. and Clough, S.C. R&D Technical Report No W20-26/TR2.
ENVIRONMENT AGENCY, 2003. ‘Swimit’ Version 2.0. Excel spreadsheet, Fawley Aquatic Research.
ENVIRONMENT AGENCY, 2005. Flow measurement structure design to aid fish migration without compromising flow data accuracy. Science Report: SC020053/SR2.
FORT, R.S. AND BRAYSHAW, J.D., 1961. Fishery management. Faber and Faber, London.
HERSCHY, R.W., WHITE, W.R. AND WHITEHEAD, E., 1977. The design of Crump weirs. Technical Memorandum No. 8, Department of the Environment, Water Data Unit, Reading, February 1977.
HERTEL, H., 1969. Hydrodynamics of swimming and wave-riding dolphins. Biology of Marine Mammals. Ed. H.T. Anderson, Academic Press, London, 31−33.
LARINIER, M., 1992. Biological factors to be taken into account in the design of fish passage facilities, the concept of obstructions to upstream migration. Bulletin Francais de la Peche et de la Pisciculture. Nos. 326-327, Le Conseil Superieur de la Peche, 20−29.
NAG, 1999. The NAG Fortran Library―Mark 19. The Numerical Algorithms Group Ltd., Oxford, UK.
PINNIGER, J., 1998. A study of the impact of gauging weir structures on coarse fish and their spawning migrations. Professional Training Report, presented in part fulfillment of BSc Hons Degree in Zoology, University of Wales, College of Cardiff.
RHODES, D.G. AND SERVAIS, S.A., 2003. Methods for measuring the free surface position in laboratory flows. Proceedings of the 30th IAHR Congress. Theme C Inland

Science Report – Low-Cost Modifications of the Crump Weir to Improve Fish Passage 71
Waters: Research, Engineering and Management, Vol. 1, Ed. Nezu, I. And N. Kotsovinos, 24-29 August 2003, Thessaloniki, Greece, 203–210.
RHODES, D.G. AND SERVAIS, S.A., 2004. Hydrometric effect of fish-pass modifications to the Crump weir. Fifth International Symposium on Ecohydraulics. Aquatic Habitats: Analysis and Restoration. Ed. Diego Garcia de Jalon Lastra and Pilar Vizcaino Martinez, 12-17 September 2004, Madrid, Spain, 969–972.
SALMON ADVISORY COMMITTEE, 1997. Fish passes and screens for salmon. Ministry of Agriculture, Fisheries and Food; Scottish Office Agriculture, Environment and Fisheries Department; Welsh Office Agriculture Department. MAFF Publications, London.
SARKER, M.A., RHODES, D.G. AND ARMSTRONG, G.S., 2001. Modification of Crump weir to facilitate fish passage. Proceedings of the 29th IAHR Congress. Theme B Environmental Hydraulics and Eco-Hydraulics, Ed. Guifen Li, 16-21 September 2001, Beijing, China, Tsinghua University Press, 371–376.
SERVAIS, S.A., 2006. Physical modelling of low-cost modifications to the Crump weir in order to improve fish passage: development of favourable swimming conditions and investigation of the hydrometric effect. PhD Thesis, Cranfield University, Engineering Systems Department, Shrivenham, Swindon, UK.
SERVAIS, S.A., RHODES, D.G. AND ARMSTRONG, G.S., 2003. Development of low-cost modifications to the Crump weir to improve fish passage. Proceedings of the 30th IAHR Congress. Theme C Inland Waters: Research, Engineering and Management, Vol. 2, Ed. Nezu, I. And N. Kotsovinos, 24-29 August 2003, Thessaloniki, Greece, 441–448.
SERVAIS, S.A., RHODES, D.G. AND ARMSTRONG, G.S., 2004. Low-cost modifications to the Crump weir for fish passage: trial solutions. Fifth International Symposium on Ecohydraulics. Aquatic Habitats: Analysis and Restoration. Ed. Diego Garcia de Jalon Lastra and Pilar Vizcaino Martinez, 12-17 September 2004, Madrid, Spain, 964–968.
SOLOMON, D.J. AND BEACH, M.H., 2004. Manual for provision of upstream migration facilities for eel and elver. Science Report SC020075/SR2, Environment Agency, Bristol.
TURNPENNY, A.W.H., 1981. An analysis of mesh sizes required for screening fish at water intakes. Estuaries, 4(4), Estuarine Research Federation, Port Republic, MD, USA, 363−368.

72 Science Report – Low-cost modifications of the Crump weir to improve fish passage
Notation d baffle height. d1 and d2 refer to first and second baffles
respectively in the two-baffle arrangement or the complete fish-pass arrangement
D diameter of delivery main to laboratory flume
f drowned flow reduction factor
h1 upstream static head measured relative to weir crest level
h2 tailwater static head measured relative to weir crest level
hp static head at crest tappings measured relative to weir crest level
H1 upstream total head measured relative to weir crest level
H2 tailwater total head measured relative to weir crest level
l dimension from weir crest to centreline of first baffle. l1 and l2 refer to first and second baffles respectively in the two-baffle arrangement or the complete fish-pass arrangement
l' dimension from weir crest to upstream face of first baffle
L length of glacis or downstream slope of weir from crest to tailwater
Q weir flow rate. Used with subscripts 1 and 2 for non-modular flows over complete fish pass. Used with subscripts BS and mod for the unmodified British Standard weir and for the weir modified by the baffle installation respectively
w width of baffle
x, y, z coordinate system with its axes normal to the vertical transverse, horizontal and vertical longitudinal planes respectively
x´, y´, z´ coordinate system obtained by rotating the x, y, z system about the z-axis to make x´ and y´ respectively parallel to and normal to the weir face

Science Report – Low-Cost Modifications of the Crump Weir to Improve Fish Passage 73
List of abbreviations CFD Computational Fluid Dynamics in which the equations of fluid motion are solved by
numerical methods. For turbulent flows, approximations normally have to be introduced to represent the mixing process as it applies to momentum, heat and mass transfer.
PTV Particle Tracking Velocimetry. A method of flow velocity measurement in which successive video frames are captured of the fluid seeded with particles and penetrated by a sheet of light. By tracking individual particles, flow velocity vectors are determined from the particle displacements and the video frame rate.
rms Root mean square, that is, the square root of the arithmetic mean of the variate squared.

74 Science Report – Low-cost modifications of the Crump weir to improve fish passage
Appendix A Analysis of data in Environment Agency (2005) A.1 The data was carefully scaled from Figure 5.4 in Environment Agency (2005) which shows Cd/CdBS plotted against H1. The data was organized in terms of d/l where, as elsewhere in our study, l was the x' coordinate of the line of symmetry of the baffle cross-section and not of the baffle upstream face, the convention used in the 2005 study. Among the data, two sets of identical d/l values were found, each set consisting of two different baffle heights. Section 4.2.7 refers to Figure 4.7, which shows this data colour-coded according to d/l and, where two baffle heights occurred at the same d/l, they are identified by different symbols. The same data is shown on its own in Figure A.1. It can be seen that each pair of data sets with an identical d/l defines near-coincident curves. Given the similar concave-upwards shape to each data set, the prospect of a single-function fit was followed up.
0 5 10 15 20 25 30 350.9
0.91
0.92
0.93
0.94
0.95
0.96
0.97
0.98
0.99
1
1.01
H1/d
Cd/
Cd B
S
d/L = 0.152
0.115
0.0779
0.0395
HR DATA
d/L = 0.183
EXTRAPOLATION
Figure A.1 Graphical representation of fitted Equation A.1, with the original data
A.2 The analysis carried out consisted of a non-linear least squares curve-fitting process, by means of the NAG Library routine E04HYF (NAG 1999), using a modified Gauss-Newton algorithm. Following trials on several different expressions and subsequent refinement of the best of them, the following equation was derived:
⎥⎥⎦
⎤
⎢⎢⎣
⎡⎥⎦
⎤⎢⎣
⎡⎟⎟⎠
⎞⎜⎜⎝
⎛⎟⎟⎠
⎞⎜⎜⎝
⎛⎟⎠⎞
⎜⎝⎛
++−=l
Hxx
l
Hxx
x
ldC 1 ln5 cos2
1 ln431
1dBSC
d (A.1)

Science Report – Low-Cost Modifications of the Crump Weir to Improve Fish Passage 75
where
2731828.20554495.05045579.07514851.05579007.1
5
4
3
2
1
=
=
==
=
xxxxx
In Figure A.1, Equation A.1 is plotted as dBS/d CC against dH /1 for a succession of ld / values corresponding to the original measurements, each represented by a single
curve. Included in Figure A.1 is an additional curve for 183.0/ =ld , which is an extrapolation using Equation A.1. Comparison of this curve with our measurements at
183.0/ =ld shown in Figure 3.21, confirms that the latter give consistently lower values of dBS/d CC .
A.3 In Figure 5.5 of the 2005 study, ranges of dBS/d CC are plotted in lH /1 ―
dH /1 space. In particular, the data for 99.0dBS/d >CC is singled out and Equation 5.1 from the 2005 study is fitted, as follows
4179.00026.0001.0 12
11 +−⎟⎠⎞
⎜⎝⎛=
′ dH
dH
lH
where l ′ is the dimension from the crest to the upstream face of the baffle. Expressed in terms of l, the dimension from the crest to the centreline of the baffle, that equation becomes
11
4179.010026.02
1 001.01
1311
−−
+−+−
=⎥⎥⎥
⎦
⎤
⎢⎢⎢
⎣
⎡
⎥⎥
⎦
⎤
⎢⎢
⎣
⎡
⎟⎟⎠
⎞⎜⎜⎝
⎛⎟⎟⎠
⎞⎜⎜⎝
⎛d
H
d
H
d
H
l
H (A.2)
A.4 Figure A.2 shows contours of dBS/d CC in terms of lH /1 and dH /1 , derived from Equation A.1, and is thus a continuous expression of the discrete representation in Figure 5.5 of the 2005 study. The contours include extrapolations beyond the range of the original data. Equation A.2 is shown by the red line in Figure A.2. It thus represents a sample in the lH /1 ― dH /1 space, for which 99.0dBS/d >CC .
However, unlike the 99.0dBS/d =CC contour, it does not define the boundary
of 99.0dBS/d ≥CC , but being a sample lies entirely on the positive side of that boundary, as expected.
A.5 Therefore, to define the position and size of the first baffle so as to affect the weir discharge coefficient by less than one per cent, the 99.0dBS/d =CC contour in Figure A.2 could be used, rather than Equation A.2 (or Equation 5.1 as given in the 2005 study). However, for a given 1H and d , Equation A.2 will give a larger and thus conservative value of l .

76 Science Report – Low-cost modifications of the Crump weir to improve fish passage
5 10 15 20 25 300.4
0.6
0.8
1.0
1.2
1.4
1.6
1.8
2.0
2.2
2.4
H1/d
H1/L 0.
70.
80.
85 0.9
0.93
0.95
0.96
0.97
0.975
0.98
0.9850.9875
0.99
0.9925
0.995
0.995
0.9925
0.990.9
875
Cd/C
d,BS
Equation A.2
Figure A.2 Contours of Cd/CdBS together with fitted Equation A.2 (shaded areas extrapolated out of range of data)

We are The Environment Agency. It's our job to look after your environment and make it a better place – for you, and for future generations.
Your environment is the air you breathe, the water you drink and the ground you walk on. Working with business, Government and society as a whole, we are making your environment cleaner and healthier.
The Environment Agency. Out there, making your environment a better place.
Published by: Environment Agency Rio House Waterside Drive, Aztec West Almondsbury, Bristol BS32 4UD Tel: 0870 8506506 Email: [email protected] www.environment-agency.gov.uk © Environment Agency All rights reserved. This document may be reproduced with prior permission of the Environment Agency.