Embed Size (px)
Citation preview
MARCH 2021
WHITE PAPER
LOW-COST CARRIERS AND U.S. AVIATION EMISSIONS GROWTH, 2005 TO 2019Brandon Graver, Ph.D. and Dan Rutherford, Ph.D.
B E I J I N G | B E R L I N | S A N F R A N C I S C O | S Ã O PA U LO | WA S H I N G TO N
www.theicct.org
twitter @theicct
ACKNOWLEDGMENTS
The authors thank Jeff Pelletier of Airline Data Inc. for his review of the data, and Xinyi Sola Zheng, Amy Smorodin, and Dale Hall of the ICCT for their review of the narrative.
International Council on Clean Transportation 1500 K Street NW, Suite 650, Washington, DC 20005
[email protected] | www.theicct.org | @TheICCT
© 2021 International Council on Clean Transportation
i ICCT WHITE PAPER | LOW-COST CARRIERS AND U.S. AVIATION EMISSIONS GROWTH, 2005 TO 2019
TABLE OF CONTENTS
Abbreviations ........................................................................................................................... iii
Executive summary ................................................................................................................. iv
Introduction ................................................................................................................................1
Methodology ............................................................................................................................. 2
Passenger airline characterization ....................................................................................................2
Airline operations database .................................................................................................................2
Fuel burn modeling .................................................................................................................................2
Validation .....................................................................................................................................................3
Other airline fuel consumption ...........................................................................................................3
Results ........................................................................................................................................4
Total operations and fuel burn of U.S. airlines .............................................................................4
Domestic passenger market, 2005-2019 .......................................................................................9
Comparison to foreign airlines ...........................................................................................................11
Atlantic passenger market ...................................................................................................................11
Canada transborder passenger market .........................................................................................12
Latin America passenger market .....................................................................................................13
Pacific passenger market ................................................................................................................... 14
Post-COVID future .................................................................................................................. 16
Conclusion and policy implications .....................................................................................17
References ............................................................................................................................... 19
Appendix A: Conversion factors ...........................................................................................21
Appendix B: Passenger aircraft in analysis........................................................................22
Appendix C: Airline-specific data for markets studied ...................................................24

ii ICCT WHITE PAPER | LOW-COST CARRIERS AND U.S. AVIATION EMISSIONS GROWTH, 2005 TO 2019
LIST OF FIGURESFigure ES-1. RPM, fuel use, and fuel efficiency growth by U.S. passenger air carrier type, 2005 to 2019. .................................................................................................................. iv
Figure ES-2. Fuel use by U.S. passenger air carrier type, 2005 to 2019 and fuel use growth. ...............................................................................................................................................v
Figure 1. Fuel consumption by U.S. commercial airlines, 2005-2019. ......................................4
Figure 2. Revenue passenger miles (a) and fuel efficiency (b) of U.S. air carriers, by aircraft class. .......................................................................................................................6
Figure 3. Fuel efficiency by route distance and aircraft class for U.S. domestic airport pairs, 2019. ......................................................................................................................7
Figure 4. RPM, fuel use, and fuel efficiency growth by U.S. passenger air carrier type, 2005 to 2019 ...........................................................................................................................8
Figure 5. Fuel use by U.S. passenger air carrier type, 2005 to 2019 and fuel use growth. ........................................................................................................................................................9
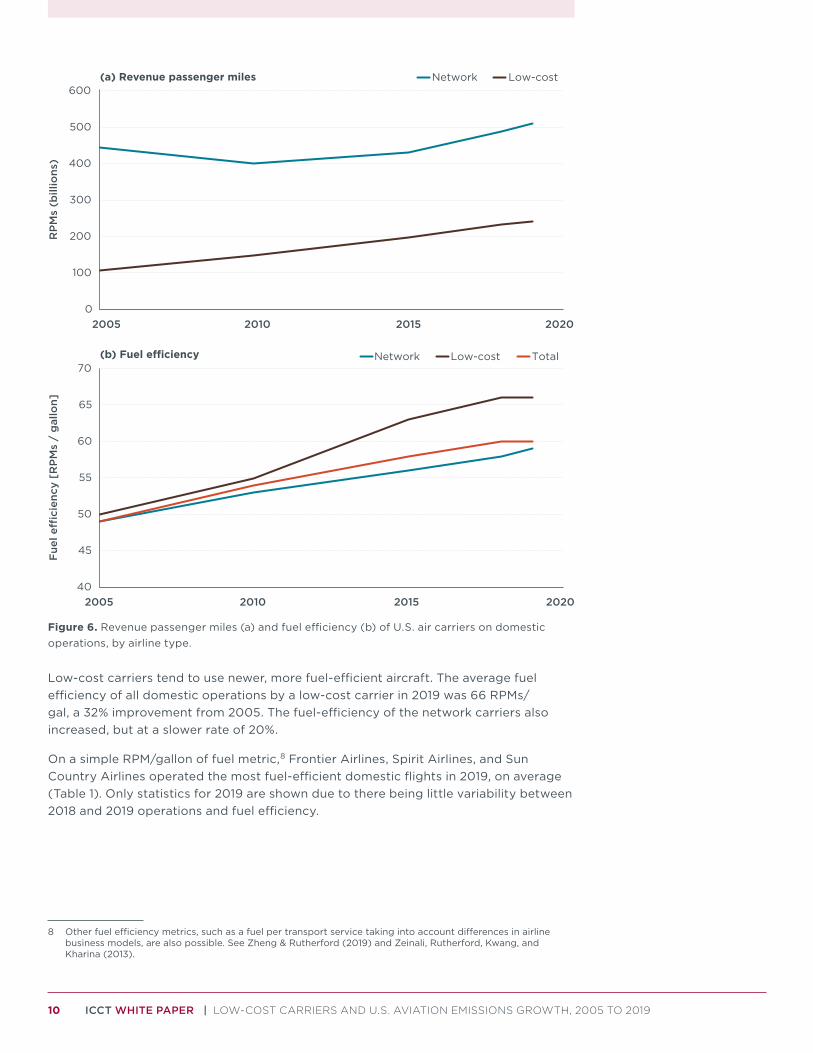
Figure 6. Revenue passenger miles (a) and fuel efficiency (b) of U.S. air carriers on domestic operations, by airline type. ............................................................................................. 10
Figure 7. CO2 emissions from U.S. commercial airlines, 2005 to 2030 ................................. 16
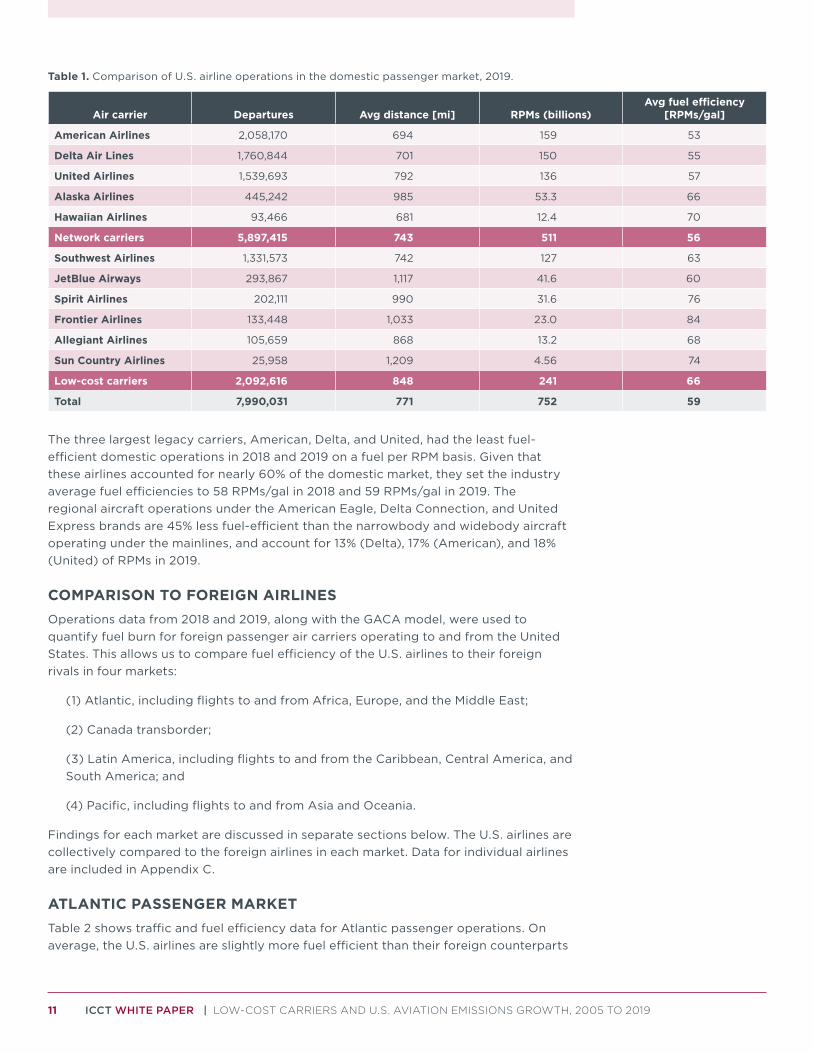
LIST OF TABLESTable 1. Comparison of U.S. airline operations in the domestic passenger market, 2019. .................................................................................................................................................... 11
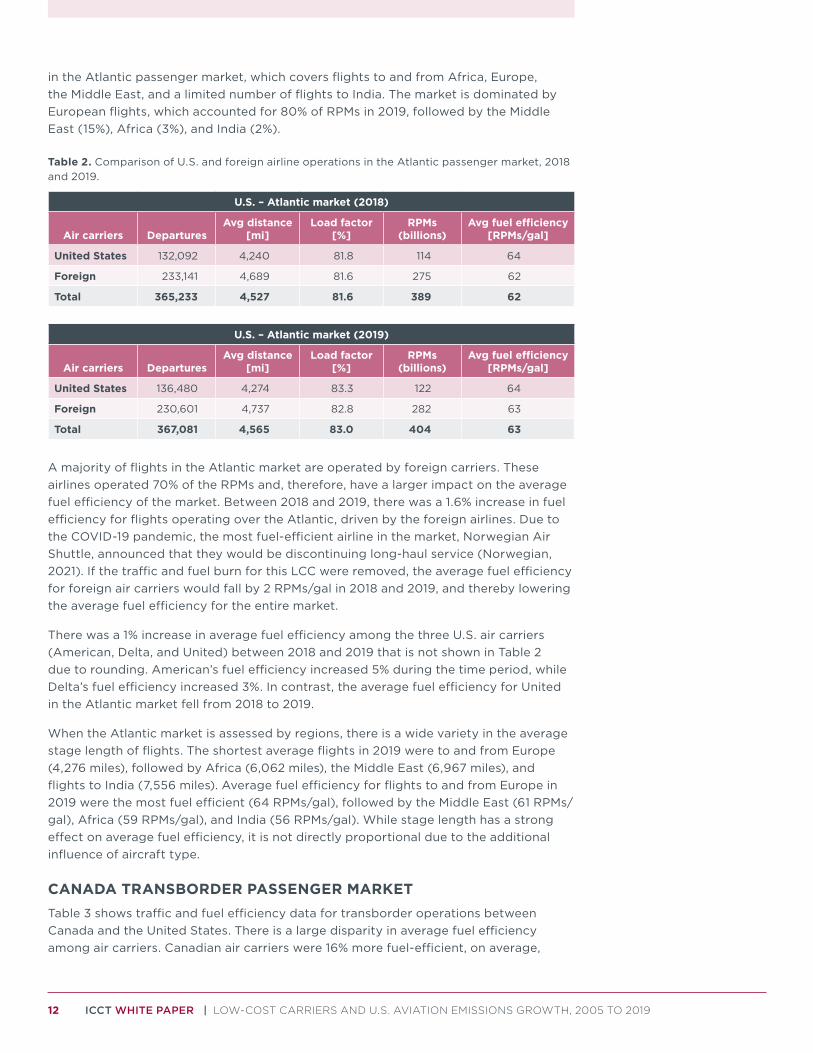
Table 2. Comparison of U.S. and foreign airline operations in the Atlantic passenger market, 2018 and 2019. ......................................................................................................... 12
Table 3. Comparison of U.S. and Canadian airline operations in the transborder passenger market, 2018 and 2019. ......................................................................................................... 13
Table 4. Comparison of U.S. and foreign airline operations in the Latin America passenger market, 2018 and 2019. .........................................................................................................14
Table 5. Comparison of U.S. and foreign airline operations in the Pacific passenger market, 2018 and 2019. .........................................................................................................15
Table A.C1 Airline-specific data for U.S.–Atlantic passenger market ...................................24
Table A.C2 Airline-specific data for U.S.–Canada passenger market ..................................26
Table A.C3 Airline-specific data for U.S.–Latin America passenger market ...................... 27
Table A.C4 Airline-specific data for U.S.–Pacific passenger market .....................................28
iii ICCT WHITE PAPER | LOW-COST CARRIERS AND U.S. AVIATION EMISSIONS GROWTH, 2005 TO 2019
ABBREVIATIONSASM available seat mile
CO2 carbon dioxide
CO2e carbon dioxide equivalent
CTM cargo ton mile
EPA U.S. Environmental Protection Agency
EU European Union
FAA U.S. Federal Aviation Administration
FTM freight ton mile
GACA Global Aviation Carbon Assessment
gal gallon
ICAO International Civil Aviation Organization
kg kilogram
LCC low-cost carrier
mi mile
Mt million tonnes
RPM revenue passenger mile
RTM revenue ton mile
iv ICCT WHITE PAPER | LOW-COST CARRIERS AND U.S. AVIATION EMISSIONS GROWTH, 2005 TO 2019
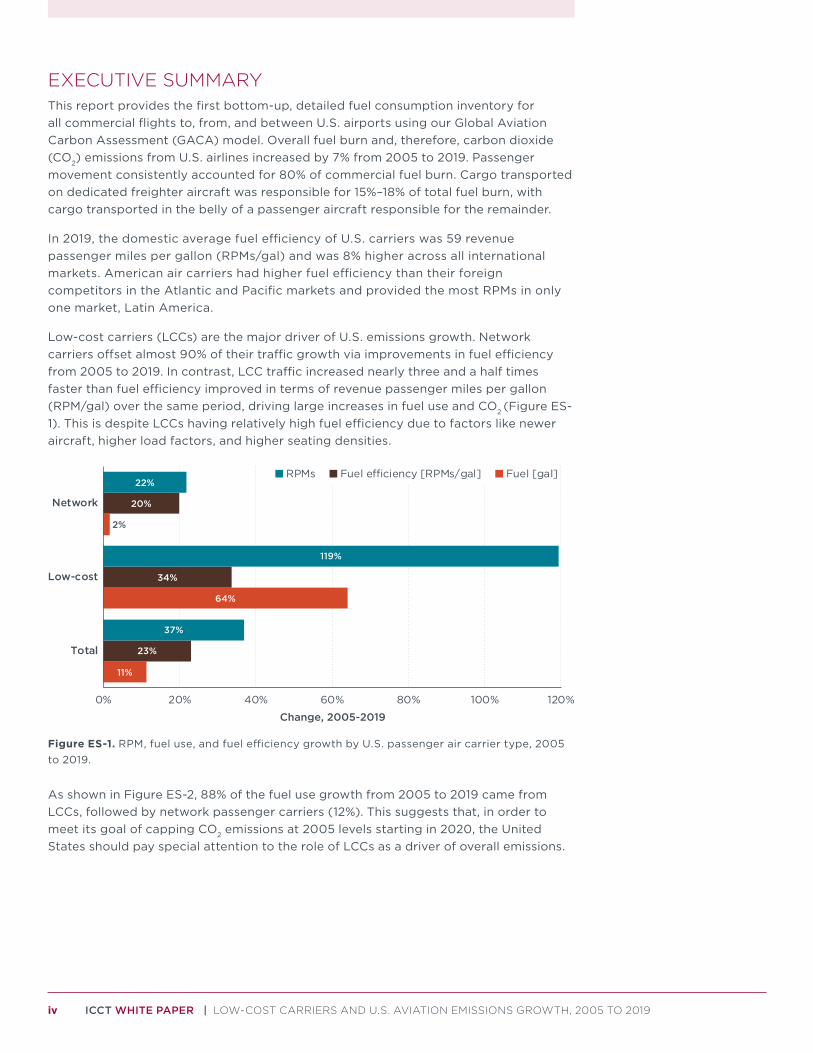
EXECUTIVE SUMMARYThis report provides the first bottom-up, detailed fuel consumption inventory for all commercial flights to, from, and between U.S. airports using our Global Aviation Carbon Assessment (GACA) model. Overall fuel burn and, therefore, carbon dioxide (CO2) emissions from U.S. airlines increased by 7% from 2005 to 2019. Passenger movement consistently accounted for 80% of commercial fuel burn. Cargo transported on dedicated freighter aircraft was responsible for 15%–18% of total fuel burn, with cargo transported in the belly of a passenger aircraft responsible for the remainder.
In 2019, the domestic average fuel efficiency of U.S. carriers was 59 revenue passenger miles per gallon (RPMs/gal) and was 8% higher across all international markets. American air carriers had higher fuel efficiency than their foreign competitors in the Atlantic and Pacific markets and provided the most RPMs in only one market, Latin America.
Low-cost carriers (LCCs) are the major driver of U.S. emissions growth. Network carriers offset almost 90% of their traffic growth via improvements in fuel efficiency from 2005 to 2019. In contrast, LCC traffic increased nearly three and a half times faster than fuel efficiency improved in terms of revenue passenger miles per gallon (RPM/gal) over the same period, driving large increases in fuel use and CO2 (Figure ES-1). This is despite LCCs having relatively high fuel efficiency due to factors like newer aircraft, higher load factors, and higher seating densities.
11%
64%
2%
23%
34%
20%
37%
119%
22%
0% 20% 40% 60% 80% 100% 120%
Total
Low-cost
Network
Change, 2005-2019
RPMs Fuel e�ciency [RPMs/gal] Fuel [gal]
Figure ES-1. RPM, fuel use, and fuel efficiency growth by U.S. passenger air carrier type, 2005 to 2019.
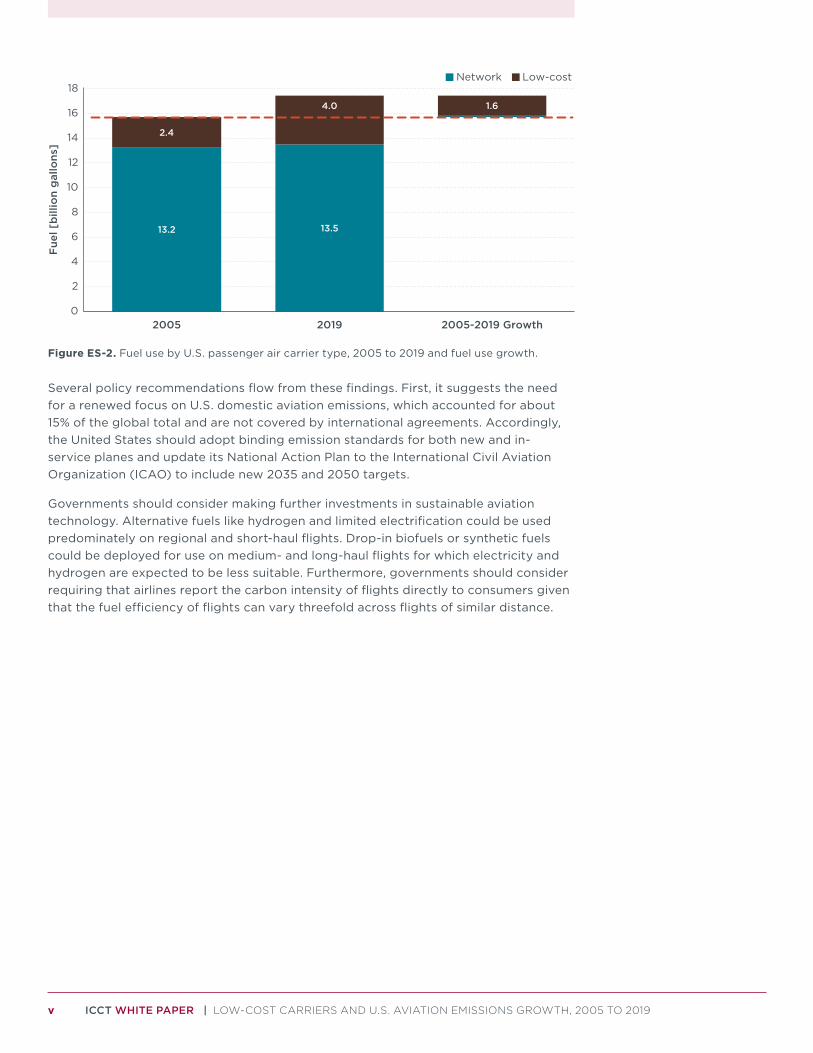
As shown in Figure ES-2, 88% of the fuel use growth from 2005 to 2019 came from LCCs, followed by network passenger carriers (12%). This suggests that, in order to meet its goal of capping CO2 emissions at 2005 levels starting in 2020, the United States should pay special attention to the role of LCCs as a driver of overall emissions.
v ICCT WHITE PAPER | LOW-COST CARRIERS AND U.S. AVIATION EMISSIONS GROWTH, 2005 TO 2019
13.2 13.5
2.4
4.0 1.6
0
2
4
6
8
10
12
14
16
18
2005 2019 2005-2019 Growth
Fue
l [b
illio
n g
allo
ns]
Network Low-cost
Figure ES-2. Fuel use by U.S. passenger air carrier type, 2005 to 2019 and fuel use growth.
Several policy recommendations flow from these findings. First, it suggests the need for a renewed focus on U.S. domestic aviation emissions, which accounted for about 15% of the global total and are not covered by international agreements. Accordingly, the United States should adopt binding emission standards for both new and in-service planes and update its National Action Plan to the International Civil Aviation Organization (ICAO) to include new 2035 and 2050 targets.
Governments should consider making further investments in sustainable aviation technology. Alternative fuels like hydrogen and limited electrification could be used predominately on regional and short-haul flights. Drop-in biofuels or synthetic fuels could be deployed for use on medium- and long-haul flights for which electricity and hydrogen are expected to be less suitable. Furthermore, governments should consider requiring that airlines report the carbon intensity of flights directly to consumers given that the fuel efficiency of flights can vary threefold across flights of similar distance.
1 ICCT WHITE PAPER | LOW-COST CARRIERS AND U.S. AVIATION EMISSIONS GROWTH, 2005 TO 2019
INTRODUCTIONPublic concern about the climate impact of commercial aviation is on the rise. Even before the sharp global downturn in traffic due to the COVID-19 pandemic, airlines were increasingly concerned about the flygskam (“flying shame”) movement in Europe, which could potentially halve the growth of air travel if people stopped flying (‘Flight shame’ could halve growth in air traffic, October 2, 2019). Pre-COVID, global aviation carbon dioxide (CO2) emissions increased rapidly—almost 70% faster than United Nations (UN) projections from 2013 to 2018 (Graver et al., 2019)—and could account for one-quarter of global emissions under a 1.5°C carbon budget through 2050 (Pidcock & Yeo, 2016).
Governments have been relatively slow to recognize the threat of aviation emissions, especially at the international level. The UN’s International Civil Aviation Organization (ICAO) has discussed a long-term greenhouse gas (GHG) cap since 2013, but has thus far failed to come to an agreement. Instead of reducing emissions from aircraft, ICAO has settled on a “mostly toothless carbon-offsetting scheme” (Airlines blame covid-19 for rowing back climate commitments, July 2, 2020) that isn’t expected to require offsetting until at least 2027 (Niranjan & Schacht, 2021). The organization has also recommended a CO2 emission standard which lags technology by more than a decade and won’t actually reduce aircraft emissions (Zheng & Rutherford, 2020; EPA, 2021).
Given the slow rate of international progress, attention has instead turned to domestic aviation, which accounts for about 45% of global passenger CO2 (Graver et al., 2020).1 In 2012, the European Union (EU) began covering domestic and intra-EU emissions under its Emissions Trading System; today, it is investigating tightening those requirements and considering introducing mandates for the use of alternative jet fuels (EC, 2020). Canada covers a limited amount of aviation jet fuel2 under its federal carbon pricing mechanism, which has been proposed to increase to Can$170 per tonne CO2e by 2030 (ECCC, 2020a). The U.S. Environmental Protection Agency adopted ICAO’s CO2 standard (EPA, 2021)3 in part to contribute to efforts to cap emissions from U.S. airlines at 2005 levels starting in 2020 (FAA, 2015).
As national policymakers consider additional measures, they would benefit from a better understanding of the drivers of airline fuel use and emissions. This report provides the first bottom-up, detailed fuel consumption inventory for all commercial flights to, from, and between U.S. airports using our Global Aviation Carbon Assessment (GACA) model. We investigate growth trends in traffic, fuel use, fuel efficiency, and CO2 emissions from 2005 to 2019 at multiple levels: by market, airline and airline type, aircraft class, and stage length. We also analyze key drivers and the relative performance of U.S. versus foreign carriers.
The next section outlines our research methods. Following that, we present the main findings regarding growth in traffic, fuel use, fuel efficiency, and CO2 emissions. We close with conclusions and brief policy implications drawn from the analysis. Detailed findings by carrier can be found in the appendices.
1 This percentage includes flights within the European Union (intra-EU).2 Currently, intraprovincial aviation emissions are covered in certain provinces, including Alberta, British
Columbia, Manitoba, Ontario, Prince Edward Island, and Saskatchewan at a rate of Can$40 per tonne CO2e (ECCC, 2020b).
3 As of publication, the Final Rule of Control of Air Pollution from Airplanes and Airplane Engines: GHG Emission Standards and Test Procedures is under immediate review by the Biden administration (White House, 2021).
2 ICCT WHITE PAPER | LOW-COST CARRIERS AND U.S. AVIATION EMISSIONS GROWTH, 2005 TO 2019
METHODOLOGYThis analysis uses the GACA model introduced in Graver et al. (2020) to estimate fuel burn for passenger aircraft in calendar years 2005, 2010, 2015, 2018, and 2019. The model merges multiple publicly available data sources to quantify aircraft fuel consumption using Piano 5, an aircraft performance and design software from Lissys Ltd (2021). The data obtained included airline operations, airports, and capacity, as is detailed below. From that, we modeled fuel burn and validated the results.
PASSENGER AIRLINE CHARACTERIZATIONThe U.S. passenger air carriers are categorized as network airlines or low-cost carriers (LCCs) according to their business models and operating networks (hub-and-spoke or matrix). This report uses a list of LCCs compiled by the International Civil Aviation Organization (ICAO, 2017a) to characterize airlines.
AIRLINE OPERATIONS DATABASETraffic data for passenger airline operations to, from, and within the United States were sourced from Airline Data Inc. (2021). Included are airline, aircraft type, origin airport, destination airport, seats available, onboard passengers, and onboard freight and mail. This data, originally sourced from the U.S. Department of Transportation (U.S. DOT), has been aggregated and audited by Airline Data Inc.
The reported distance between origin and destination airports is great circle distance. To account for variability in actual flight paths due to weather conditions, the great circle distance of each route was adjusted using correction factors (ICAO, 2017b).
Average payload for each route was estimated by multiplying the total number of onboard passengers by a default passenger mass of 100 kg including luggage (ICAO, 2019), adding the total mass of freight and mail carried, and dividing that by the total number of departures.
The traffic data for the U.S. air carriers included total block (gate-to-gate) time and total air (takeoff-to-landing) time for each route. Average taxi time was calculated by subtracting the air time from block time, and dividing by the number of departures. For foreign air carriers, the average taxi time by U.S. carriers for the same aircraft class at the departure airport was used.
FUEL BURN MODELINGFor each combination of airline, aircraft type, and route, GACA modeled fuel burn using Piano 5 aircraft files, adjusted distance, taxi time, and payload, all derived as previously discussed. Piano default values for operational parameters such as engine thrust, drag, fuel flow, available flight levels, and speed were used. Cruise speeds were set to allow for a 99% maximum specific air range to approximate actual airline operations. Fuel reserve values to account for weather, congestion, diversions, and other unforeseen events were based on U.S. Federal Aviation Administration (FAA) Operations Specification B043 (2014).
3 ICCT WHITE PAPER | LOW-COST CARRIERS AND U.S. AVIATION EMISSIONS GROWTH, 2005 TO 2019
For passenger aircraft, fuel burn was apportioned to passenger and belly freight carriage using the following three equations:
Equation [1]
Total Passenger Fuel Use [kg] = (Total Passenger Weight [kg]
Total Weight [kg] )(Total Fuel Use [kg])
Equation [2]Total Passenger Weight [kg] = (Number of Aircraft Seats)(50 kg) + (Number of Passengers)(100 kg)
Equation [3]Total Weight [kg] = Total Passenger Weight [kg] + Total Freight Weight [kg]
Thus, total fuel use is proportional to payload mass after taking into account furnishings and service equipment needed for passenger operations.
Aircraft CO2 emissions were estimated using the internationally-accepted constants of 3.16 tonnes of CO2 emitted from the consumption of one tonne of aviation fuel (ICAO, 2020) and 0.8 kilograms of CO2 per liter of jet fuel (ICAO, 2019).
VALIDATIONPrevious studies (Graver & Rutherford, 2018a; Graver & Rutherford, 2018b; IPCC, 1999) established that aircraft performance models tend to underestimate real-world fuel consumption. To develop fuel correction factors by aircraft type, fuel burn per revenue passenger mile (RPM) was modeled for U.S. passenger airlines by GACA and validated by operations and fuel burn data reported to the U.S. DOT via Form 41.4 Different fuel correction factors were created for each analysis year, airline, aircraft type, and market served. Airline annual financial reports were used to validate fuel burn for regional airlines operating for network air carriers (e.g., American Eagle, Delta Connection, United Express). For all analysis years, the GACA modelled fuel burn was within 1% of the fuel burn reported on Form 41.
For foreign air carriers, fuel correction factors from U.S. airlines operating the same aircraft type in the same market and year were utilized. Environment or sustainability officers at many of the foreign air carriers included in this analysis were invited to submit fuel burn and RPM data, which were used to calibrate fuel burn for the responding airlines, as well as for aircraft types not operated by U.S. airlines.
OTHER AIRLINE FUEL CONSUMPTIONFor U.S. airlines that transport only cargo, such as freight and mail, or are charter airlines, Form 41 fuel burn data were collected for this analysis.
4 The Form 41 data from U.S. DOT has been aggregated and audited by Airline Data Inc.
4 ICCT WHITE PAPER | LOW-COST CARRIERS AND U.S. AVIATION EMISSIONS GROWTH, 2005 TO 2019
RESULTSOperations data from five calendar years—2005, 2010, 2015, 2018, and 2019—along with the GACA model were used to quantify fuel burn for U.S. air carriers. Fuel burn values were validated using airline-reported data to the U.S. DOT and in their annual reports.
Given that this report focuses on U.S. airlines, imperial units are used throughout. Appendix A contains conversion factors to convert any reported values into metric units.
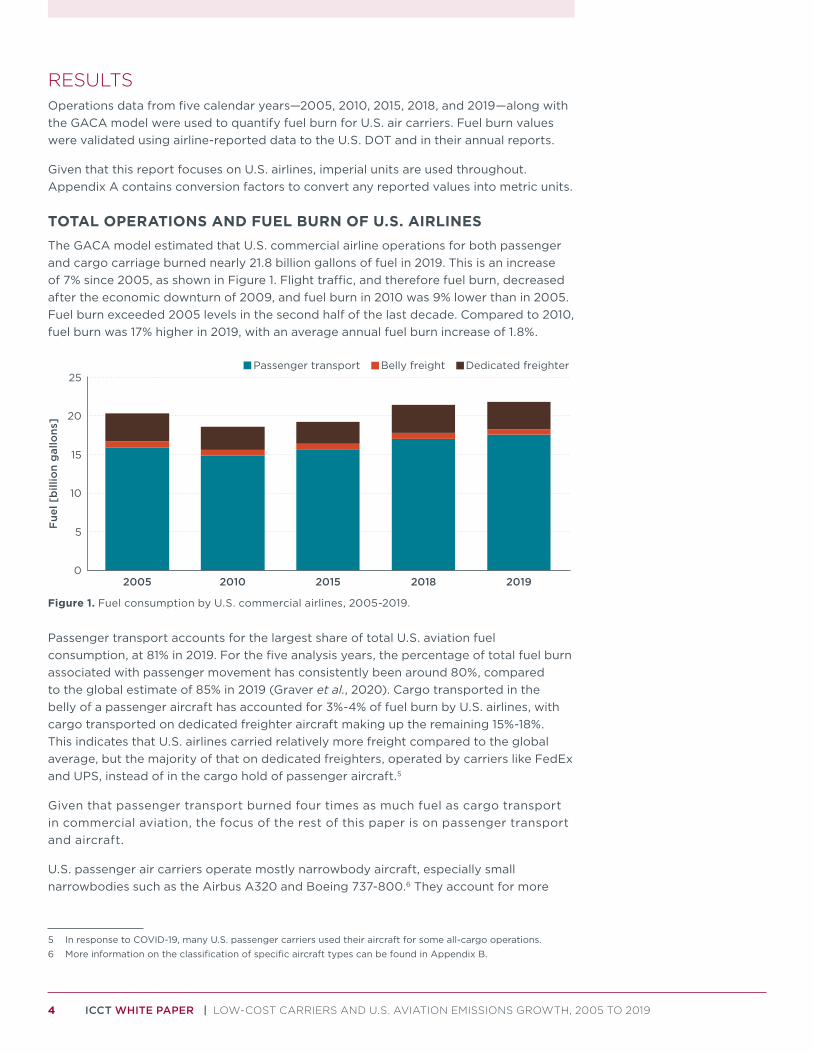
TOTAL OPERATIONS AND FUEL BURN OF U.S. AIRLINESThe GACA model estimated that U.S. commercial airline operations for both passenger and cargo carriage burned nearly 21.8 billion gallons of fuel in 2019. This is an increase of 7% since 2005, as shown in Figure 1. Flight traffic, and therefore fuel burn, decreased after the economic downturn of 2009, and fuel burn in 2010 was 9% lower than in 2005. Fuel burn exceeded 2005 levels in the second half of the last decade. Compared to 2010, fuel burn was 17% higher in 2019, with an average annual fuel burn increase of 1.8%.
0
5
10
15
20
25
2005 2010 2015 2018 2019
Fue
l [b
illio
n g
allo
ns]
Passenger transport Belly freight Dedicated freighter
Figure 1. Fuel consumption by U.S. commercial airlines, 2005-2019.
Passenger transport accounts for the largest share of total U.S. aviation fuel consumption, at 81% in 2019. For the five analysis years, the percentage of total fuel burn associated with passenger movement has consistently been around 80%, compared to the global estimate of 85% in 2019 (Graver et al., 2020). Cargo transported in the belly of a passenger aircraft has accounted for 3%-4% of fuel burn by U.S. airlines, with cargo transported on dedicated freighter aircraft making up the remaining 15%-18%. This indicates that U.S. airlines carried relatively more freight compared to the global average, but the majority of that on dedicated freighters, operated by carriers like FedEx and UPS, instead of in the cargo hold of passenger aircraft.5
Given that passenger transport burned four times as much fuel as cargo transport in commercial aviation, the focus of the rest of this paper is on passenger transport and aircraft.
U.S. passenger air carriers operate mostly narrowbody aircraft, especially small narrowbodies such as the Airbus A320 and Boeing 737-800.6 They account for more
5 In response to COVID-19, many U.S. passenger carriers used their aircraft for some all-cargo operations.6 More information on the classification of specific aircraft types can be found in Appendix B.
5 ICCT WHITE PAPER | LOW-COST CARRIERS AND U.S. AVIATION EMISSIONS GROWTH, 2005 TO 2019
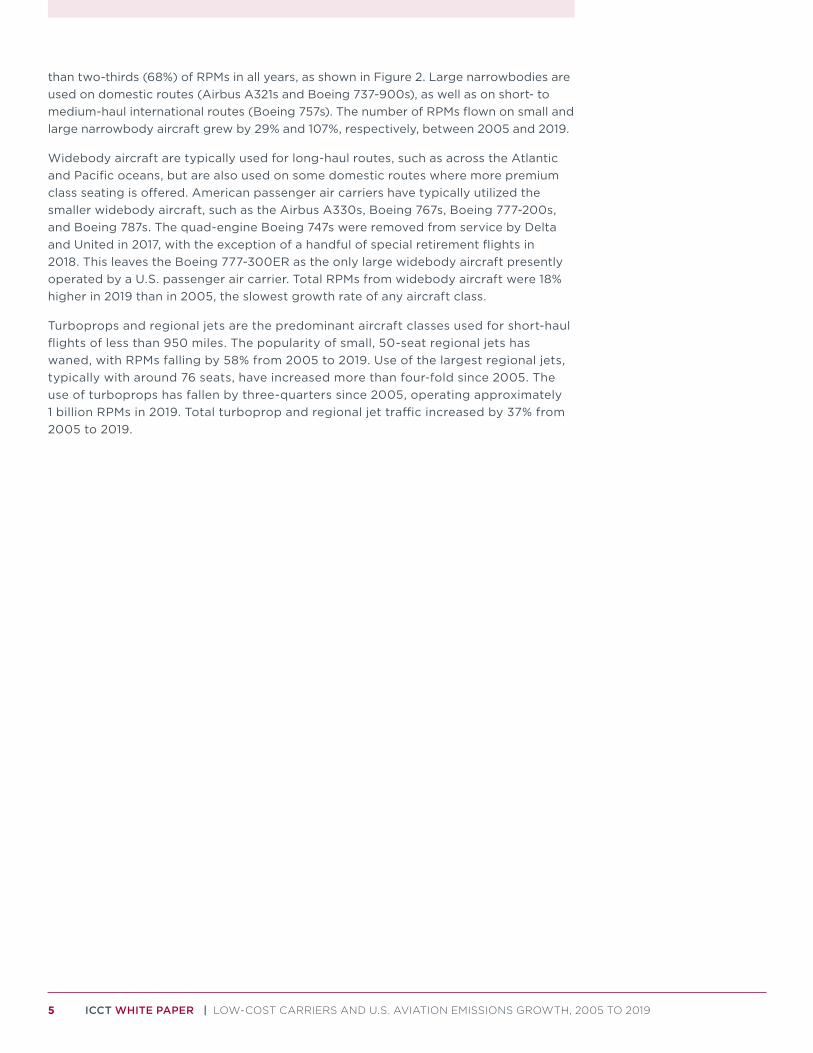
than two-thirds (68%) of RPMs in all years, as shown in Figure 2. Large narrowbodies are used on domestic routes (Airbus A321s and Boeing 737-900s), as well as on short- to medium-haul international routes (Boeing 757s). The number of RPMs flown on small and large narrowbody aircraft grew by 29% and 107%, respectively, between 2005 and 2019.
Widebody aircraft are typically used for long-haul routes, such as across the Atlantic and Pacific oceans, but are also used on some domestic routes where more premium class seating is offered. American passenger air carriers have typically utilized the smaller widebody aircraft, such as the Airbus A330s, Boeing 767s, Boeing 777-200s, and Boeing 787s. The quad-engine Boeing 747s were removed from service by Delta and United in 2017, with the exception of a handful of special retirement flights in 2018. This leaves the Boeing 777-300ER as the only large widebody aircraft presently operated by a U.S. passenger air carrier. Total RPMs from widebody aircraft were 18% higher in 2019 than in 2005, the slowest growth rate of any aircraft class.
Turboprops and regional jets are the predominant aircraft classes used for short-haul flights of less than 950 miles. The popularity of small, 50-seat regional jets has waned, with RPMs falling by 58% from 2005 to 2019. Use of the largest regional jets, typically with around 76 seats, have increased more than four-fold since 2005. The use of turboprops has fallen by three-quarters since 2005, operating approximately 1 billion RPMs in 2019. Total turboprop and regional jet traffic increased by 37% from 2005 to 2019.
6 ICCT WHITE PAPER | LOW-COST CARRIERS AND U.S. AVIATION EMISSIONS GROWTH, 2005 TO 2019
(a) Revenue passenger miles
(b) Fuel e�ciency
0
10
20
30
40
50
60
70
Turboprop Regional jet(small)
Regional jet(large)
Narrowbody(small)
Narrowbody(large)
Widebody(small)
Widebody(large)
Fue
l e�
cien
cy [
RP
Ms
/ g
allo
n]
2005 2010 2015 2018 2019
2005 2010 2015 2018 2019
0
50
100
150
200
250
300
350
400
450
Turboprop Regional jet(small)
Regional jet(large)
Narrowbody(small)
Narrowbody(large)
Widebody(small)
Widebody(large)
RP
Ms
(bill
ions
)
Figure 2. Revenue passenger miles (a) and fuel efficiency (b) of U.S. air carriers, by aircraft class.
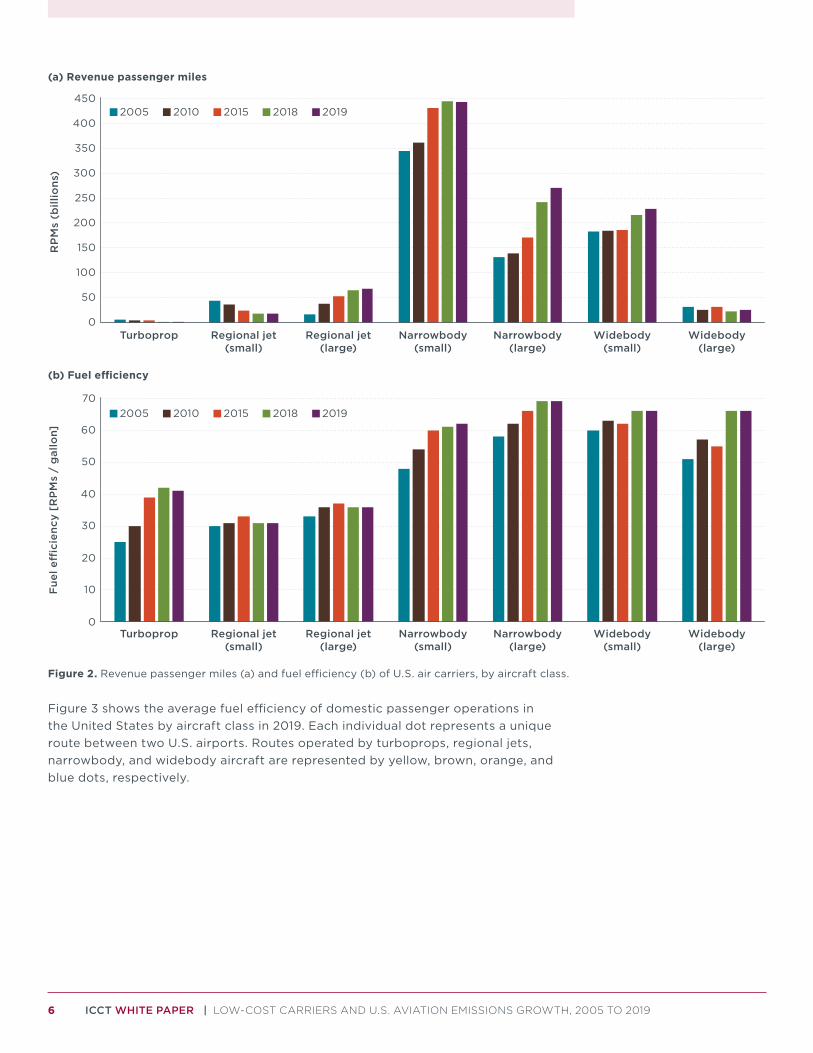
Figure 3 shows the average fuel efficiency of domestic passenger operations in the United States by aircraft class in 2019. Each individual dot represents a unique route between two U.S. airports. Routes operated by turboprops, regional jets, narrowbody, and widebody aircraft are represented by yellow, brown, orange, and blue dots, respectively.
7 ICCT WHITE PAPER | LOW-COST CARRIERS AND U.S. AVIATION EMISSIONS GROWTH, 2005 TO 2019
0
10
20
30
40
50
60
70
80
90
100
0 500 1000 1500 2000 2500 3000 3500 4000 4500 5000 5500
Fue
l e�
cien
cy [
RP
Ms
/ g
allo
n]
Route distance [mi]
Widebodies
Narrowbodies
Regional jets
Turboprops
2019 Average
Route distanceAverage fuel efficiency
[RPMs/gallon]
< 500 miles 36
500-1,000 miles 54
1,001 – 1,500 miles 65
> 1,500 miles 73
Figure 3. Fuel efficiency by route distance and aircraft class for U.S. domestic airport pairs, 2019.
Several conclusions can be drawn from Figure 3. The first is that the fuel efficiency of flights is sensitive to route distance (stage length), with operations longer than 1,500 miles nearly twice as fuel efficient on an RPMs/gallon basis than flights less than 500 miles. Even lower fuel efficiencies, on the order of 10 RPMs/gallon, are seen for the regional flights less than 250 miles.
Second, there are systematic differences in the fuel efficiency across aircraft classes, even when they are operated over similar route distances. This is most clearly seen by comparing the fuel efficiency of regional jets (brown) to turboprops (yellow) and narrowbodies (orange) on common routes. On regional routes less than 500 miles, turboprops and narrowbodies are 30% more fuel-efficient than regional jets. Narrowbody and widebody aircraft using turbofan engines, in contrast, show comparable fuel efficiencies, although widebodies are used on a broader variety of route distances than narrowbodies.
Third, the figure shows a large difference in the fuel efficiency of flights even across the same distance band. For example, the figure indicates that flights of 1,000 miles can vary in fuel efficiency from 30 RPMs/gallon up to 90 RPMs/gallon. This threefold
8 ICCT WHITE PAPER | LOW-COST CARRIERS AND U.S. AVIATION EMISSIONS GROWTH, 2005 TO 2019
difference in fuel efficiency highlights the importance of better emission disclosure from airlines, a point that we will return to later in this study.
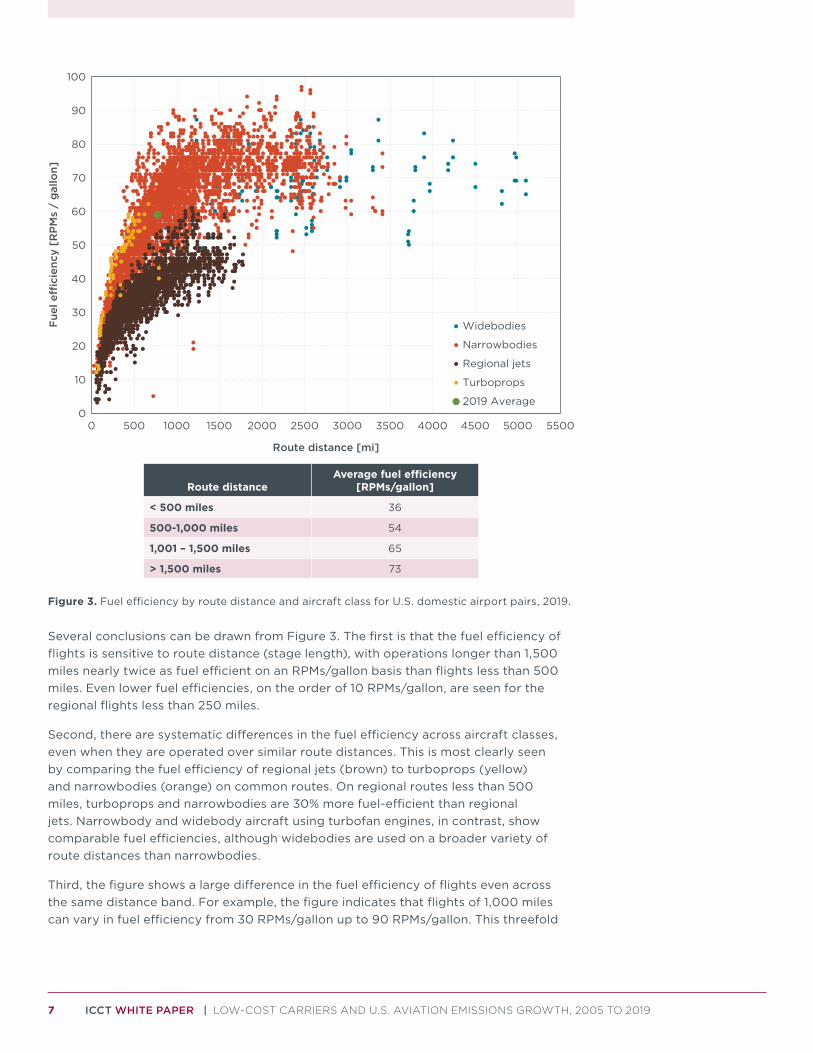
Significant differences in traffic growth, fuel efficiency, and overall fuel burn are seen across different types of carriers. The rapid growth of LCCs—Allegiant, Frontier, JetBlue, Southwest, Spirit, and Sun Country—was a major driver of fuel use and emissions from U.S. airlines over the period studied. Figure 4 shows the aggregate increases in RPMs, fuel efficiency in RPMs/gallon, and fuel use from 2005 to 2019 for network airlines with their regional affiliates (Alaska, American, Delta, Hawaiian, and United) and for LCCs, as well as for the industry average.
11%
64%
2%
23%
34%
20%
37%
119%
22%
0% 20% 40% 60% 80% 100% 120%
Total
Low-cost
Network
Change, 2005-2019
RPMs Fuel e�ciency [RPMs/gal] Fuel [gal]
Figure 4. RPM, fuel use, and fuel efficiency growth by U.S. passenger air carrier type, 2005 to 2019. The following airlines are included in 2005: AirTran Airways, Aloha Airlines, America West Airways, ATA Airlines, Continental Airlines, Independence Air, Midwest Airlines, Northwest Airlines, US Airways, and Virgin America. Many of these carriers merged into current-day airlines, with many of their aircraft still in operation today.
Over the period studied, travel growth for network carriers was largely offset by fuel efficiency gains, leading to a modest 2% increase in fuel use and, therefore, CO2 emissions. In contrast, LCC traffic increased 3.5 times faster than fuel efficiency improved, driving a much larger 64% increase in fuel use from 2005 to 2019. Thus, while LLCs tend to be more fuel-efficient due to higher seating densities, higher load factors, and a newer fleet, high traffic growth more than offsetting those inherent efficiencies. Largely due to the influence of LCCs, total overall traffic grew 1.6 times as fast as fuel efficiency improved from 2005 to 2019, leading fuel use from passenger operations to increase by 11%.7
As shown in Figure 5, 88% of the fuel use growth from 2005 to 2019 came from LCCs, followed by network passenger carriers (12%). This suggests that, in order to meet its goal of capping CO2 emissions at 2005 levels starting in 2020, the United States should pay special attention to the role of LCCs as a driver of overall emissions.
7 Emissions from freight movement fell from 2005 to 2019, so total (passenger plus freight) fuel use grew by only 7%.
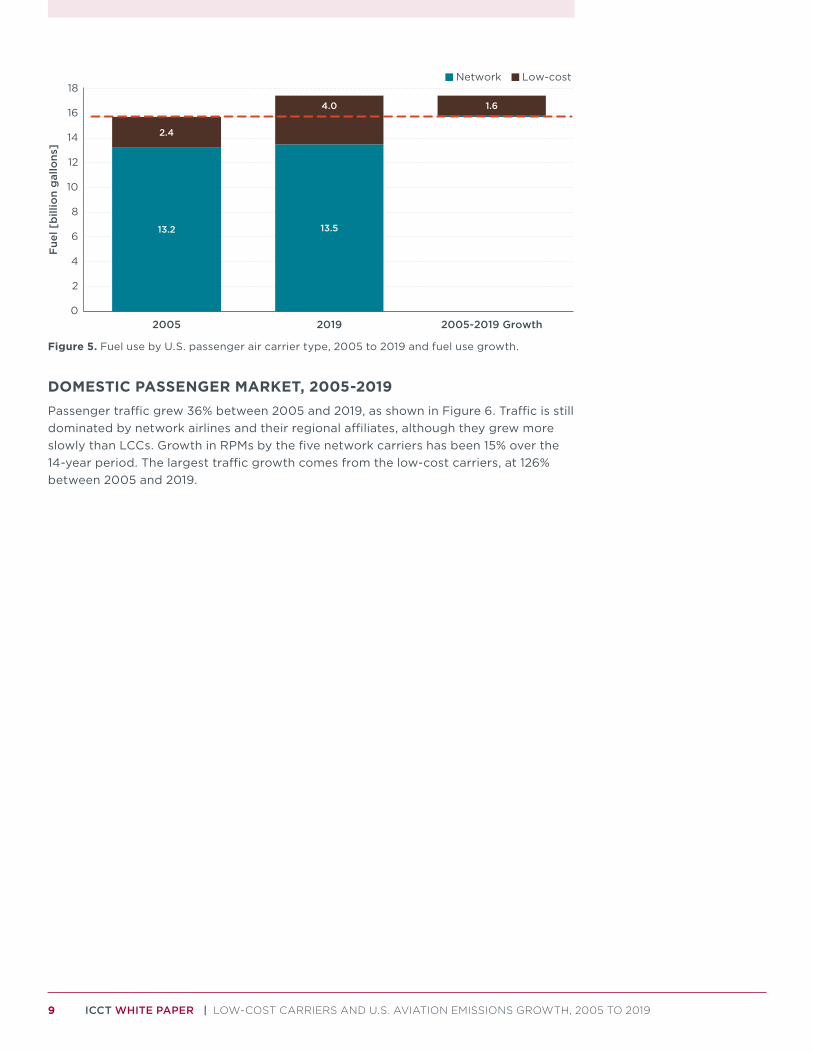
9 ICCT WHITE PAPER | LOW-COST CARRIERS AND U.S. AVIATION EMISSIONS GROWTH, 2005 TO 2019
13.2 13.5
2.4
4.0 1.6
0
2
4
6
8
10
12
14
16
18
2005 2019 2005-2019 Growth
Fue
l [b
illio
n g
allo
ns]
Network Low-cost
Figure 5. Fuel use by U.S. passenger air carrier type, 2005 to 2019 and fuel use growth.
DOMESTIC PASSENGER MARKET, 2005-2019Passenger traffic grew 36% between 2005 and 2019, as shown in Figure 6. Traffic is still dominated by network airlines and their regional affiliates, although they grew more slowly than LCCs. Growth in RPMs by the five network carriers has been 15% over the 14-year period. The largest traffic growth comes from the low-cost carriers, at 126% between 2005 and 2019.
10 ICCT WHITE PAPER | LOW-COST CARRIERS AND U.S. AVIATION EMISSIONS GROWTH, 2005 TO 2019
40
45
50
55
60
65
70
2005 2010 2015 2020
Fue
l e�
cien
cy [
RP
Ms
/ g
allo
n]
Network Low-cost Total
0
100
200
300
400
500
600
2005 2010 2015 2020
RP
Ms
(bill
ions
)
Network Low-cost(a) Revenue passenger miles
(b) Fuel e�ciency
Figure 6. Revenue passenger miles (a) and fuel efficiency (b) of U.S. air carriers on domestic operations, by airline type.
Low-cost carriers tend to use newer, more fuel-efficient aircraft. The average fuel efficiency of all domestic operations by a low-cost carrier in 2019 was 66 RPMs/gal, a 32% improvement from 2005. The fuel-efficiency of the network carriers also increased, but at a slower rate of 20%.
On a simple RPM/gallon of fuel metric,8 Frontier Airlines, Spirit Airlines, and Sun Country Airlines operated the most fuel-efficient domestic flights in 2019, on average (Table 1). Only statistics for 2019 are shown due to there being little variability between 2018 and 2019 operations and fuel efficiency.
8 Other fuel efficiency metrics, such as a fuel per transport service taking into account differences in airline business models, are also possible. See Zheng & Rutherford (2019) and Zeinali, Rutherford, Kwang, and Kharina (2013).
11 ICCT WHITE PAPER | LOW-COST CARRIERS AND U.S. AVIATION EMISSIONS GROWTH, 2005 TO 2019
Table 1. Comparison of U.S. airline operations in the domestic passenger market, 2019.
Air carrier Departures Avg distance [mi] RPMs (billions)Avg fuel efficiency
[RPMs/gal]
American Airlines 2,058,170 694 159 53
Delta Air Lines 1,760,844 701 150 55
United Airlines 1,539,693 792 136 57
Alaska Airlines 445,242 985 53.3 66
Hawaiian Airlines 93,466 681 12.4 70
Network carriers 5,897,415 743 511 56
Southwest Airlines 1,331,573 742 127 63
JetBlue Airways 293,867 1,117 41.6 60
Spirit Airlines 202,111 990 31.6 76
Frontier Airlines 133,448 1,033 23.0 84
Allegiant Airlines 105,659 868 13.2 68
Sun Country Airlines 25,958 1,209 4.56 74
Low-cost carriers 2,092,616 848 241 66
Total 7,990,031 771 752 59
The three largest legacy carriers, American, Delta, and United, had the least fuel-efficient domestic operations in 2018 and 2019 on a fuel per RPM basis. Given that these airlines accounted for nearly 60% of the domestic market, they set the industry average fuel efficiencies to 58 RPMs/gal in 2018 and 59 RPMs/gal in 2019. The regional aircraft operations under the American Eagle, Delta Connection, and United Express brands are 45% less fuel-efficient than the narrowbody and widebody aircraft operating under the mainlines, and account for 13% (Delta), 17% (American), and 18% (United) of RPMs in 2019.
COMPARISON TO FOREIGN AIRLINESOperations data from 2018 and 2019, along with the GACA model, were used to quantify fuel burn for foreign passenger air carriers operating to and from the United States. This allows us to compare fuel efficiency of the U.S. airlines to their foreign rivals in four markets:
(1) Atlantic, including flights to and from Africa, Europe, and the Middle East;
(2) Canada transborder;
(3) Latin America, including flights to and from the Caribbean, Central America, and South America; and
(4) Pacific, including flights to and from Asia and Oceania.
Findings for each market are discussed in separate sections below. The U.S. airlines are collectively compared to the foreign airlines in each market. Data for individual airlines are included in Appendix C.
ATLANTIC PASSENGER MARKETTable 2 shows traffic and fuel efficiency data for Atlantic passenger operations. On average, the U.S. airlines are slightly more fuel efficient than their foreign counterparts
12 ICCT WHITE PAPER | LOW-COST CARRIERS AND U.S. AVIATION EMISSIONS GROWTH, 2005 TO 2019
in the Atlantic passenger market, which covers flights to and from Africa, Europe, the Middle East, and a limited number of flights to India. The market is dominated by European flights, which accounted for 80% of RPMs in 2019, followed by the Middle East (15%), Africa (3%), and India (2%).
Table 2. Comparison of U.S. and foreign airline operations in the Atlantic passenger market, 2018 and 2019.
U.S. – Atlantic market (2018)
Air carriers DeparturesAvg distance
[mi]Load factor
[%]RPMs
(billions)Avg fuel efficiency
[RPMs/gal]
United States 132,092 4,240 81.8 114 64
Foreign 233,141 4,689 81.6 275 62
Total 365,233 4,527 81.6 389 62
U.S. – Atlantic market (2019)
Air carriers DeparturesAvg distance
[mi]Load factor
[%]RPMs
(billions)Avg fuel efficiency
[RPMs/gal]
United States 136,480 4,274 83.3 122 64
Foreign 230,601 4,737 82.8 282 63
Total 367,081 4,565 83.0 404 63
A majority of flights in the Atlantic market are operated by foreign carriers. These airlines operated 70% of the RPMs and, therefore, have a larger impact on the average fuel efficiency of the market. Between 2018 and 2019, there was a 1.6% increase in fuel efficiency for flights operating over the Atlantic, driven by the foreign airlines. Due to the COVID-19 pandemic, the most fuel-efficient airline in the market, Norwegian Air Shuttle, announced that they would be discontinuing long-haul service (Norwegian, 2021). If the traffic and fuel burn for this LCC were removed, the average fuel efficiency for foreign air carriers would fall by 2 RPMs/gal in 2018 and 2019, and thereby lowering the average fuel efficiency for the entire market.
There was a 1% increase in average fuel efficiency among the three U.S. air carriers (American, Delta, and United) between 2018 and 2019 that is not shown in Table 2 due to rounding. American’s fuel efficiency increased 5% during the time period, while Delta’s fuel efficiency increased 3%. In contrast, the average fuel efficiency for United in the Atlantic market fell from 2018 to 2019.
When the Atlantic market is assessed by regions, there is a wide variety in the average stage length of flights. The shortest average flights in 2019 were to and from Europe (4,276 miles), followed by Africa (6,062 miles), the Middle East (6,967 miles), and flights to India (7,556 miles). Average fuel efficiency for flights to and from Europe in 2019 were the most fuel efficient (64 RPMs/gal), followed by the Middle East (61 RPMs/gal), Africa (59 RPMs/gal), and India (56 RPMs/gal). While stage length has a strong effect on average fuel efficiency, it is not directly proportional due to the additional influence of aircraft type.
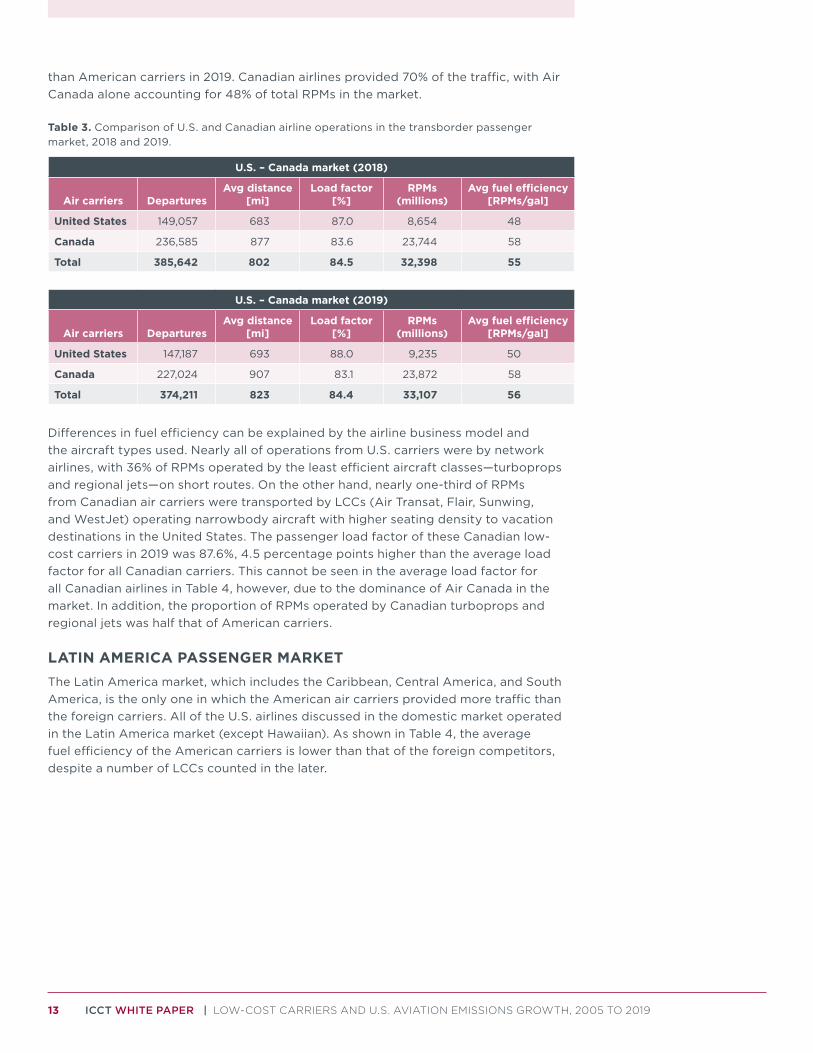
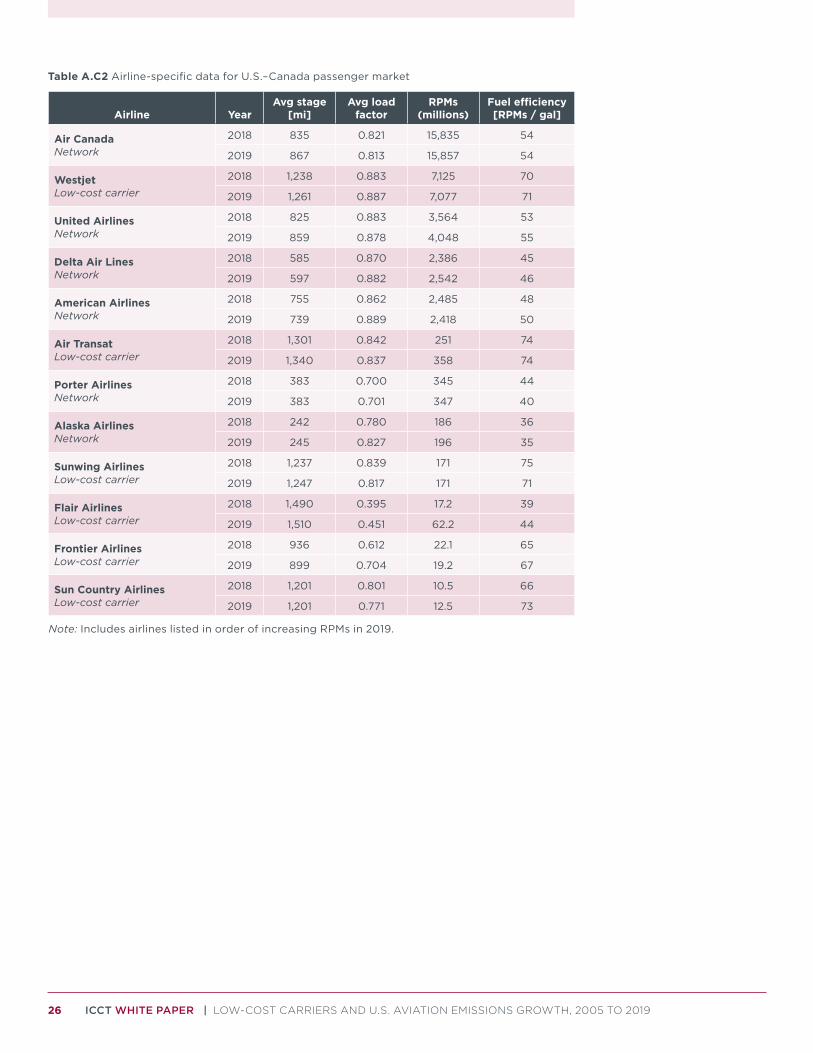
CANADA TRANSBORDER PASSENGER MARKETTable 3 shows traffic and fuel efficiency data for transborder operations between Canada and the United States. There is a large disparity in average fuel efficiency among air carriers. Canadian air carriers were 16% more fuel-efficient, on average,
13 ICCT WHITE PAPER | LOW-COST CARRIERS AND U.S. AVIATION EMISSIONS GROWTH, 2005 TO 2019
than American carriers in 2019. Canadian airlines provided 70% of the traffic, with Air Canada alone accounting for 48% of total RPMs in the market.
Table 3. Comparison of U.S. and Canadian airline operations in the transborder passenger market, 2018 and 2019.
U.S. – Canada market (2018)
Air carriers DeparturesAvg distance
[mi]Load factor
[%]RPMs
(millions)Avg fuel efficiency
[RPMs/gal]
United States 149,057 683 87.0 8,654 48
Canada 236,585 877 83.6 23,744 58
Total 385,642 802 84.5 32,398 55
U.S. – Canada market (2019)
Air carriers DeparturesAvg distance
[mi]Load factor
[%]RPMs
(millions)Avg fuel efficiency
[RPMs/gal]
United States 147,187 693 88.0 9,235 50
Canada 227,024 907 83.1 23,872 58
Total 374,211 823 84.4 33,107 56
Differences in fuel efficiency can be explained by the airline business model and the aircraft types used. Nearly all of operations from U.S. carriers were by network airlines, with 36% of RPMs operated by the least efficient aircraft classes—turboprops and regional jets—on short routes. On the other hand, nearly one-third of RPMs from Canadian air carriers were transported by LCCs (Air Transat, Flair, Sunwing, and WestJet) operating narrowbody aircraft with higher seating density to vacation destinations in the United States. The passenger load factor of these Canadian low-cost carriers in 2019 was 87.6%, 4.5 percentage points higher than the average load factor for all Canadian carriers. This cannot be seen in the average load factor for all Canadian airlines in Table 4, however, due to the dominance of Air Canada in the market. In addition, the proportion of RPMs operated by Canadian turboprops and regional jets was half that of American carriers.
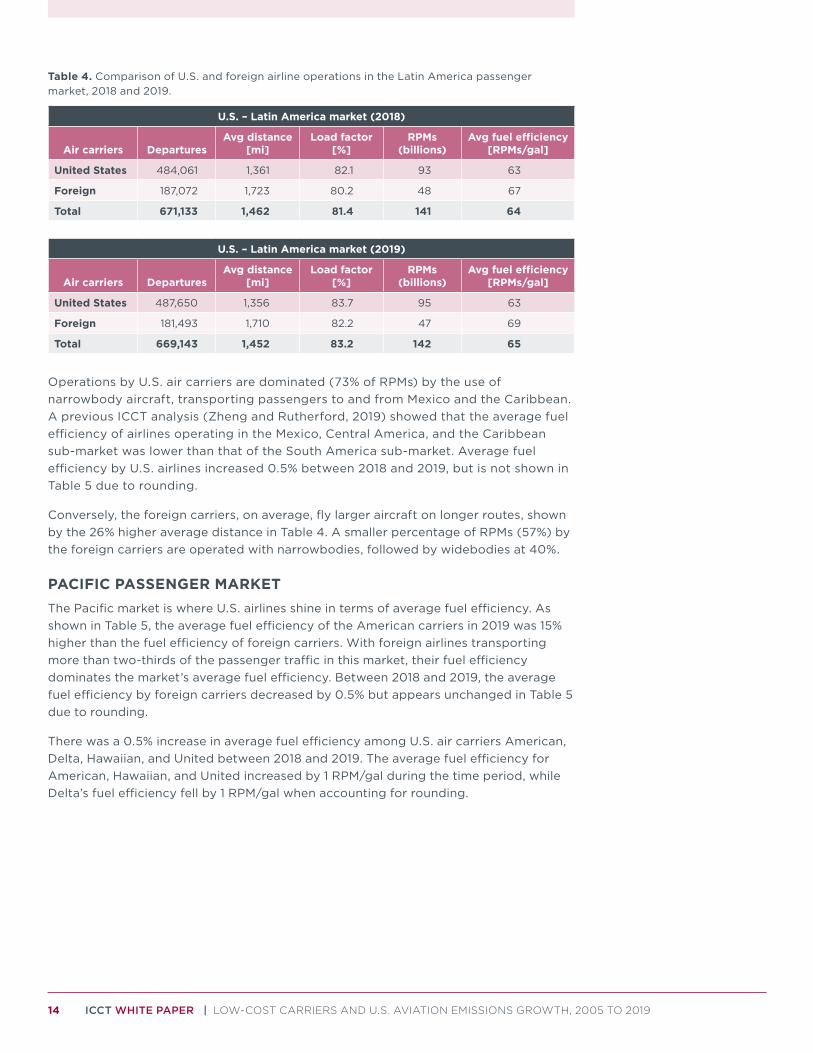
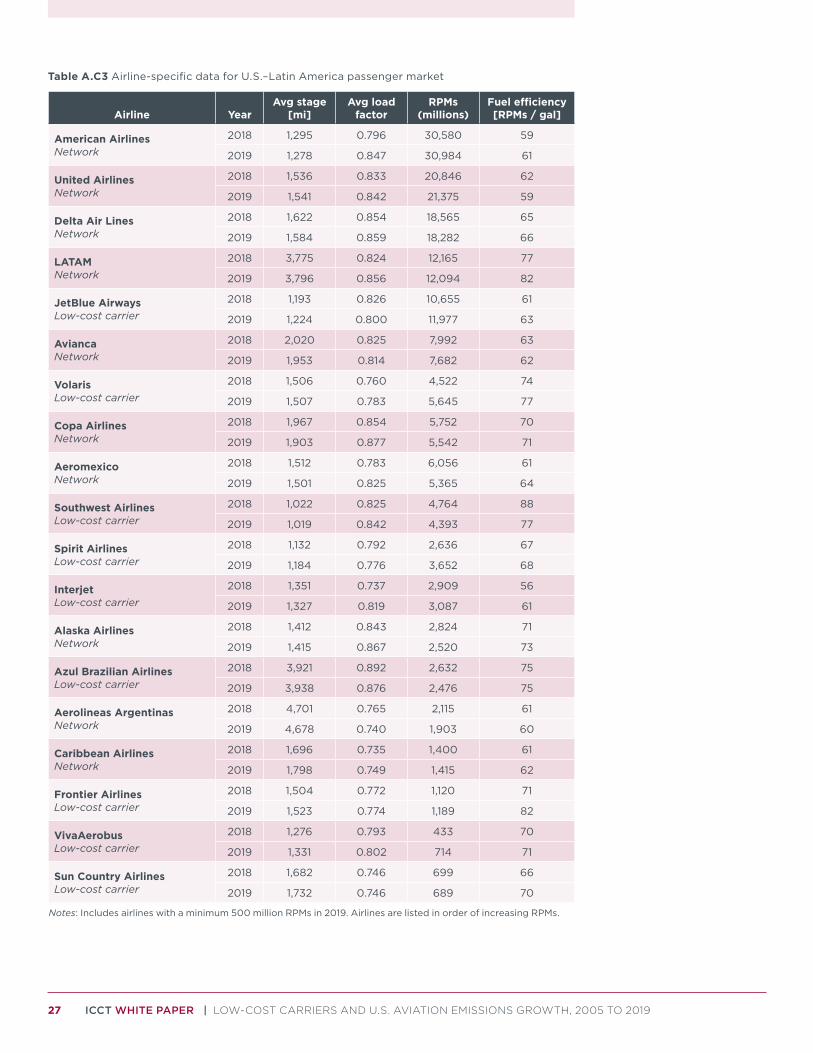
LATIN AMERICA PASSENGER MARKETThe Latin America market, which includes the Caribbean, Central America, and South America, is the only one in which the American air carriers provided more traffic than the foreign carriers. All of the U.S. airlines discussed in the domestic market operated in the Latin America market (except Hawaiian). As shown in Table 4, the average fuel efficiency of the American carriers is lower than that of the foreign competitors, despite a number of LCCs counted in the later.
14 ICCT WHITE PAPER | LOW-COST CARRIERS AND U.S. AVIATION EMISSIONS GROWTH, 2005 TO 2019
Table 4. Comparison of U.S. and foreign airline operations in the Latin America passenger market, 2018 and 2019.
U.S. – Latin America market (2018)
Air carriers DeparturesAvg distance
[mi]Load factor
[%]RPMs
(billions)Avg fuel efficiency
[RPMs/gal]
United States 484,061 1,361 82.1 93 63
Foreign 187,072 1,723 80.2 48 67
Total 671,133 1,462 81.4 141 64
U.S. – Latin America market (2019)
Air carriers DeparturesAvg distance
[mi]Load factor
[%]RPMs
(billions)Avg fuel efficiency
[RPMs/gal]
United States 487,650 1,356 83.7 95 63
Foreign 181,493 1,710 82.2 47 69
Total 669,143 1,452 83.2 142 65
Operations by U.S. air carriers are dominated (73% of RPMs) by the use of narrowbody aircraft, transporting passengers to and from Mexico and the Caribbean. A previous ICCT analysis (Zheng and Rutherford, 2019) showed that the average fuel efficiency of airlines operating in the Mexico, Central America, and the Caribbean sub-market was lower than that of the South America sub-market. Average fuel efficiency by U.S. airlines increased 0.5% between 2018 and 2019, but is not shown in Table 5 due to rounding.
Conversely, the foreign carriers, on average, fly larger aircraft on longer routes, shown by the 26% higher average distance in Table 4. A smaller percentage of RPMs (57%) by the foreign carriers are operated with narrowbodies, followed by widebodies at 40%.
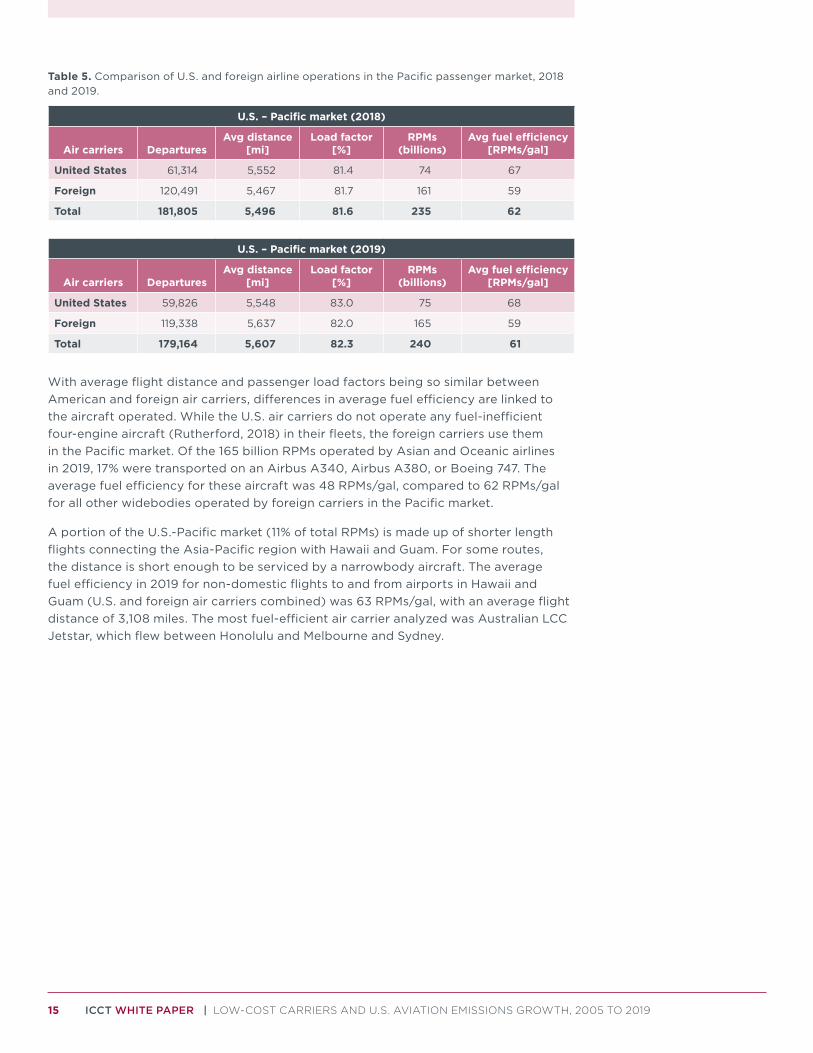
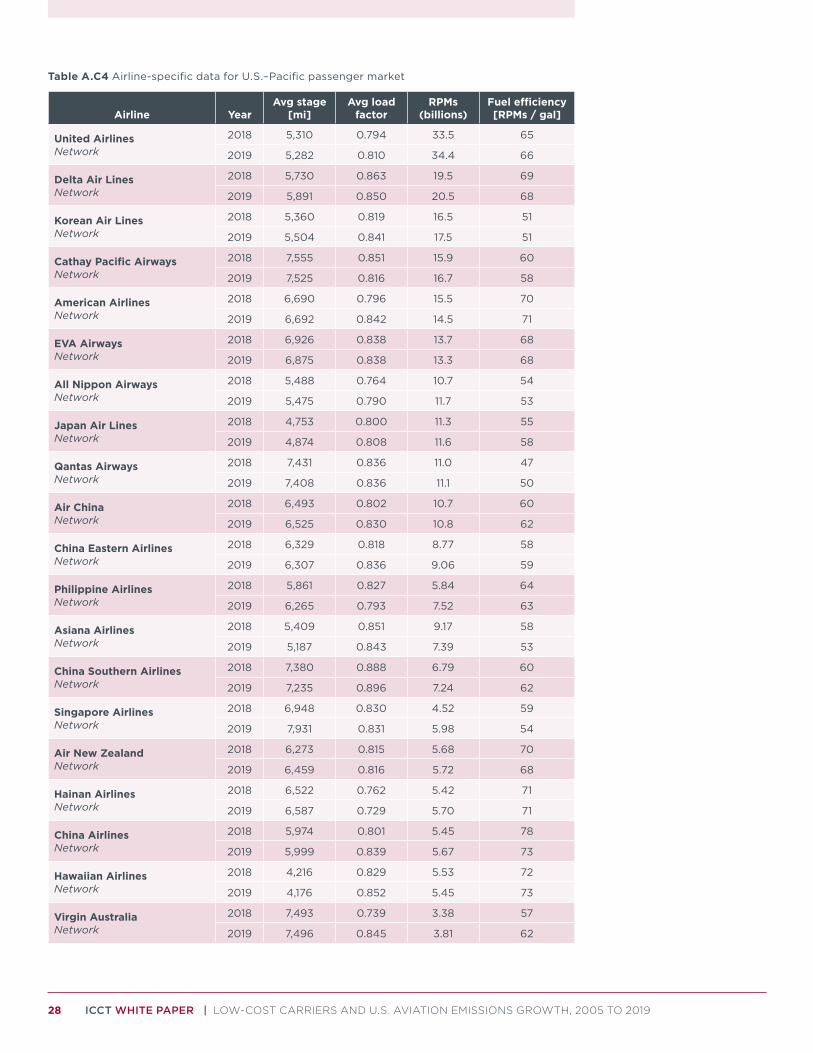
PACIFIC PASSENGER MARKETThe Pacific market is where U.S. airlines shine in terms of average fuel efficiency. As shown in Table 5, the average fuel efficiency of the American carriers in 2019 was 15% higher than the fuel efficiency of foreign carriers. With foreign airlines transporting more than two-thirds of the passenger traffic in this market, their fuel efficiency dominates the market’s average fuel efficiency. Between 2018 and 2019, the average fuel efficiency by foreign carriers decreased by 0.5% but appears unchanged in Table 5 due to rounding.
There was a 0.5% increase in average fuel efficiency among U.S. air carriers American, Delta, Hawaiian, and United between 2018 and 2019. The average fuel efficiency for American, Hawaiian, and United increased by 1 RPM/gal during the time period, while Delta’s fuel efficiency fell by 1 RPM/gal when accounting for rounding.
15 ICCT WHITE PAPER | LOW-COST CARRIERS AND U.S. AVIATION EMISSIONS GROWTH, 2005 TO 2019
Table 5. Comparison of U.S. and foreign airline operations in the Pacific passenger market, 2018 and 2019.
U.S. – Pacific market (2018)
Air carriers DeparturesAvg distance
[mi]Load factor
[%]RPMs
(billions)Avg fuel efficiency
[RPMs/gal]
United States 61,314 5,552 81.4 74 67
Foreign 120,491 5,467 81.7 161 59
Total 181,805 5,496 81.6 235 62
U.S. – Pacific market (2019)
Air carriers DeparturesAvg distance
[mi]Load factor
[%]RPMs
(billions)Avg fuel efficiency
[RPMs/gal]
United States 59,826 5,548 83.0 75 68
Foreign 119,338 5,637 82.0 165 59
Total 179,164 5,607 82.3 240 61
With average flight distance and passenger load factors being so similar between American and foreign air carriers, differences in average fuel efficiency are linked to the aircraft operated. While the U.S. air carriers do not operate any fuel-inefficient four-engine aircraft (Rutherford, 2018) in their fleets, the foreign carriers use them in the Pacific market. Of the 165 billion RPMs operated by Asian and Oceanic airlines in 2019, 17% were transported on an Airbus A340, Airbus A380, or Boeing 747. The average fuel efficiency for these aircraft was 48 RPMs/gal, compared to 62 RPMs/gal for all other widebodies operated by foreign carriers in the Pacific market.
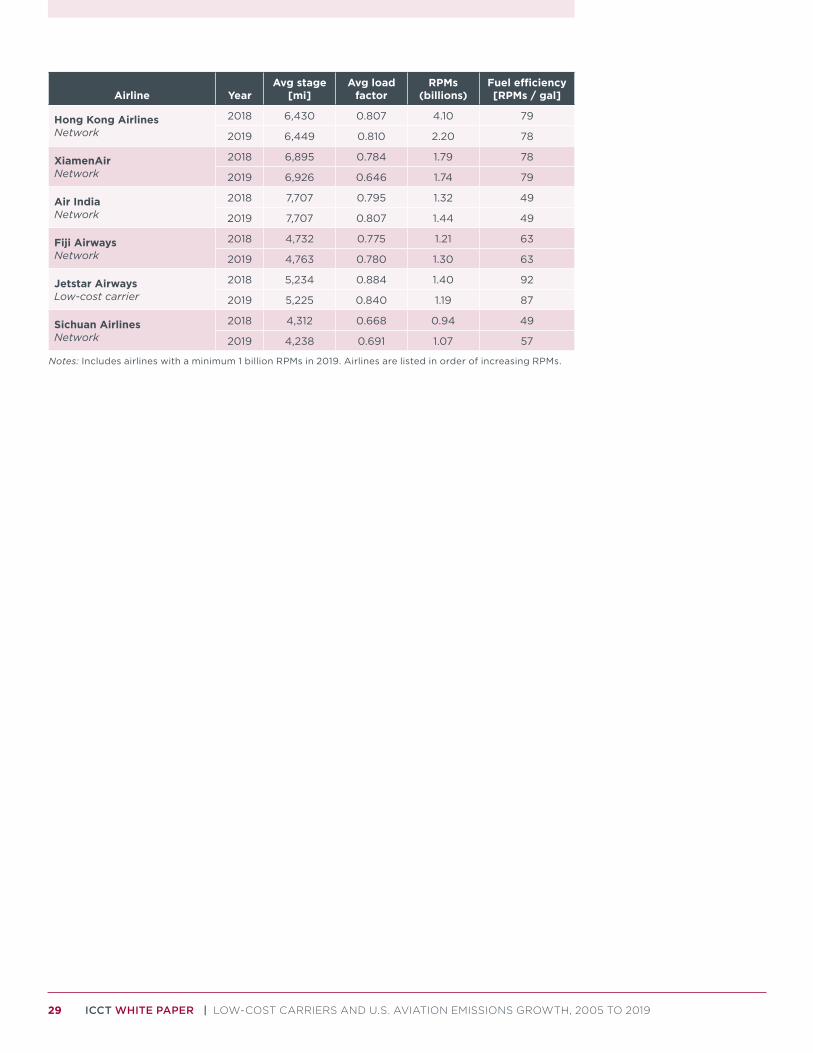
A portion of the U.S.-Pacific market (11% of total RPMs) is made up of shorter length flights connecting the Asia-Pacific region with Hawaii and Guam. For some routes, the distance is short enough to be serviced by a narrowbody aircraft. The average fuel efficiency in 2019 for non-domestic flights to and from airports in Hawaii and Guam (U.S. and foreign air carriers combined) was 63 RPMs/gal, with an average flight distance of 3,108 miles. The most fuel-efficient air carrier analyzed was Australian LCC Jetstar, which flew between Honolulu and Melbourne and Sydney.
16 ICCT WHITE PAPER | LOW-COST CARRIERS AND U.S. AVIATION EMISSIONS GROWTH, 2005 TO 2019
POST-COVID FUTUREClimate change is a serious threat to airline growth; accordingly, U.S. airlines pledged over a decade ago to reduce net emissions from their operations by 50% in 2050 compared to 2005 emissions (A4A, 2021). Since then, the three largest U.S. passenger airlines—American, Delta, and United—have made net-zero carbon commitments by 2050 (American, 2020; Delta, 2020; United, 2020). In 2015, the United States established the goal to cap greenhouse gas emissions from its airlines at 2005 levels starting in 2020 (FAA, 2015). The use of a 2005 base year instead of a 2015 reference year provided U.S. airlines with a weaker target, but due to rapid growth after 2015, by 2019 CO2 emissions from U.S. airlines had increased to 7% above 2005 levels.
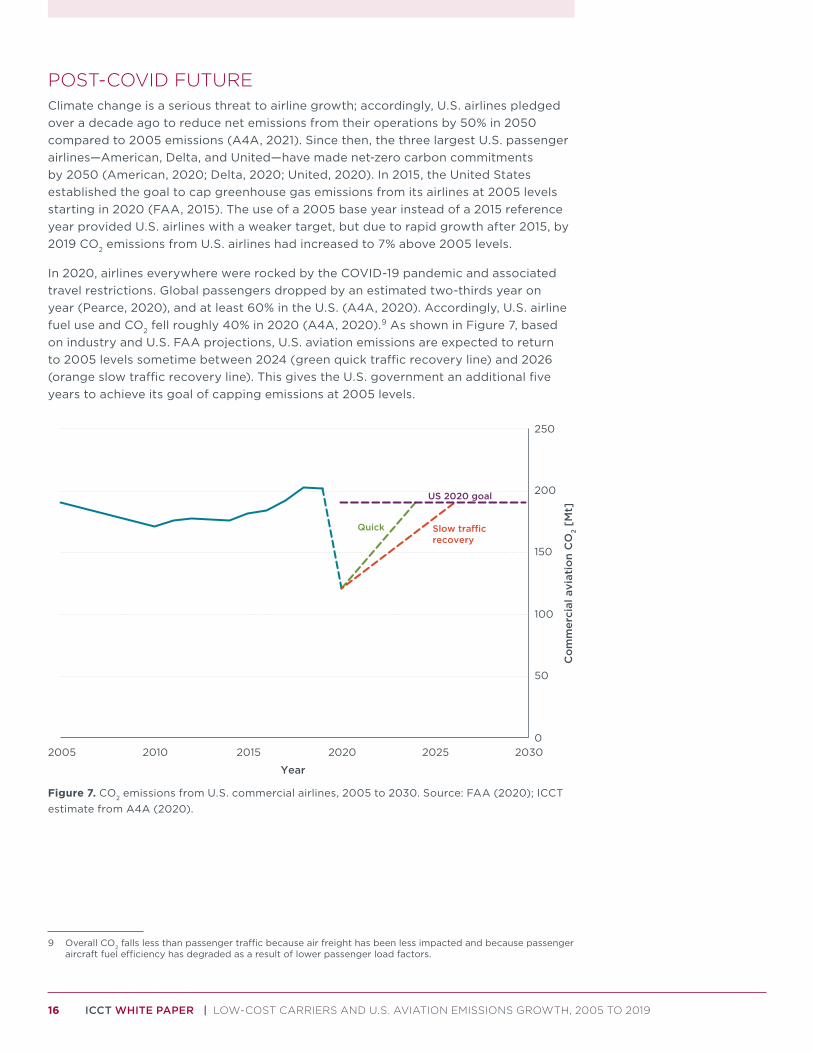
In 2020, airlines everywhere were rocked by the COVID-19 pandemic and associated travel restrictions. Global passengers dropped by an estimated two-thirds year on year (Pearce, 2020), and at least 60% in the U.S. (A4A, 2020). Accordingly, U.S. airline fuel use and CO2 fell roughly 40% in 2020 (A4A, 2020).9 As shown in Figure 7, based on industry and U.S. FAA projections, U.S. aviation emissions are expected to return to 2005 levels sometime between 2024 (green quick traffic recovery line) and 2026 (orange slow traffic recovery line). This gives the U.S. government an additional five years to achieve its goal of capping emissions at 2005 levels.
0
50
100
150
200
250
2005 2010 2015 2020 2025 2030
Co
mm
erci
al a
viat
ion
CO
2 [M
t]
Year
Slow tra�crecovery
Quick
US 2020 goal
Figure 7. CO2 emissions from U.S. commercial airlines, 2005 to 2030. Source: FAA (2020); ICCT estimate from A4A (2020).
9 Overall CO2 falls less than passenger traffic because air freight has been less impacted and because passenger aircraft fuel efficiency has degraded as a result of lower passenger load factors.
17 ICCT WHITE PAPER | LOW-COST CARRIERS AND U.S. AVIATION EMISSIONS GROWTH, 2005 TO 2019
CONCLUSION AND POLICY IMPLICATIONSThis report provides the first, bottom-up and detailed fuel consumption inventory for all flights to, from, and between U.S. airports. It highlights that overall fuel burn, and therefore CO2 emissions, from airlines increased by 7% from 2005 to 2019. Fuel burn associated with passenger movement has stayed consistent at around 80%. Cargo transported on dedicated freighter aircraft are responsible for 15%-18% of total fuel burn, with cargo transported in the belly of a passenger aircraft responsible for the remainder.
Substantial differences were seen in the traffic growth of various aircraft types. Overall, narrowbody aircraft moved more than two-thirds (68%) of passenger traffic at U.S. airports in 2019, and accounted for a comparable share of overall fuel use and emissions. Widebody aircraft moved 24% of the traffic, while regional aircraft (regional jets and turboprops) moved about 8% in total.
Significant differences are seen in the fuel efficiency across different aircraft types. Regional jets are very fuel-inefficient compared to other aircraft types, with larger narrowbody and widebody aircraft transporting about twice as many RPMs per gallon of fuel as regional jets. While some of this difference is related to the use of regional jets on shorter, relatively less fuel-efficient flights, even turboprops are found to be about 50% more fuel efficient than the smaller regional jets used on comparable flights. Note, however, that the use of turboprops fell three-quarters from 2005 to 2019, and now account for only 0.1% of total RPMs.
Notably, this report highlights low-cost carriers as a major driver of U.S. traffic and emissions growth. While network carriers offset almost 90% of their traffic growth via improvements in fuel efficiency from 2005 to 2019, low-cost carrier traffic increased three and a half times faster than fuel efficiency improved, driving large increases in fuel use and CO2 emissions. This is despite the fact that LCCs have relatively high fuel efficiency due to factors like newer aircraft, higher load factors, and higher seating densities. As a result, almost all (88%) of emissions growth from U.S. passenger operations since 2005 was linked to growth of low-cost carriers.
Across specific flight distances, the fuel efficiency of domestic flights can vary by up to a factor of three, with the largest deviation seen on flights of about 1,000 miles. This highlights the value of better emissions disclosure so that consumers can choose more fuel-efficient flights. Future work will analyze per passenger fuel burn and emissions of different itineraries between the same airport pairs.
Looking to the future, the COVID-19 downturn means that the U.S. has until 2025 to meet its goal of capping aviation emissions at 2005 levels. Further action is needed to put in place binding measures which can further support the aircraft retirements and network reductions that have already taken place.
Several policy recommendations flow from these findings. First, it suggests a need for a renewed focus on U.S. domestic aviation emissions, which accounted for about 15% of the global total and are not covered by international agreements. Accordingly, the U.S. should adopt meaningful emission standards for both new and in-service planes and update the U.S. National Action Plan to ICAO (FAA, 2015). A natural focus of this would be to supplement the current cap of emissions at 2005 levels with 2035 and 2050 targets consistent with an economy-wide net-zero target. These agreements can build upon voluntary climate commitments from airlines like Delta (2020), JetBlue (2020), and United (2020).
18 ICCT WHITE PAPER | LOW-COST CARRIERS AND U.S. AVIATION EMISSIONS GROWTH, 2005 TO 2019
Second, this report highlights regional jets, which are found to be considerably less fuel-efficient than other aircraft types, as a source of excess GHG pollution. Moreover, regional jets are used predominately on regional and short-haul flights, which will be a suitable option for electrification and the use of alternative fuels like hydrogen. Since those technologies will require substantial investments to mature and develop, national and even state governments should consider making further investments similar to those that have been proposed by Norway and other Nordic countries (Sigurdardottir, 2020). Drop-in biofuels or synthetic fuels could be deployed for use on medium- and long-haul flights for which electricity and hydrogen are expected to be less viable.
Furthermore, the finding that fuel efficiency can vary threefold across flights of similar distance highlights the value of airlines reporting emissions directly to the consumers so that they can choose less-emitting flights. In 2020, search engines including Google Flights (2020), Kayak (Howard, 2020), and Skyscanner (n.d.) began to offer this information to consumers. The U.S. government should explore requiring the reporting of emissions either legislatively or via EPA’s regulatory authority under the Clean Air Act.
While the data provided by the U.S. DOT on airline operations and fuel burn are relatively comprehensive, improvements can be made. A number of errors in the public data have been found by both Airline Data Inc. and ICCT. While every attempt is made by U.S. DOT to correct errors, questions arise about the enforcement power of the department to ensure airlines are reporting correctly and revising errors when necessary. In addition, there are data gaps with regards to regional air carrier fuel burn in Form 41; the regional carriers are not reporting fuel burn because the fuel is purchased by the mainline carriers, but the mainline carriers are also not reporting the fuel consumption. The U.S. DOT and airlines should work together to ensure that regulators, research organizations, and the general public have access to complete, comprehensive data needed to make informed decisions that support and promote a more sustainable aviation future.
19 ICCT WHITE PAPER | LOW-COST CARRIERS AND U.S. AVIATION EMISSIONS GROWTH, 2005 TO 2019
REFERENCESAirlines blame covid-19 for rowing back climate commitments. (July 2, 2020). The Economist.
Retrieved from https://www.economist.com/business/2020/07/04/airlines-blame-covid-19-for-rowing-back-climate-commitments
Airline Data Inc. (2021). The Hub Data Sets [database]. Retrieved from https://www.airlinedata.com/the-hub/
Airlines for America (A4A). (2021). A4A’s Climate Change Commitment. Retrieved from https://www.airlines.org/a4as-climate-change-commitment/
Airlines for America (A4A). (2020). Tracking the Impacts of COVID-19 (updated December 21 2020). Retrieved from https://www.airlines.org/dataset/impact-of-covid19-data-updates/#
American Airlines. (2020). American Airlines Publishes 2019-2020 ESG Report. Retrieved from http://news.aa.com/news/news-details/2020/American-Airlines-Publishes-2019-2020-ESG-Report-CORP-OTH-10/default.aspx
Delta Air Lines (2020). Delta commits $1 billion to become first carbon neutral airline globally. Retrieved from https://news.delta.com/delta-commits-1-billion-become-first-carbon-neutral-airline-globally
Environment and Climate Change Canada (ECCC). (2020a). A healthy environment and a healthy economy. Retrieved from https://www.canada.ca/content/dam/eccc/documents/pdf/climate-change/climate-plan/health_environment_healthy_economy_plan.pdf
Environment and Climate Change Canada (ECCC). (2020b). Putting a price on pollution: Carbon pollution pricing systems across Canada. Retrieved from https://www.canada.ca/en/environment-climate-change/services/climate-change/pricing-pollution-how-it-will-work.html
European Commission (EC). (2020). Sustainable aviation fuels – ReFuelEU Aviation.Retrieved from https://ec.europa.eu/info/law/better-regulation/have-your-say/initiatives/12303-ReFuelEU-Aviation-Sustainable-Aviation-Fuels
‘Flight shame’ could halve growth in air traffic. (October 2, 2019). British Broadcasting Corporation. Retrieved from https://www.bbc.com/news/business-49890057
Google Flights (2020). Check carbon emissions on Google Flights. Retrieved from https://support.google.com/travel/answer/9671620?hl=en
Graver, B., Rutherford, D., & Zheng, S. (2020). CO2 emissions from commercial aviation, 2013, 2018, and 2019. Retrieved from the International Council on Clean Transportation https://theicct.org/publications/co2-emissions-commercial-aviation-2020
Graver, B., Zhang, K., & Rutherford, D. (2019). CO2 emissions from commercial aviation, 2018. Retrieved from the International Council on Clean Transportation https://theicct.org/sites/default/files/publications/ICCT_CO2-commercl-aviation-2018_20190918.pdf
Graver, B. & Rutherford, D. (2018). Transatlantic airline fuel efficiency ranking, 2017. Retrieved from the International Council on Clean https://theicct.org/sites/default/files/publications/Transatlantic_Fuel_Efficiency_Ranking_20180912_v2.pdf
Graver, B. & Rutherford, D. (2018). Transpacific airline fuel efficiency ranking, 2016. Retrieved from the International Council on Clean Transportation https://theicct.org/sites/default/files/publications/Transpacific-airline-fuel-efficiency-ranking-2016_ICCT-white-paper_16012018_vF.pdf
Howard. A. (2020). This KAYAK.com feature can help you find eco-friendly flights. Retrieved from https://www.lonelyplanet.com/articles/eco-friendly-flights-kayak
Intergovernmental Panel on Climate Change (IPCC). (1999). Comparisons of present-day and 2015 forecast emissions inventories (NASA, ANCAT/EC2, and DLR). Penner, J., Lister, D., Griggs, D., Dokken, D.; McFarland, M. (Eds.), Aviation and the Global Atmosphere (Section 9.3.4). Retrieved from http://www.ipcc.ch/ipccreports/sreas/aviation/137.htm
International Civil Aviation Organization (ICAO). (2017a). List of Low-Cos-Carriers (LCCs) based on ICAO definition. Retrieved from https://www.icao.int/sustainability/Documents/LCC-List.pdf
International Civil Aviation Organization (ICAO). (2017b). ICAO carbon emissions calculator methodology, version 10. Retrieved from https://www.icao.int/environmental-protection/CarbonOffset/Documents/Methodology%20ICAO%20Carbon%20Calculator_v10-2017.pdf
International Civil Aviation Organization (ICAO). (2019). Glossary of terms – ICAO Data Plus. Retrieved from https://data.icao.int/newDataPlus/content/docs/glossary.pdf
JetBlue. (2020). JetBlue is the First U.S. Airline to Commit to and Achieve Carbon Neutrality for All Domestic Flying. Retrieved from http://mediaroom.jetblue.com/investor-relations/press-releases/2020/08-13-2020-152953291
20 ICCT WHITE PAPER | LOW-COST CARRIERS AND U.S. AVIATION EMISSIONS GROWTH, 2005 TO 2019
Niranjan, A., Schacht, K. (2021). CORSIA: World’s biggest plan to make flying green ‘too broken to fix’. Deutsche Welle. Retrieved from https://www.dw.com/en/corsia-climate-flying-emissions-offsets/a-56309438
Norwegian. (2021). Norwegian to focus on a strong European network. Retrieved from https://media.uk.norwegian.com/pressreleases/norwegian-to-focus-on-a-strong-european-network-3064682
Pearce, B. (2020). COVID-19: Outlook for air transport and the airline industry. Retrieved from International Air Transport Association https://www.iata.org/en/iata-repository/publications/economic-reports/airline-industry-economic-performance-november-2020---presentation/
Piano 5. (2021). [software]. United Kingdom: Lissys Ltd. Retrieved from https://www.lissys.uk/
Pidcock, R., Yeo, S. (August 8, 2016). Analysis: Aviation could consume a quarter of 1.5C carbon budget by 2050. Carbon Brief. Retrieved from https://www.carbonbrief.org/aviation-consume-quarter-carbon-budget
Sigurdardottir, R. (2020). Nordic States Set Electric-Planes Pace After Green-Cars Push. Bloomberg. Retrieved from https://www.bloomberg.com/news/articles/2020-12-13/nordic-nations-set-pace-in-electric-planes-after-green-cars-push
Skyscanner (n.d.). Travel with a conscience. Retrieved from https://www.skyscanner.com/environment
Rutherford, D. (2018). Size matters for aircraft fuel efficiency. Just not in the way that you think. [blog post]. Retrieved from the International Council on Clean Transportation. Retrieved from https://theicct.org/blog/staff/size-matters-for-aircraft-fuel-efficiency
United Airlines. (2020). United Makes Bold Environmental Commitment Unmatched by Any Airline; Pledges 100% Green by Reducing Greenhouse Gas Emissions 100% by 2050. Retrieved from https://hub.united.com/united-pledges-100-green-2050-2649438060.html
United States Environmental Protection Agency (EPA). (2021). Control of Air Pollution From Airplanes and Airplane Engines: GHG Emission Standards and Test Procedures. 86 C.F.R. § 6 Retrieved from https://www.govinfo.gov/content/pkg/FR-2021-01-11/pdf/2020-28882.pdf
United States Federal Aviation Administration (FAA). (2020). FAA Aerospace Forecast. Fiscal Years 2020 to 2040. Retrieved from https://www.faa.gov/data_research/aviation/aerospace_forecasts/media/FY2020-40_FAA_Aerospace_Forecast.pdf
United States Federal Aviation Administration (FAA). (2015). United States Aviation Greenhouse Gas Reduction Plan. Retrieved from https://www.icao.int/environmental-protection/Lists/ActionPlan/Attachments/30/UnitedStates_Action_Plan-2015.pdf
United States Federal Aviation Administration (FAA). (2014). Part 121 flag operations, supplemental operations outside the contiguous states, and extended overwater operations. Retrieved from http://fsims.faa.gov/PICDetail.aspx?docId=8900.1,Vol.3,Ch25,Sec4
White House. (2021). Executive Order on Protecting Public Health and the Environment and Restoring Science to Tackle the Climate Crisis. Retrieved from https://www.whitehouse.gov/briefing-room/presidential-actions/2021/01/20/executive-order-protecting-public-health-and-environment-and-restoring-science-to-tackle-climate-crisis/
Zeinali, M., Rutherford, D., Kwan, I., Kharina, A. (2013) U.S. Domestic Airline Fuel Efficiency Ranking 2010. Retrieved from the International Council on Clean Transportation website: https://theicct.org/publications/us-domestic-airline-fuel-efficiency-ranking-2010
Zheng, X.S. & Rutherford D. (2020). Fuel burn of new commercial jet aircraft: 1960 to 2019. Retrieved from the International Council on Clean Transportation website: https://theicct.org/publications/fuel-burn-new-comm-aircraft-1960-2019-sept2020
Zheng, X.S. & Rutherford D. (2019). U.S.-Latin America Airline Fuel Efficiency Ranking, 2017-2018. Retrieved from the International Council on Clean Transportation website: https://theicct.org/sites/default/files/publications/ICCT_LatAm-airline-ranking_20191120.pdf
Zheng, X.S., Graver, B., Rutherford, D. (2019) U.S. Domestic Airline Fuel Efficiency Ranking, 2017–2018. Retrieved from the International Council on Clean Transportation website: https://theicct.org/publications/us-domestic-airline-fuel-efficiency-ranking-2017-18
21 ICCT WHITE PAPER | LOW-COST CARRIERS AND U.S. AVIATION EMISSIONS GROWTH, 2005 TO 2019
APPENDIX A: CONVERSION FACTORS1 ton = 0.907 metric tonnes
1 mile = 1.609 kilometers
1 ton mile = 1.460 tonne kilometers
1 gallon of jet fuel = 3.785 liters of jet fuel
1 liter of jet fuel = 0.8 kilograms of jet fuel
1 kilogram of jet fuel consumed = 3.16 kilograms of carbon dioxide emissions
1 airline seat = 50 kilograms (110 pounds)
1 passenger and checked luggage = 100 kilograms (220 pounds)
22 ICCT WHITE PAPER | LOW-COST CARRIERS AND U.S. AVIATION EMISSIONS GROWTH, 2005 TO 2019
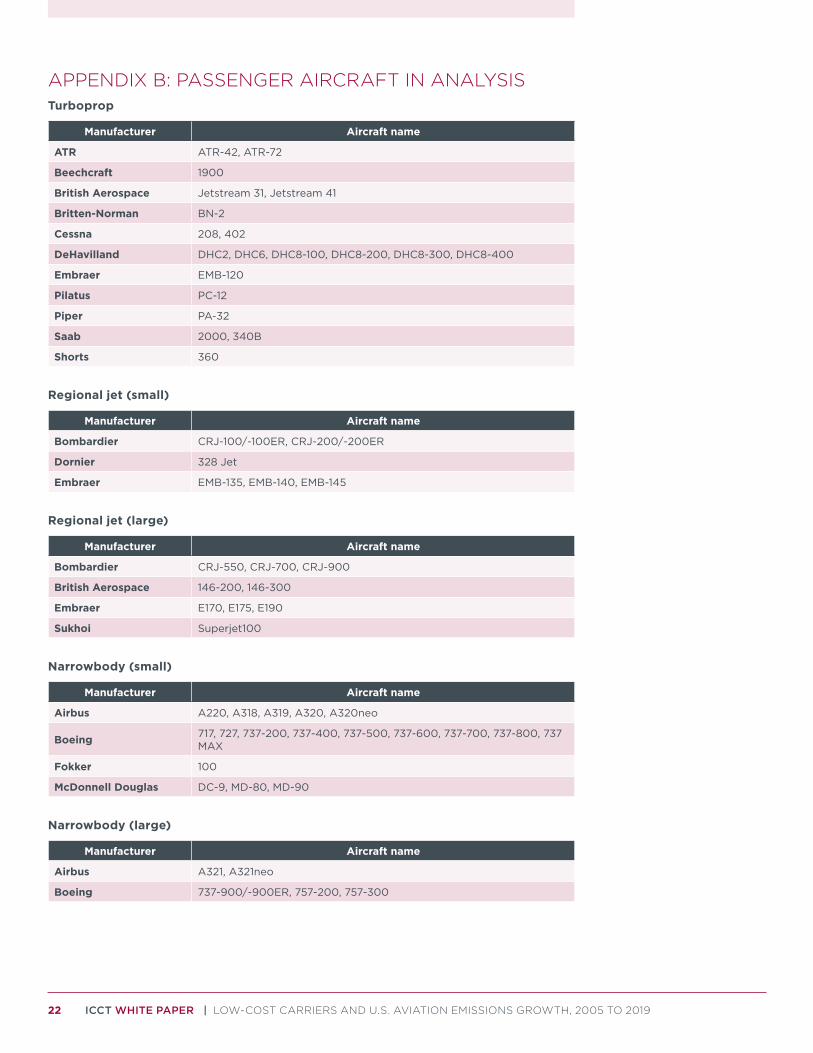
APPENDIX B: PASSENGER AIRCRAFT IN ANALYSISTurboprop
Manufacturer Aircraft name
ATR ATR-42, ATR-72
Beechcraft 1900
British Aerospace Jetstream 31, Jetstream 41
Britten-Norman BN-2
Cessna 208, 402
DeHavilland DHC2, DHC6, DHC8-100, DHC8-200, DHC8-300, DHC8-400
Embraer EMB-120
Pilatus PC-12
Piper PA-32
Saab 2000, 340B
Shorts 360
Regional jet (small)
Manufacturer Aircraft name
Bombardier CRJ-100/-100ER, CRJ-200/-200ER
Dornier 328 Jet
Embraer EMB-135, EMB-140, EMB-145
Regional jet (large)
Manufacturer Aircraft name
Bombardier CRJ-550, CRJ-700, CRJ-900
British Aerospace 146-200, 146-300
Embraer E170, E175, E190
Sukhoi Superjet100
Narrowbody (small)
Manufacturer Aircraft name
Airbus A220, A318, A319, A320, A320neo
Boeing 717, 727, 737-200, 737-400, 737-500, 737-600, 737-700, 737-800, 737 MAX
Fokker 100
McDonnell Douglas DC-9, MD-80, MD-90
Narrowbody (large)
Manufacturer Aircraft name
Airbus A321, A321neo
Boeing 737-900/-900ER, 757-200, 757-300

23 ICCT WHITE PAPER | LOW-COST CARRIERS AND U.S. AVIATION EMISSIONS GROWTH, 2005 TO 2019
Widebody (small)
Manufacturer Aircraft name
Airbus A300, A310, A330, A330neo, A340, A350-900
Boeing 767-200, 767-300/-300ER, 767-400, 777-200/-200ER/-200LR, 787-8, 787-9, 787-10
McDonnell Douglas DC-10, MD-11
Widebody (large)
Manufacturer Aircraft name
Airbus A350-1000, A380
Boeing 747-200, 747-400/-400ER, 747-8, 777-300/-300ER
24 ICCT WHITE PAPER | LOW-COST CARRIERS AND U.S. AVIATION EMISSIONS GROWTH, 2005 TO 2019
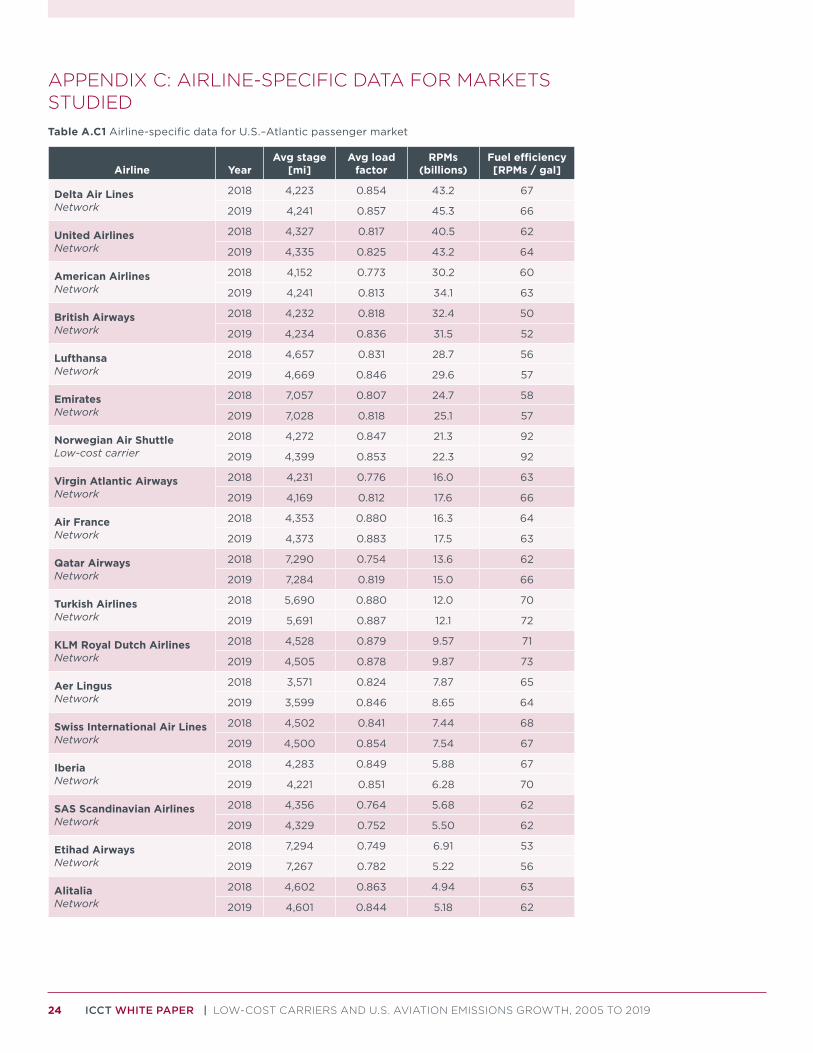
APPENDIX C: AIRLINE-SPECIFIC DATA FOR MARKETS STUDIEDTable A.C1 Airline-specific data for U.S.–Atlantic passenger market
Airline YearAvg stage
[mi]Avg load
factorRPMs
(billions)Fuel efficiency [RPMs / gal]
Delta Air LinesNetwork
2018 4,223 0.854 43.2 67
2019 4,241 0.857 45.3 66
United AirlinesNetwork
2018 4,327 0.817 40.5 62
2019 4,335 0.825 43.2 64
American AirlinesNetwork
2018 4,152 0.773 30.2 60
2019 4,241 0.813 34.1 63
British AirwaysNetwork
2018 4,232 0.818 32.4 50
2019 4,234 0.836 31.5 52
LufthansaNetwork
2018 4,657 0.831 28.7 56
2019 4,669 0.846 29.6 57
EmiratesNetwork
2018 7,057 0.807 24.7 58
2019 7,028 0.818 25.1 57
Norwegian Air ShuttleLow-cost carrier
2018 4,272 0.847 21.3 92
2019 4,399 0.853 22.3 92
Virgin Atlantic AirwaysNetwork
2018 4,231 0.776 16.0 63
2019 4,169 0.812 17.6 66
Air FranceNetwork
2018 4,353 0.880 16.3 64
2019 4,373 0.883 17.5 63
Qatar AirwaysNetwork
2018 7,290 0.754 13.6 62
2019 7,284 0.819 15.0 66
Turkish AirlinesNetwork
2018 5,690 0.880 12.0 70
2019 5,691 0.887 12.1 72
KLM Royal Dutch AirlinesNetwork
2018 4,528 0.879 9.57 71
2019 4,505 0.878 9.87 73
Aer LingusNetwork
2018 3,571 0.824 7.87 65
2019 3,599 0.846 8.65 64
Swiss International Air LinesNetwork
2018 4,502 0.841 7.44 68
2019 4,500 0.854 7.54 67
IberiaNetwork
2018 4,283 0.849 5.88 67
2019 4,221 0.851 6.28 70
SAS Scandinavian AirlinesNetwork
2018 4,356 0.764 5.68 62
2019 4,329 0.752 5.50 62
Etihad AirwaysNetwork
2018 7,294 0.749 6.91 53
2019 7,267 0.782 5.22 56
AlitaliaNetwork
2018 4,602 0.863 4.94 63
2019 4,601 0.844 5.18 62
25 ICCT WHITE PAPER | LOW-COST CARRIERS AND U.S. AVIATION EMISSIONS GROWTH, 2005 TO 2019
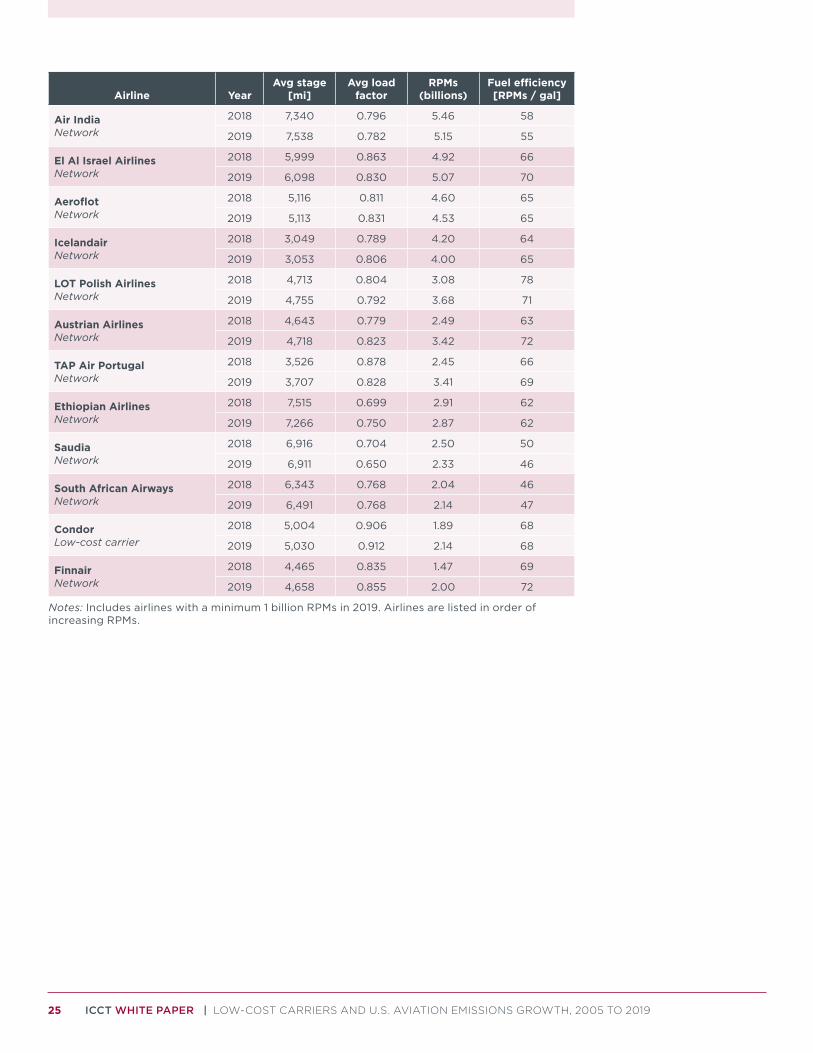
Airline YearAvg stage
[mi]Avg load
factorRPMs
(billions)Fuel efficiency [RPMs / gal]
Air IndiaNetwork
2018 7,340 0.796 5.46 58
2019 7,538 0.782 5.15 55
El Al Israel AirlinesNetwork
2018 5,999 0.863 4.92 66
2019 6,098 0.830 5.07 70
AeroflotNetwork
2018 5,116 0.811 4.60 65
2019 5,113 0.831 4.53 65
IcelandairNetwork
2018 3,049 0.789 4.20 64
2019 3,053 0.806 4.00 65
LOT Polish AirlinesNetwork
2018 4,713 0.804 3.08 78
2019 4,755 0.792 3.68 71
Austrian AirlinesNetwork
2018 4,643 0.779 2.49 63
2019 4,718 0.823 3.42 72
TAP Air PortugalNetwork
2018 3,526 0.878 2.45 66
2019 3,707 0.828 3.41 69
Ethiopian AirlinesNetwork
2018 7,515 0.699 2.91 62
2019 7,266 0.750 2.87 62
SaudiaNetwork
2018 6,916 0.704 2.50 50
2019 6,911 0.650 2.33 46
South African AirwaysNetwork
2018 6,343 0.768 2.04 46
2019 6,491 0.768 2.14 47
CondorLow-cost carrier
2018 5,004 0.906 1.89 68
2019 5,030 0.912 2.14 68
FinnairNetwork
2018 4,465 0.835 1.47 69
2019 4,658 0.855 2.00 72
Notes: Includes airlines with a minimum 1 billion RPMs in 2019. Airlines are listed in order of increasing RPMs.
26 ICCT WHITE PAPER | LOW-COST CARRIERS AND U.S. AVIATION EMISSIONS GROWTH, 2005 TO 2019
Table A.C2 Airline-specific data for U.S.–Canada passenger market
Airline YearAvg stage
[mi]Avg load
factorRPMs
(millions)Fuel efficiency [RPMs / gal]
Air CanadaNetwork
2018 835 0.821 15,835 54
2019 867 0.813 15,857 54
WestjetLow-cost carrier
2018 1,238 0.883 7,125 70
2019 1,261 0.887 7,077 71
United AirlinesNetwork
2018 825 0.883 3,564 53
2019 859 0.878 4,048 55
Delta Air LinesNetwork
2018 585 0.870 2,386 45
2019 597 0.882 2,542 46
American AirlinesNetwork
2018 755 0.862 2,485 48
2019 739 0.889 2,418 50
Air TransatLow-cost carrier
2018 1,301 0.842 251 74
2019 1,340 0.837 358 74
Porter AirlinesNetwork
2018 383 0.700 345 44
2019 383 0.701 347 40
Alaska AirlinesNetwork
2018 242 0.780 186 36
2019 245 0.827 196 35
Sunwing AirlinesLow-cost carrier
2018 1,237 0.839 171 75
2019 1,247 0.817 171 71
Flair AirlinesLow-cost carrier
2018 1,490 0.395 17.2 39
2019 1,510 0.451 62.2 44
Frontier AirlinesLow-cost carrier
2018 936 0.612 22.1 65
2019 899 0.704 19.2 67
Sun Country AirlinesLow-cost carrier
2018 1,201 0.801 10.5 66
2019 1,201 0.771 12.5 73
Note: Includes airlines listed in order of increasing RPMs in 2019.
27 ICCT WHITE PAPER | LOW-COST CARRIERS AND U.S. AVIATION EMISSIONS GROWTH, 2005 TO 2019
Table A.C3 Airline-specific data for U.S.–Latin America passenger market
Airline YearAvg stage
[mi]Avg load
factorRPMs
(millions)Fuel efficiency [RPMs / gal]
American AirlinesNetwork
2018 1,295 0.796 30,580 59
2019 1,278 0.847 30,984 61
United AirlinesNetwork
2018 1,536 0.833 20,846 62
2019 1,541 0.842 21,375 59
Delta Air LinesNetwork
2018 1,622 0.854 18,565 65
2019 1,584 0.859 18,282 66
LATAMNetwork
2018 3,775 0.824 12,165 77
2019 3,796 0.856 12,094 82
JetBlue AirwaysLow-cost carrier
2018 1,193 0.826 10,655 61
2019 1,224 0.800 11,977 63
AviancaNetwork
2018 2,020 0.825 7,992 63
2019 1,953 0.814 7,682 62
VolarisLow-cost carrier
2018 1,506 0.760 4,522 74
2019 1,507 0.783 5,645 77
Copa AirlinesNetwork
2018 1,967 0.854 5,752 70
2019 1,903 0.877 5,542 71
AeromexicoNetwork
2018 1,512 0.783 6,056 61
2019 1,501 0.825 5,365 64
Southwest AirlinesLow-cost carrier
2018 1,022 0.825 4,764 88
2019 1,019 0.842 4,393 77
Spirit AirlinesLow-cost carrier
2018 1,132 0.792 2,636 67
2019 1,184 0.776 3,652 68
InterjetLow-cost carrier
2018 1,351 0.737 2,909 56
2019 1,327 0.819 3,087 61
Alaska AirlinesNetwork
2018 1,412 0.843 2,824 71
2019 1,415 0.867 2,520 73
Azul Brazilian AirlinesLow-cost carrier
2018 3,921 0.892 2,632 75
2019 3,938 0.876 2,476 75
Aerolineas ArgentinasNetwork
2018 4,701 0.765 2,115 61
2019 4,678 0.740 1,903 60
Caribbean AirlinesNetwork
2018 1,696 0.735 1,400 61
2019 1,798 0.749 1,415 62
Frontier AirlinesLow-cost carrier
2018 1,504 0.772 1,120 71
2019 1,523 0.774 1,189 82
VivaAerobusLow-cost carrier
2018 1,276 0.793 433 70
2019 1,331 0.802 714 71
Sun Country AirlinesLow-cost carrier
2018 1,682 0.746 699 66
2019 1,732 0.746 689 70
Notes: Includes airlines with a minimum 500 million RPMs in 2019. Airlines are listed in order of increasing RPMs.
28 ICCT WHITE PAPER | LOW-COST CARRIERS AND U.S. AVIATION EMISSIONS GROWTH, 2005 TO 2019
Table A.C4 Airline-specific data for U.S.–Pacific passenger market
Airline YearAvg stage
[mi]Avg load
factorRPMs
(billions)Fuel efficiency [RPMs / gal]
United AirlinesNetwork
2018 5,310 0.794 33.5 65
2019 5,282 0.810 34.4 66
Delta Air LinesNetwork
2018 5,730 0.863 19.5 69
2019 5,891 0.850 20.5 68
Korean Air LinesNetwork
2018 5,360 0.819 16.5 51
2019 5,504 0.841 17.5 51
Cathay Pacific AirwaysNetwork
2018 7,555 0.851 15.9 60
2019 7,525 0.816 16.7 58
American AirlinesNetwork
2018 6,690 0.796 15.5 70
2019 6,692 0.842 14.5 71
EVA AirwaysNetwork
2018 6,926 0.838 13.7 68
2019 6,875 0.838 13.3 68
All Nippon AirwaysNetwork
2018 5,488 0.764 10.7 54
2019 5,475 0.790 11.7 53
Japan Air LinesNetwork
2018 4,753 0.800 11.3 55
2019 4,874 0.808 11.6 58
Qantas AirwaysNetwork
2018 7,431 0.836 11.0 47
2019 7,408 0.836 11.1 50
Air ChinaNetwork
2018 6,493 0.802 10.7 60
2019 6,525 0.830 10.8 62
China Eastern AirlinesNetwork
2018 6,329 0.818 8.77 58
2019 6,307 0.836 9.06 59
Philippine AirlinesNetwork
2018 5,861 0.827 5.84 64
2019 6,265 0.793 7.52 63
Asiana AirlinesNetwork
2018 5,409 0.851 9.17 58
2019 5,187 0.843 7.39 53
China Southern AirlinesNetwork
2018 7,380 0.888 6.79 60
2019 7,235 0.896 7.24 62
Singapore AirlinesNetwork
2018 6,948 0.830 4.52 59
2019 7,931 0.831 5.98 54
Air New ZealandNetwork
2018 6,273 0.815 5.68 70
2019 6,459 0.816 5.72 68
Hainan AirlinesNetwork
2018 6,522 0.762 5.42 71
2019 6,587 0.729 5.70 71
China AirlinesNetwork
2018 5,974 0.801 5.45 78
2019 5,999 0.839 5.67 73
Hawaiian AirlinesNetwork
2018 4,216 0.829 5.53 72
2019 4,176 0.852 5.45 73
Virgin AustraliaNetwork
2018 7,493 0.739 3.38 57
2019 7,496 0.845 3.81 62
29 ICCT WHITE PAPER | LOW-COST CARRIERS AND U.S. AVIATION EMISSIONS GROWTH, 2005 TO 2019
Airline YearAvg stage
[mi]Avg load
factorRPMs
(billions)Fuel efficiency [RPMs / gal]
Hong Kong AirlinesNetwork
2018 6,430 0.807 4.10 79
2019 6,449 0.810 2.20 78
XiamenAirNetwork
2018 6,895 0.784 1.79 78
2019 6,926 0.646 1.74 79
Air IndiaNetwork
2018 7,707 0.795 1.32 49
2019 7,707 0.807 1.44 49
Fiji AirwaysNetwork
2018 4,732 0.775 1.21 63
2019 4,763 0.780 1.30 63
Jetstar AirwaysLow-cost carrier
2018 5,234 0.884 1.40 92
2019 5,225 0.840 1.19 87
Sichuan AirlinesNetwork
2018 4,312 0.668 0.94 49
2019 4,238 0.691 1.07 57
Notes: Includes airlines with a minimum 1 billion RPMs in 2019. Airlines are listed in order of increasing RPMs.