Embed Size (px)
Citation preview
Aerospace
Civil Aviation Alternate Fuels
Contrails and Emissions Research –
Operations and Contrail
Observations
LR-FRL-2018-0013
A P Brown, M Bastian, F Femia, M Salib, F Ghatala, J Olfert,
R Beunis, M Valk and N Gaudet
Flight Research Laboratory

2
Table of Contents
Table of Figures .............................................................................................................................. 4
Abbreviations .................................................................................................................................. 8
Abstract ......................................................................................................................................... 11
1.0 Introduction ............................................................................................................................. 12
2.0 CAAFCER consortium operational responsibilities ............................................................... 12
3.0 SkyNRG HEFA biofuel acquisition and blending .................................................................. 13
4.0 Air Canada CAAFCER flight operations ............................................................................... 13
4.1 Flight operational period ..................................................................................................... 13
4.2 Air Canada flight procedures .............................................................................................. 13
4.3 Air Canada flight listing ...................................................................................................... 14
4.4 Wing-tank fuel samples....................................................................................................... 15
4.5 Flight profile & data ............................................................................................................ 15
4.6 Supplemental flight details .................................................................................................. 15
5.0 University of Alberta calibration operations........................................................................... 16
5.1 Particle Loss estimations ..................................................................................................... 16
6.0 NRC CT-133 flight operations................................................................................................ 17
6.1 NRC CT-133 Research Aircraft and Instrumentation......................................................... 17
6.2 CAAFCER NRC CT-133 flights......................................................................................... 19
7.0 A data overview and examples of CAAFCER contrail flight data ......................................... 21
7.1 General ................................................................................................................................ 21
7.2 Atmospheric influence ........................................................................................................ 21
7.3 Data analysis ....................................................................................................................... 21
7.3.1 General.......................................................................................................................... 21
7.3.2 Spatial re-construction .................................................................................................. 21
7.3.3 Time-trace analysis ....................................................................................................... 22
7.4 25th April flight .................................................................................................................... 23
7.4.1 Biofuel contrail ............................................................................................................. 23
8.0 Contrail Video Imagery .......................................................................................................... 24
8.1 Biofuel contrail, 3rd May flight ........................................................................................... 24
3
8.2 Jet A1 contrail, B763, 3rd May ............................................................................................ 26
8.3 Biofuel contrail, A320, 4th May, afternoon flight ................................................................ 27
8.4 Jet A1 contrail, A320, 11th May .......................................................................................... 31
9.0 Data review and analysis......................................................................................................... 34
9.1 Data example, biofuel contrail, 25th April 2017.................................................................. 34
9.1.1 Inertial and Air data ...................................................................................................... 34
9.1.2 Wake vortex data .......................................................................................................... 34
9.1.3 Dynamic phase, contrail length 10-17 km .................................................................... 37
9.1.4 Biofuel contrail, 25th April 2017, 18-26 km length ...................................................... 44
9.1.5 Biofuel contrail, 25th APRIL 2017, 27-37 km length ................................................... 49
9.1.6 Biofuel contrail, 25th APRIL 2017, 37-50 km .............................................................. 53
9.1.7 Biofuel contrail, 25th APRIL 2017, 50-55 km length ................................................... 57
9.2 Overview, assembly & comparison, CN data ..................................................................... 61
9.2.1 Biofuel contrail, 25th April, to 55 km length ................................................................ 61
9.2.2 Contrail FSSP data assemblage .................................................................................... 62
10.0 Conclusions ........................................................................................................................... 64
11.0 Acknowledgements ............................................................................................................... 65
12.0 References ............................................................................................................................. 65

4
Table of Figures Figure 1. NRC CT-133 research jet, equipped with contrail and emissions measurement sensors; strike -through text depicts the configuration changes of successive sensor developmental cycles – text in red (2016ff) depicts CAAFCER configuration. Figure 2 – CAAFCER inflight pictures of contrail states, left, slanted-veil state, and right, laterally-spreading crown of cirrocumulus character. Figure 3 – top, left to right, typical contrail cross-section, and vertical distribution of ice particles; mid, left to right, ice particle size spectra, bottom, left to right, MED contrail cross-section, behaviour of MED with contrail length. Figure 4 – plot of CAAFCER contrail AEIn7 values, for the FSSP-100 against CN, CPC & CPCnv values. Figure 5 – plot of all contrail AEIn values, derived from contrail cross-sections, measured by the NRC CT-133, and compared to CN EIn. Figure 6 – plot of nvPM EIm against total hydrogen content (normalised by 15.3%) for five jet fuels tested in the altitude chamber of the Gas Turbine Lab of the NRC1; curve-fit is the variation nvPM EIm ~ (total hydrogen)-27.9. Figure 7 – plot of contrail FSSP-100 AEIn against total hydrogen content; ordinate direction spread includes the effect of variations in atmospheric conditions, such as RH iice, individual aircraft, engines, power settings+3%; the log-log linearization shown is for CAAFCER JetA1 and ACCESS II Jet A and HEFA-blend., resulting in a power index of -36. Figure 8 – plot of normalised emitted PM EIn against sulphur content, estimated from Aerodyne/NASA data2. Figure 9(a) –trailing vortex pair core passages at 11 km wake length, plotted against crossplane
projection of the CT-133 flight-path (this data was used for the open path integral of Figure 8)..
Figure 9(b) – re-constructed cross-plane view of trailing vortex pair (of Figure 9(a)), observed in the signature of induced vertical wind: showing the relatively large-scale of the vortices and relatively short distance between vortex cores, approximately 10 metres.
Figure 10 – plot of CAAFCER & ACCESS II NRC data of FSSP-100 AEIn against atmospheric temperature. Figure 11 – plot of CAAFCER & ACCESS II NRC data of FSSP-100 AEIn against atmospheric RHICE Figure 12 – plot of CAAFCER & ACCESS II NRC data of FSSP-100 AEIn against atmospheric RH lapse rate,
RH/z.
Figure 13 – plots of ARH/zaTSbRHice
c = log10[FSSP EIn], identifications for each of the two separate fuel type CAAFCER contrail data-sets (ACCESS data is not included in the statistical identification, merely presented for comparison).

5
Figure 14 – plot of ARH/zaTSbRHice
c identified separately for each of the two fuel types, against contrail cross-section data-point age Figure 15 – plots of CAAFCER & ACCESS II NRC data of FSSP-100 AEIm against atmospheric temperature
TS, RH lapse rate RH/z and relative humidity over ice RHICE.
Figure 16 – plots of log-normal (by 108 µg/kg) ARH/zaTSbRHice
c = log10[FSSP AEIm], identifications of contrail spherically-assumed ice-mass, for each of the two separate fuel type contrails Figure 17 – plot of ARH/zaTS
bRHicec identified separately for each of the two fuel types, against contrail
cross-section data-point age. Figure 18 – contrail ice particle spectra, FSSP-100, in homogenous sections of the contrail, at various contrail lengths:- top, left to right, 15 nm, 18 nm, 22 nm; bottom, left to right, 35 nm, 45 nm Figure 19(a) – contour crossplane plots of contrail FSSP-100 ice particle spectral MED (43%HEFA contrail, 3rd May 2017), showing size growth in the UJW and sublimation in the TWV regions over increasing contrail length:- top, left to right, 8 nm, 12 nm; bottom, left to right, 15 nm, 18 nm. Figure 19(b) – contour crossplane plots of contrail FSSP-100 ice particle spectral MED (Jet A1 contrail, 3rd May 2017), showing size growth in the UJW and sublimation in the TWV regions over increasing contrail length:- top, left to right, 123nm, 16 nm; bottom, left to right, 19 nm, 22 nm. Figure 20 – plots of median MED for each contrail cross-sections, plotted against top left, contrail age (and along-track spatial changes) and atmospheric parameters, top right, TS, bottom left, RHice, bottom
right, RH/z. Figure 21 – plots of identified power-law parametric variations of contrail cross-section median MED with atmospheric properties, for the two fuel types used on CAAFCER, Figure 22 – CAAFCER #1, 18-27 km contrail cross-sections, biofuel nvPM CPC3776 >2.5 nano-m (left) and CN 7610 >10 nano-m CN (right) concentration. Figure 23 – CAAFCER #1, 18-27 km contrail cross-section lateral integrations, biofuel nvPM CPC3776 >2.5 nano-m (left) and CN 7610 >10 nano-m CN concentration (right). Figure 24 – CAAFCER #1, 18-27 km contrail, biofuel, ratio of FSSP ice particle count density to nvPM particle count, with contrail length (left) and a contrail cross-sectional contour plot (right). Figure 25 – CAAFCER #1, 18-27 km contrail cross-section and lateral integration, CO2 plume. Figure 26 – CAAFCER #1, 18-27 km contrail cross-section and lateral integration, BC plume. Figure 27 – CAAFCER #1, 18-27 km contrail cross-section and lateral integration, ice-mass, assuming sphericity. Figure 28 – CAAFCER #1, 18-27 km contrail cross-sectional MED distribution (left) and behaviour of MED with contrail length (right).

6
Figure 29 – CAAFCER #1, 18-27 km contrail cross-sections of RH (left) and RHi (right). Figure 30 – CAAFCER #1, 27-37 km contrail cross-section of CN and lateral integrand distribution Figure 31(a) – CAAFCER #1, 27-37 km contrail cross-section of CPC3776 PM and lateral integrand distribution. Figure 31(b) – CAAFCER #1, 27-37 km contrail cross-section of CO2 and lateral integrand distribution. Figure 32 – CAAFCER #1, 27-37 km contrail cross-section of FSSP-100 ice particles and lateral integrand vertical distribution thereof. Figure 33 – CAAFCER #1, 27-37 km contrail cross-sectional distribution of ice particle MED. Figure 34 – CAAFCER #1, 27-37 km contrail cross-sections of RH (left) and RHi (right). Figure 35 – CAAFCER #1, 37-50 km contrail cross-section of CN and lateral integrand, vertical distribution. Figure 36 – CAAFCER #1, 37-50 km contrail cross-section of CPC3776 nvPM and lateral integrand, vertical distribution Figure 37 – CAAFCER #1, 37-50 km contrail cross-section of CO2 and lateral integrand, vertical distribution Figure 38 – CAAFCER #1, 37-50 km contrail cross-section of BC and lateral integrand, vertical distribution. Figure 39 – CAAFCER #1, 37-50 km contrail cross-section of ice particles and # lateral integrand, vertical distribution Figure 40 – CAAFCER #1, 37-50 km contrail cross-section of MED. Figure 41 – CAAFCER #1, 37-50 km contrail nvPM/FSSP activation (left) and re-constructed cross-section of the activation (right). Figure 42 – CAAFCER #1, 37-50 km contrail cross-sections of RH (left) and RHi(right). Figure 43 – CAAFCER #1, 50-55 km contrail cross-section of CN aerosol # (left) lateral integrand, vertical distribution (right). Figure 44 – CAAFCER #1, 50-55 km contrail cross-section of CPC total ultrafine aerosol # ( left) lateral integrand, vertical distribution (right). Figure 45 – CAAFCER #1, 50-55 km contrail cross-section of CO2 (left) lateral integrand, vertical distribution (right).
7
Figure 46 – CAAFCER #1, 50-55 km contrail cross-section of BC (left) lateral integrand, vertical distribution (right). Figure 47 – CAAFCER #1, 50-55 km contrail cross-section of ice particle count (top left) lateral integrand, vertical distribution (top right), and MED cross-section (bottom left). Figure 48 – CAAFCER #1, 50-55 km contrail cross-sections of RH (left) and RHi (right). Figure 49 – CAAFCER #1, biofuel contrail assembly and comparison of CN EIn data, plotted against cruise altitude, with that of other flight campaigns. Figure 50 – CAAFCER #1, biofuel contrail assembly and comparison of CN EIn data, plotted against engine EGT/TS, a measure of engine thrust level. Figure 51 – CAAFCER #1, biofuel contrail FSSP-100 AEIn, (top) and spherical-AEIm (bottom), cross-plotted against cruise altitude, and compared with AEIn of other contrails measured by the NRC CT-133 upon earlier flight campaigns. Figure 52 – CAAFCER #1, biofuel contrail FSSP-100 AEIn, cross-plotted against CN aerosol EIn and compared with AEIn ~ CN EIn of other contrails measured by the NRC CT-133 upon earlier flight campaigns.
8
Abbreviations
ACA Air Canada flight ACCESS II NASA project Alternativee Fuel Effects on Contrails &
Cruise Emissions, Phase II
ADS Air data system AEIn Apparent Emissions Index of contrail ice particle number
per kg of fuel burned, for ice particles >0.5µm in size as measured by the NRC CT-133 FSSP-100 probe
ASTM D7566 Standard Specification for Aviation Turbine Fuel of the
American Society for Testing & Materials ATC Air traffic control
bv Lateral separation of the trailing vortex pair BC Black carbon particles (soot) BL-NCE Business Led Network of Centres of Excellence
CAAFCER Civil Aviation Alternate Fuel Contrails and Emissions Research
CN 7610 Condensation nuclei counter, model 7610, counting aerosol particles of greater than 10 nano-metres, in size
CPC 3776 Condensation particle counter, model 3776 operated on a
sheath airflow principle, to count ultrafine particles of greater than 2.5 nano-metres, in size
CT-133 NRC research jet aeroplane DAS Data acquisition system DND Department of National Defence of Canada
ECCC Environment and Climate Change Canada EI or EIm Emission Index by mass per kg fuel burned
EIn Number Emission index by number per kg of fuel burned FIRNS FRL inertial reference and navigations system (integrated
HG1700 IMU, Novatel GPS and DRP system)
FL Flight level, aircraft altitude in 100 feet units above sea level, e.g., F300=30,000 feet altitude
FMS Flight management system FSSP-100 Forward scattering spectrometric probe -100 part number
sizing 0.5-47 µm
GARDN Green Aviation Research & Development Network, a non-profit organization funded by the Business-Led Network of
Centres of Excellence (BL-NCE) of the Government of Canada and the Canadian aerospace industry
HAARC NRC High altitude atmospheric research capability
HEFA Hydro-processed Esters and Fatty Acids LOF Line of flight
LVW Lower viscous wake (wake regime below the TWV) M Mach Number MED Median effective diameter – the spherical ice particle

9
diameter equating to the 50th percentile of the FSSP-100 cumulative volumetric distribution of the particle size
spectrum MFC Mass-flow controller
MLE Maximum likelihood estimator NOx Total NO, NO2, and HONO compounds, measured by full
conversion to NO2 by the Thermo 42I analyser one sample
per twenty seconds in this mode, which is not used on the CAAFCER project
NOy Nitric oxides measured by the Thermo 42I analyser, operating in 1 Hz streaming mode (i.e. incomplete conversion), ref. para 5.1.5
NRC National Research Council of Canada N1 Engine gas generator rotational speed (%)
nm Nano-metres Nm Nautical miles NMR Nuclear magnetic resonance measurement of total
hydrogen content nvPM Non-volatile particulate matter (such as black carbon)
PDP NRC particle detection probe PIREP Pilot report of inflight conditions of icing, turbulence, air
temperature
PM Particulate matter emissions PS Atmospheric static air pressure
PT Atmospheric total air temperature QAR Quick access recorder, part of the aircraft flight data
recorder
QETE Quality Engineering Test Establishment of the Department of National Defence
RH Relative humidity RHice RH over ice TAT Total air temperature
TGT Engine turbine gas temperature THC Total hydrogen content
TOPC Top of climb TOPD Top of descent TS Static air temperature
TWV Trailing wake vortex crossplane flow region UofA The University of Alberta
UJW Upper jet wake; generally the UJW in cross-sectional shape is a ‘T’, the lateral being the UJW crown, the vertical being the UJW stem, and the foot being the TWV region.
UTLS Upper troposphere lower stratosphere V True airspeed
vPM Volatile particulate matter WV Trailing pair of wake vortices
10
wa Vortex-induced velocity component in the contrail axial direction, [x]
wC Vortex-induced velocity component in the contrail crossplane, or lateral, direction [y]
wZ Vortex-induced velocity component in the contrail normal direction [z]
YOW Ottawa Airport
YUL Montreal Pierre Elliott Trudeau Airport YVO Val d’Or Airport, Quebec
YYZ Toronto Pearson Airport Contrail axis system:
[x] Projection of the CT-133 mean LOF axis direction onto the horizontal plane (upstream is positive); mean LOF is
aligned with the contrail mean axial direction projection onto the horizontal plane (in cruising flight at constant Flight Level, the difference in elevation is negligible)
[y] Lateral direction (to the right is positive, looking upstream), orthogonal to [x]
[z] Normal direction (upwards is positive)
Free airflow incidence angle (angle-of-attack) to the NRC
CT-133
Free airflow sideslip angle to the NRC CT-133
Vortex circulation
Free airflow density
11
Abstract
In 2017, the NRC undertook GARDN project CAAFCER, Civil Aviation Alternate Fuels Contrails and Emissions Research, in conjunction with Air Canada, The Waterfall Group, The
University of Alberta, SkyNRG, and The Boeing Company, with the scientific objective of comparing the characteristics of persistent contrails formed from petroleum jet fuel and biofuel.
The NRC CT-133 research jet undertook flight measurements of contrail ice particle size and number, particulate and gaseous emissions from Air Canada A320 series jets in cruise, flying
respectively on bulk JetA1 and pre-blended 43% HEFA-biofuel-JetA1 blend. The HEFA was supplied by AltAir, Air Canada conducted the blend in Montreal. Intertek conducted full ASTM
analyses of the fuel blend. Aircraft departed Montreal Airport for Toronto. The NRC CT-133 flew from Ottawa Airport, intercepting the Air Canada jets at top-of-climb.
Fuel from the wing-tanks of each project Air Canada flight were sampled and analysed by QETE
DND, for hydrogen content, aromatics, sulphur, naphthalene and heat of combustion – biofuel blend flights were fuel-sampled following refuelling and prior to despatch, JetA1 inbound flights were fuel-sampled following shutdown at the arrival gates in Montreal Airport.
Biofuel contrails were successfully obtained and measured to 90 kilometres in length; JetA1
contrails to 55 kilometres in length.
The ground and flight operations are summarized. Included are examples of measured emission data and a range of particulate emissions and contrail characteristics flight data.

12
1.0 Introduction
The Civil Aviation Alternate Fuels Contrail and Emissions Research project (CAAFCER),
addressed the flight research of high altitude contrails formed by jet transport aeroplanes, and, in
particular, the comparison between contrails formed by petroleum jet fuel and biofuel. The
CAAFCER project was a 2016 award from The Green Aviation Research and Development
Network (GARDN), a non-profit organization funded by the Business-Led Network of Centres
of Excellence (BL-NCE) of the Government of Canada and the Canadian aerospace industry.
The research was conducted by a consortium, led by The Waterfall Group. Additional
consortium members were the National Research Council Canada (NRC), Air Canada, SkyNRG,
the University of Alberta and Boeing. Flight research consisted of the flight measurement of
contrails and emissions produced by Jet A1 and by a biofuel blend, consisting of 43% hydro-
processed ester fatty acid (HEFA) biofuel and 57% Jet A1.
The data acquisition Operations Phase of GARDN CAAFCER extended from the 20 th April to
the 4th May, for the last biofuel flight, and a subsequent Jet A1 flight on 11th May 2017. The
overall operational phase covered fuel acquisition, delivery, blending and usage operations.
These operations are briefly described herein.
Fuel usage and consumption consisted of line flight operations of Air Canada A320 series
aircraft, operating Montreal Airport (YUL) to Toronto Airport (YYZ) on 43% HEFA / Jet A1
blend and Toronto to Montreal on Jet A1, refueled in Toronto. The NRC CT-133 research jet
aeroplane measured contrail and emissions characteristics.
The principal goal of this project was to measure and compare contrail characteristics from
different jet transport fuels, namely petroleum and biofuel blend. For such a comparison, the
determinant parameters are the types of jet fuel, individual engine, aircraft and atmospheric
conditions. The comparative analysis considers the parametric variants of fuel properties (for the
JetA1 and 43%HEFA blend used on the experiment) and atmospheric conditions.
2.0 CAAFCER consortium operational responsibilities In the CAAFCER consortium, the following entities undertook operations or operations support:
(1) The Waterfall Group – project management, liaison and coordination
(2) SkyNRG – management of fuel acquisition and blending with Air Canada
(3) Air Canada – conduct of biofuel blending with SkyNRG and conducting line flight
operations, integration of the biofuel flights
(4) NRC – flight measurement and analysis of contrails and emissions from the Air
Canada flights
(5) University of Alberta – management and analysis of the CPC 3776 aerosol counter
and denuder operations,

13
(6) Boeing – providing technical input in the planning and execution of the CAAFCER
flights, notably fuel property and flight process optimization and quality assurance.
(7) QETE of DND – undertaking analysis of fuel samples, for the measurement of fuel
properties.
3.0 SkyNRG HEFA biofuel acquisition and blending The HEFA biofuel acquired for CAAFCER was produced by Alt-Air bio-refinery in Los
Angeles Airport, using a feedstock of used cooking oil. The HEFA was shipped per ISO
container via rail, to Montreal railyards, where it was blended with Jet A1, produced by the
Valero jet-fuel refinery, in early April 2017.
The 43%HEFA- Jet Al blend was required, by ASTM D7566 standards, to comply with all Jet
A1 specifications. Marginal fuel specification compliance characteristics centred upon aromatics
content and fuel freezing point; the latter dictated the final blend of 43% HEFA.
The analysis of the 43% HEFA / 57% Jet A1 blend is included as Appendix A.
4.0 Air Canada CAAFCER flight operations
4.1 Flight operational period
The planned CAAFCER flight operations period covered the 20th April to the 5th May, inclusive.
Five biofuel flights were conducted over this period. As explained below, the operational period
was extended to the 11th of May, in an attempt to utilize the residual HEFA blend, after the five
flights.
The residual biofuel quantity was 3,000 kg in the biofuel bowser, operated by the Air Canada
contractor at YUL, Swissport. In an effort to utilise the residual quantity (in a wing-tank mix
that would be approximately 35% HEFA / Jet A1 blend), the operational period was extended to
11th May. However, the residual biofuel was not able to be uploaded, due to insufficient pump-
priming head (fuel depth) for a flight on that data. The NRC CT-133 nevertheless flew on that
date, surveying an ACA A320 contrail generated on Jet A1.This was the sixth and final
CAAFCER flight.
4.2 Air Canada flight procedures When contrail conditions were forecast to occur, a CAAFCER biofuel flight was scheduled, by
the afternoon of the day before the flight. Generally, this was the early flight from YUL, which
had been gated overnight at one of three suitable Gates (for the size of the biofuel bowser) at the
Air Canada terminal at YUL.
In early morning on the flight day, Air Canada defueled the designated aircraft (to an undrainable
fuel level of approximately 200 litres Jet A1), then refueled with biofuel-blend for flight

14
operations dispatch of the aircraft. The wing fuel was sampled for analysis by DND QETE, for
(i) calorific value, (ii) total hydrogen, (iii) aromatics, (iv) naphthalene and (v) sulphur content.
The biofuel aircraft QAR was fitted with a flash-card for recording flight parameters – engine,
inertial and air data. The flash-card was removed and archived, upon arrival of the aircraft, at the
terminal gate in YYZ.
In the second week of CAAFCER flight operations, two middle-of-the-day flights were prepared
and despatched from YUL, in order to achieve all CAAFCER flights (due to limitations on
suitable atmospheric conditions). The middle-of-the-day flight operations were considerably
more demanding upon flight- line resources, due to the time limitations on aircraft-turnarounds.
Greater human resources were applied, in order to achieve these flights. The Jet A1 YYZ-YUL
flights, following arrival at the designated gate in YUL, had wing-tank fuel sampled for DND
QETE analysis. The QAR flight data flash-card, with recorded engine, inertial and air data, was
removed and archived, following arrival of the aircraft at the terminal gate at YYZ.
4.3 Air Canada flight listing Table 1 lists the Air Canada flights, biofuel from YUL and Jet A1 from YYZ. In addition to the
list, a project flight functional check was conducted on the 20th April, with an A320 (flight
ACA411) JetA1 contrail being measured, but wing-tank fuel not being sampled for fuel
properties testing.
Table 1 – Air Canada CAAFCER flight details.
Date, 2017 Flight, YUL-YYZ (43% HEFA/JetA1) Flight, YYZ-YUL (Jet A1)
Flt No. Aircraft Engines, Type Flt No. Aircraft Engines, Type
25th April ACA401 C-GPWG A320-211
ACA402 C-GITY A321-211
28th April ACA401 C-FGKN
A321-211
CFM56-5B3-P ACA402 C-GJWD
A321-211
FIN457
CFM56-5B3-P
3rd May ACA411 C-FNVU
A320-211
CFM56-5A1
ACA412
C-FPCA
B767-375 FIN637
CF6-80C2 B1F/B6F
4th May ACA401 C-FDRH
A320-211
CFM56-5A1 ACA402 C-FXCD
A320-214 FIN239
CFM56-5B4/P
4th May ACA413
A320-211
CFM56-5A1 ACA414
A320-211
11th May nil nil Nil nil ACA402 A320 - -
15
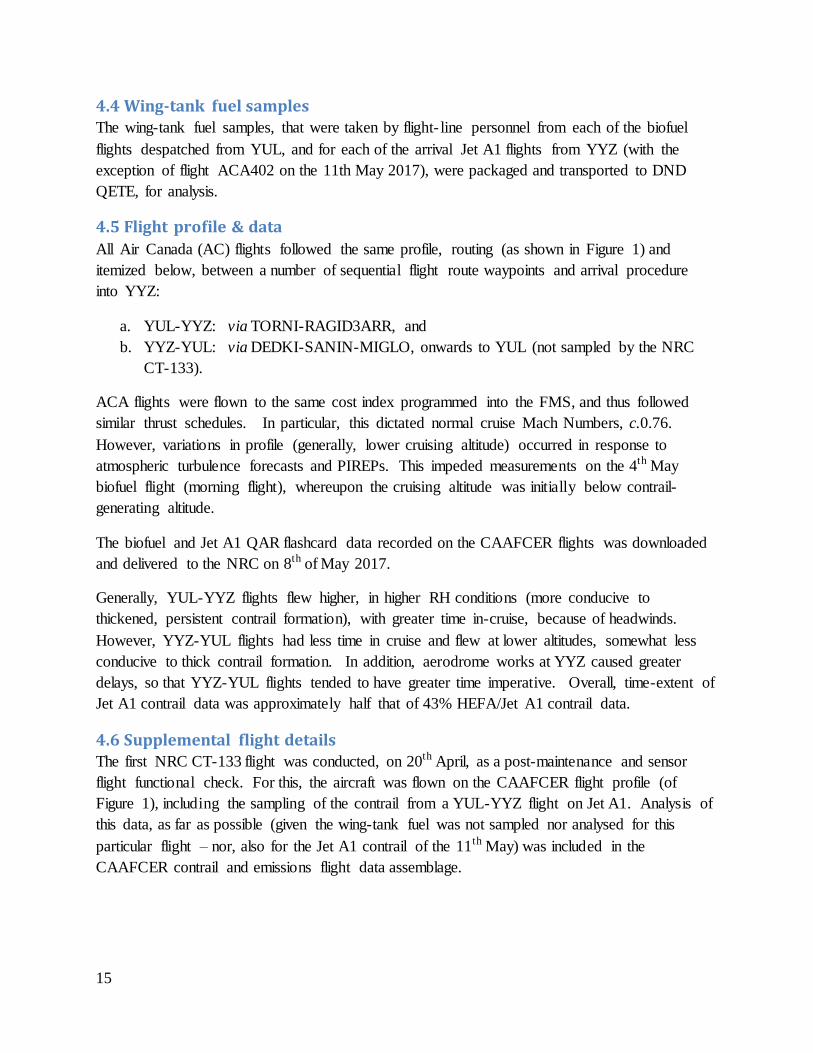
4.4 Wing-tank fuel samples The wing-tank fuel samples, that were taken by flight- line personnel from each of the biofuel
flights despatched from YUL, and for each of the arrival Jet A1 flights from YYZ (with the
exception of flight ACA402 on the 11th May 2017), were packaged and transported to DND
QETE, for analysis.
4.5 Flight profile & data
All Air Canada (AC) flights followed the same profile, routing (as shown in Figure 1) and
itemized below, between a number of sequential flight route waypoints and arrival procedure
into YYZ:
a. YUL-YYZ: via TORNI-RAGID3ARR, and
b. YYZ-YUL: via DEDKI-SANIN-MIGLO, onwards to YUL (not sampled by the NRC
CT-133).
ACA flights were flown to the same cost index programmed into the FMS, and thus followed
similar thrust schedules. In particular, this dictated normal cruise Mach Numbers, c.0.76.
However, variations in profile (generally, lower cruising altitude) occurred in response to
atmospheric turbulence forecasts and PIREPs. This impeded measurements on the 4th May
biofuel flight (morning flight), whereupon the cruising altitude was initially below contrail-
generating altitude.
The biofuel and Jet A1 QAR flashcard data recorded on the CAAFCER flights was downloaded
and delivered to the NRC on 8th of May 2017.
Generally, YUL-YYZ flights flew higher, in higher RH conditions (more conducive to
thickened, persistent contrail formation), with greater time in-cruise, because of headwinds.
However, YYZ-YUL flights had less time in cruise and flew at lower altitudes, somewhat less
conducive to thick contrail formation. In addition, aerodrome works at YYZ caused greater
delays, so that YYZ-YUL flights tended to have greater time imperative. Overall, time-extent of
Jet A1 contrail data was approximately half that of 43% HEFA/Jet A1 contrail data.
4.6 Supplemental flight details The first NRC CT-133 flight was conducted, on 20th April, as a post-maintenance and sensor
flight functional check. For this, the aircraft was flown on the CAAFCER flight profile (of
Figure 1), including the sampling of the contrail from a YUL-YYZ flight on Jet A1. Analysis of
this data, as far as possible (given the wing-tank fuel was not sampled nor analysed for this
particular flight – nor, also for the Jet A1 contrail of the 11th May) was included in the
CAAFCER contrail and emissions flight data assemblage.

16
Figure 1 – Air Canada & NRC flight tracks for CAAFCER flights, indicating the ACA routes and CT-133
contrail measurement segments of cruising flight.
5.0 University of Alberta calibration operations
5.1 Particle Loss estimations
Through the course of 2016, the University of Alberta (UAlberta) conducted detailed estimations
of particle losses for the CPC 3776 and denuder installations in the starboard pod of the CT-133.
The method of inflight operation involved using a pair of pinch (low particle loss) valves, for
bypass or in-line operation of the denuder (which was kept at operating temperature >300C
throughout), to obtain total ultrafine aerosol counts and non-volatile particle counts, respectively.
At the NRC Flight Research Laboratory, UAlberta conducted inter-comparative calibrations for
particle sizes >10 nm, between the CN 7610 and CPC 3776 counters. A fully flight-
representative calibration was not possible, because of the difficulty of static representation of
flight (wherefore, isokinetic probe operation is driven by airspeed, i.e. a positive pressure at the
inlet). However, the inter-comparisons did indicate similarity of measurements between the
counters – a similar result to previous inter-comparisons between the CN7610 and an ECCC
CPC.
17
The CPC 3776 and denuder performed very well inflight, following initial performance flight
testing on the 20th April flight. Initially the dissipative heat exchanger of the Peltier cooler did
not receive sufficient cooling – a mini cooling fan assembly (consisting of two mini-axial- flow
fans) was designed, installed, and successfully provided sufficient forced convection to rectify
the condition. Furthermore, to maintain the denuder temperature above 300C, the denuder
heater temperature was set higher, from 350C to 430 C
6.0 NRC CT-133 flight operations
6.1 NRC CT-133 Research Aircraft and Instrumentation
The NRC CT-133 research aeroplane contrail and emissions equipage, together with the sensor
data acquisition rates, are shown in the photograph of Figure 2, which captions the
instrumentation configuration for the measurement of emissions and contrail ice particles, as
used upon the GARDN CAAFCER biofuel contrails project.
Most of the contrail and emissions sensors were contained in the port and starboard underwing
pods. The exceptions were the CO2 and water vapour sensor (a Licor 840A, located in the
aircraft nose), the wing glove on the port wing, for dynamic loads measurements, and the LOF
video camera.
The aircraft inertial, airdata and data acquisition systems were contained in the aircraft nose and
cockpit. The sensors are described below (note that the locations are significant, given that the
principal methodology of NRC contrail and emissions data analysis involves contrail/plume
cross-sectional, spatiotemporal reconstruction):-
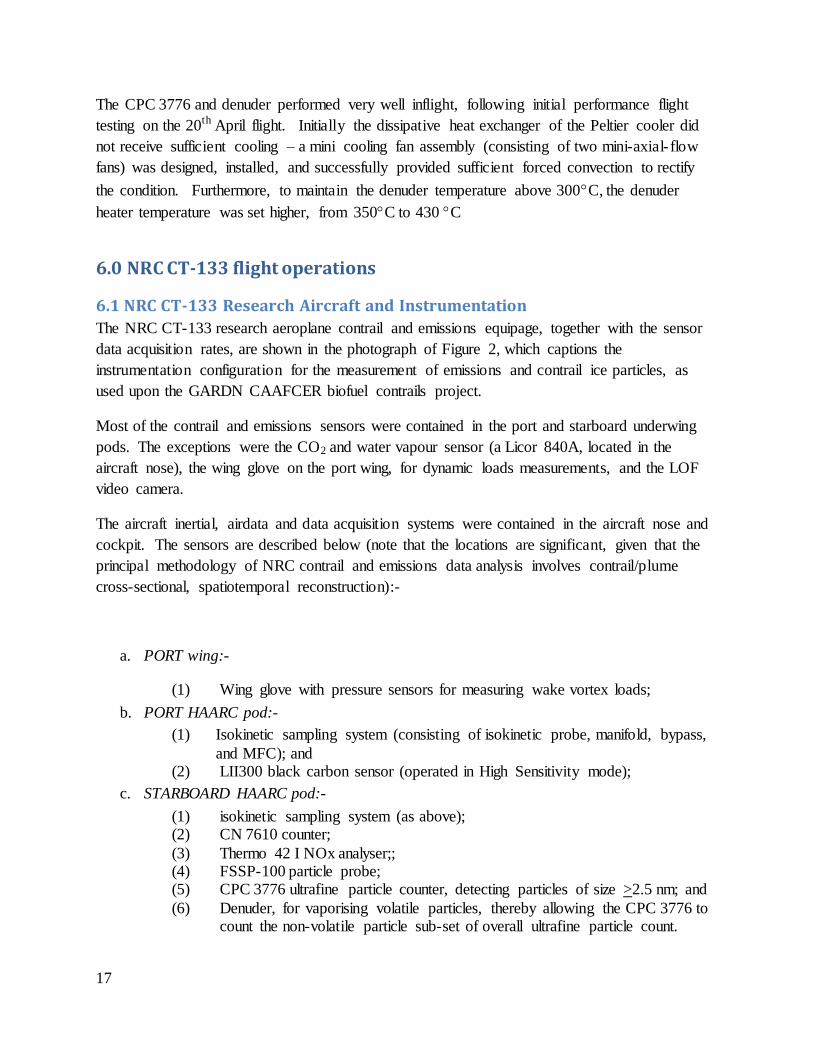
a. PORT wing:-
(1) Wing glove with pressure sensors for measuring wake vortex loads;
b. PORT HAARC pod:-
(1) Isokinetic sampling system (consisting of isokinetic probe, manifold, bypass,
and MFC); and (2) LII300 black carbon sensor (operated in High Sensitivity mode);
c. STARBOARD HAARC pod:-
(1) isokinetic sampling system (as above); (2) CN 7610 counter;
(3) Thermo 42 I NOx analyser;; (4) FSSP-100 particle probe; (5) CPC 3776 ultrafine particle counter, detecting particles of size >2.5 nm; and
(6) Denuder, for vaporising volatile particles, thereby allowing the CPC 3776 to count the non-volatile particle sub-set of overall ultrafine particle count.

18
d. AIRCRAFT NOSE:-
(1) airdata boom, sensors TAT, PS, PT ,
(2) inertial system; (3) back-up DAS;
(4) LICOR 840A, measuring CO2 and water vapour; (5) NRC ice Particle Detector Probe (PDP); (6) GPS antenna and receiver.
e. AIRCRAFT COCKPIT:-
(1) DAS; and
(2) Line-of-flight video camera.
Figure 2 – NRC CT-133 contrail and emissions measurement instrumentation, configuration of the GARDN
CAAFCER project.
Pre-operational period, the FSSP-100 contrail ice particle counting and sizing probe was
calibrated for spherical water particles – particular attention was paid to the optical set-up and
instrument calibration (to spherical water particles), such that confidence was placed in the
smallest bin sizing of 0.5μm. A density correction, water to ice, was applied to the calibration, in

19
order to correctly size the measured ice particles of the contrails. FSSP-100 data was gathered at
10 Hz.
The 42I NOx analyser measures the luminescence of the reaction between NO and ozone (the
luminescence level is proportional to concentration), the complete NOx determination firstly
requires the catalytic conversion of any NO2 to NO, a relatively long process (one reading
available each 20 seconds).
In relation to operation of the 42I: without conversion, an NOx reading would be available each
second in streaming mode – the reading would be sensitive to NO and some other nitric
compounds such as HONO, but would not be sensitive to NO2; on the other hand, in fresh
aircraft emission plumes, the majority of nitric oxide compounds is generally present as NO and
oxidises slowly, negligibly over an elapsed contrail survey time of several minutes.
On the NRC CT-133, the NOx analyser was always operated in 1 Hz streaming mode on
CAAFCER flights. To reflect data acquisition in the streaming mode, without sensitivity to the
presence of any NO2, the measured parameter is identified as NOy (rather than NOx).
6.2 CAAFCER NRC CT-133 flights The operational status of the CT-133 and sensors upon all CAAFCER flights, together with
atmospheric conditions, is presented in Table 2.
Note that although the first flight was a post-maintenance and flight functional check of systems
and sensors, it has been designated as Flight Number CAAFCER #0, insofar as it followed the
CAAFCER flight profile and surveyed a Jet A1 contrail from an ACA A320 westward-bound to
YYZ. The wing-tank fuel was not sampled. Thus, in analyzing the contrail data against fuel
properties, the average of Jet A1 fuel analyses has been used. This analysis has been conducted
elsewhere, other than this report. It compared favourably with the other CAAFCER Jet A1
contrails.

20
Table 2 – NRC CT-133 flight details summary (light blue coloured flight details denote post-maintenance and
functional flight test of the CT-133, with a Jet A1 A320 contrail surveyed).
# Date
(2017) Flight
duration
(hrs)
AC flights (from Table 1) Notes:- instrumentation & atmospheric YUL-YYZ
type
altitude
contrail length
YYZ-YUL
type
altitude
contrail length
Pre-CAAFCER flight
0 20th
April
1.5
ACA411 A320 –
YUL JetA1
FL260
6-17 Nm
Nil Used for CPC & denuder flight development, generally
satisfactory, denuder required a higher temp setting for SAE
compliance at high altitude; full FSSP data throughout this &
all flights; no LOF video taken. On ground test on 21st
April
2017, it was apparent that the CPC condenser temperature was
too warm, so that two mini-fans were installed (24th
April 2017)
to successfully provide additional cooling.
Contrail at 8 km height surveyed 10-30 km in length. FSSP
recorded 1 Hz, contrail, AEIn1013
.
CAAFCER flights
1 25th
April
2.5
ACA401
A320-211 -
biofuel
FL340
6-apprr.40 Nm
Nil (late
dispatch from
YYZ due to
ground works
program)
NOy unreliable due to limited settling time after ground power
interruptions; CN 7610, CPC 3776+denuder functional CN,
PM, nvPM; no LOF video taken..
Contrail persistent, optically thinner in the visual range,
dynamic character, AEIn1015
-1013
in jet-stream dynamics
2 28th
April
2.3
ACA401
A321 - biofuel
FL340
Sublimated by c.
4 nm
ACA402
A321 - JetA1
FL330
Contrail
remnants at 8
nm
Starboard pod pumps failed, reset (some loss of CN; loss of
NOy due to off-condition time duration).
CPC data with denuder in-bypass; LOF video;
JetA1 visible contrail limited to trailing vortices only at 15 km
length; 43%HEFA contrail visibly sublimated by 7 km;
however, non-visible ice particles were numerous, resulting in
AEIn values of the order of 108 #/kg. These non-persistent,
non-visible contrails were very useful in data analysis,
conducted elsewhere.
3 3rd
May
2.0
ACA411
A320 - biofuel
FL300
6-c.20 nm
(descent)
ACA412
B763 – JetA1
FL290
8-c.20 nm
(descent)
On climb – starboard pod pump OFF difficulties, resolved
promptly; full comparative sets of CN, NOy, CPC + denuder,
BC, CO2, water vapour data; LOF video.
4 4th
May
2.2
ACA401
A320 – biofuel
FL240 – FL280
No intercept
ACA402
A320 – JetA1
FL310
6-c.12 nm
ACA401 flight planned low altitude due to atmospheric
turbulence, eventually climbed FL280, however not in a
position to obtain contrail data; LOF video.
Full data-set for YYZ JetA1.
5 4th
May
1.8
ACA413
A320 – biofuel
FL320
6-36 nm
ACA414
A320 – JetA1
FL330
c.20-30 nm
Comparative (between Jet A1 and 43%HEFA contrails) sets of
CN, NOy, CPC + denuder, BC, CO2, H2O data; LOF video.
Contrails formed at the top of the troposphere in light
background cirrus.
6 11th
May
2.3
Nil
Background
cirrus (high
aerosol)
ACA402
A320 – JetA1
FL330-350
c.10-24 nm
YYZ Jet A1 sets of CN, NOy, CPC + denuder, BC, CO2, water
vapour data; LOF video.
Contrail formed at the top of the troposphere in background
cirrus with high aerosol content
21
7.0 A data overview and examples of CAAFCER contrail flight data
7.1 General
NRC CT-133 contrail and emissions data has been analysed in detail by the NRC and the
University of Alberta. Examples of data obtained and video images is presented here, in order to
present the atmospheric conditions encountered and the characteristics of the contrails generated
by the ACA flights.
7.2 Atmospheric influence The YYZ-YOW-YUL-YVO area of the St Lawrence Seaway valley is typically influenced by
the North American Jetstream. The NRC has conducted high altitude atmospheric research
flights in this area for wake turbulence research since 2004 (requiring contrail conditions to
delineate wake vortex position), for emissions since 2011, and for contrails, since 2014.
Furthermore, the NRC has conducted mid-altitude atmospheric research in the region for
approximately five decades, with a resultant, substantive local atmospheric knowledge. In
particular, inflight and ground observations of UTLS cloud and contrail characteristics have
enabled the NRC FRL to characterize the UTLS atmospheric nature and dynamics of the St
Lawrence Seaway. The jet-stream influence typically leads to dynamic effects involving water
phase changes, such as high ice particle growth rates during rapid deposition events, ice particle
gravity fall-out and sublimation, convective uplift and cirrocumulus development, and humidity
pooling. Along track, these effects can vary over relatively-small spatial scales of approximately
20-80 km.
High contrail ice particle growth rates have previously been measured (2014/2015) by the NRC
CT-133 in flights to the north of Ottawa[1,2]. As an example of ice particle growth rates,
compared with CT-133 measurements in NASA ACCESS II, DC-8 vortex-dominated
condensate spectra had median effective diameter (MED) values of 1-2 µm as measured by the
FSSP-100, whereas B773 spectra north of YOW had MED of 7 µm. As mentioned below,
CAAFCER flight A320, A321 and B763 contrail ice particle spectra likewise had comparatively
high MED, 5-10 µm.
7.3 Data analysis
7.3.1 General
Two methods of data anlaysis have been applied to CAAFCER contrail and emissions data:
a. Spatial re-construction, and
b. Time-trace analysis.
7.3.2 Spatial re-construction
Contrail and emissions cruise flight data for biofuel and petroleum jet fuel, has been analysed in
the spatiotemporal domain, for which the dominant spatial variable of dynamic change is in the
lateral and vertical directions, orthogonal to the contrail axis. In particular, contrail and emissions
22
plume cross-sections were re-constructed from concatenated sub-sets of nine passes across the
contrail, each occupying a duration of 2-5 seconds (overall, an elapsed time of, typically, two
minutes, at a contrail lengthening rate of 3.5 km per minute, over an air distance of 10 km per
minute). This experimental technique has been matured over four years of flight technique and
data-analysis development [1,2].
FSSP-100 data is recorded at 10 Hz, which is equivalent to a crossplane displacement increment
of 1-2.5 metres per data point. Some of the passes, in the cross-plane, overlapped. Contour plots
have been derived by Matlab delauney triangulation of data points. Therefore, spatial re-
construction is an averaging process. As such, this reduces the inaccuracy effects of
uncertainties such as contrail lateral meandering) and vertical reference (whether geo-centric or
wake vortex referenced [1,2]). Nevertheless, these uncertainties determine the process to be
stochastic. For example, there are differences in the contour plot integrations and hence the
derived contrail AEIn values whether the contrail was assessed in a geo-centric reference (when
the dynamic effects of entrainment were subsiding and detrainment onset occurring) or in a wake
vortex height frame of reference. Assessments [1,2] indicate that the error involved could be
within the range of +10% over this intermediate contrail state of subsiding entrainment-
increasing detrainment.
By this methodology, spatiotemporal re-constructions of GARDN CAAFCER contrail cross-
sections have been conducted for four biofuel (43% HEFA / JetA1 blend) contrails and six
baseline JetA1 flight data, using a total of 10 different aircraft, of three types (A320, A321 and a
B763). Analysis therefore can be based under the premise of considering contrail characteristics
variations and potential parameterisations with fuel properties and atmospheric properties, across
the range of individual engines, engine types and aircraft types.
7.3.3 Time-trace analysis
Included in the CAAFCER flightpath segment train was occasional dwell-time (occupying 15-40
seconds) in a relatively constant position in the contrail, typically near the stem-crown juncture
of the UJW, wherein it was found the ice particle count was reasonably homogenous (e.g., in the
time-slice 1360-1390 seconds of Figure 3). For contrails and emissions flight data analysis,
homogeneity is a desirable pre-requisite for time domain analysis, as it reduces variations (and
hence the standard deviation of an averaging process) over a sampling period, using sensors
operating at different bandwidths and acquisition rates. These segments thus would be amenable
to time-domain analysis of the FSSP-100, CN or CPC data, using the co-located NOy signal
(with an internal, pneumatic lag of 8 seconds) as the intermediary species for the determination
of EIn or, for contrail ice particle number, AEIn in the time domain.

23
7.4 25th April flight
7.4.1 Biofuel contrail
The contrail intercept by the CT-133 occurred from above (by the ACA flight climbing through
the CT-133 flight level, 5 Nm ahead). A time-slice example of contrail ice particle and
particulate matter data is presented in Figure 3.
Concerning CT-133 height, it is seen that the survey height, as time progressed, is biased towards
the UJW domain – this is symptomatic of tracking the presence of ice particles, and in particular
the occurrence of ice particle sublimation in the TWV region, as the vortices descend into, on
this occasion, air of lower RH and higher pressure as the vortex circulation decays.
For every persistent contrail and emissions plume measured by the NRC CT-133, the top of the
contrail and UJW have remained at the emitter aircraft altitude. The vertical traverse at time
c.1500 sec of Figure 3 illustrates this point: it is seen that the FSSP-100 activity count (roughly
proportional to the number of ice particles validly observed by the FSSP-100) diminished with
height downwards, whilst the CN and ultrafine aerosol each maintained two concentrations – one
in the UJW crown and one in the TWV remnant region, with a diminution of concentrations in
the UJW stem.
Concerning contrail ice particle density, in data snapshot terms, the metric ‘FSSP activity count’
is related proportionately, ‘Max’ relating to local thickness, ‘Mean’ and ‘Median’ (all shown in
Figure 3) relating statistically to the overall contrail, including the time spent outside the contrail,
in order to delineate the contrail dimensions and to measure local background atmospheric
parameters. It is seen in Figure 3 that the Max value is 47, occurring in the TWV region of the
fresh contrail. Maximum values in the UJW crown of the persistent contrail were in the range of
30-33.

24
Figure 3 – CAAFCER #1 data time-slice (as recorded inflight, i.e. non-time correlated for differing internal pneumatic lags between sensors):- top downwards, CT-133 height, CN 7610 >10 nano-m data, FSSP-100
activity count, CPC 3776 ultrafine aerosol data.
8.0 Contrail Video Imagery Examples of contrail imagery, viewed in the LOF direction, are presented in this section, to
illustrate examples of contrail ice particle perspectives and state-transformations encountered on
the CAAFCER flights.
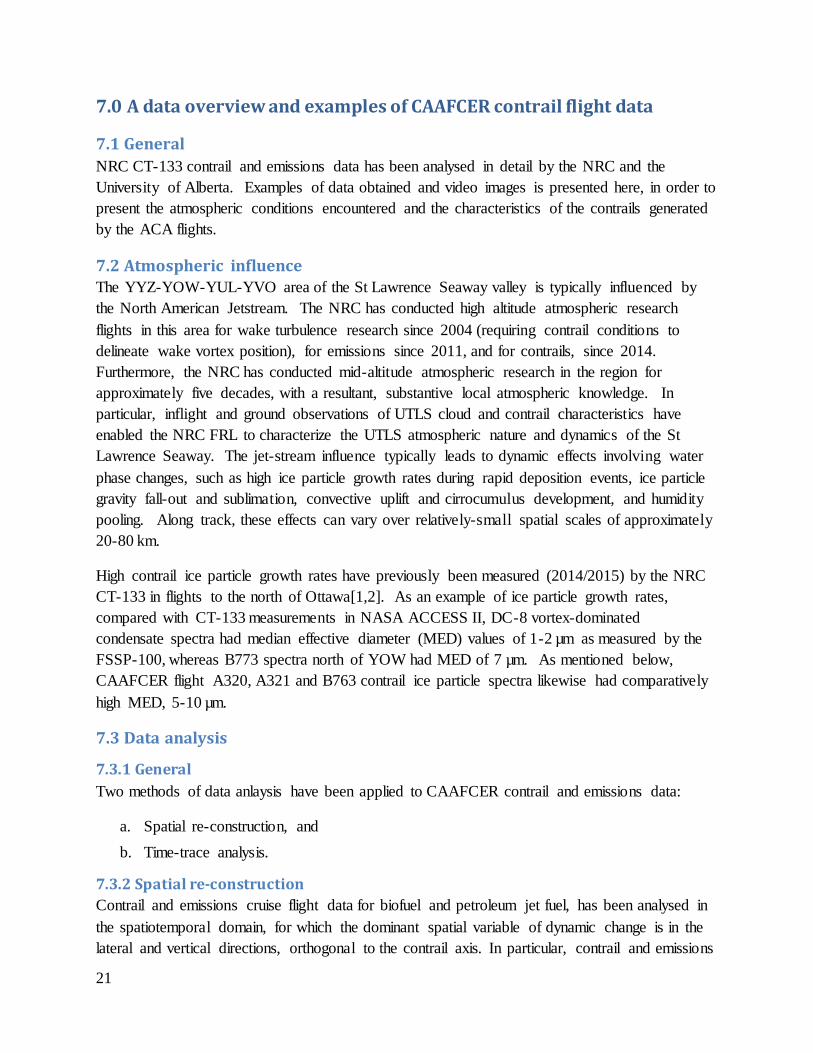
8.1 Biofuel contrail, 3rd May flight The intercept was conducted with the NCR CT-133 above the ACA flight, following which the
ACA flight climbed through the CT-133 flight level, when 9 km ahead of the CT-133 (Figure 4).
25
Figure 4(a) – 3rd
May 2017 CAFACER flight, at intercept of the ACA flight, from above (ACA flight is 9 km
ahead).
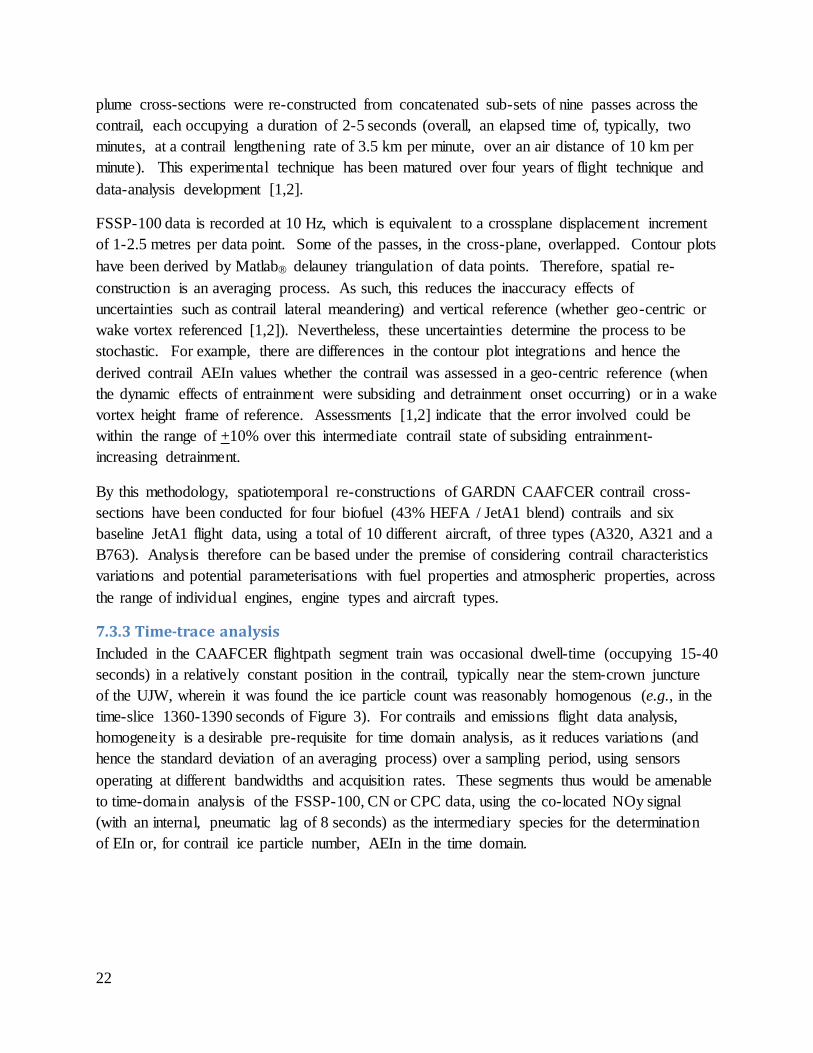
Figure 4(b) – LOF contrail appearance, from below, at approximately 19 km contrail length.

26
Figure 4(c) – contrail at approximately 30 km length: diminution of trailing vortex condensate, and
development of crown condensate in UJW (note the slanted-downwards to the left inclination of the contrail,
due to background crosswind and shear).
Figure 4(d) – contrail limited to UJW crown region, with optically thinning due to sublimating ice particles.
8.2 Jet A1 contrail, B763, 3rd May The LOF appearance of the contrail is shown in Figure 5, for a contrail length of approximately
28 km. The NRC CT-133 is below the UJW, flying in the trailing vortex region (with little
condensate in this region) at the moment of the image. The UJW appearance to the contrail
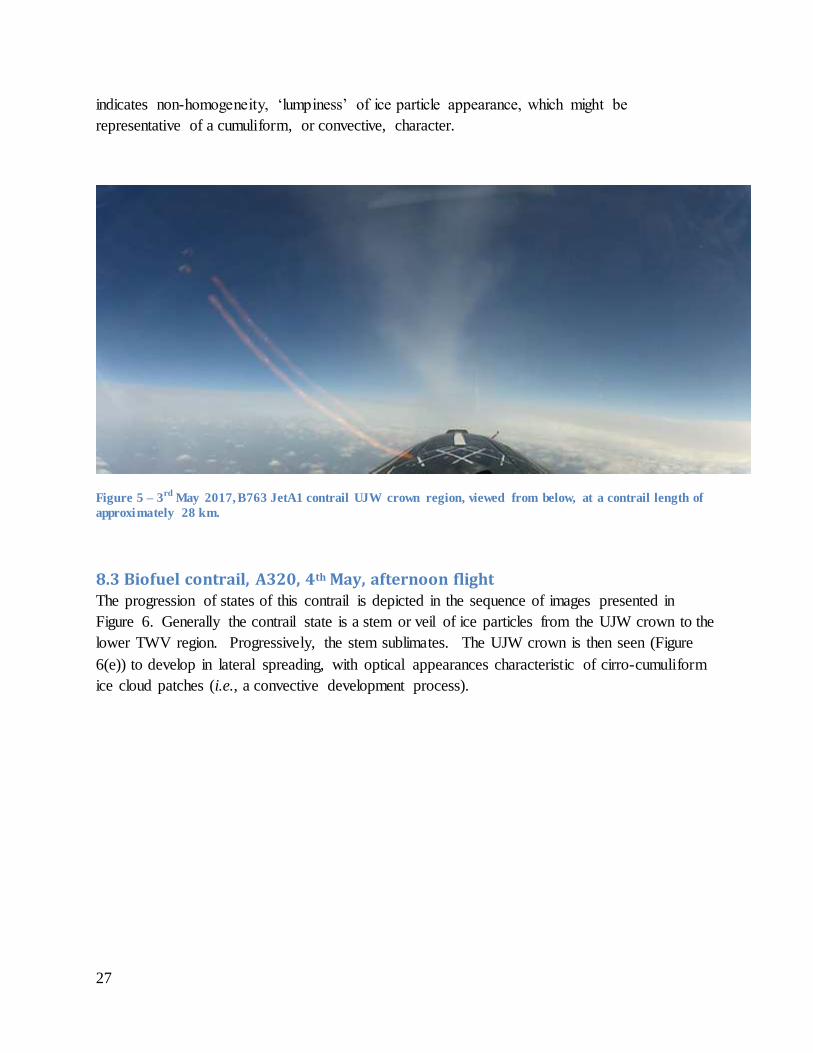
27
indicates non-homogeneity, ‘lumpiness’ of ice particle appearance, which might be
representative of a cumuliform, or convective, character.
Figure 5 – 3rd
May 2017, B763 JetA1 contrail UJW crown region, viewed from below, at a contrail length of
approximately 28 km.
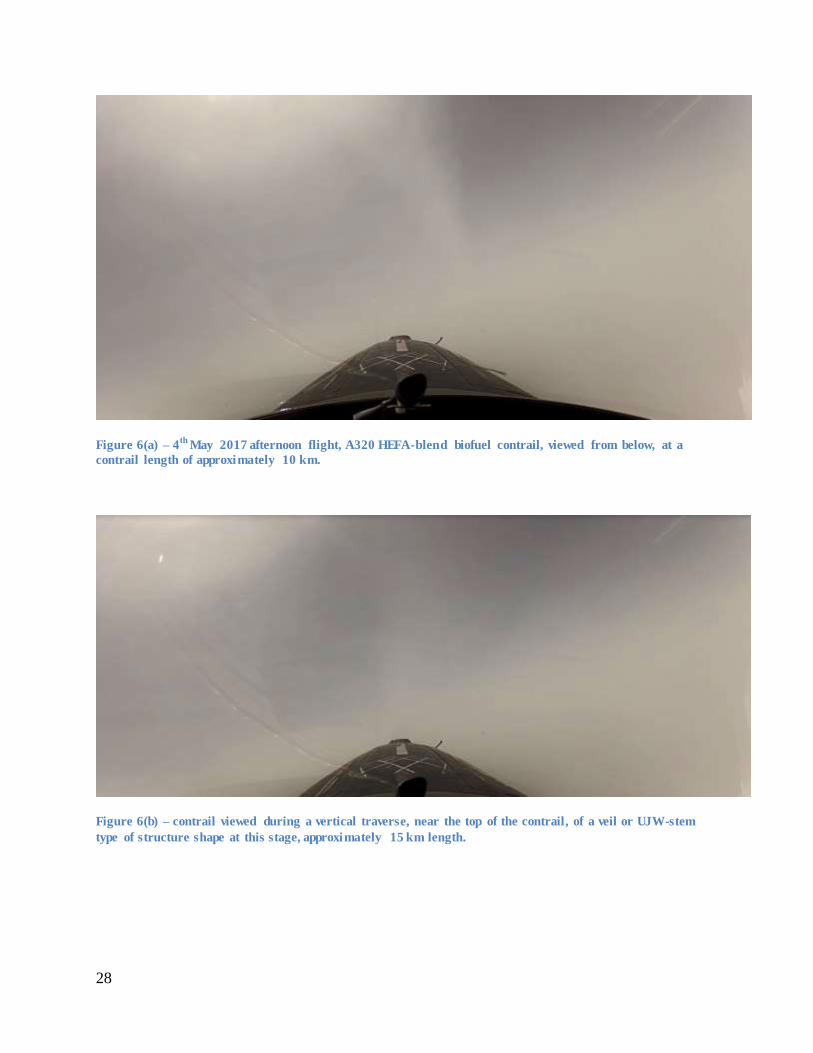
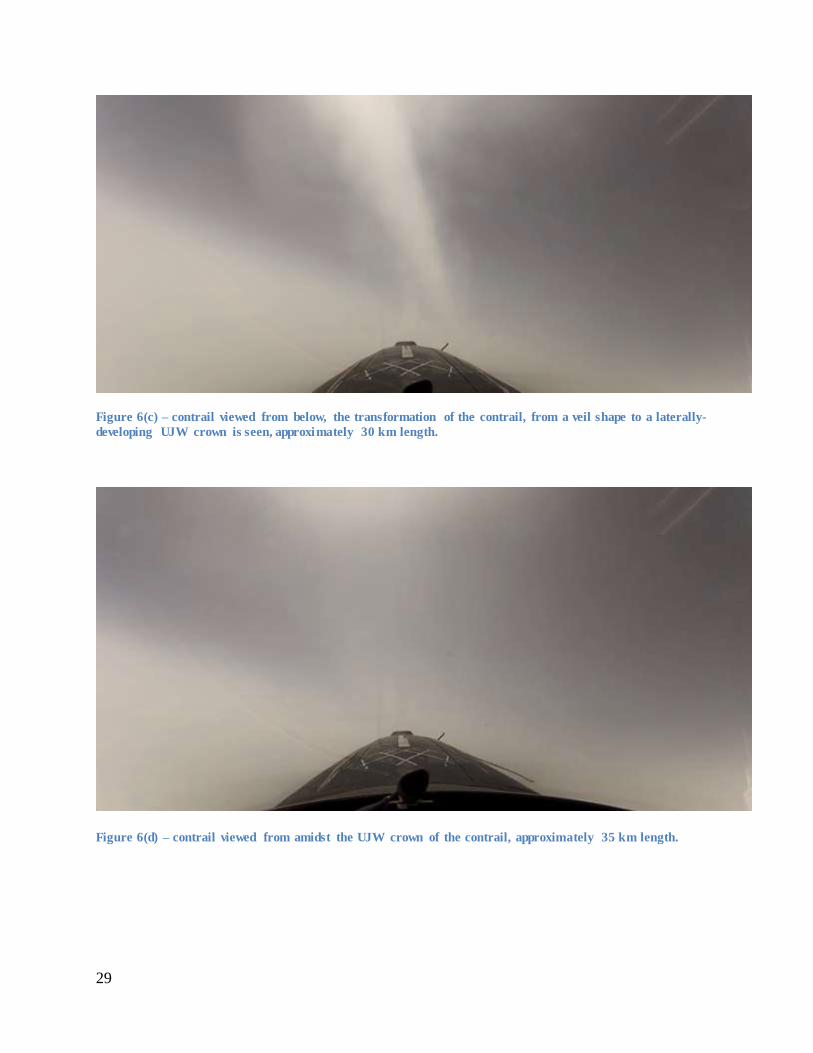
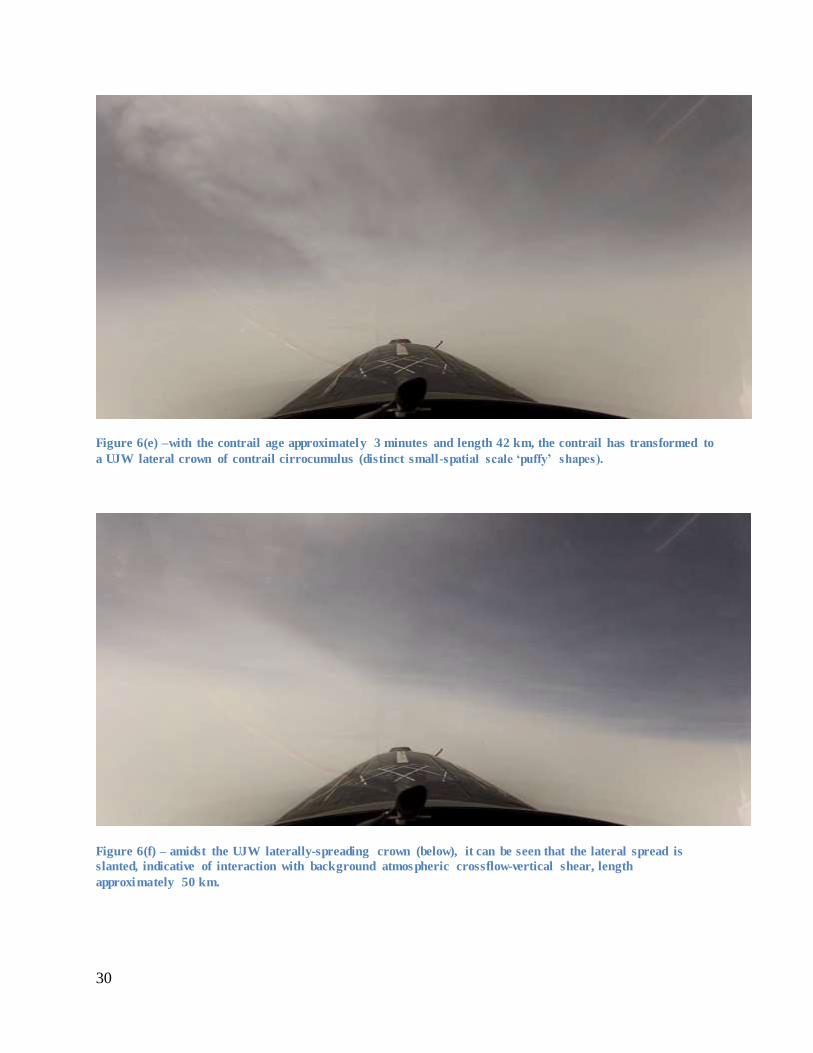
8.3 Biofuel contrail, A320, 4th May, afternoon flight The progression of states of this contrail is depicted in the sequence of images presented in
Figure 6. Generally the contrail state is a stem or veil of ice particles from the UJW crown to the
lower TWV region. Progressively, the stem sublimates. The UJW crown is then seen (Figure
6(e)) to develop in lateral spreading, with optical appearances characteristic of cirro-cumuliform
ice cloud patches (i.e., a convective development process).
28
Figure 6(a) – 4th
May 2017 afternoon flight, A320 HEFA-blend biofuel contrail, viewed from below, at a
contrail length of approximately 10 km.
Figure 6(b) – contrail viewed during a vertical traverse, near the top of the contrail, of a veil or UJW-stem
type of structure shape at this stage, approximately 15 km length.
29
Figure 6(c) – contrail viewed from below, the transformation of the contrail, from a veil shape to a laterally-
developing UJW crown is seen, approximately 30 km length.
Figure 6(d) – contrail viewed from amidst the UJW crown of the contrail, approximately 35 km length.
30
Figure 6(e) –with the contrail age approximately 3 minutes and length 42 km, the contrail has transformed to
a UJW lateral crown of contrail cirrocumulus (distinct small-spatial scale ‘puffy’ shapes).
Figure 6(f) – amidst the UJW laterally-spreading crown (below), it can be seen that the lateral spread is
slanted, indicative of interaction with background atmospheric crossflow-vertical shear, length
approximately 50 km.

31
Figure 6(g) – NRC CT-133 landing back at Ottawa, Runway 25, in a light southerly crosswind:-
8.4 Jet A1 contrail, A320, 11th May Contrail images are shown in Figure 7 for a Jet A1-fueled A320 ACA flight, measured by the
NRC CT-133 on a flight on the 11th May 2017. It is a good example of the varying states of
contrail characteristics, and the influence of varying background air-mass conditions, typical of
the St Lawrence Seaway jet-stream-dominated atmospheric conditions.
Figure 7(a) – seen from below, whilst holding near Toronto, for the ACA402 Jet A1 flight, contrail from an
overflying regional jet, 2,000 feet above the NRC CT-133 (shown on the port wing, in orange, is the wing
glove, fitted with pressure transducers to measure the unsteady wake vortex loads on the wing):-

32
Figure 7(b) – ACA402 JetA1 contrail, viewed from below, at interception (at a contrail length of
approximately 18 km); non-uniform nature of the contrail veil is evident, because of the entrainment
dynamics effect of the trailing vortices in long-wave, linking instability, typically excited by background
atmospheric turbulence (of a ‘light to moderate ‘chop’ nature).
Figure 7(c) – ACA402 JetA1 contrail, viewed from below, at a length of approximately 25 km, picture taken
with the CT-133 in the lower part of the contrail, vicinity of trailing vortices, which have induced a roll ont eh
Ct-133..
33
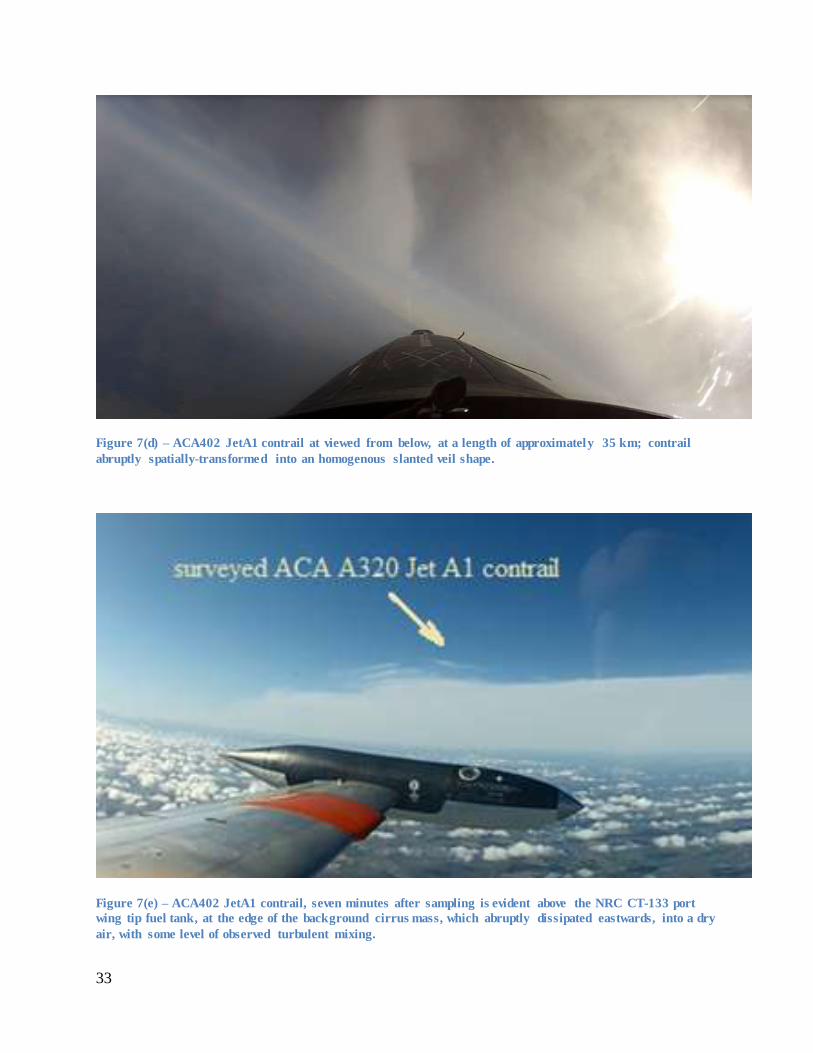
Figure 7(d) – ACA402 JetA1 contrail at viewed from below, at a length of approximately 35 km; contrail
abruptly spatially-transformed into an homogenous slanted veil shape.
Figure 7(e) – ACA402 JetA1 contrail, seven minutes after sampling is evident above the NRC CT-133 port
wing tip fuel tank, at the edge of the background cirrus mass, which abruptly dissipated eastwards, into a dry
air, with some level of observed turbulent mixing.
34
9.0 Data review and analysis
9.1 Data example, biofuel contrail, 25th April 2017
CT-133 acquired data analysis is reviewed, to illustrate the development and quantify the
measured characteristics of CAFACER contrails and emissions. For this, the data has been
analysed in the format of NRC ACCESS II contrail and emissions data [1,2].
Data quantified and presented herein is representative of the nature of spatially reconstructed
CAAFCER contrail and emissions plume data, presented for the illustrative purposes of the
present report.
9.1.1 Inertial and Air data
Inertial data was reliably acquired at 600 samples per second (i.e., 600 Hz) throughout all flights.
Likewise, air data was reliably recorded, with the exception of probable ice contamination or
blocking, which occurred on the final flight, 11th May, and which was evidenced in the
derivation of α and β. Nevertheless, re-construction of air data for this condition was
successfully conducted using inertial acceleration and velocity data.
9.1.2 Wake vortex data
At 600 Hz, the measured inertial and derived air data vectors have been differenced, then
spatially-correlated (using inertial position information, transformed to the wake vortex axis
system, concurrent with mean direction-of-flight), to provide trailing vortex data for port and
starboard vortices, from which wake vortex characteristics have been usefully derived.
Trailing vortex cores were relatively large in diameter (1 to 4 metres diameter, which varied in
vortex vented, funnel-shaped short-wave instability modes3). Lateral separation between
vortices was relatively small, typically 20 m, centre-to-centre. The separation varied with long-
wave instability excitation, as typical of wake vortex states. At 56% of wingspan, this vortex
separation was significantly less than that for an elliptically-loaded wing (/4, or 79% of
wingspan).
Lateral proximity of the vortices to each other would tend to suggest that geometric wingspan
would not be a scaling parameter for vortex size nor diameter. It would also be expected to
result in greater short and long wave instability modes, and result in greater generated vortex
circulation. Generated circulation, =W/(Vbv), was typically (for ACA A320 flights on
CAAFCER) 250 m2/s (which agreed with the circulation derived from the open path integral of
the approach segment of the CT-133 flight-path [4], Figure 8 refers).

35
Figure 8 – open path line integral, deriving vortex circulation, for a typical CAAFCER contrail survey flight-
path.
Figure 9(a) shows 3-velocity components to the vortices. Most unusual is the dominance of axial
velocity peaks (in green, peak magnitudes 9-17 m/s; tangential velocity component, 5-7 m/s).
Possibly this could be attributable to the relative proximity of vortices to each other, in driving
helical vorticity associated with elliptical modes. Figure 9(b) presents the vertical wind
component, highlighting the relatively large-scale of the vortices cross-section, and relatively
small distance between them (approximately 10 metres in this re-construction). The relatively
small ratio of separation to core radius could be the mechanism providing stimulation of
particular mutual instability modes which might drive the axial velocity observations.
The circumferentially non-uniform distribution of velocity peaks is considered to be associated
with such elliptical modes of instability. Characteristics of axial variation of vortex core state
include venting, funneling contractions of vortex cores, and circumferential discretization of
vorticity into ‘strings of pearl’ vortices [3].
100 200 300 400 500 600 700 800 900
-600
-400
-200
0
200
400
t (sec)
(
m2s
-1)
Crossplane open path integral, wCZ
sds, A320

36
Figure 9(a) –trailing vortex pair core passages at 11 km wake length, plotted against crossplane projection of
the CT-133 flight-path (this data was used for the open path integral of Figure 8)..
Figure 9(b) – re-constructed cross-plane of vortex-induced velocity magnitude (m/s), delineating a view of
trailing vortex pair (of Figure 9(a)), observed in the signature of induced vertical wind: showing the
relatively large-scale of the vortices and relatively short distance between vortex cores, approximately 10-15
metres.
345 350 355 360 365 370 375
-10
-5
0
5
10
15
dsa-sum, crossplane arc distance
wc
w
a
w
Z
wc
wa
wZ
37
9.1.3 Dynamic phase, contrail length 10-17 km
9.1.3.1 CN 7610 aerosol counter data
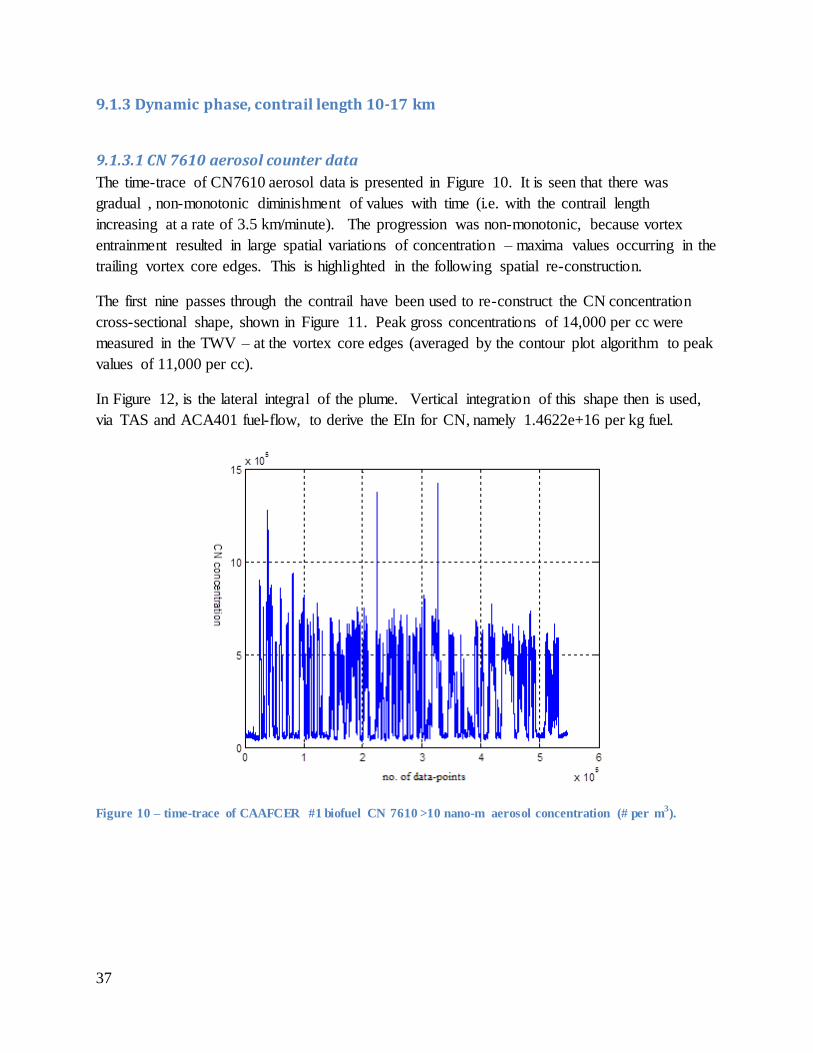
The time-trace of CN7610 aerosol data is presented in Figure 10. It is seen that there was
gradual , non-monotonic diminishment of values with time (i.e. with the contrail length
increasing at a rate of 3.5 km/minute). The progression was non-monotonic, because vortex
entrainment resulted in large spatial variations of concentration – maxima values occurring in the
trailing vortex core edges. This is highlighted in the following spatial re-construction.
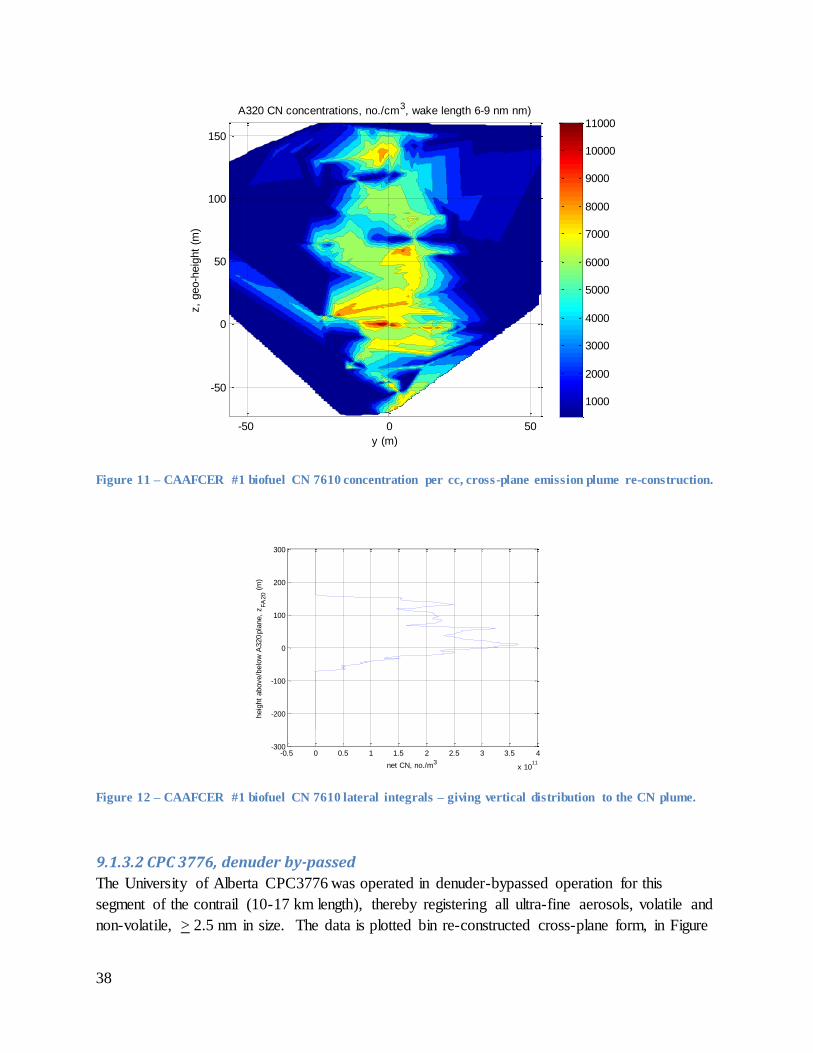
The first nine passes through the contrail have been used to re-construct the CN concentration
cross-sectional shape, shown in Figure 11. Peak gross concentrations of 14,000 per cc were
measured in the TWV – at the vortex core edges (averaged by the contour plot algorithm to peak
values of 11,000 per cc).
In Figure 12, is the lateral integral of the plume. Vertical integration of this shape then is used,
via TAS and ACA401 fuel-flow, to derive the EIn for CN, namely 1.4622e+16 per kg fuel.
Figure 10 – time-trace of CAAFCER #1 biofuel CN 7610 >10 nano-m aerosol concentration (# per m3).
38
Figure 11 – CAAFCER #1 biofuel CN 7610 concentration per cc, cross-plane emission plume re-construction.
Figure 12 – CAAFCER #1 biofuel CN 7610 lateral integrals – giving vertical distribution to the CN plume.
9.1.3.2 CPC 3776, denuder by-passed
The University of Alberta CPC3776 was operated in denuder-bypassed operation for this
segment of the contrail (10-17 km length), thereby registering all ultra-fine aerosols, volatile and
non-volatile, > 2.5 nm in size. The data is plotted bin re-constructed cross-plane form, in Figure
y (m)
z,
geo-h
eig
ht
(m)
A320 CN concentrations, no./cm3, wake length 6-9 nm nm)
-50 0 50
-50
0
50
100
150
1000
2000
3000
4000
5000
6000
7000
8000
9000
10000
11000
-0.5 0 0.5 1 1.5 2 2.5 3 3.5 4
x 1011
-300
-200
-100
0
100
200
300
net CN, no./m3
heig
ht
above/b
elo
w A
320 p
lane,
zFA
20 (
m)
39
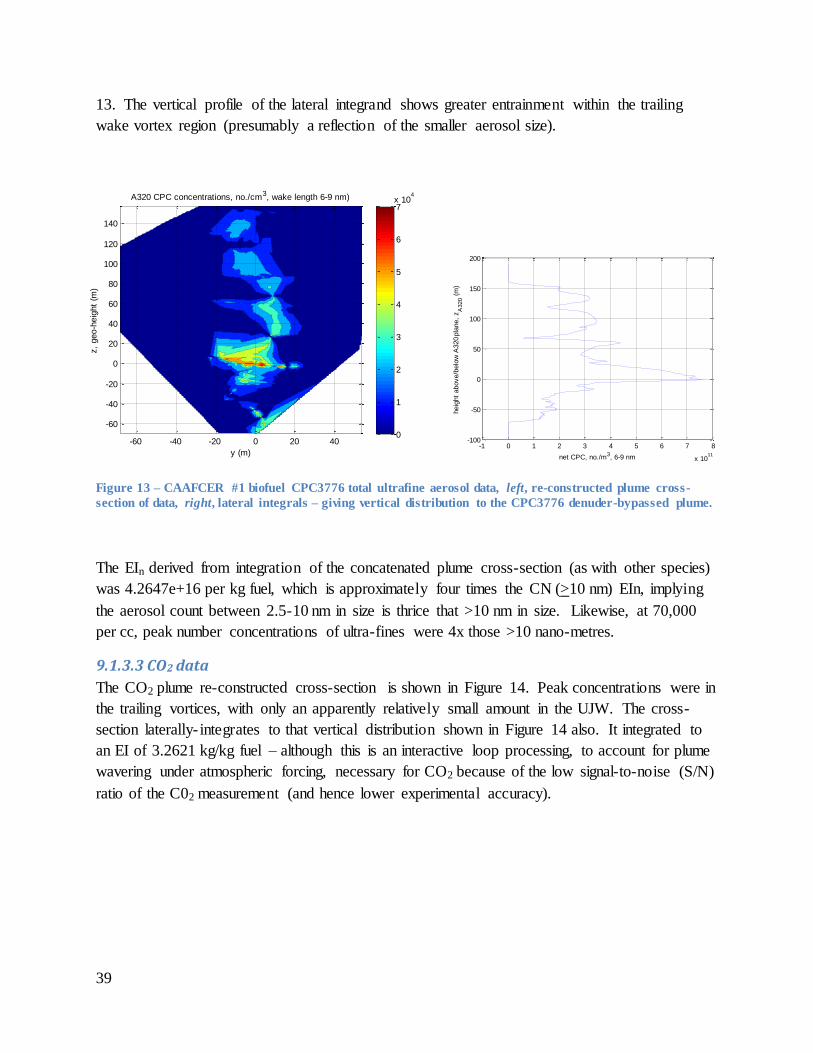
13. The vertical profile of the lateral integrand shows greater entrainment within the trailing
wake vortex region (presumably a reflection of the smaller aerosol size).
Figure 13 – CAAFCER #1 biofuel CPC3776 total ultrafine aerosol data, left, re-constructed plume cross-
section of data, right, lateral integrals – giving vertical distribution to the CPC3776 denuder-bypassed plume.
The EIn derived from integration of the concatenated plume cross-section (as with other species)
was 4.2647e+16 per kg fuel, which is approximately four times the CN (>10 nm) EIn, implying
the aerosol count between 2.5-10 nm in size is thrice that >10 nm in size. Likewise, at 70,000
per cc, peak number concentrations of ultra-fines were 4x those >10 nano-metres.
9.1.3.3 CO2 data
The CO2 plume re-constructed cross-section is shown in Figure 14. Peak concentrations were in
the trailing vortices, with only an apparently relatively small amount in the UJW. The cross-
section laterally- integrates to that vertical distribution shown in Figure 14 also. It integrated to
an EI of 3.2621 kg/kg fuel – although this is an interactive loop processing, to account for plume
wavering under atmospheric forcing, necessary for CO2 because of the low signal-to-noise (S/N)
ratio of the C02 measurement (and hence lower experimental accuracy).
y (m)
z,
geo-h
eig
ht
(m)
A320 CPC concentrations, no./cm3, wake length 6-9 nm)
-60 -40 -20 0 20 40
-60
-40
-20
0
20
40
60
80
100
120
140
0
1
2
3
4
5
6
7x 10
4
-1 0 1 2 3 4 5 6 7 8
x 1011
-100
-50
0
50
100
150
200
net CPC, no./m3, 6-9 nmheig
ht
above/b
elo
w A
320 p
lane,
zA
320 (
m)

40
Figure 14 – CAAFCER #1 biofuel CO2 cross-sectional plume (left), cross-sectional plume lateral integrand,
showing vertical profile (right).
9.1.3.4 Black carbon (BC) data
The BC plume re-constructed cross-sectional profile is shown in Figure 15, for 10-17 km contrail
length contrail. Compared to the CN and CPC plumes, the re-constructed BC profile lacks some
correlation, likely related to low-concentration levels of BC, and including optical turbulence
effects in the sensor optical cell. Integration of the profile yielded an EI of 212+50 mg/kg, with
an uncertainty that relates to the minimum concentration sensitivity of the sensor.
y (m)
z (
m)
A320 CO2 concentrations, ppb, wake length 6-9 nm
-60 -40 -20 0 20 40
-60
-40
-20
0
20
40
60
80
100
120
140
366
368
370
372
374
376
378
-2 0 2 4 6 8 10 12 14 16 18
x 10-5
-300
-200
-100
0
100
200
300
CO2, m3
heig
ht
above/b
elo
w A
320 p
lane,
zFA
20 (
m)
CO2 ppm Grand total minus CO
2,ppb Background
y (m)
z,
geo-h
eig
ht
(m)
A320 BC concentration, mg/m3, wake length 6-9 nm)
-80 -60 -40 -20 0 20 40 60
-50
0
50
100
150
0.5
1
1.5
2
2.5
x 10-3
0 0.005 0.01 0.015 0.02 0.025 0.03 0.035 0.04-100
-50
0
50
100
150
200
BC, mg/m3
heig
ht
above/b
elo
w A
320 p
lane,
zA
320 (
m)

41
Figure 15 – CAAFCER #1 biofuel BC: Left: BC cross-sectional plume (left), cross-sectional plume lateral
integrand, showing vertical profile (right); Right (blue relates to data for the complete contrail survey; red
relates to the data sub-set which is only used for the 10-17 km contrail length): lateral distribution of BC
readings (left), vertical distribution (right).
9.1.3.5 Contrail ice particle data, 6-9 nm
The FSSP-100 contrail ice particle (>0.5µm size) number (#) density is shown in Figure 16, and
the lateral integrand in Figure 16 likewise, which integrated to an AEIn of 1.3244e+14 #/kg fuel
from ACA401, at this location & length of contrail. Ice aprticle number densities were of the
order of 200 #/cc. The contrail ice distribution was predominantly vertically-oriented. The
shape could be described as an amorphous, ‘lumpy’ veil, with no lateral crown developed at this
stage, a one minute old contrail.
However the TWV region had smaller ice particles than the UJW (and eventually, the TWV ice
particles ceased growing and sublimated). Typical spectra are shown in Figure 17.
The spectra can be integrated to derive the median effective diameter of the ice particles (MED),
the distribution of which is shown in Figure 18 – it is seen that the smaller particles occurred in
the TWV region (and were sized 1-2 µm MED), larger occurred in the UJW, with a progressive
vertical distribution in MED. With increasing contrail length – there is a general growth in
average MED (Figure 18) and in the difference between MAX and MIN MED values, over the
cross-section of the contrail.

42
Figure 16 – CAAFCER #1 biofuel contrail cross-sectional shape (left) and lateral integrand (right), showing
vertical distribution.
Figure 17 – CAAFCER #1 biofuel contrail ice particle spectra, left, TWV, right, UJW stem.
y (m)
z (
m)
A320 FSSP concentrations, no./cm3, wake length 6-9 nm)
-30 -20 -10 0 10 20 30
-50
0
50
100
150
0
20
40
60
80
100
120
140
160
0 2 4 6 8 10 12 14 16 18
x 108
-100
-50
0
50
100
150
200
FSSP, no./m3
heig
ht
above/b
elo
w A
320 p
lane,
zA
320 (
m)
0 1 2 3 4 5 6 7 8 90
5
10
15
20
25
30
35
size (m)
#/c
c
0 1 2 3 4 5 6 7 8 90
5
10
15
20
25
size (m)
#/c
c

43
Figure 18 – CAAFCER #1 biofuel contrail ice particle MED left, spatial distribution, right, as a function of
contrail length.
The ice particle spectra can be integrated into an ice mass concentration, the cross-sectional
distribution of which is shown in Figure 19. With the larger particle size in the UJW, the ice
mass fraction of the whole, contained in the UJW, is greater. At this length, 10-17 km, the
contrail had an ice-mass (for =1,000 kg/m3, likely an over-estimate due to air bubble
entrapment in the ice nucleation process) AEIm of 9.1494e+08 µg/kg fuel.
Figure 19 – CAAFCER #1 biofuel contrail ice mass left, spatial distribution, right vertical profile.
y (m)
z (
m)
A320 FSSP Median Vol. Diameter, wake length 6-9 nm)
-80 -60 -40 -20 0 20 40 60
-50
0
50
100
150
1
1.5
2
2.5
3
3.5
4
4.5
5x 10
-6
5 10 15 20 25 30 350
1
2
3
4
5
6
7
8x 10
-6
length of wake (m)
ME
D (
m)
y (m)
z (
m)
A320 FSSP ICE MASS, g/m3, wake length 6-9 nm)
-60 -40 -20 0 20 40
-50
0
50
100
150
0
100
200
300
400
500
600
700
800
900
0 0.5 1 1.5 2 2.5 3
x 104
-300
-200
-100
0
100
200
300
ICE, cumulative g/m2
heig
ht
above/b
elo
w A
320 p
lane,
zFA
20 (
m)

44
9.1.3.6 Water vapour, Licor 840A
The water vapour RH and RH over ice, RHi, data obtained from the Licor 840A in the CT-133, is
presented in Figure 20, in re-constructed cross-sectional distribution. At the TWV region (z=0),
the RH is irregular, with depletion-region shape definition that appears to be that of the trailing
vortex pair. In the UJW, super-saturation to 120% is evident, and is laterally-spread, a precursor
to the eventual lateral spread of the contrail UJW crown.
Figure 20 – CAAFCER #1 biofuel contrail measured cross -section of RH and RHICE.
9.1.4 Biofuel contrail, 25th April 2017, 18-26 km length
9.1.4.1 CN 7610 aerosol data
For the same contrail, but at a longer length (older age and different relative-atmospheric
location, approximately 35 km air-track distance further to the west), the CN7610 data re-
constructed plume and contrail cross-section are presented in Figure 21. Compared to the same
contrail at 10-17 km length, perhaps there is slightly greater lateral extent of the particle plume, a
lessening effect of the TWV and a growing detrainment effect (greatest lateral integration was no
longer in the TWV, but occurred at mid-height of the plume).
y (m)
z (
m)
A320 RHw
, wake length 6-9 nm)
-80 -60 -40 -20 0 20 40 60
-50
0
50
100
150
30
35
40
45
50
55
60
65
70
75
y (m)
z (
m)
A320 RHi, wake length 6-9 nm)
-80 -60 -40 -20 0 20 40 60
-50
0
50
100
150
50
60
70
80
90
100
110
120

45
Figure 21 – CAAFCER #1 biofuel contrail measured cross -section of aerosol, CN.
9.1.4.2 CN 7610 & denuded CPC3776 data
Presented in Figure 22 are the contrail cross-section reconstructions for CN (>10 nm) and non-
volatile ultrafine particles, nvPM, (>2.5 nm), The vertical distribution of accumulations is
shown in Figure 23. nvPM particles could be expected to have been principally soot, BC.
Figure 22 – CAAFCER #1, 18-27 km contrail cross-sections of PM concentrations (#/cc), biofuel nvPM CPC3776 >2.5 nm (left) and CN 7610 >10 nm CN (right).
It is seen that nvPM concentrations were approximately 15% of CN concentrations. As
described earlier, CPC3776 counts, with denuder bypassed, were 4x CN counts, if similarity is
y (m)
z,
geo-h
eig
ht
(m)
A320 CN concentrations, no./cm3, wake length 10-14 nm)
-80 -60 -40 -20 0 20 40 60 80-100
-50
0
50
100
150
1000
2000
3000
4000
5000
6000
7000
8000
-2 0 2 4 6 8 10 12 14 16 18
x 1010
-100
-50
0
50
100
150
200
net CN, no./m3
heig
ht
above/b
elo
w A
320 p
lane,
zA
320 (
m)
46
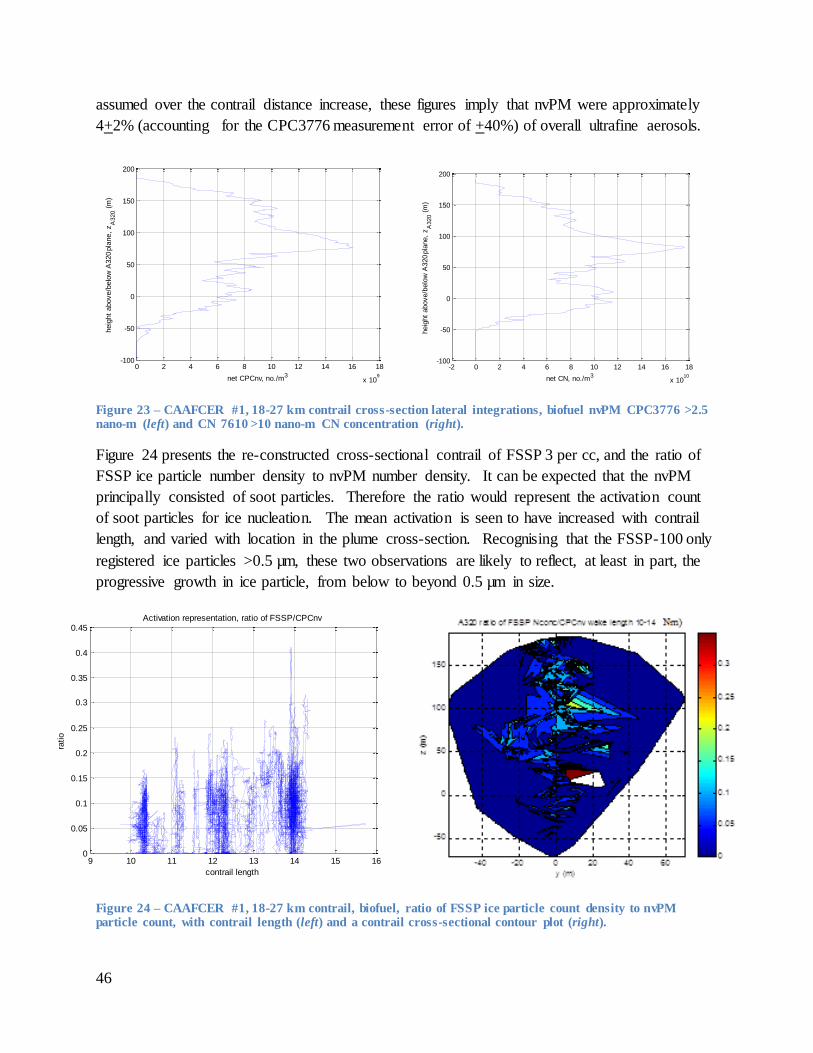
assumed over the contrail distance increase, these figures imply that nvPM were approximately
4+2% (accounting for the CPC3776 measurement error of +40%) of overall ultrafine aerosols.
Figure 23 – CAAFCER #1, 18-27 km contrail cross-section lateral integrations, biofuel nvPM CPC3776 >2.5 nano-m (left) and CN 7610 >10 nano-m CN concentration (right).
Figure 24 presents the re-constructed cross-sectional contrail of FSSP 3 per cc, and the ratio of
FSSP ice particle number density to nvPM number density. It can be expected that the nvPM
principally consisted of soot particles. Therefore the ratio would represent the activation count
of soot particles for ice nucleation. The mean activation is seen to have increased with contrail
length, and varied with location in the plume cross-section. Recognising that the FSSP-100 only
registered ice particles >0.5 µm, these two observations are likely to reflect, at least in part, the
progressive growth in ice particle, from below to beyond 0.5 µm in size.
Figure 24 – CAAFCER #1, 18-27 km contrail, biofuel, ratio of FSSP ice particle count density to nvPM particle count, with contrail length (left) and a contrail cross-sectional contour plot (right).
0 2 4 6 8 10 12 14 16 18
x 109
-100
-50
0
50
100
150
200
net CPCnv, no./m3
heig
ht
above/b
elo
w A
320 p
lane,
zA
320 (
m)
-2 0 2 4 6 8 10 12 14 16 18
x 1010
-100
-50
0
50
100
150
200
net CN, no./m3
heig
ht
above/b
elo
w A
320 p
lane,
zA
320 (
m)
9 10 11 12 13 14 15 160
0.05
0.1
0.15
0.2
0.25
0.3
0.35
0.4
0.45
ratio
contrail length
Activation representation, ratio of FSSP/CPCnv

47
9.1.4.3 CO2, cross-section
The CO2 plume is shown in Figure 25, for this segment of the contrail length. The bulk of the
CO2 is observed to reside in the lower half of the cross-section.
Figure 25 – CAAFCER #1, 18-27 km contrail cross-section and lateral integration, CO2 plume.
9.1.4.4 BC, cross-section
The BC re-constructed plume cross-section for this contrail segment is presented in Figure 26.
Figure 26 – CAAFCER #1, 18-27 km contrail cross-section and lateral integration, BC plume.
y (m)
z (
m)
A320 CO2 concentrations, ppb, wake length 10-14 nm
-60 -40 -20 0 20 40 60
-50
0
50
100
150
363
364
365
366
367
368
369
370
371
372
373
374
-4 -2 0 2 4 6 8
x 10-5
-100
-50
0
50
100
150
200
CO2, m3
heig
ht
above/b
elo
w A
320 p
lane,
zA
320 (
m)
CO2 ppm Grand total minus CO
2,ppb Background
0 0.002 0.004 0.006 0.008 0.01 0.012 0.014 0.016 0.018 0.02-100
-50
0
50
100
150
200
BC, mg/m3
heig
ht
above/b
elo
w A
320 p
lane,
zA
320 (
m)
48
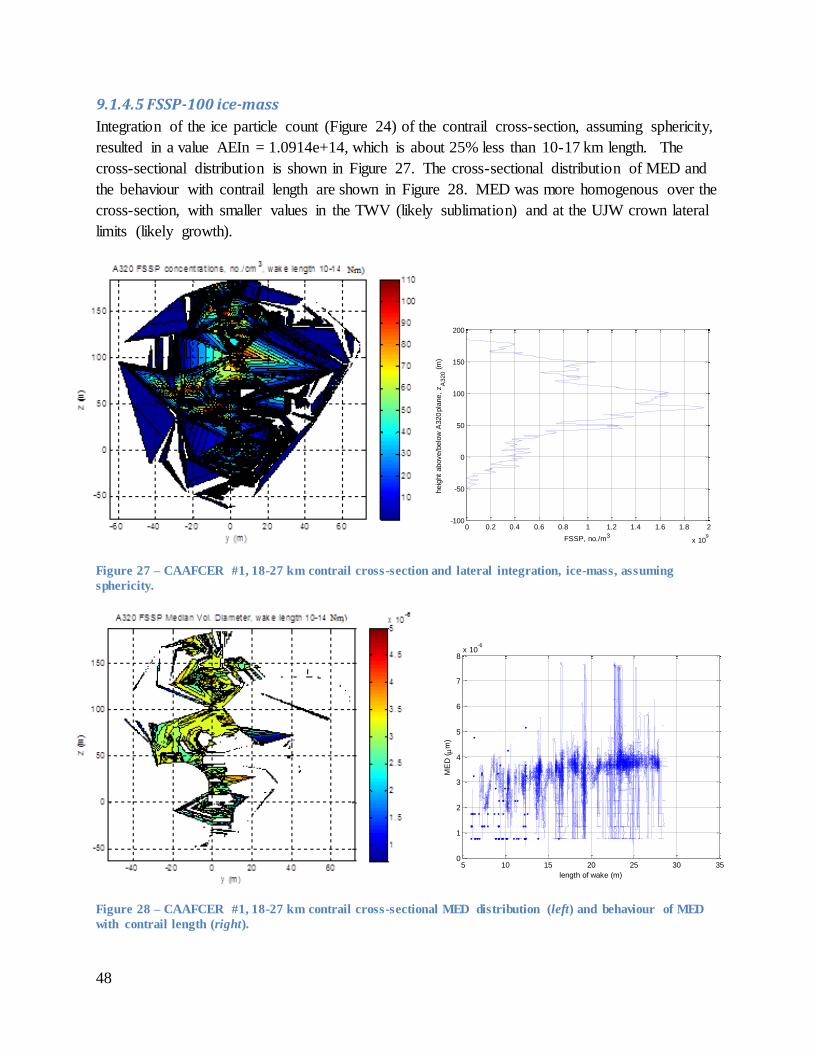
9.1.4.5 FSSP-100 ice-mass
Integration of the ice particle count (Figure 24) of the contrail cross-section, assuming sphericity,
resulted in a value AEIn = 1.0914e+14, which is about 25% less than 10-17 km length. The
cross-sectional distribution is shown in Figure 27. The cross-sectional distribution of MED and
the behaviour with contrail length are shown in Figure 28. MED was more homogenous over the
cross-section, with smaller values in the TWV (likely sublimation) and at the UJW crown lateral
limits (likely growth).
Figure 27 – CAAFCER #1, 18-27 km contrail cross-section and lateral integration, ice-mass, assuming
sphericity.
Figure 28 – CAAFCER #1, 18-27 km contrail cross-sectional MED distribution (left) and behaviour of MED
with contrail length (right).
0 0.2 0.4 0.6 0.8 1 1.2 1.4 1.6 1.8 2
x 109
-100
-50
0
50
100
150
200
FSSP, no./m3
heig
ht
above/b
elo
w A
320 p
lane,
zA
320 (
m)
5 10 15 20 25 30 350
1
2
3
4
5
6
7
8x 10
-6
length of wake (m)
ME
D (
m)
49
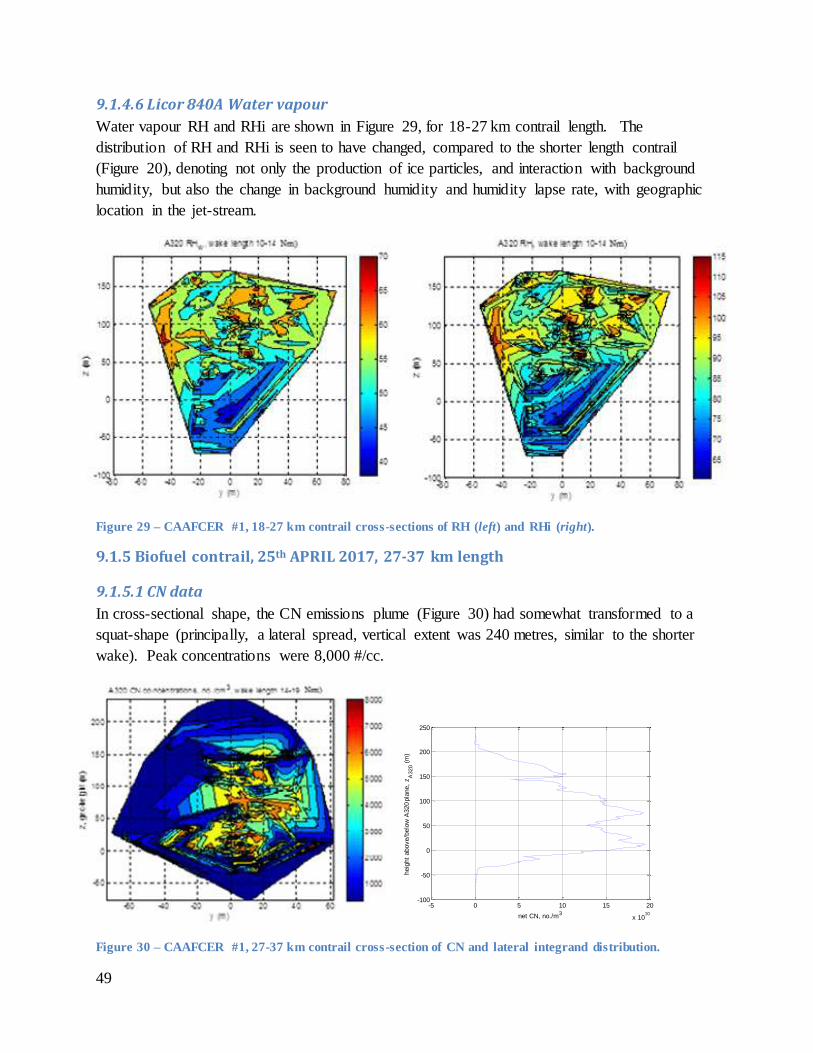
9.1.4.6 Licor 840A Water vapour
Water vapour RH and RHi are shown in Figure 29, for 18-27 km contrail length. The
distribution of RH and RHi is seen to have changed, compared to the shorter length contrail
(Figure 20), denoting not only the production of ice particles, and interaction with background
humidity, but also the change in background humidity and humidity lapse rate, with geographic
location in the jet-stream.
Figure 29 – CAAFCER #1, 18-27 km contrail cross-sections of RH (left) and RHi (right).
9.1.5 Biofuel contrail, 25th APRIL 2017, 27-37 km length
9.1.5.1 CN data
In cross-sectional shape, the CN emissions plume (Figure 30) had somewhat transformed to a
squat-shape (principally, a lateral spread, vertical extent was 240 metres, similar to the shorter
wake). Peak concentrations were 8,000 #/cc.
Figure 30 – CAAFCER #1, 27-37 km contrail cross-section of CN and lateral integrand distribution.
-5 0 5 10 15 20
x 1010
-100
-50
0
50
100
150
200
250
net CN, no./m3
heig
ht
above/b
elo
w A
320 p
lane,
zA
320 (
m)

50
9.1.5.2 CPC3776 PM data, i.e. denuder bypassed
The cross-sectional profile, Figure 31, of ultrafine aerosol PM (i.e., total, volatile and non-
volatile) was similar to that of CN, and peak concentrations were ~30,000 #/cc, once again
roughly 4 x that of CN, implying ~3 x CN were particles between 2.5 and 10 nano-m in size.
Figure 31(a) – CAAFCER #1, 27-37 km contrail cross-section of CPC3776 PM and lateral integrand
distribution.
9.1.5.3 CO2 data
CO2 dilution was evidenced at the greater contrail length. Elevated CO2 concentrations (to peak
values of 374 ppb, against the background of 364 ppb) were more prevalent in the lower-half of
the wake (refer to Figure 31(b)), compared to CN and ultrafine PM. Licor 840A repeatability
was specified at +2% - the elevated concentrations were therefore at the limit of the sensor
accuracy.
-1 0 1 2 3 4 5
x 1011
-100
-50
0
50
100
150
200
250
net CPC, no./m3
heig
ht
above/b
elo
w A
320 p
lane,
zA
320 (
m)
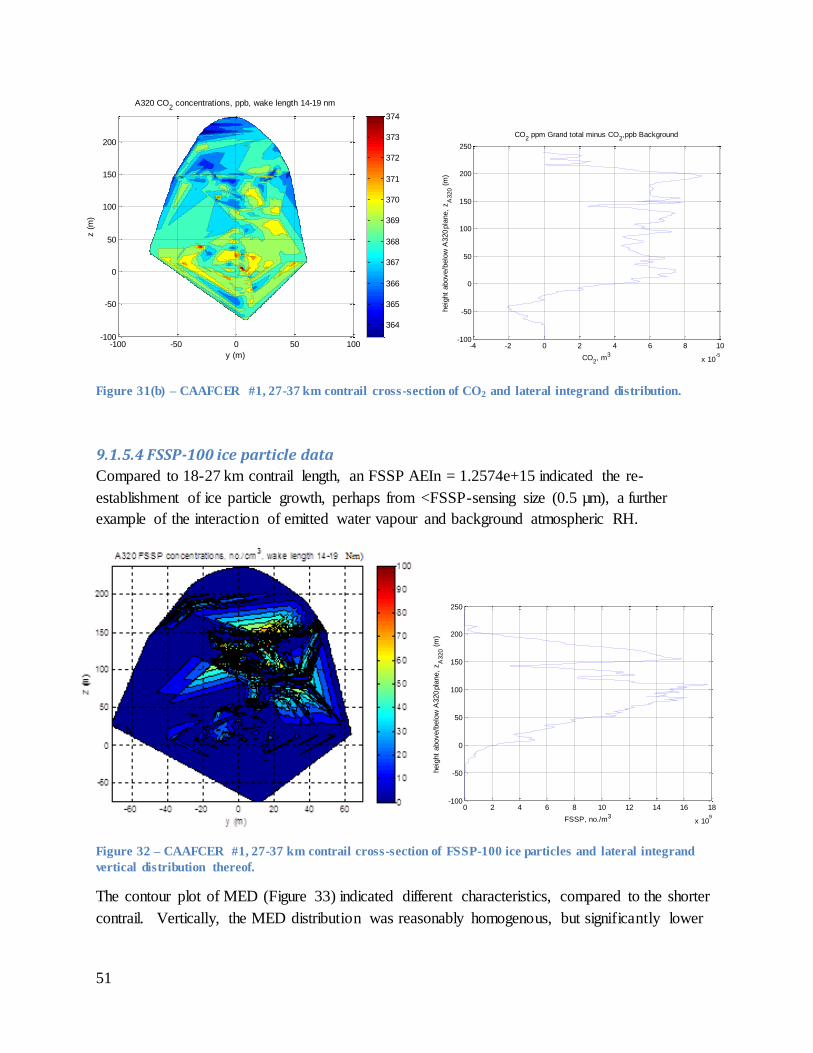
51
Figure 31(b) – CAAFCER #1, 27-37 km contrail cross-section of CO2 and lateral integrand distribution.
9.1.5.4 FSSP-100 ice particle data
Compared to 18-27 km contrail length, an FSSP AEIn = 1.2574e+15 indicated the re-
establishment of ice particle growth, perhaps from <FSSP-sensing size (0.5 µm), a further
example of the interaction of emitted water vapour and background atmospheric RH.
Figure 32 – CAAFCER #1, 27-37 km contrail cross-section of FSSP-100 ice particles and lateral integrand
vertical distribution thereof.
The contour plot of MED (Figure 33) indicated different characteristics, compared to the shorter
contrail. Vertically, the MED distribution was reasonably homogenous, but significantly lower
y (m)
z (
m)
A320 CO2 concentrations, ppb, wake length 14-19 nm
-100 -50 0 50 100-100
-50
0
50
100
150
200
364
365
366
367
368
369
370
371
372
373
374
-4 -2 0 2 4 6 8 10
x 10-5
-100
-50
0
50
100
150
200
250
CO2, m3
heig
ht
above/b
elo
w A
320 p
lane,
zA
320 (
m)
CO2 ppm Grand total minus CO
2,ppb Background
0 2 4 6 8 10 12 14 16 18
x 109
-100
-50
0
50
100
150
200
250
FSSP, no./m3
heig
ht
above/b
elo
w A
320 p
lane,
zA
320 (
m)
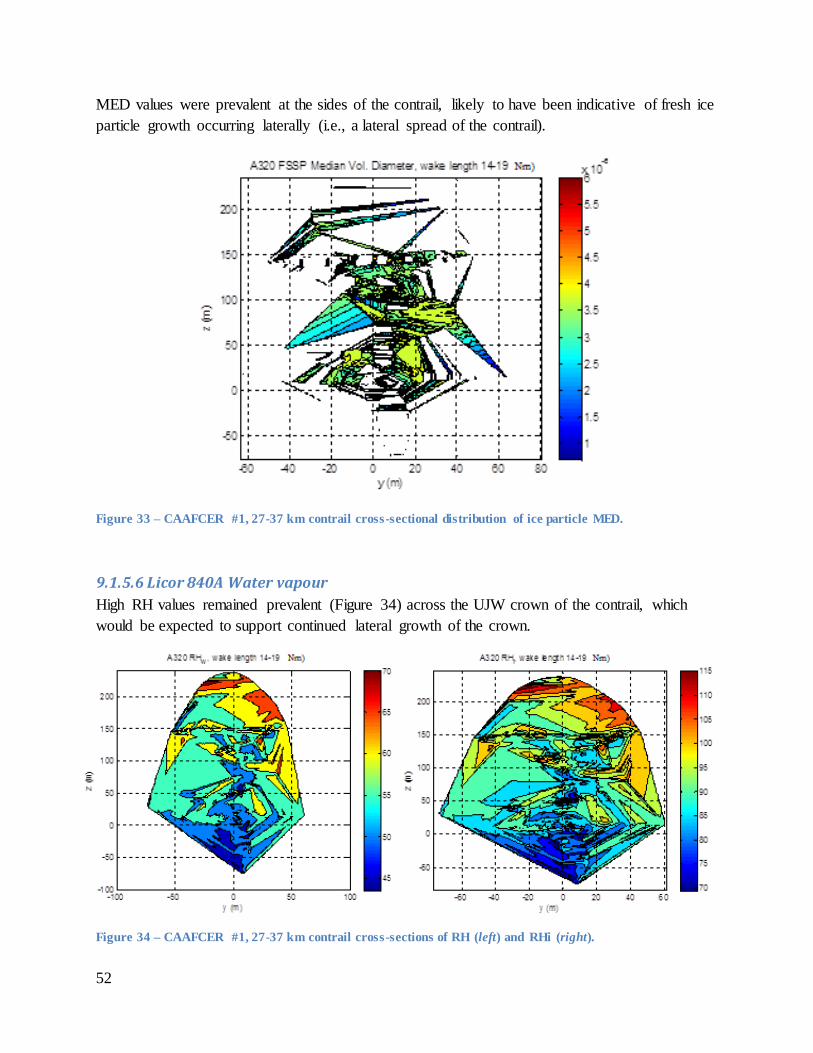
52
MED values were prevalent at the sides of the contrail, likely to have been indicative of fresh ice
particle growth occurring laterally (i.e., a lateral spread of the contrail).
Figure 33 – CAAFCER #1, 27-37 km contrail cross-sectional distribution of ice particle MED.
9.1.5.6 Licor 840A Water vapour
High RH values remained prevalent (Figure 34) across the UJW crown of the contrail, which
would be expected to support continued lateral growth of the crown.
Figure 34 – CAAFCER #1, 27-37 km contrail cross-sections of RH (left) and RHi (right).

53
9.1.6 Biofuel contrail, 25th APRIL 2017, 37-50 km
9.1.6.1 CN data
The CN cross-section was integrated to an EIn of 1.4522e+16. However, the plume (Figure 35)
showed that the integration may have been truncated in the 4-5 o’clock position, in which case
the cross-section integration could be expected to be an under-estimate.
Figure 35 – CAAFCER #1, 37-50 km contrail cross-section of CN and lateral integrand, vertical distribution.
9.1.6.2 CPC data, non-volatile (i.e. denuder in-line)
On the other hand, the CPC3776 nvPM plume (Figure 36) would appear to have been fully
captured. Of further note for the vector of nine traverses used in the cross-sectional re-
construction was the observation that background CN data points differed from background non-
volatile data points (indicative of some difference in background aerosol constituents, and the
presence of volatile particles in particular). EIn for CPCnv was 1.2978e+15 /kg.
Figure 36 – CAAFCER #1, 37-50 km contrail cross-section of CPC3776 nvPM and lateral integrand, vertical
distribution
-0.5 0 0.5 1 1.5 2 2.5
x 1011
-100
-50
0
50
100
150
200
250
300
net CN, no./m3
heig
ht
above/b
elo
w A
320 p
lane,
zA
320 (
m)
0 0.2 0.4 0.6 0.8 1 1.2 1.4 1.6 1.8 2
x 1010
-100
-50
0
50
100
150
200
250
300
net CPCnv, no./m3
heig
ht
above/b
elo
w A
320 p
lane,
zA
320 (
m)
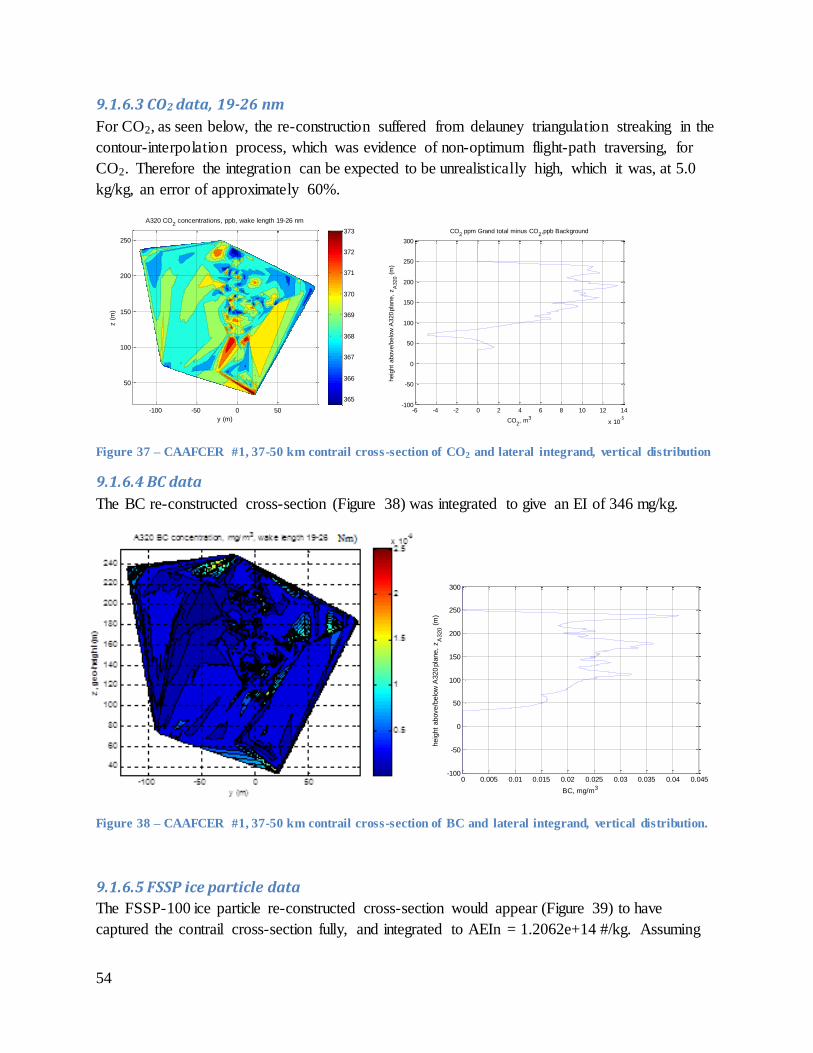
54
9.1.6.3 CO2 data, 19-26 nm
For CO2, as seen below, the re-construction suffered from delauney triangulation streaking in the
contour-interpolation process, which was evidence of non-optimum flight-path traversing, for
CO2. Therefore the integration can be expected to be unrealistically high, which it was, at 5.0
kg/kg, an error of approximately 60%.
Figure 37 – CAAFCER #1, 37-50 km contrail cross-section of CO2 and lateral integrand, vertical distribution
9.1.6.4 BC data
The BC re-constructed cross-section (Figure 38) was integrated to give an EI of 346 mg/kg.
Figure 38 – CAAFCER #1, 37-50 km contrail cross-section of BC and lateral integrand, vertical distribution.
9.1.6.5 FSSP ice particle data
The FSSP-100 ice particle re-constructed cross-section would appear (Figure 39) to have
captured the contrail cross-section fully, and integrated to AEIn = 1.2062e+14 #/kg. Assuming
y (m)
z (
m)
A320 CO2 concentrations, ppb, wake length 19-26 nm
-100 -50 0 50
50
100
150
200
250
365
366
367
368
369
370
371
372
373
-6 -4 -2 0 2 4 6 8 10 12 14
x 10-5
-100
-50
0
50
100
150
200
250
300
CO2, m3
heig
ht
above/b
elo
w A
320 p
lane,
zA
320 (
m)
CO2 ppm Grand total minus CO
2,ppb Background
0 0.005 0.01 0.015 0.02 0.025 0.03 0.035 0.04 0.045-100
-50
0
50
100
150
200
250
300
BC, mg/m3
heig
ht
above/b
elo
w A
320 p
lane,
zA
320 (
m)
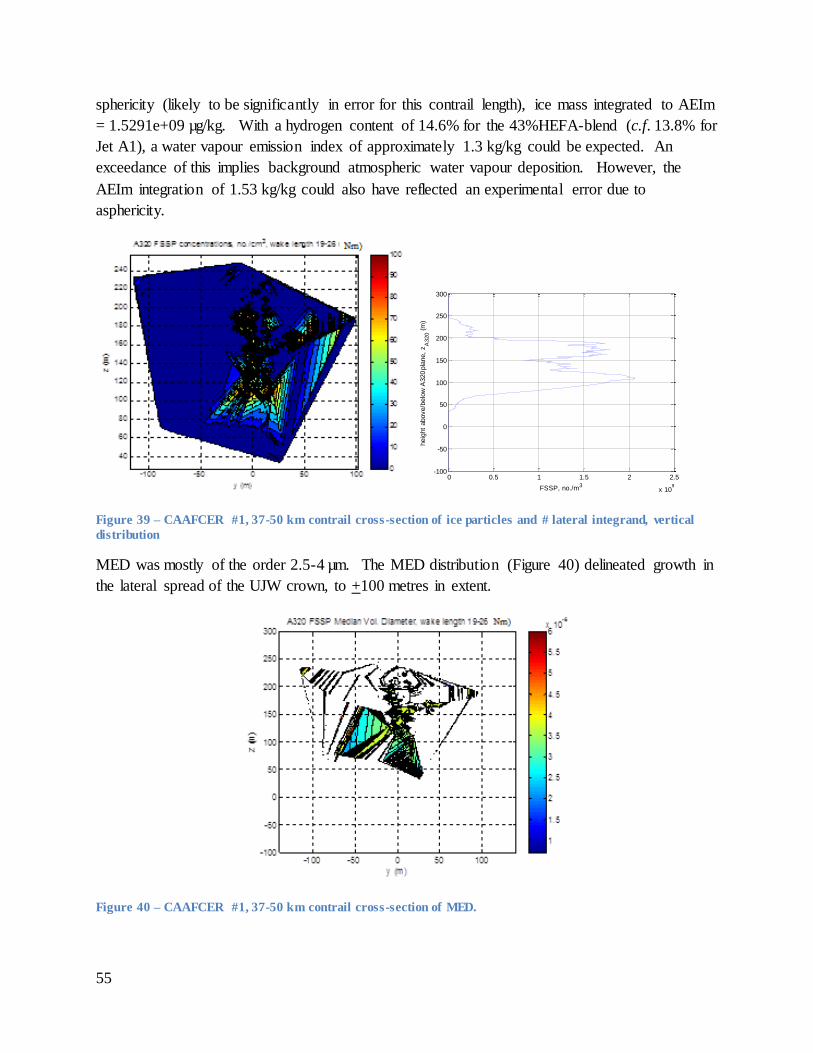
55
sphericity (likely to be significantly in error for this contrail length), ice mass integrated to AEIm
= 1.5291e+09 µg/kg. With a hydrogen content of 14.6% for the 43%HEFA-blend (c.f. 13.8% for
Jet A1), a water vapour emission index of approximately 1.3 kg/kg could be expected. An
exceedance of this implies background atmospheric water vapour deposition. However, the
AEIm integration of 1.53 kg/kg could also have reflected an experimental error due to
asphericity.
Figure 39 – CAAFCER #1, 37-50 km contrail cross-section of ice particles and # lateral integrand, vertical
distribution
MED was mostly of the order 2.5-4 µm. The MED distribution (Figure 40) delineated growth in
the lateral spread of the UJW crown, to +100 metres in extent.
Figure 40 – CAAFCER #1, 37-50 km contrail cross-section of MED.
0 0.5 1 1.5 2 2.5
x 109
-100
-50
0
50
100
150
200
250
300
FSSP, no./m3
heig
ht
above/b
elo
w A
320 p
lane,
zA
320 (
m)

56
The ratio of FSSP ice particle number density to that of nvPM (i.e., CPC with denuder in-line, as
stated above) is shown in Figure 41. Peak ratios are seen to be lower than 19-27 km contrail
length, 0.2 (c.f. 0.3), implying some sublimation. Examination of the contour plot of the ratio
(Figure 41), in comparison to Figure 24 (shorter contrail) indicates that the sublimation occurred
in the TWV region. On the other hand, ratios at lateral extremities of the contrail had risen from
values of 0.05 (Figure 24) to 0.1, representing for FSSP sensed ice particle sizes, greater
activation associated with the lateral spread of the contrail.
Figure 41 – CAAFCER #1, 37-50 km contrail nvPM/FSSP activation (left) and re-constructed cross-section of
the activation (right).
9.1.6.6 Licor 840A water vapour
The RH cross-section (Figure 42) shows strong water vapour depletion in the areas of the
contrail. The RHi distribution (Figure 42) shows the surrounding environment to have no super-
saturation. Sublimation can be expected to be in-process.
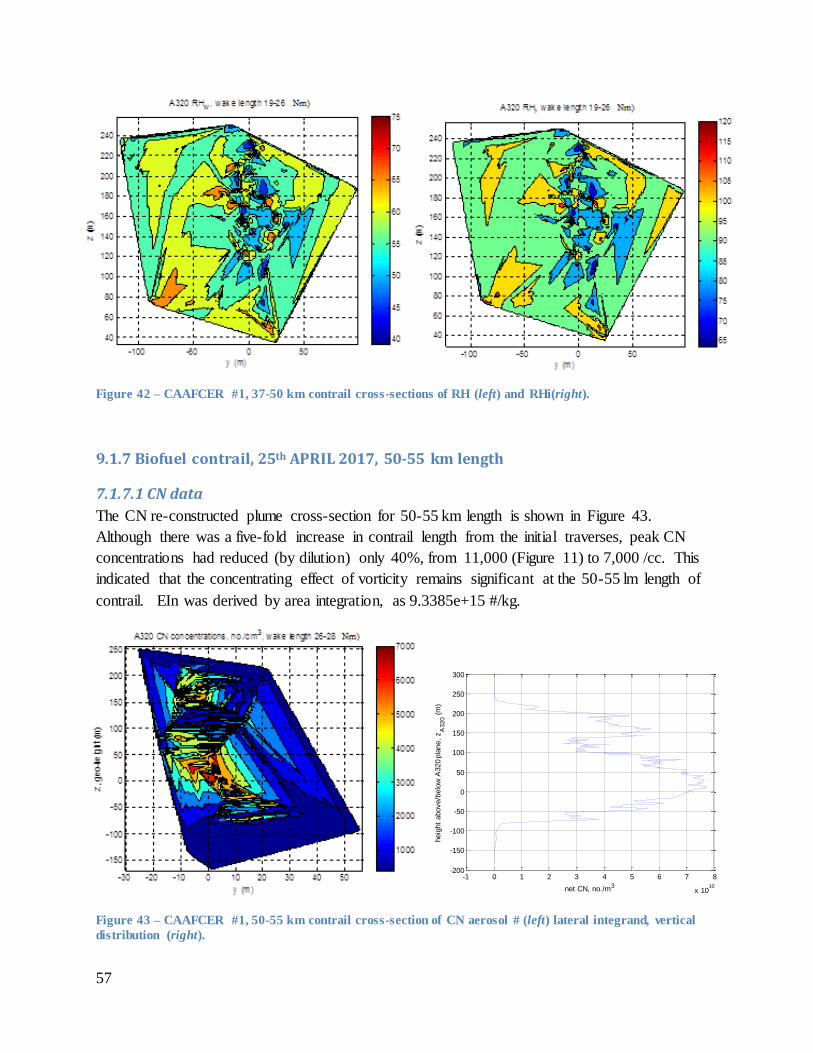
57
Figure 42 – CAAFCER #1, 37-50 km contrail cross-sections of RH (left) and RHi(right).
9.1.7 Biofuel contrail, 25th APRIL 2017, 50-55 km length
7.1.7.1 CN data
The CN re-constructed plume cross-section for 50-55 km length is shown in Figure 43.
Although there was a five-fold increase in contrail length from the initial traverses, peak CN
concentrations had reduced (by dilution) only 40%, from 11,000 (Figure 11) to 7,000 /cc. This
indicated that the concentrating effect of vorticity remains significant at the 50-55 lm length of
contrail. EIn was derived by area integration, as 9.3385e+15 #/kg.
Figure 43 – CAAFCER #1, 50-55 km contrail cross-section of CN aerosol # (left) lateral integrand, vertical
distribution (right).
-1 0 1 2 3 4 5 6 7 8
x 1010
-200
-150
-100
-50
0
50
100
150
200
250
300
net CN, no./m3
heig
ht
above/b
elo
w A
320 p
lane,
zA
320 (
m)

58
9.1.7.2 CPC PM data, denuder bypassed
For ultrafine aerosols (both volatile plus non-volatile), the re-constructed plume cross-section is
shown in Figure 44, and integrates to EIn = 1.8588e+16, or approximately twice the CN EIn.
Figure 44 – CAAFCER #1, 50-55 km contrail cross-section of CPC total ultrafine aerosol # (left) lateral
integrand, vertical distribution (right).
9.1.7.3 CO2 data
The cross-section of Figure 45 integrated to an EIm of 3.3467 kg/kg, when iterated against
refinements to the background concentration curve-fitting. Background CO2 had increased in
this location to a mean 370 ppb, with a negative lapse rate, from 372 ppb, 200 m below vortex
reference height, to 368 ppb, 200 m above vortex reference height. Elevations in CO2
concentration above this (to peak values of 373 ppb) were within the resolution of the Licor
840A. Thus, the re-constructed plume was non-deterministic.
Figure 45 – CAAFCER #1, 50-55 km contrail cross-section of CO2 (left) lateral integrand, vertical
distribution (right).
0 2 4 6 8 10 12 14 16
x 1010
-200
-150
-100
-50
0
50
100
150
200
250
300
net CPC, no./m3heig
ht
above/b
elo
w A
320 p
lane,
zA
320 (
m)
y (m)
z (
m)
A320 CO2 concentrations, ppb, wake length 26-28 nm
-30 -20 -10 0 10 20 30 40 50
-150
-100
-50
0
50
100
150
200
250
366
367
368
369
370
371
372
373
-2 -1 0 1 2 3 4 5 6 7
x 10-5
-200
-150
-100
-50
0
50
100
150
200
250
300
CO2, m3
heig
ht
above/b
elo
w A
320 p
lane,
zA
320 (
m)
CO2 ppm Grand total minus CO
2,ppb Background

59
9.1.7.4 BC data
For the BC plume cross-section (Figure 46), EIm was integrated to a BC EIm value of 303
mg/kg.
9.1.7.5 FSSP-100 data
The contrail cross-section, Figure 47, was also bifurcated vertically (like that observed for CN
and CPC data), into lower and upper lobes, joined on the port side, and slanted to the starboard
side. Integration gave AEIn = 5.5113e+13 /kg. By mass, assuming sphericity, AEIm =
7.1758e+08 µg/kg. The MVD distribution (below) showed size homogeneity through the height
of the contrail, 3.5-4 µm.
Figure 46 – CAAFCER #1, 50-55 km contrail cross-section of BC (left) lateral integrand distribution (right).
Figure continued over-page, with caption.
0 0.002 0.004 0.006 0.008 0.01 0.012 0.014 0.016 0.018-200
-150
-100
-50
0
50
100
150
200
250
300
BC, mg/m3
heig
ht
above/b
elo
w A
320 p
lane,
zA
320 (
m)
0 1 2 3 4 5 6 7
x 108
-200
-150
-100
-50
0
50
100
150
200
250
300
FSSP, no./m3
heig
ht
above/b
elo
w A
320 p
lane,
zA
320 (
m)
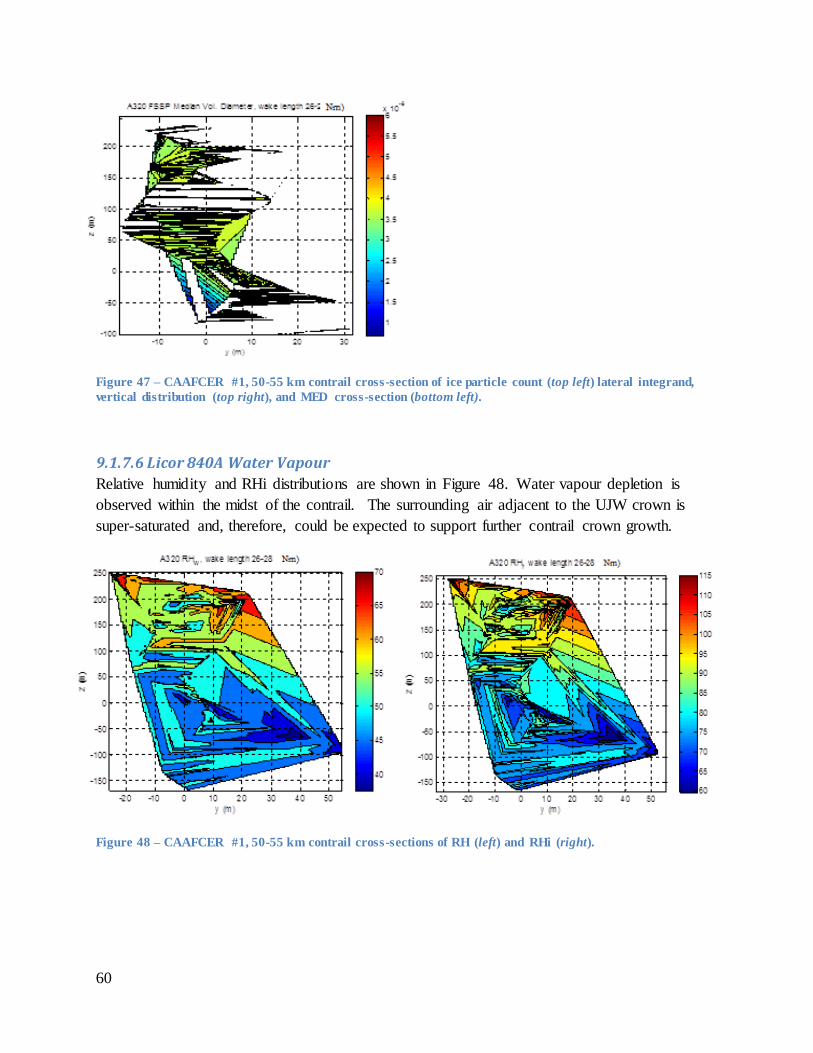
60
Figure 47 – CAAFCER #1, 50-55 km contrail cross-section of ice particle count (top left) lateral integrand,
vertical distribution (top right), and MED cross-section (bottom left).
9.1.7.6 Licor 840A Water Vapour
Relative humidity and RHi distributions are shown in Figure 48. Water vapour depletion is
observed within the midst of the contrail. The surrounding air adjacent to the UJW crown is
super-saturated and, therefore, could be expected to support further contrail crown growth.
Figure 48 – CAAFCER #1, 50-55 km contrail cross-sections of RH (left) and RHi (right).
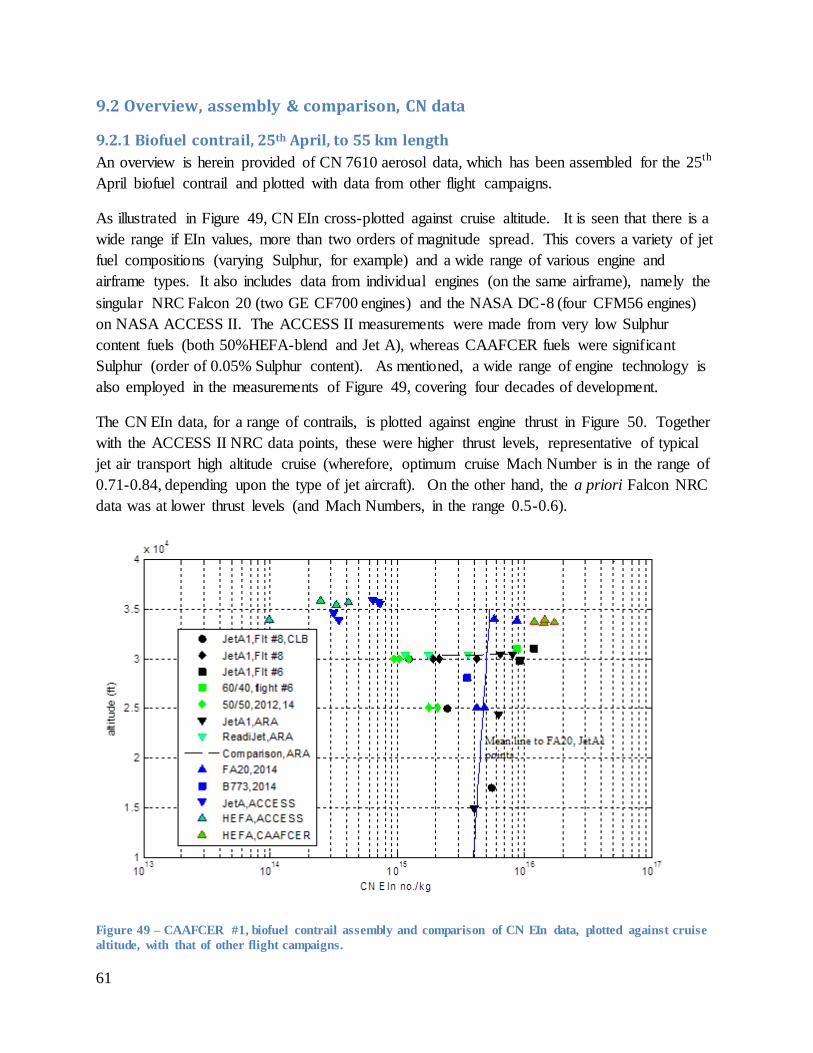
61
9.2 Overview, assembly & comparison, CN data
9.2.1 Biofuel contrail, 25th April, to 55 km length
An overview is herein provided of CN 7610 aerosol data, which has been assembled for the 25th
April biofuel contrail and plotted with data from other flight campaigns.
As illustrated in Figure 49, CN EIn cross-plotted against cruise altitude. It is seen that there is a
wide range if EIn values, more than two orders of magnitude spread. This covers a variety of jet
fuel compositions (varying Sulphur, for example) and a wide range of various engine and
airframe types. It also includes data from individual engines (on the same airframe), namely the
singular NRC Falcon 20 (two GE CF700 engines) and the NASA DC-8 (four CFM56 engines)
on NASA ACCESS II. The ACCESS II measurements were made from very low Sulphur
content fuels (both 50%HEFA-blend and Jet A), whereas CAAFCER fuels were significant
Sulphur (order of 0.05% Sulphur content). As mentioned, a wide range of engine technology is
also employed in the measurements of Figure 49, covering four decades of development.
The CN EIn data, for a range of contrails, is plotted against engine thrust in Figure 50. Together
with the ACCESS II NRC data points, these were higher thrust levels, representative of typical
jet air transport high altitude cruise (wherefore, optimum cruise Mach Number is in the range of
0.71-0.84, depending upon the type of jet aircraft). On the other hand, the a priori Falcon NRC
data was at lower thrust levels (and Mach Numbers, in the range 0.5-0.6).
Figure 49 – CAAFCER #1, biofuel contrail assembly and comparison of CN EIn data, plotted against cruise
altitude, with that of other flight campaigns.
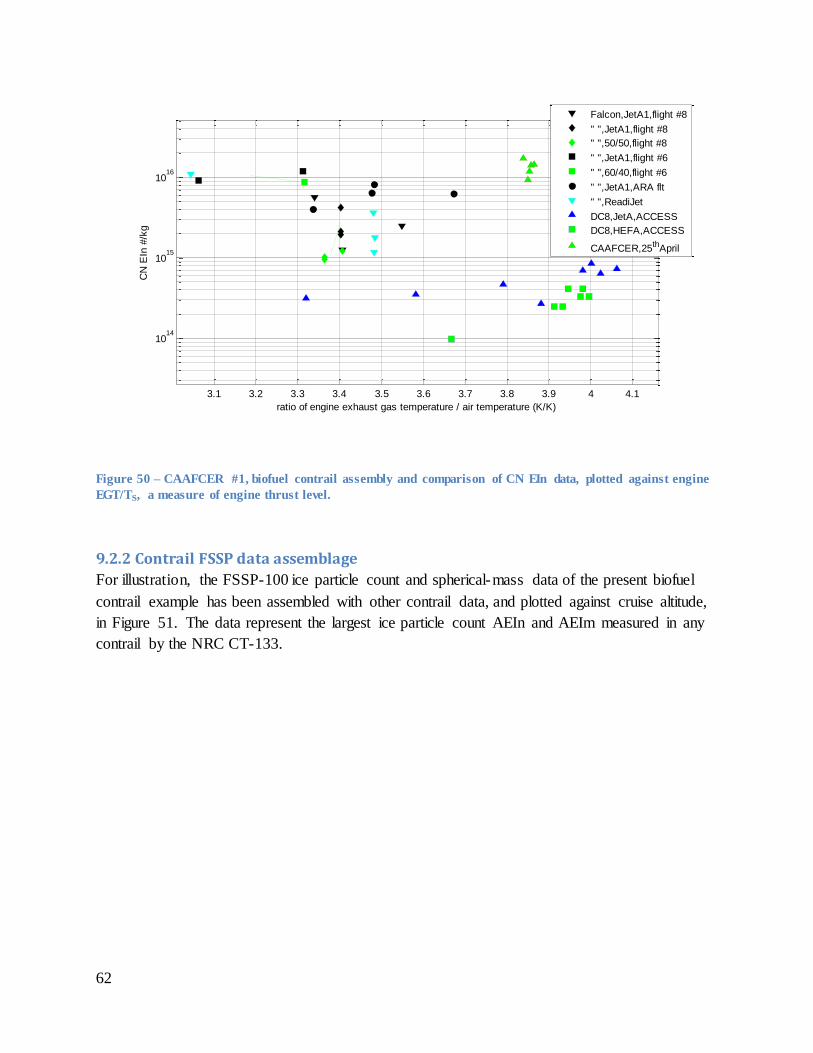
62
Figure 50 – CAAFCER #1, biofuel contrail assembly and comparison of CN EIn data, plotted against engine
EGT/TS, a measure of engine thrust level.
9.2.2 Contrail FSSP data assemblage
For illustration, the FSSP-100 ice particle count and spherical-mass data of the present biofuel
contrail example has been assembled with other contrail data, and plotted against cruise altitude,
in Figure 51. The data represent the largest ice particle count AEIn and AEIm measured in any
contrail by the NRC CT-133.
3.1 3.2 3.3 3.4 3.5 3.6 3.7 3.8 3.9 4 4.1
1014
1015
1016
ratio of engine exhaust gas temperature / air temperature (K/K)
CN
EIn
#/k
g
Falcon,JetA1,flight #8
" ",JetA1,flight #8
" ",50/50,flight #8
" ",JetA1,flight #6
" ",60/40,flight #6
" ",JetA1,ARA flt
" ",ReadiJet
DC8,JetA,ACCESS
DC8,HEFA,ACCESS
CAAFCER,25thApril
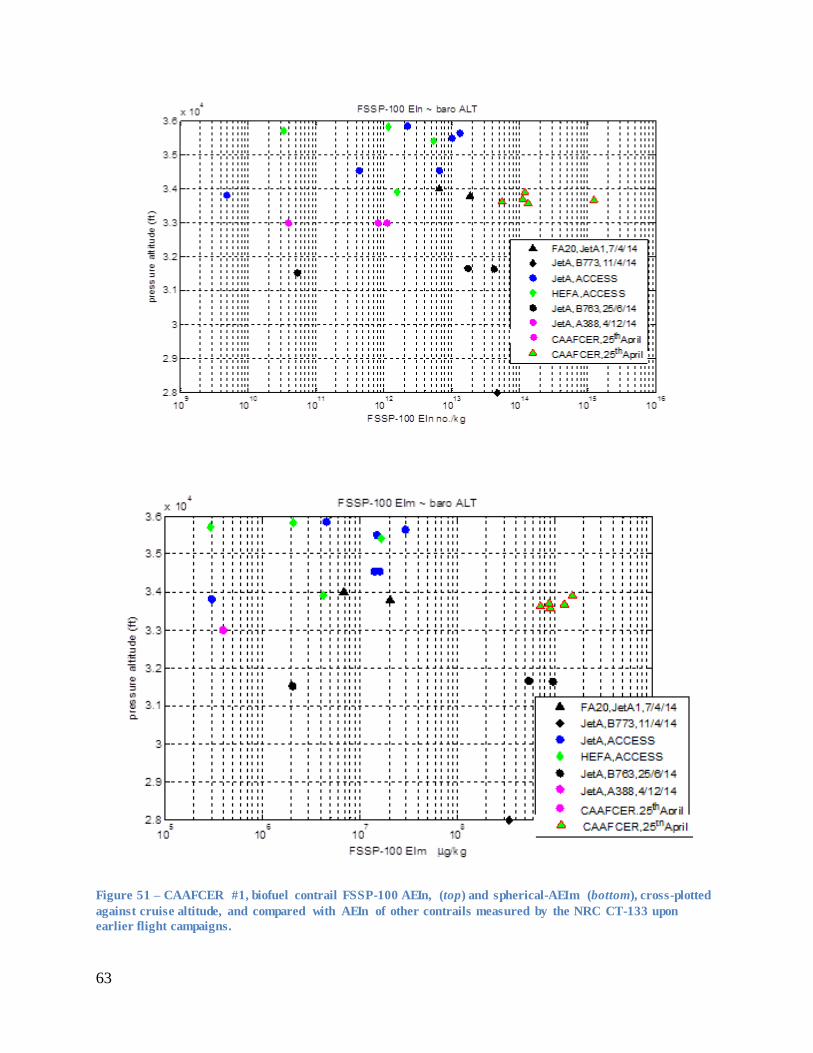
63
Figure 51 – CAAFCER #1, biofuel contrail FSSP-100 AEIn, (top) and spherical-AEIm (bottom), cross-plotted
against cruise altitude, and compared with AEIn of other contrails measured by the NRC CT-133 upon
earlier flight campaigns.
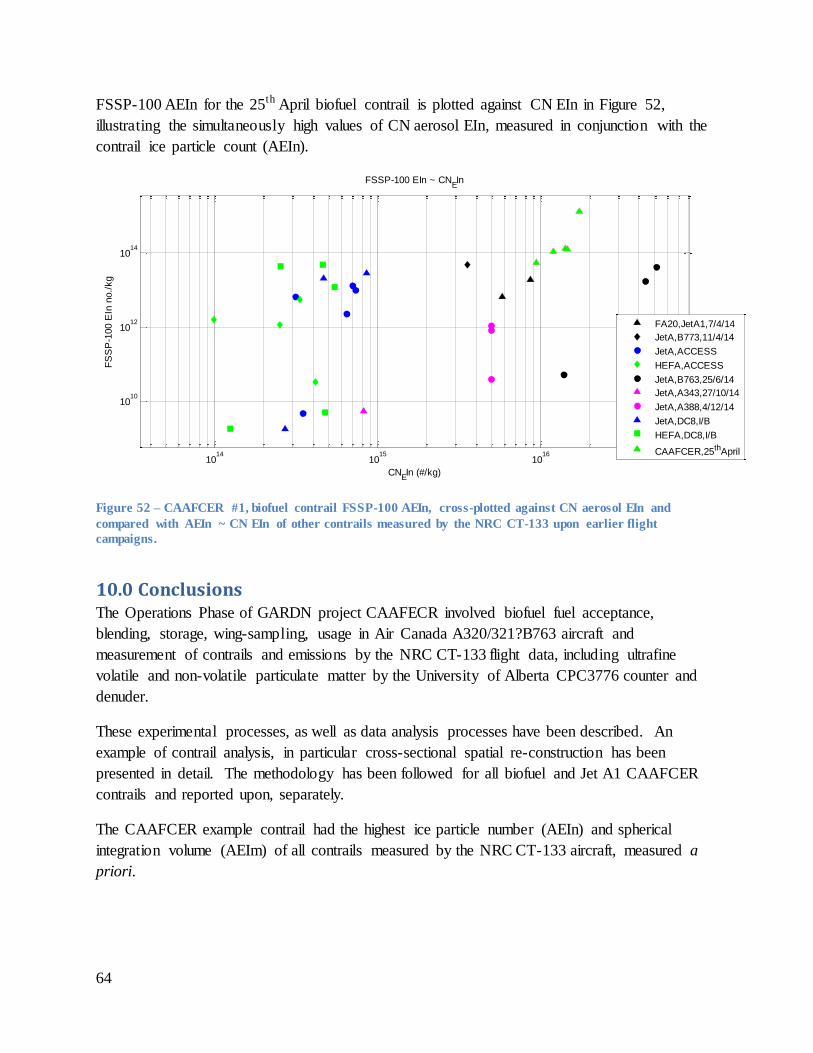
64
FSSP-100 AEIn for the 25th April biofuel contrail is plotted against CN EIn in Figure 52,
illustrating the simultaneously high values of CN aerosol EIn, measured in conjunction with the
contrail ice particle count (AEIn).
Figure 52 – CAAFCER #1, biofuel contrail FSSP-100 AEIn, cross-plotted against CN aerosol EIn and
compared with AEIn ~ CN EIn of other contrails measured by the NRC CT-133 upon earlier flight
campaigns.
10.0 Conclusions The Operations Phase of GARDN project CAAFECR involved biofuel fuel acceptance,
blending, storage, wing-sampling, usage in Air Canada A320/321?B763 aircraft and
measurement of contrails and emissions by the NRC CT-133 flight data, including ultrafine
volatile and non-volatile particulate matter by the University of Alberta CPC3776 counter and
denuder.
These experimental processes, as well as data analysis processes have been described. An
example of contrail analysis, in particular cross-sectional spatial re-construction has been
presented in detail. The methodology has been followed for all biofuel and Jet A1 CAAFCER
contrails and reported upon, separately.
The CAAFCER example contrail had the highest ice particle number (AEIn) and spherical
integration volume (AEIm) of all contrails measured by the NRC CT-133 aircraft, measured a
priori.
1014
1015
1016
1010
1012
1014
CNEIn (#/kg)
FS
SP
-100 E
In n
o./
kg
FSSP-100 EIn ~ CNEIn
FA20,JetA1,7/4/14
JetA,B773,11/4/14
JetA,ACCESS
HEFA,ACCESS
JetA,B763,25/6/14
JetA,A343,27/10/14
JetA,A388,4/12/14
JetA,DC8,I/B
HEFA,DC8,I/B
CAAFCER,25thApril

65
11.0 Acknowledgements CAAFCER project funding has been provided by the Green Aviation Research and Development
Network (GARDN), a non-profit organization funded by the Business-Led Network of Centres
of Excellence (BL-NCE) of the Government of Canada and the Canadian aerospace industry
Technical assistance provided by Steve Baughcum of Boeing has been very influential on the
success of the CAAFCER project. Successful conduct of CAAFCER flight operations (and
quantity of data gathered) involved a huge undertaking and commitment by Air Canada.
12.0 References
1. A P Brown, Matthew Bastian, Mike Pryor, Per Talgoy, “NRC CT-133 ACCESS II
DATA ANALYSIS:- GASEOUS, AEROSOL AND CONTRAIL
CHARACTERISTICS,” Flight Research Laboratory, NRC IFAR NASA ACCESS II Data Workshop, Kissimmee, FL, 9th January 2015
2. A. P. Brown, M. Bastian, S. Alavi, M Wasey, “FLIGHT RESEARCH REPORT:-
PROJECTS AEAFFR, CAAFER AND NASA ACCESS II JET TRANSPORT EMISSIONS MEASUREMENTS,’ NRC LTR-FRL-2015-0054, March 2015.
3. Brown, A.P., “Flight data of axial flows in wake vortex instability,” AIAA AVIATION Forum, 13-17 June 2016, Washington D.C., 8th AIAA Atmospheric and Space Environments Conference, 10.2514/6.2016-3435.
4. Brown, A.P. and Bastian, M., “Derivation of Wake Vortex Circulation from Flight Data using Path Integrals,” AIAA 2007-286, 45th AIAA Aerospace Sciences Meeting
and Exhibit, 8 - 11 January 2007, Reno, Nevada.