Embed Size (px)
Citation preview
EN
André Bardow, Damien Green December – 2017
Low-Carbon Process Industries
Through Energy Efficiency and
Carbon Dioxide Utilisation
A study in support of a DG Research & Innovation Projects for Policy (P4P) report
Low-Carbon Process Industries Through Energy Efficiency and Carbon Dioxide Utilisation
European Commission
Directorate-General for Research and Innovation
Directorate Directorate D — Industrial Technologies
Unit [Directorate D.2. — Advanced Manufacturing Systems and Biotechnologies
Contact Nicolas Segebarth
Carmine Marzano
E-mail [email protected]
European Commission
B-1049 Brussels
Manuscript completed in December 2017.
This document has been prepared for the European Commission in support of a ‘Projects for Policy’ report. Projects for Policy
(P4P) is a European Commission initiative that aims to use research and innovation project results to shape policymaking
through evidence-based policy recommendations. The Research and Innovation Projects for Policy (P4P) report series
(https://ec.europa.eu/info/research-and-innovation-0/p4p_en) collects these recommendations to reach out to partners and
stakeholders, and contribute to an effective policymaking process.
This document reflects the views only of the authors, and the Commission cannot be held responsible for any use which may be made of the information contained therein.
More information on the European Union is available on the internet (http://europa.eu).
Luxembourg: Publications Office of the European Union, 2018
PDF ISBN 978-92-79-77788-2 doi:10.2777/175882 KI-04-18-022-EN-N
© European Union, 2018.
Reuse is authorised provided the source is acknowledged. The reuse policy of European Commission documents is regulated by
Decision 2011/833/EU (OJ L 330, 14.12.2011, p. 39).
For any use or reproduction of photos or other material that is not under the EU copyright, permission must be sought directly
from the copyright holders.
Cover page image: © Lonely # 46246900, ag visuell #16440826, Sean Gladwell #6018533, LwRedStorm #3348265, 2011;
kras99 #43746830, 2012. Source: Fotolia.com.
EUROPEAN COMMISSION
Low-Carbon Process Industries
Through Energy Efficiency and
Carbon Dioxide Utilisation
A study in support of a DG Research & Innovation
Projects for Policy (P4P) report
André Bardow, Damien Green
Directorate-General for Research and Innovation
2018 Key Enabling Technologies EN

Table of Contents
INTRODUCTION .................................................................................................. 3
1. POLICY CHALLENGES ...................................................................................... 4
1.1 Keeping global warming wall below 2˚C ......................................................................... 4
1.2 Transforming the emissions intensity of process industries ............................................... 5
1.3 Promoting industrial energy efficiency ............................................................................ 7
1.4 Unlocking the potential of carbon dioxide utilisation ......................................................... 9
2. PORTFOLIO OF EU-FUNDED R&I PROJECTS .................................................. 12
2.1 Programmes contributing to energy efficiency and CCU .................................................. 12
2.2 Portfolio of beneficiaries ............................................................................................. 16
3. IMPACT OF R&I FUNDING ON EU POLICY GOALS .......................................... 18
3.1 Supporting the transfer of policy-relevant innovations to market ..................................... 18
3.2 Supporting GHG abatement goals ................................................................................ 20
3.3 Supporting industrial efficiency goals ........................................................................... 21
3.4 Supporting goals to develop CO2 utilisation technologies ................................................ 23
4. POLICY RECOMMENDATIONS ........................................................................ 25
4.1 Remove barriers to energy efficiency investment ........................................................... 26
4.2 Optimise scale-up of challenge-relevant technologies with smart R&I ............................... 30
4.3 Take an evidence-based approach to integrating CCU into the policy framework ................ 32
4.4 Develop a supportive framework to promote industrial symbiosis .................................... 34
Appendix 1 – Project Identification ......................................................................... 39
Appendix 2 – Survey conducted for this study .......................................................... 40
Appendix 3 – Data on TRL, Energy Saving, GHG Saving and Operation Costs ............... 42
Appendix 4 – Data on Barriers ............................................................................... 45
Appendix 5 – Data on Policy Recommendations ........................................................ 51
3
INTRODUCTION
EU policymakers have set ambitious goals to tackle climate change, promote resource
efficiency, strengthen energy security, and enhance economic competitiveness. The
Research and Innovation (R&I) community, meanwhile, is developing the solutions
needed to meet these societal challenges. In this respect, R&I programmes at the
European level, such as the SPIRE PPP (funded with €900 million from 2014-20), as well
as initiatives at national and regional level, have been established to support delivery of
these targets. Projects for Policy (P4P) reports seek to facilitate a conversation between
policymakers and the R&I community, about how to better deliver shared goals. The
present study has been conducted to support a DG Research & Innovation Projects for
Policy report.
This particular study considers the challenge of establishing low-carbon process
industries, which is a key aspect of the wider societal challenges mentioned above.
Indeed, industry accounts for a quarter of EU emissions and energy consumption,
contributing 15% to GDP directly, and acting as the foundation for many value chains.
Establishing low-carbon process industries will call for a wide range of technologies, such
as CCS, electrification, and renewable hydrogen, but the present report focuses on
energy efficiency and carbon dioxide utilisation in particular. The intention is to cover a
long-standing field, and a more recent topic, providing policymakers with specific
insights in these areas, while generating insights of general relevance to other low-
carbon technologies at different stages of maturity. The joint discussion of energy
efficiency and carbon dioxide utilisation is also intended to broaden and guide the
current discussion around carbon dioxide utilisation, which today is often debated in the
context of carbon dioxide storage only, while many carbon dioxide utilisation pathways
in fact do not provide carbon storage, but aim at low-carbon processes by improving
energy and resource efficiency.
Section 1 of the report sets out four main policy challenges that relate to establishing
low-carbon process industries. These were identified by reviewing the policy
environment, and analysing industrial emissions and energy data. Section 2 outlines the
R&I projects that the EU has funded since 2007 that are relevant to the policy challenges
identified in Section 1. These were identified by reviewing project data from Framework
Programme 7 (FP7), Horizon 2020, Intelligent Energy Europe (IEE), and the Research
Fund for Coal and Steel (RFCS). Section 3 discusses the value of these projects in
relation to the goals identified in Section 1. This discussion is based on the projects’ self-
assessment (in response to an online survey), as well as analysis of specific projects,
drawing upon relevant literature where appropriate. Finally, Section 4 makes four policy
recommendations (each with two suggested accompanying measures). These are based
on information from the projects concerning barriers and policy interventions, which was
supplemented with insights and evidence from relevant recent literature, and comments
from stakeholders and policymakers at a workshop.
For the purposes of this report, industry has been defined broadly to include refining and
all major manufacturing sectors (see Appendix 1 for further details). While this report is
properly concerned with carbon dioxide utilisation, the acronym ‘CCU’ (which stands for
Carbon Capture and Utilisation) will be used throughout for convenience, because it is a
more established term than CDU, and CO2 capture is an important part of the CCU value
chain.
4
1. POLICY CHALLENGES
Four main policy challenges that relate to promoting low-carbon process industries
through energy efficiency and CCU have been identified. The challenges have been
selected and analysed by reviewing the policy environment and industrial emissions and
energy data.
1.1 Keeping global warming well below 2°C
The EU has played a leading role in international efforts to reduce greenhouse gas (GHG)
emissions since the inception of the United Nations Framework Convention on Climate
Change in 1992.1 During the first Kyoto Protocol commitment period (2008-12), the EU-
15 pledged to keep average annual emissions at least 8% below 1990 levels, and
overachieved its target by almost four percentage points.2 3 Now, in the second Kyoto
commitment period (2013-20), the EU-28 has promised to emit 20% less by 2020
(compared to 1990 levels), and is well on track.4 5
But the real challenge lies ahead. The United Nations forecasts that the global population
will increase by 30% by 2050, and 47% by the end of the century.6 At the same time,
the Paris Agreement—negotiated in 2015 and now in force—requires nations to keep
global warming ‘well below’ 2°C, and strive to limit it to 1.5°C (compared to pre-
industrial levels).7 In its first Nationally Determined Contribution (NDC), the EU has
pledged to emit 40% less by 2030 (compared to 1990 levels), which will require a step
change in climate action in the next decade.8 And, to be consistent with the wider Paris
objective, the EU will have to go much further, dramatically cutting emissions by the
middle of the century.
Member State Environment Ministers first endorsed a 2°C limit in 1996, and in 2011 the
European Council agreed that it would require an 80–95% cut in emissions by 2050
(compared to 1990 levels), in keeping with the findings of the Intergovernmental Panel
on Climate Change’s Fourth Assessment Report.9 10 11 The European Commission
accordingly issued a Roadmap in 2011, setting out how this level of abatement could be
achieved, and proposing a 60% milestone target for 2040.12
The Commission will review its mid-century strategy in light of the 1.5°C aspiration in
the Paris Agreement, and the latest evidence from UNEP provided at COP23, which
suggests that there exists a significant ‘emissions gap’ between current NDCs and the
overall goal of the Agreement, and calls for urgent action during the Facilitative Dialogue
period (2018) ahead of the submission of updated NDCs in 2020.13 14 The European
Parliament, meanwhile, passed a Resolution in October ahead of COP23, calling for a
zero-emissions strategy for 2050 by 2018.15
1 http://unfccc.int/essential_background/convention/items/6036.php 2 http://unfccc.int/kyoto_protocol/items/3145.php 3 https://www.eea.europa.eu/data-and-maps/indicators/greenhouse-gas-emission-trends-5/assessment 4 https://treaties.un.org/doc/Publication/CN/2012/CN.718.2012-Eng.pdf 5 http://ec.europa.eu/eurostat/tgm/table.do?tab=table&init=1&language=en&pcode=t2020_30&plugin=1 6 https://www.un.org/development/desa/en/news/population/world-population-prospects-2017.html 7 https://unfccc.int/files/essential_background/convention/application/pdf/english_paris_agreement.pdf 8 http://www4.unfccc.int/submissions/INDC/Published%20Documents/Latvia/1/LV-03-06-EU%20INDC.pdf 9 http://europa.eu/rapid/press-release_PRES-96-188_en.htm?locale=en 10 http://www.consilium.europa.eu/uedocs/cms_data/docs/pressdata/en/ec/119175.pdf 11 http://www.ipcc.ch/pdf/assessment-report/ar4/syr/ar4_syr_full_report.pdf 12 http://eur-lex.europa.eu/legal-content/EN/TXT/?uri=CELEX:52011DC0112 13 https://cop23.unfccc.int/ 14 https://www.unenvironment.org/resources/emissions-gap-report 15 http://www.europarl.europa.eu/sides/getDoc.do?type=TA&language=EN&reference=P8-TA-2017-0380
5
1.2 Transforming the emissions intensity of process industries
Reducing industrial emissions is a crucial aspect of the EU’s wider goal of moving to a
low-carbon society, because direct industrial emissions account for a quarter of EU
emissions, and indirect industrial emissions associated with energy-use about a further
tenth.16 17 Bearing in mind that the EU’s industrial strategy seeks to promote
manufacturing growth—aiming for manufacturing to account for 20% of GDP by 2020—a
radical transformation is required in the emissions intensity of process industries.18
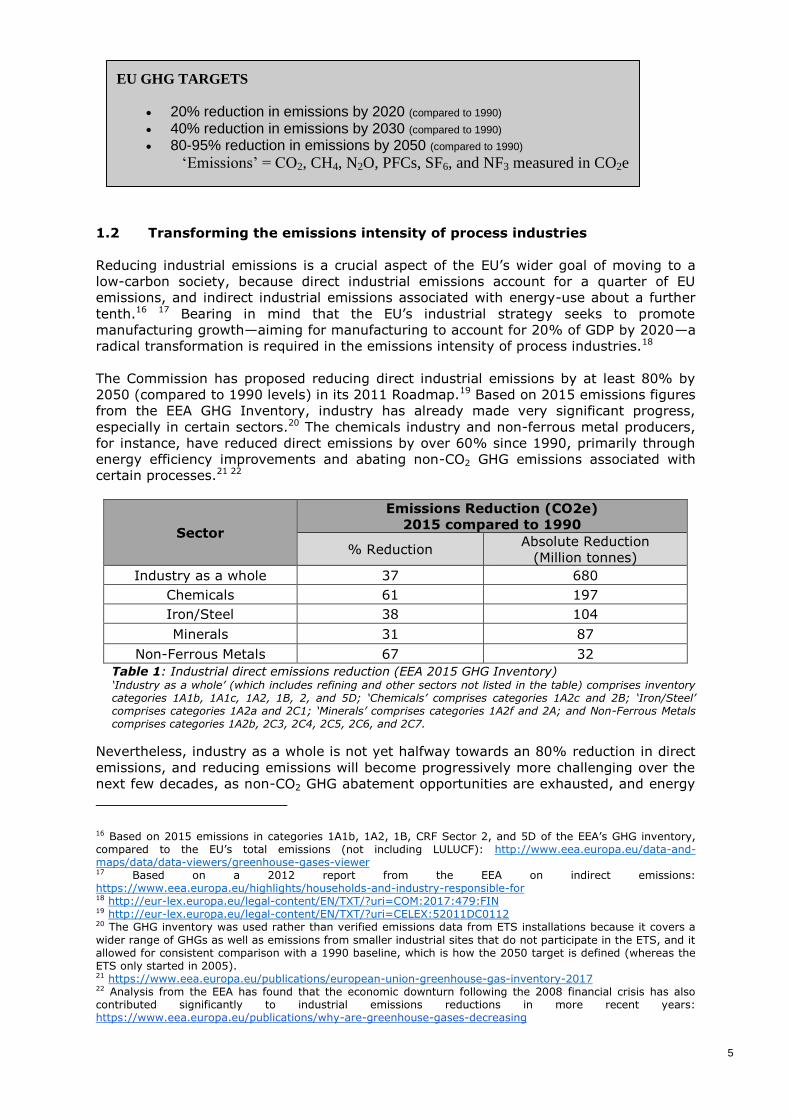
The Commission has proposed reducing direct industrial emissions by at least 80% by
2050 (compared to 1990 levels) in its 2011 Roadmap.19 Based on 2015 emissions figures
from the EEA GHG Inventory, industry has already made very significant progress,
especially in certain sectors.20 The chemicals industry and non-ferrous metal producers,
for instance, have reduced direct emissions by over 60% since 1990, primarily through
energy efficiency improvements and abating non-CO2 GHG emissions associated with
certain processes.21 22
Sector
Emissions Reduction (CO2e)
2015 compared to 1990
% Reduction Absolute Reduction
(Million tonnes)
Industry as a whole 37 680
Chemicals 61 197
Iron/Steel 38 104
Minerals 31 87
Non-Ferrous Metals 67 32
Table 1: Industrial direct emissions reduction (EEA 2015 GHG Inventory) ‘Industry as a whole’ (which includes refining and other sectors not listed in the table) comprises inventory categories 1A1b, 1A1c, 1A2, 1B, 2, and 5D; ‘Chemicals’ comprises categories 1A2c and 2B; ‘Iron/Steel’ comprises categories 1A2a and 2C1; ‘Minerals’ comprises categories 1A2f and 2A; and Non-Ferrous Metals comprises categories 1A2b, 2C3, 2C4, 2C5, 2C6, and 2C7.
Nevertheless, industry as a whole is not yet halfway towards an 80% reduction in direct
emissions, and reducing emissions will become progressively more challenging over the
next few decades, as non-CO2 GHG abatement opportunities are exhausted, and energy
16 Based on 2015 emissions in categories 1A1b, 1A2, 1B, CRF Sector 2, and 5D of the EEA’s GHG inventory, compared to the EU’s total emissions (not including LULUCF): http://www.eea.europa.eu/data-and-maps/data/data-viewers/greenhouse-gases-viewer 17 Based on a 2012 report from the EEA on indirect emissions: https://www.eea.europa.eu/highlights/households-and-industry-responsible-for 18 http://eur-lex.europa.eu/legal-content/EN/TXT/?uri=COM:2017:479:FIN 19 http://eur-lex.europa.eu/legal-content/EN/TXT/?uri=CELEX:52011DC0112 20 The GHG inventory was used rather than verified emissions data from ETS installations because it covers a
wider range of GHGs as well as emissions from smaller industrial sites that do not participate in the ETS, and it allowed for consistent comparison with a 1990 baseline, which is how the 2050 target is defined (whereas the ETS only started in 2005). 21 https://www.eea.europa.eu/publications/european-union-greenhouse-gas-inventory-2017 22 Analysis from the EEA has found that the economic downturn following the 2008 financial crisis has also contributed significantly to industrial emissions reductions in more recent years: https://www.eea.europa.eu/publications/why-are-greenhouse-gases-decreasing
EU GHG TARGETS
20% reduction in emissions by 2020 (compared to 1990)
40% reduction in emissions by 2030 (compared to 1990)
80-95% reduction in emissions by 2050 (compared to 1990)
‘Emissions’ = CO2, CH4, N2O, PFCs, SF6, and NF3 measured in CO2e
6
efficiency improvements become increasingly incremental. In addition, there are wider
challenges to reduce indirect emissions associated with the upstream production of
materials and energy used by industry, as well as the downstream waste management
of products made from carbon feedstocks, such as those produced by the chemicals
industry.23 24
To achieve this radical transformation, the EU will have to use policy levers and very
significant public funding to help industry bring breakthrough technologies to market. In
this respect, the EU currently funds innovation under Horizon 2020, the Research Fund
for Coal and Steel, and NER300, and Member States have a range of research and
innovation programmes.25 26 27 The European Commission is also currently considering
an initiative to promote technological breakthroughs capable of producing zero-emissions
steel from 2030 (the Big Ticket Initiative), following a recommendation in the Pascal
Lamy report on priorities for Framework Programme 9.28 29 Ensuring that industry has
access to cheap low-carbon electricity, will also be vital if breakthrough technologies
involving electrification are to be viable.
While the 2011 Roadmap contains the EU’s only industry-specific emissions goal,
industrial sectors also participate in the EU Emissions Trading System (ETS), which
progressively limits CO2, N2O and PFC emissions from industrial processes, electricity
generation, and aviation.30 The ETS is currently calibrated to issue a number of
allowances in 2020 that corresponds to an emissions level that is 21% below 2005
levels.31 A provisional agreement has been reached that the ETS will issue a number of
allowances in 2030 that is 43% below 2005 levels.32 This gives an indication of the EU’s
shorter-term goals for reducing industrial emissions.33
23 The EU has a range of policy mechanisms and initiatives relating to tier 2 and 3 industrial emissions, such as the Renewable Energy Directive (which promotes renewable electricity), and the forthcoming Plastics Strategy (which will consider how to reduce the climate impact of plastics). 24 The Ellen MacArthur Foundation, for instance, suggests that plastics could account for 20% of global oil consumption by 2050, which would take up 15% of the global carbon budget: https://www.ellenmacarthurfoundation.org/assets/downloads/EllenMacArthurFoundation_TheNewPlasticsEconomy_15-3-16.pdf 25 https://ec.europa.eu/programmes/horizon2020/ 26 http://ec.europa.eu/research/industrial_technologies/rfcs_en.html 27 https://ec.europa.eu/clima/policies/lowcarbon/ner300_en 28 https://publications.europa.eu/en/publication-detail/-/publication/f5a82742-2a44-11e7-ab65-01aa75ed71a1 29 https://ec.europa.eu/research/evaluations/pdf/archive/other_reports_studies_and_documents/hlg_2017_report.pdf#view=fit&pagemode=none 30 See Annex 1: eur-lex.europa.eu/legal-content/EN/TXT/?uri=CELEX:02003L0087-20140430 31 https://ec.europa.eu/clima/policies/ets_en 32 http://www2.consilium.europa.eu/en/press/press-releases/2017/11/22/reform-of-the-eu-emissions-trading-system-council-endorses-deal-with-european-parliament/# 33 The ETS target is only indicative for industry because the cap also covers other sectors’ emissions, and the number of allowances available for compliance in a given year can exceed the number issued that year, due to the market surplus.
EU INDUSTRY GHG REDUCTION TRAJECTORY 21% reduction in direction emissions by 2020 (compared to 2005)
CO2, N20, and PFC emissions measured in CO2e. Shared with the power sector and affected by the ETS market surplus
43% reduction in direct emissions by 2030 (compared to 2005) CO2, N20, and PFC emissions measured in CO2e.
Shared with the power sector and affected by the ETS market surplus
>80% reduction in direct emissions by 2050 (compared to 1990)
CO2, CH4, N2O, PFCs, SF6, and NF3 measured in CO2e
7
1.3 Promoting industrial energy efficiency
The EU recognises that improving energy efficiency is one of the best ways of reducing
emissions: efficiency is often the cheapest form of abatement, and has the additional
benefits of enhancing competitiveness and bolstering energy security.34 For this reason,
promoting energy efficiency is one of five fundamental goals in the EU’s Energy Union
strategy, and the EU has regularly endorsed the principle of putting ‘efficiency first’ in its
policymaking.35 36
The EU has an overarching target—which is currently on track—to consume 20% less
energy in 2020 compared to projections (PRIMES 2007), and is in the process of
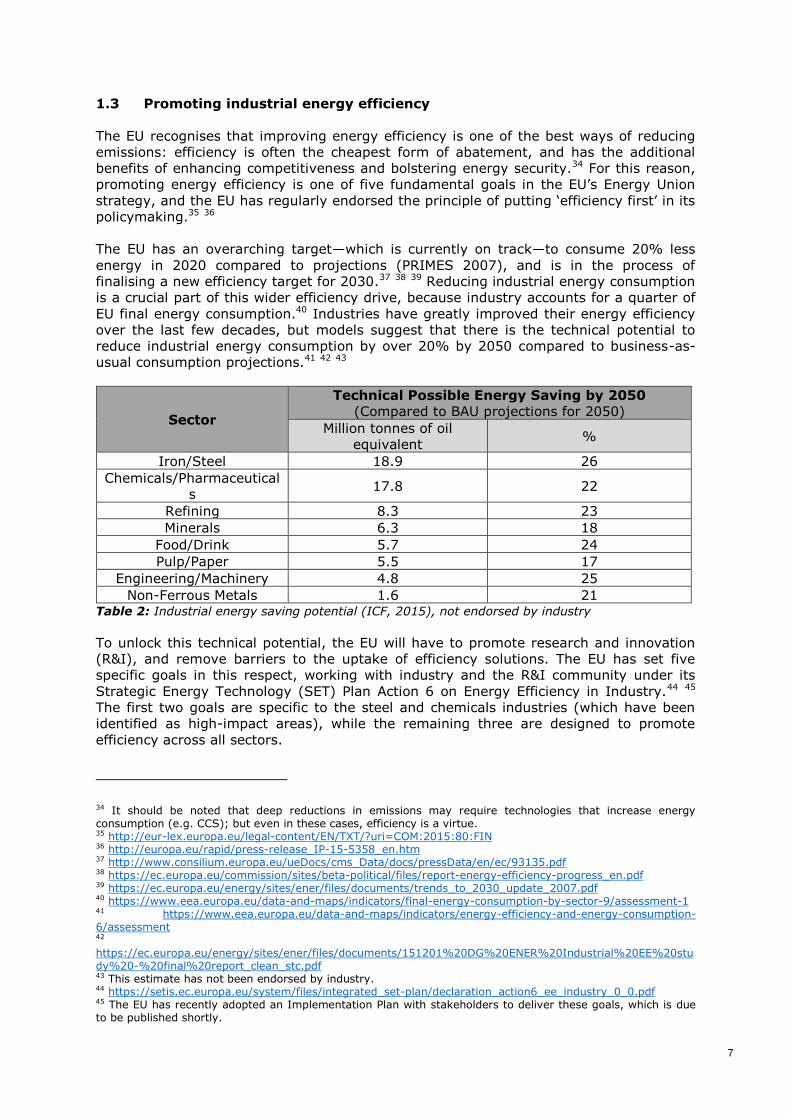
finalising a new efficiency target for 2030.37 38 39 Reducing industrial energy consumption
is a crucial part of this wider efficiency drive, because industry accounts for a quarter of
EU final energy consumption.40 Industries have greatly improved their energy efficiency
over the last few decades, but models suggest that there is the technical potential to
reduce industrial energy consumption by over 20% by 2050 compared to business-as-
usual consumption projections.41 42 43
Sector
Technical Possible Energy Saving by 2050
(Compared to BAU projections for 2050)
Million tonnes of oil
equivalent %
Iron/Steel 18.9 26
Chemicals/Pharmaceutical
s 17.8 22
Refining 8.3 23
Minerals 6.3 18
Food/Drink 5.7 24
Pulp/Paper 5.5 17
Engineering/Machinery 4.8 25
Non-Ferrous Metals 1.6 21 Table 2: Industrial energy saving potential (ICF, 2015), not endorsed by industry
To unlock this technical potential, the EU will have to promote research and innovation
(R&I), and remove barriers to the uptake of efficiency solutions. The EU has set five
specific goals in this respect, working with industry and the R&I community under its
Strategic Energy Technology (SET) Plan Action 6 on Energy Efficiency in Industry.44 45
The first two goals are specific to the steel and chemicals industries (which have been
identified as high-impact areas), while the remaining three are designed to promote
efficiency across all sectors.
34 It should be noted that deep reductions in emissions may require technologies that increase energy consumption (e.g. CCS); but even in these cases, efficiency is a virtue. 35 http://eur-lex.europa.eu/legal-content/EN/TXT/?uri=COM:2015:80:FIN 36 http://europa.eu/rapid/press-release_IP-15-5358_en.htm 37 http://www.consilium.europa.eu/ueDocs/cms_Data/docs/pressData/en/ec/93135.pdf 38 https://ec.europa.eu/commission/sites/beta-political/files/report-energy-efficiency-progress_en.pdf 39 https://ec.europa.eu/energy/sites/ener/files/documents/trends_to_2030_update_2007.pdf 40 https://www.eea.europa.eu/data-and-maps/indicators/final-energy-consumption-by-sector-9/assessment-1 41 https://www.eea.europa.eu/data-and-maps/indicators/energy-efficiency-and-energy-consumption-6/assessment 42 https://ec.europa.eu/energy/sites/ener/files/documents/151201%20DG%20ENER%20Industrial%20EE%20study%20-%20final%20report_clean_stc.pdf 43 This estimate has not been endorsed by industry. 44 https://setis.ec.europa.eu/system/files/integrated_set-plan/declaration_action6_ee_industry_0_0.pdf 45 The EU has recently adopted an Implementation Plan with stakeholders to deliver these goals, which is due to be published shortly.
8
The Energy Efficiency Directive (EED), Industrial Emissions Directive (IED), and
Ecodesign Directive (ED) support the delivery of the EU’s industrial efficiency goals. The
EED allows Member States to count industrial efficiency policies towards energy saving
obligations, and requires large industrial sites to conduct energy audits every four
years.46 The IED sets efficiency standards by requiring Member States to issue permits
for industrial activities according to Best Available Technique reference documents
(BREFs).47 48 And the ED sets standards for energy-related products sold in the EEA,
including industrial equipment such as electric motors, pumps, and fans.49 50
46 http://eur-lex.europa.eu/legal-content/EN/TXT/?uri=celex:32012L0027 47 http://eur-lex.europa.eu/legal-content/EN/TXT/?uri=CELEX:32010L0075 48 http://eippcb.jrc.ec.europa.eu/reference/ 49 http://eur-lex.europa.eu/legal-content/EN/TXT/?uri=CELEX:32009L0125 50 https://ec.europa.eu/energy/sites/ener/files/documents/list_of_ecodesign_measures.pdf
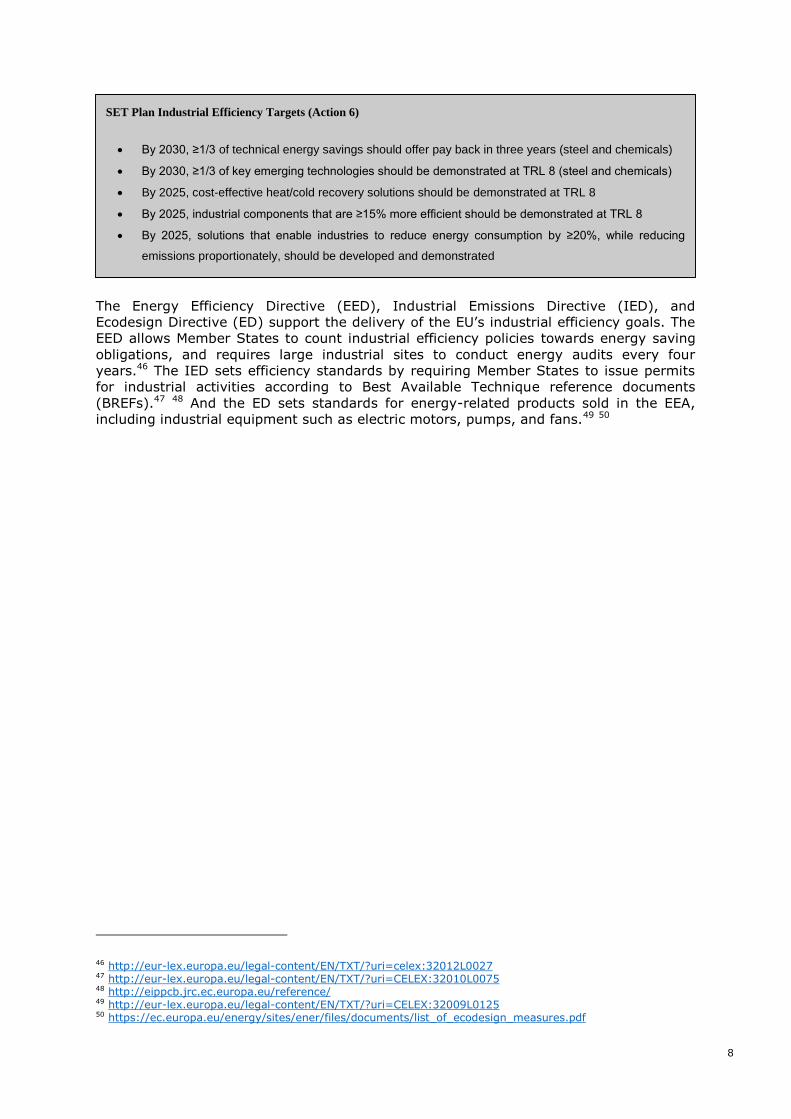
SET Plan Industrial Efficiency Targets (Action 6)
By 2030, ≥1/3 of technical energy savings should offer pay back in three years (steel and chemicals)
By 2030, ≥1/3 of key emerging technologies should be demonstrated at TRL 8 (steel and chemicals)
By 2025, cost-effective heat/cold recovery solutions should be demonstrated at TRL 8
By 2025, industrial components that are ≥15% more efficient should be demonstrated at TRL 8
By 2025, solutions that enable industries to reduce energy consumption by ≥20%, while reducing
emissions proportionately, should be developed and demonstrated
9
1.4 Unlocking the potential of carbon dioxide utilisation
CCU has been acknowledged as an important research priority under the Energy Union,
together with Carbon Capture and Storage (CCS).51 The EU is calling for a forward-
looking approach to CCS and CCU for the power and industrial sectors, which will be
critical to reaching the 2050 climate objectives in a cost-effective way.52 Stepping up
research and innovation activities on the commercial viability of CCU is priority Action 9
of the SET Plan.53 Since COP21, the European Union has been an active member in
Mission Innovation, which aims to double Clean Energy R&D Investment by 2020
compared to 2013-2015 levels. In Mission Innovation, the EU is part of the Clean Energy
R&D Focus Area on CCU and CCS.54
However, it is important to distinguish CCU from CCS: while CCS mitigates climate
change solely through storage, and some CCU technologies also offer permanent CO2
storage in a product (e.g. mineralisation), most CCU technologies aim to reduce CO2
emissions by either increasing resource and energy efficiency compared to current
products (e.g. CO2-based polyols), or by integrating renewable energy into the value
chain (e.g. CO2-based fuels). Most CCU technologies thus try to use less fossil
resources.55 Thereby, fossil carbon would be left in the ground and these CCU
technologies would avoid CO2 emissions compared to current fossil-based practise.
These differences between CCU and CCS have to be recognised to link CCU appropriately
into the policy framework. Member States already employ different approaches to CCU,
e.g. as raw materials or industrial symbiosis technology.56 To shed light on the broader
climate mitigation potential of CCU technologies, the Commission has called upon the
Scientific Advice Mechanism High Level Group, which will study the potential of CCU for
emissions reduction, industrial innovation, and competitiveness of energy-intensive
industries.57
CCU projects have already been granted under Framework Programmes 6 and 7, and
CO2-use-specific calls have been part of the Horizon 2020 programme. In parallel, the
EU Commission started a comprehensive stakeholder dialogue in 2015, with its scoping
workshop ‘Transforming CO2 into value for a rejuvenated European economy’.58 Based
on these actions, potential contributions of CCU technologies to several key EU policy
goals have been identified, such as the transition towards a more circular economy, GHG
mitigation, energy security, and transport emissions reduction, while avoiding any
potential conflict with the food sector. However, since many CCU technologies are rather
novel, further research and development is required to establish competitive
technologies, and to clarify if, how, and which CCU technologies can actually realise
these potential contributions. Beneficial CCU technologies should be integrated into the
existing policy framework according to the mechanism by which they provide benefits.
The transition towards a more circular economy is a key priority for the European
Commission. By turning waste into a resource, the Circular Economy Action Plan aims to
reduce primary resource use and its associated environmental impacts including GHG
emissions, and increase resource security, while boosting the competitiveness of the
European economy.59 Current measures include eco-design, waste prevention, and the
re-use and recycling of products, but the Circular Economy Action Plan also mentions the
51 http://eur-lex.europa.eu/legal-content/en/TXT/?uri=COM%3A2015%3A80%3AFIN 52 http://eur-lex.europa.eu/legal-content/EN/TXT/?uri=CELEX:52015DC0080 53 https://ec.europa.eu/energy/sites/ener/files/documents/1_EN_ACT_part1_v8_0.pdf 54 http://mission-innovation.net/participating-countries/european-union/ 55
The present report discusses only CCU and its potential role in low-carbon industries. The focus on CCU does not imply any statement with respect to CCS and its relative importance in climate change mitigation. 56 E.g. https://www.thyssenkrupp.com/en/carbon2chem/ 57 https://ec.europa.eu/research/sam/index.cfm?pg=ccu
58 https://publications.europa.eu/en/publication-detail/-/publication/a89ae7bf-1bef-407a-9a02-4c76a5b55b49 59 http://eur-lex.europa.eu/legal-content/EN/TXT/?qid=1453384154337&uri=CELEX:52015DC0614
10
re-use of CO2 effluent gases as an innovative production process to be promoted
through R&I funding and Cohesion Policy funds
In a carbon cycle, CO2 captured (i) during the end-of-life treatment of a CCU product,
(ii) via biomass, or (iii) via direct air capture, could be a renewable carbon source and
substitute for conventional (often fossil) raw materials.60 This substitution not only
increases resource security, but can also reduce the emission intensity of value chains.61
In addition, CO2-use technologies, such as mineralisation and enhanced oil recovery,
could store carbon as long as geological storage; thus, eventually even enabling carbon-
negative pathways. However, there is no established monitoring and verification
methodology to ascertain the permanence of storage through mineralisation. In this
context, a first court ruling has recognised that the CO2 used in a precipitated calcium
carbonate product is chemically bound in that stable product, and that the following
provision from the Monitoring and Reporting Regulation 601/2012 is invalid: ‘Where CO2
is used in the plant or transferred to another plant for the production of PCC
(precipitated calcium carbonate), that amount of CO2 shall be considered emitted by the
installation producing the CO2’. Incentives for permanent carbon storage through CO2
use are missing under the current ETS.
CO2 utilisation can also support the integration of renewable energy into the European
energy mix, which is a key priority of the Energy Union and SET Plan. Quantitative
targets and measures have been defined by the Renewable Energy Directive.62 CCU
could help integrate renewables into the energy mix by utilising electricity from
fluctuating renewable sources. In CCU value chains, electricity is commonly used for the
production of hydrogen via electrolysis, which is an important co-reactant for many CO2-
based products, including fuels and bulk chemicals such as methanol and carbon
monoxide. Pathways to hydrogen with low CO2 emissions are therefore a key
prerequisite for many CCU technologies. The flexible use of renewable electricity in CCU
processes could enhance grid stability, and CO2-based fuels could provide both energy
storage and energy transportation. A common methodology to account for grid flexibility
options offered by CCU and power-to-hydrogen in general, however, is currently missing
in the policy framework. Due to the early stage of development, the potential role of
CCU in this context is only emerging.
Current literature suggests that CO2-based fuels require very low-carbon energy to be
less carbon-intensive than fossil fuels.63 According to Life Cycle Assessment (LCA)
literature, the expected EU grid mix in 2050 might still be too carbon-intensive. At the
same time, it has been shown that the current grid mix in several countries is already
sufficient to allow for CO2-based chemicals and fuels with reduced GHG emissions
today.64 65 Valorisation of residual streams with low calorific value by CCU could also
provide promising pathways.66 Properly locating potential production sites for CO2-based
fuels and chemicals therefore seems important. As long as a limited energy input is
used, this planning has to take into account the efficiency in the utilisation of low-carbon
energy for GHG mitigation, which can be high, e.g. if CO2-based production leads to
more energy and resource efficient production. 67 But it can often be lower for CO2 use
than for many competing technologies.68
60 The RED currently specifies renewable carbon only if it comes from sustainable biomass: http://eur-lex.europa.eu/legal-content/EN/ALL/?uri=CELEX%3A32009L0028 61 https://doi.org/10.1039/c4gc00513a 62 http://eur-lex.europa.eu/legal-content/EN/ALL/?uri=CELEX:32009L0028 63 http://dx.doi.org/10.1021/es500191g 64 http://dx.doi.org/10.1021/acs.chemrev.7b00435 65 http://pubs.acs.org/doi/10.1021/acs.chemrev.7b00435 66 https://www.thyssenkrupp.com/de/carbon2chem/ 67 https://doi.org/10.1016/j.jcou.2017.10.001 68 http://dx.doi.org/10.1039/C4EE03051F
11
Fuels from CO2 and renewable energy could help integrate renewable energy into the
transport sector. The Renewable Energy Directive (RED) requires that at least 10% of
the transport fuels in all EU countries come from renewable sources by 2020.69 The
proposal for a revised Renewable Energy Directive (REDII) for the period 2021-2030
includes so-called ‘waste-based fossil fuels’ which could be produced from CO2
processing gases or exhaust gases.70 The Fuel Quality Directive (FQD) requires that the
GHG intensity of transport fuels is reduced by 6% in 2020 from a 2010 baseline.71 In
2015, CO2-based renewable fuels have been further incentivised by a new Directive on
Indirect Land Use Change (ILUC) amending the RED and the FQD.72 This Directive sets
an indicative 0.5% target for so-called advanced biofuels (including CO2-based fuels) as
a reference for national targets, and encourages the use of renewable electricity in
transport by counting it 2.5 times (rail) or 5 times (road) towards the 2020 target of
10% renewable energy use in transport. The Commission is empowered to adopt a
delegated act by the end of 2017, specifying the GHG intensity of novel fuels, including
fuels from CCU. Available LCA calculations undertaken by the Joint Research Centre
(JRC) for this purpose, and in the scientific literature, show that CO2-based fuels have
intrinsically a lower efficiency from renewable energy to mobility than more direct
pathways and that the GHG intensity of these fuels is therefore highly dependent on the
GHG intensity of the electricity used to produce them.73 74
If successful, the large-scale application of CCU technologies could potentially contribute
to lowering the costs of CO2 supply through the implementation and development of a
CO2 supply infrastructure and required technologies. The COSME project on Phase 2 of
the Regional Hot Spot Analysis, and the European Sustainable Chemicals Support
Service (ESCSS) studies infrastructure which is expected to require regionalised and
industrial cross-sectoral collaboration for CCU.75 Infrastructures for CCU and CCS will not
be identical in all details, but the CCU infrastructure would certainly include both CO2
capture facilities and a distribution system. These elements would also be part of an
infrastructure for geological storage of carbon dioxide, which is part of the Energy Union
Strategy for cost-efficient achievement of the 2050 GHG targets. CCU could thus
contribute to reducing the cost of CCS.
These potential contributions of CCU to EU policy areas can be enabled through the
development of innovative technologies to ensure future competitive advantages and
technological leadership in the field of CO2 utilisation in European industry.
69 http://eur-lex.europa.eu/legal-content/EN/ALL/?uri=CELEX%3A32009L0028 70 http://eur-lex.europa.eu/legal-content/EN/TXT/?uri=CELEX:52016PC0767R%2801%29 71 http://eur-lex.europa.eu/legal-content/EN/TXT/?uri=CELEX:32009L0030 72 http://eur-lex.europa.eu/legal-content/EN/TXT/?uri=CELEX%3A32015L1513 73 INFORMAL EXPERT GROUP ON TRANSPOSITION AND HARMONISED IMPLEMENTATION OF COUNCIL DIRECTIVE (EU) 2015/652 AND FUEL QUALITY DIRECTIVE 98/70/EC ARTICLE 7A 74 http://dx.doi.org/10.1021/acs.chemrev.7b00435 75 http://ted.europa.eu/TED/notice/udl?uri=TED:NOTICE:22992-2017:TEXT:EN:HTML
12
2. PORTFOLIO OF EU-FUNDED R&I PROJECTS
This section analyses a portfolio of 546 projects in the fields of energy efficiency and
CCU that the EU has funded since 2007. The projects were selected by reviewing publicly
available data from the EU’s Seventh Framework Programme (FP7), Horizon 2020
(H2020), the Research Fund for Coal and Steel (RFCS), and the Intelligent Energy
Europe programme (IEE). This review identified 559 R&I projects of relevance with a
start date in 2007 or later: 488 concerning energy efficiency, and 71 concerning CCU.
From these, 485 energy efficiency projects and 61 CCU projects were selected for
analysis (546 in total), based on the availability of data. Further details on the
methodology for project selection can be found in Appendix 1.
2.1 Programmes contributing to energy efficiency and CCU
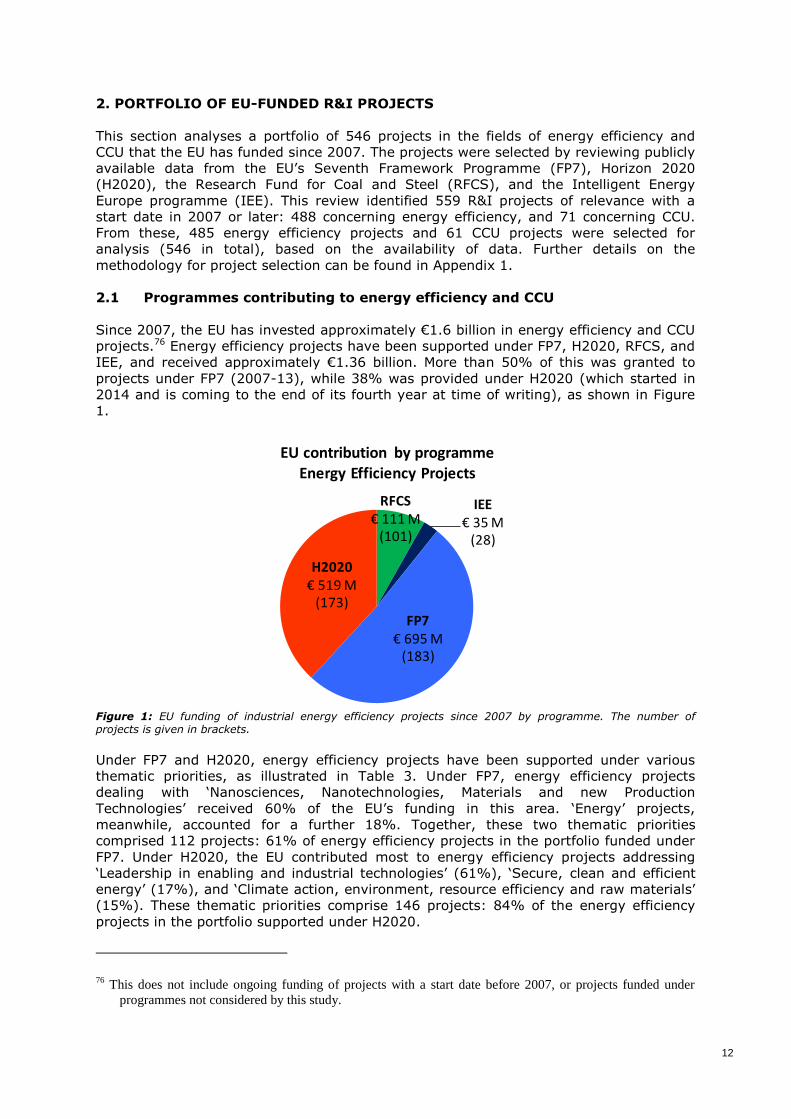
Since 2007, the EU has invested approximately €1.6 billion in energy efficiency and CCU
projects.76 Energy efficiency projects have been supported under FP7, H2020, RFCS, and
IEE, and received approximately €1.36 billion. More than 50% of this was granted to
projects under FP7 (2007-13), while 38% was provided under H2020 (which started in
2014 and is coming to the end of its fourth year at time of writing), as shown in Figure
1.
Figure 1: EU funding of industrial energy efficiency projects since 2007 by programme. The number of projects is given in brackets.
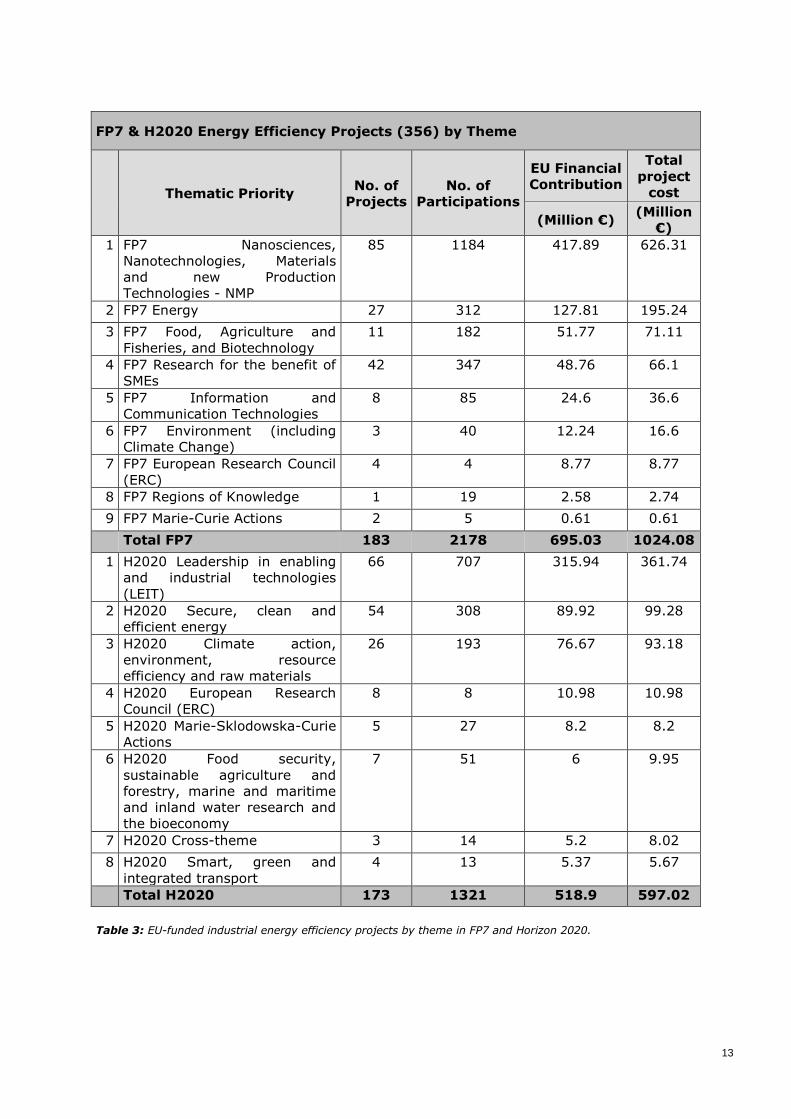
Under FP7 and H2020, energy efficiency projects have been supported under various
thematic priorities, as illustrated in Table 3. Under FP7, energy efficiency projects
dealing with ‘Nanosciences, Nanotechnologies, Materials and new Production
Technologies’ received 60% of the EU’s funding in this area. ‘Energy’ projects,
meanwhile, accounted for a further 18%. Together, these two thematic priorities
comprised 112 projects: 61% of energy efficiency projects in the portfolio funded under
FP7. Under H2020, the EU contributed most to energy efficiency projects addressing
‘Leadership in enabling and industrial technologies’ (61%), ‘Secure, clean and efficient
energy’ (17%), and ‘Climate action, environment, resource efficiency and raw materials’
(15%). These thematic priorities comprise 146 projects: 84% of the energy efficiency
projects in the portfolio supported under H2020.
76 This does not include ongoing funding of projects with a start date before 2007, or projects funded under
programmes not considered by this study.
RFCS€ 111 M
(101)
IEE€ 35 M
(28)
FP7€ 695 M
(183)
H2020€ 519 M
(173)
EU contribution by programme Energy Efficiency Projects
13
FP7 & H2020 Energy Efficiency Projects (356) by Theme
Thematic Priority No. of
Projects
No. of
Participations
EU Financial
Contribution
Total
project
cost
(Million €) (Million
€)
1 FP7 Nanosciences,
Nanotechnologies, Materials
and new Production
Technologies - NMP
85 1184 417.89 626.31
2 FP7 Energy 27 312 127.81 195.24
3 FP7 Food, Agriculture and
Fisheries, and Biotechnology
11 182 51.77 71.11
4 FP7 Research for the benefit of
SMEs
42 347 48.76 66.1
5 FP7 Information and
Communication Technologies
8 85 24.6 36.6
6 FP7 Environment (including
Climate Change)
3 40 12.24 16.6
7 FP7 European Research Council
(ERC)
4 4 8.77 8.77
8 FP7 Regions of Knowledge 1 19 2.58 2.74
9 FP7 Marie-Curie Actions 2 5 0.61 0.61
Total FP7 183 2178 695.03 1024.08
1 H2020 Leadership in enabling
and industrial technologies
(LEIT)
66 707 315.94 361.74
2 H2020 Secure, clean and
efficient energy
54 308 89.92 99.28
3 H2020 Climate action,
environment, resource
efficiency and raw materials
26 193 76.67 93.18
4 H2020 European Research
Council (ERC)
8 8 10.98 10.98
5 H2020 Marie-Sklodowska-Curie
Actions
5 27 8.2 8.2
6 H2020 Food security,
sustainable agriculture and
forestry, marine and maritime
and inland water research and
the bioeconomy
7 51 6 9.95
7 H2020 Cross-theme 3 14 5.2 8.02
8 H2020 Smart, green and
integrated transport
4 13 5.37 5.67
Total H2020 173 1321 518.9 597.02
Table 3: EU-funded industrial energy efficiency projects by theme in FP7 and Horizon 2020.
14
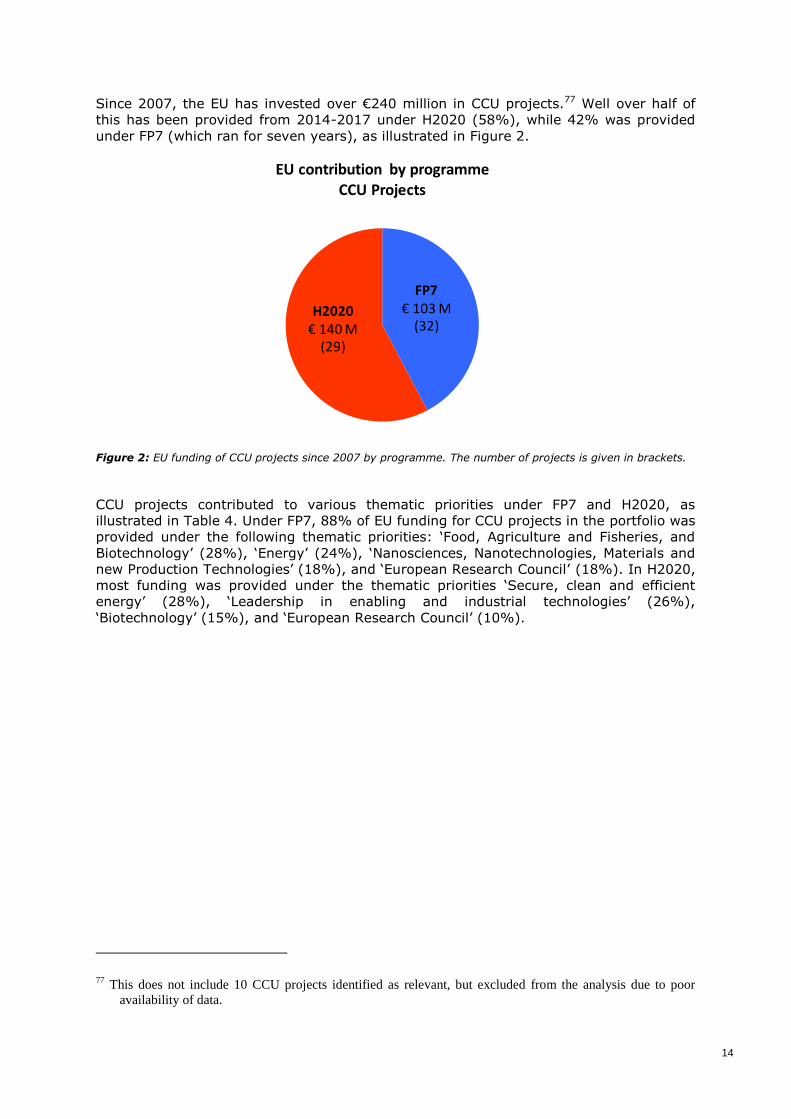
Since 2007, the EU has invested over €240 million in CCU projects.77 Well over half of
this has been provided from 2014-2017 under H2020 (58%), while 42% was provided
under FP7 (which ran for seven years), as illustrated in Figure 2.
Figure 2: EU funding of CCU projects since 2007 by programme. The number of projects is given in brackets.
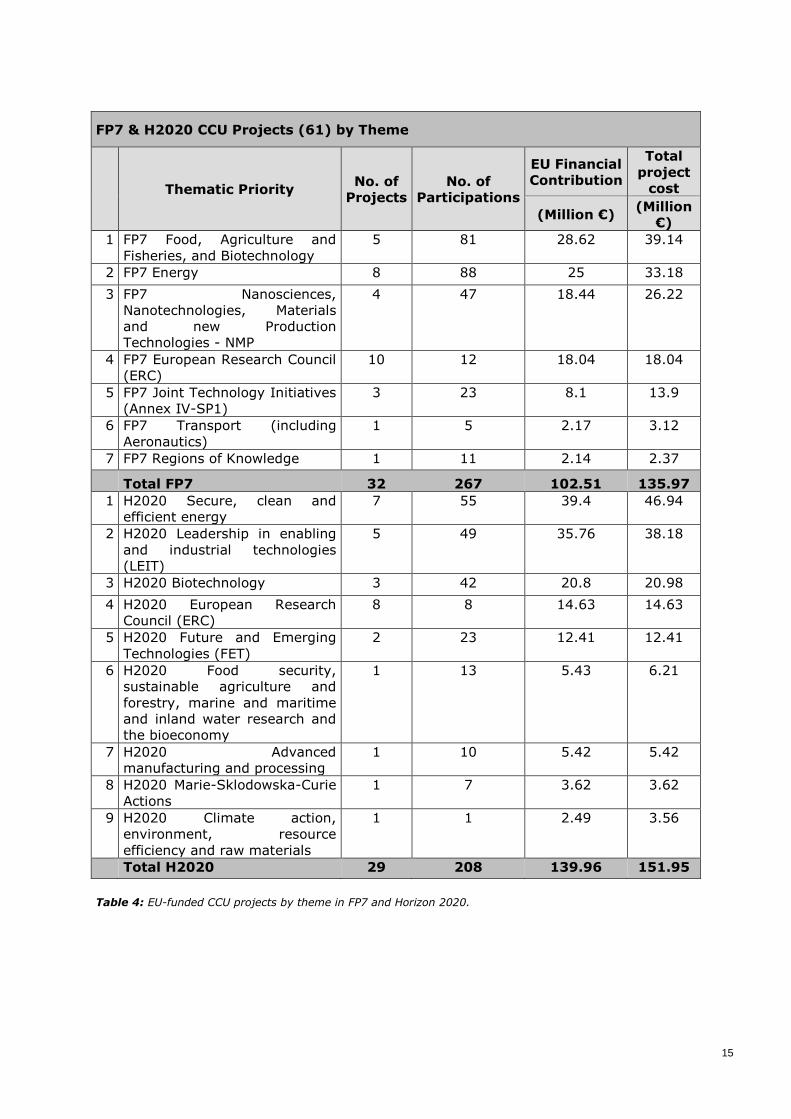
CCU projects contributed to various thematic priorities under FP7 and H2020, as
illustrated in Table 4. Under FP7, 88% of EU funding for CCU projects in the portfolio was
provided under the following thematic priorities: ‘Food, Agriculture and Fisheries, and
Biotechnology’ (28%), ‘Energy’ (24%), ‘Nanosciences, Nanotechnologies, Materials and
new Production Technologies’ (18%), and ‘European Research Council’ (18%). In H2020,
most funding was provided under the thematic priorities ‘Secure, clean and efficient
energy’ (28%), ‘Leadership in enabling and industrial technologies’ (26%),
‘Biotechnology’ (15%), and ‘European Research Council’ (10%).
77 This does not include 10 CCU projects identified as relevant, but excluded from the analysis due to poor
availability of data.
FP7€ 103 M
(32)H2020
€ 140 M (29)
EU contribution by programme CCU Projects
15
FP7 & H2020 CCU Projects (61) by Theme
Thematic Priority No. of
Projects
No. of
Participations
EU Financial
Contribution
Total
project
cost
(Million €) (Million
€)
1 FP7 Food, Agriculture and
Fisheries, and Biotechnology
5 81 28.62 39.14
2 FP7 Energy 8 88 25 33.18
3 FP7 Nanosciences,
Nanotechnologies, Materials
and new Production
Technologies - NMP
4 47 18.44 26.22
4 FP7 European Research Council
(ERC)
10 12 18.04 18.04
5 FP7 Joint Technology Initiatives
(Annex IV-SP1)
3 23 8.1 13.9
6 FP7 Transport (including
Aeronautics)
1 5 2.17 3.12
7 FP7 Regions of Knowledge 1 11 2.14 2.37
Total FP7 32 267 102.51 135.97
1 H2020 Secure, clean and
efficient energy
7 55 39.4 46.94
2 H2020 Leadership in enabling
and industrial technologies
(LEIT)
5 49 35.76 38.18
3 H2020 Biotechnology 3 42 20.8 20.98
4 H2020 European Research
Council (ERC)
8 8 14.63 14.63
5 H2020 Future and Emerging
Technologies (FET)
2 23 12.41 12.41
6 H2020 Food security,
sustainable agriculture and
forestry, marine and maritime
and inland water research and
the bioeconomy
1 13 5.43 6.21
7 H2020 Advanced
manufacturing and processing
1 10 5.42 5.42
8 H2020 Marie-Sklodowska-Curie
Actions
1 7 3.62 3.62
9 H2020 Climate action,
environment, resource
efficiency and raw materials
1 1 2.49 3.56
Total H2020 29 208 139.96 151.95
Table 4: EU-funded CCU projects by theme in FP7 and Horizon 2020.
16
EU
fundin
g i
n m
illi
on €
E
U f
undin
g i
n m
illi
on €
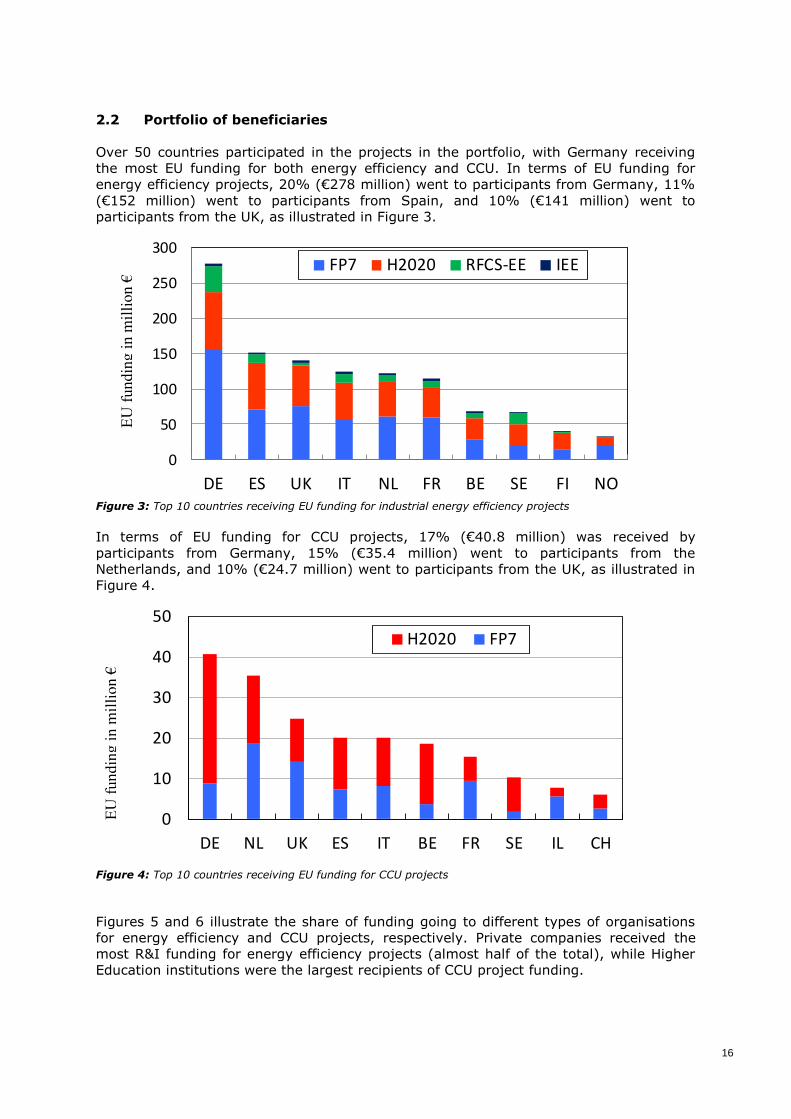
2.2 Portfolio of beneficiaries
Over 50 countries participated in the projects in the portfolio, with Germany receiving
the most EU funding for both energy efficiency and CCU. In terms of EU funding for
energy efficiency projects, 20% (€278 million) went to participants from Germany, 11%
(€152 million) went to participants from Spain, and 10% (€141 million) went to
participants from the UK, as illustrated in Figure 3.
Figure 3: Top 10 countries receiving EU funding for industrial energy efficiency projects
In terms of EU funding for CCU projects, 17% (€40.8 million) was received by
participants from Germany, 15% (€35.4 million) went to participants from the
Netherlands, and 10% (€24.7 million) went to participants from the UK, as illustrated in
Figure 4.
Figure 4: Top 10 countries receiving EU funding for CCU projects
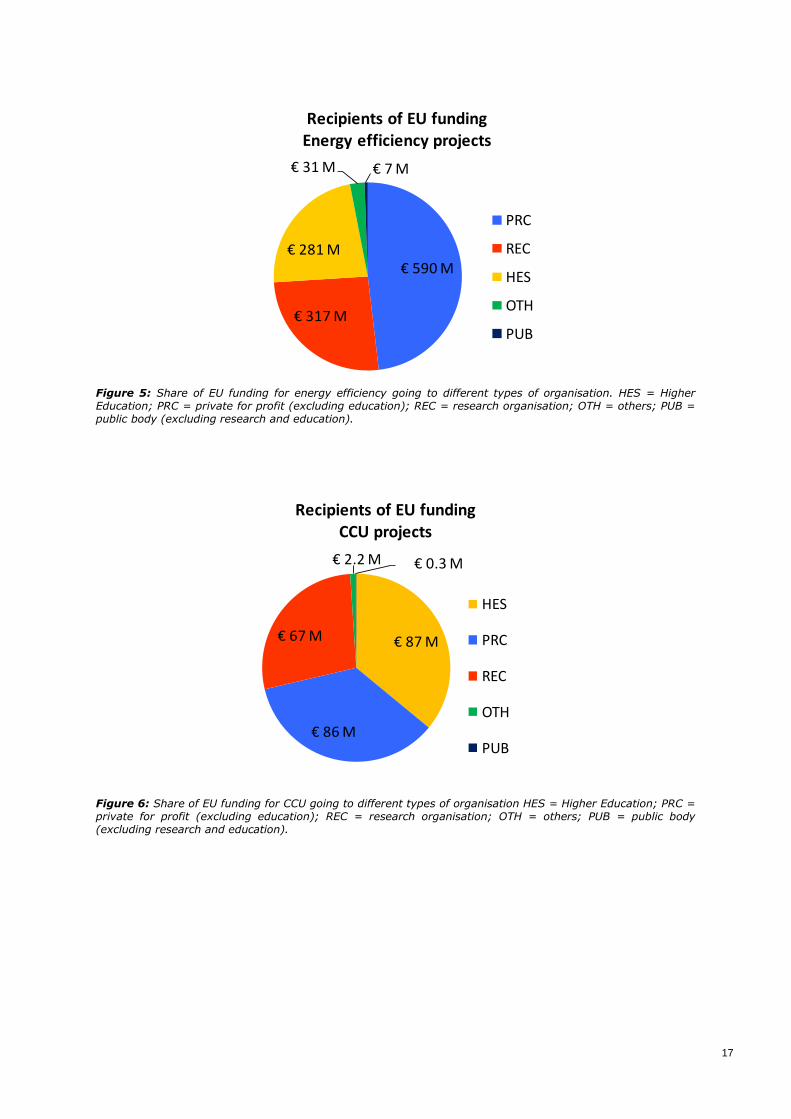
Figures 5 and 6 illustrate the share of funding going to different types of organisations
for energy efficiency and CCU projects, respectively. Private companies received the
most R&I funding for energy efficiency projects (almost half of the total), while Higher
Education institutions were the largest recipients of CCU project funding.
0
50
100
150
200
250
300
DE ES UK IT NL FR BE SE FI NO
FP7 H2020 RFCS-EE IEE
0
10
20
30
40
50
DE NL UK ES IT BE FR SE IL CH
H2020 FP7
17
Figure 5: Share of EU funding for energy efficiency going to different types of organisation. HES = Higher Education; PRC = private for profit (excluding education); REC = research organisation; OTH = others; PUB = public body (excluding research and education).
Figure 6: Share of EU funding for CCU going to different types of organisation HES = Higher Education; PRC = private for profit (excluding education); REC = research organisation; OTH = others; PUB = public body (excluding research and education).
€ 590 M
€ 317 M
€ 281 M
€ 31 M € 7 M
Recipients of EU fundingEnergy efficiency projects
PRC
REC
HES
OTH
PUB
€ 87 M
€ 86 M
€ 67 M
€ 2.2 M € 0.3 M
Recipients of EU fundingCCU projects
HES
PRC
REC
OTH
PUB
18
3. IMPACT OF R&I FUNDING ON EU POLICY GOALS
The impacts and results of EU-funded projects on energy efficiency and CO2 utilisation
for policies have been assessed based on the project reports and the self-assessments
provided in the SPIRE progress monitoring report and our survey.78 Our survey has been
conducted for this report to gauge project impact with respect to policy objectives (for
further details see Appendix 2). The information provided by the projects has been
checked against the literature where possible, but it is important to note that the
quantitative data presented are based on self-assessments by the projects in our survey,
which has to be taken into account when interpreting the figures.79 We also caution that
the projects are at different stages, and concern technologies at different TRLs, which
means that the self-assessments involve varying degrees of uncertainty. Furthermore,
projects were asked to provide proportional estimates of impacts compared to current
practice, which they were free to define as they felt appropriate, which means that
conclusions cannot be drawn about absolute impacts. The following presentation
analyses the transfer of policy-relevant innovation to market and the value of topical
clusters of R&I activity results for the policy challenges identified in Section 1.
3.1 Supporting the transfer of policy-relevant innovations to market
It is evident from our survey that the EU has funded energy efficiency and carbon
dioxide utilisation projects at all stages of development, supporting their technological
progression and creating a pipeline for the commercialisation of policy-relevant
innovations. Projects that responded to the survey addressed technologies at all TRLs
(1–9), with an average of 5.1.80 Energy efficiency projects averaged 5.3, and carbon
dioxide utilisation projects a less mature 3.8. Projects that provided information in this
area expected a TRL increase of 2.3 on average, which was consistent across different
technologies, ranging from catalysis and advanced materials, to monitoring and process
control. For carbon dioxide utilisation, EU project funding has been particularly important
for de-risking early stage research: 87% of the responding CCU projects addressed
technologies at TRL3 or less, whereas only 11% of efficiency projects included such early
stage technologies. In this regard, EU funding has followed the technology maturity
curve.
78 https://www.spire2030.eu/ 79 Not least because the survey was conducted under the aegis of the Commission, which also finances the projects. 80 Average values reported for our survey are based on the responses to the corresponding questions. Non-responses were not taken into account since the reason for non-response is not given, even though this approach might lead to bias in the average value.
19
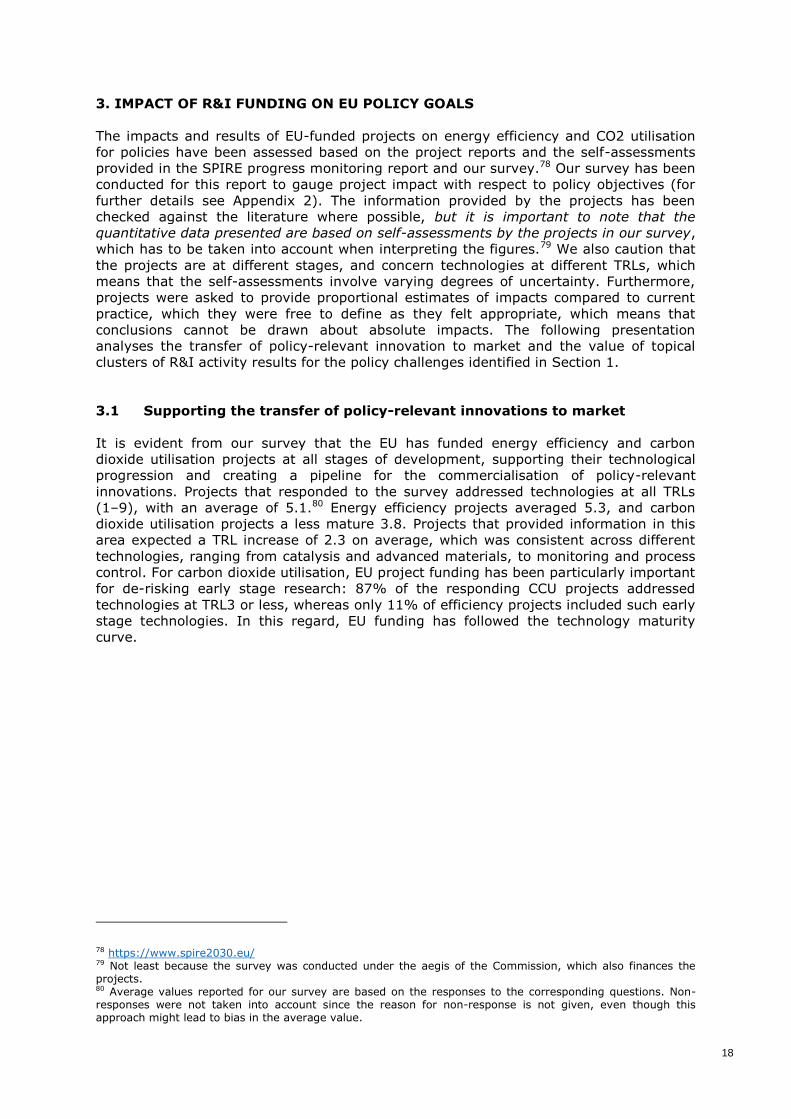
TRL spread of R&I funding
Figure 7: Technology readiness level (TRL) at project start for technologies considered by projects, as reported by the projects in our survey. 202 projects responded to this question. Projects could report several technologies and their TRLs.
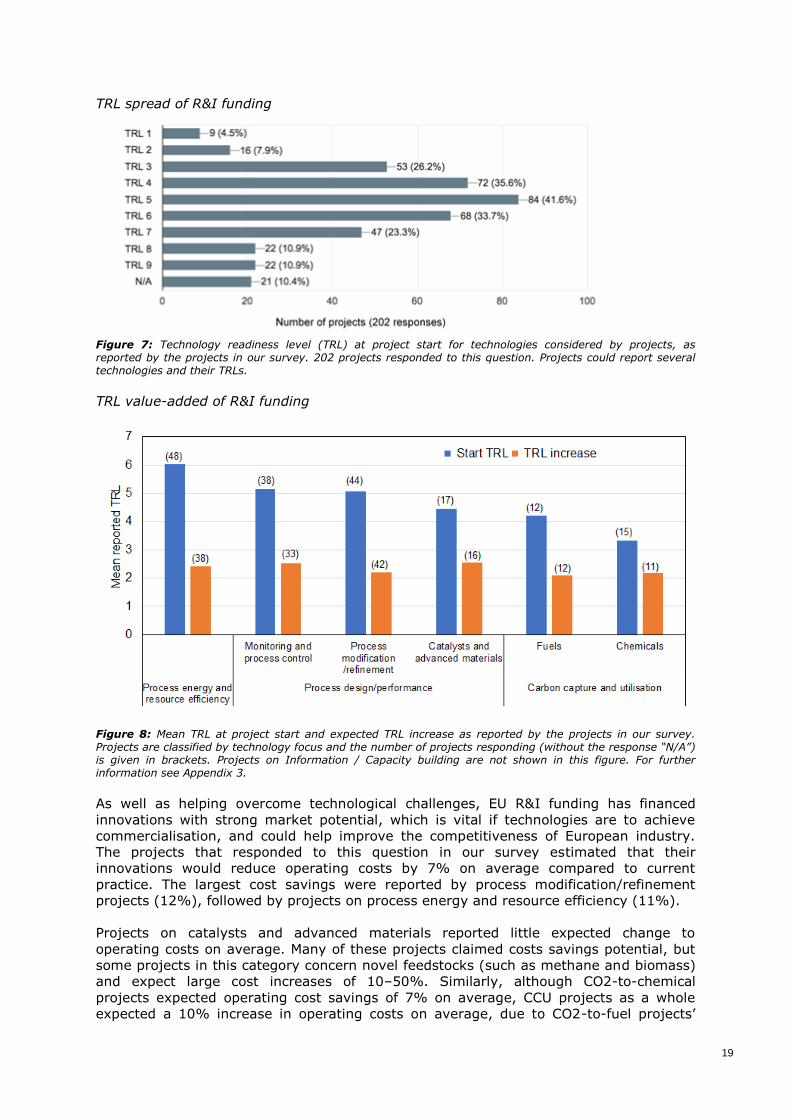
TRL value-added of R&I funding
Figure 8: Mean TRL at project start and expected TRL increase as reported by the projects in our survey. Projects are classified by technology focus and the number of projects responding (without the response “N/A”) is given in brackets. Projects on Information / Capacity building are not shown in this figure. For further information see Appendix 3.
As well as helping overcome technological challenges, EU R&I funding has financed
innovations with strong market potential, which is vital if technologies are to achieve
commercialisation, and could help improve the competitiveness of European industry.
The projects that responded to this question in our survey estimated that their
innovations would reduce operating costs by 7% on average compared to current
practice. The largest cost savings were reported by process modification/refinement
projects (12%), followed by projects on process energy and resource efficiency (11%).
Projects on catalysts and advanced materials reported little expected change to
operating costs on average. Many of these projects claimed costs savings potential, but
some projects in this category concern novel feedstocks (such as methane and biomass)
and expect large cost increases of 10–50%. Similarly, although CO2-to-chemical
projects expected operating cost savings of 7% on average, CCU projects as a whole
expected a 10% increase in operating costs on average, due to CO2-to-fuel projects’
20
large requirement for renewable energy. Due to the low TRL and recent start dates of
the CCU projects, however, these figures must be treated more cautiously.
Beyond merely providing financing, EU R&I support has fostered connections between
industry, research institutions, and government, which are vital to the commercialisation
of innovations. Many projects have taken a value chain approach, including all
stakeholders to ensure rapid technology development and fast deployment. In total,
2,636 unique participants worked on the projects considered by this report, with 17%
and 21% of new participants integrated into the H2020 funding programs for energy
efficiency and CO2 use, respectively. Their interaction is facilitated through broader
platforms such as SPIRE. A broader platform has also been established by the Climate-
KIC flagship enCO2re.
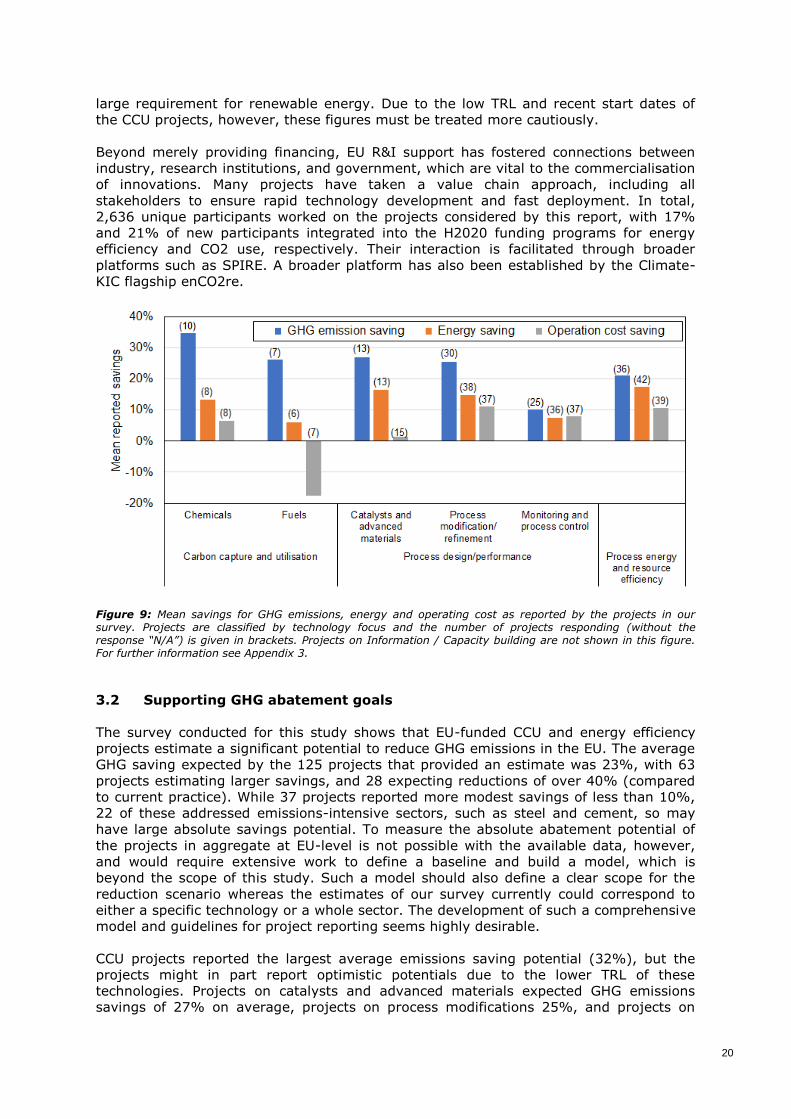
Figure 9: Mean savings for GHG emissions, energy and operating cost as reported by the projects in our survey. Projects are classified by technology focus and the number of projects responding (without the response “N/A”) is given in brackets. Projects on Information / Capacity building are not shown in this figure. For further information see Appendix 3.
3.2 Supporting GHG abatement goals
The survey conducted for this study shows that EU-funded CCU and energy efficiency
projects estimate a significant potential to reduce GHG emissions in the EU. The average
GHG saving expected by the 125 projects that provided an estimate was 23%, with 63
projects estimating larger savings, and 28 expecting reductions of over 40% (compared
to current practice). While 37 projects reported more modest savings of less than 10%,
22 of these addressed emissions-intensive sectors, such as steel and cement, so may
have large absolute savings potential. To measure the absolute abatement potential of
the projects in aggregate at EU-level is not possible with the available data, however,
and would require extensive work to define a baseline and build a model, which is
beyond the scope of this study. Such a model should also define a clear scope for the
reduction scenario whereas the estimates of our survey currently could correspond to
either a specific technology or a whole sector. The development of such a comprehensive
model and guidelines for project reporting seems highly desirable.
CCU projects reported the largest average emissions saving potential (32%), but the
projects might in part report optimistic potentials due to the lower TRL of these
technologies. Projects on catalysts and advanced materials expected GHG emissions
savings of 27% on average, projects on process modifications 25%, and projects on
21
energy and resource efficiency 21%. Lower average GHG savings are reported by
projects concerning monitoring and process control (10%), but these predominantly
addressed large-scale processes where absolute savings could be more significant (e.g.
24 out of the 42 projects addressed the sectors iron/steel and cement).
While the average GHG saving reported by the projects is lower than the Commission’s
2011 Roadmap target to reduce industrial emissions by at least 80% by 2050, we should
bear in mind that this target is set based on a 1990 baseline, while the projects were
responding compared to current practice, which is already almost halfway towards the
target. Furthermore, energy efficiency is usually a result of several technological steps
and in this regard, the projects provide significant steps. In addition, several projects
have been funded that could deliver very significant savings.
Of the six technology-oriented projects reporting the largest GHG emission savings
(>80% compared to the relevant current practices in the EU), four projects addressed
production, recycling and replacement of critical and rare materials (CritCat,
REMAGHIC), and production of chemicals and fuels based on renewable energy (SUN-to-
LIQUID, CO2EXIDE). Projects addressing electro-winning routes to steel (IERO,
SIDERWIN) also reported potential to reduce emissions by 71-80% compared to current
practices. All of these projects are, however, at an early stage or low TRL. Further
technologies related to integrating renewable energy into the fuel, chemical, and steel
sectors were prominent among the projects stating larger GHG emissions savings. These
stated breakthroughs, however, critically rely on the availability of electricity with a low
or very low carbon footprint as an enabling technology.
3.3 Supporting industrial efficiency goals
It is evident from our survey that EU-funded R&I projects estimate a significant potential
to help deliver industrial energy efficiency goals. Over 70% of respondents (146 projects
in total) were able to estimate their energy saving potential.81 Of these, 59% expected
energy savings of over 10% compared to current practice, 36% expected savings over
20%, and 23% expected savings over 30%. More than half of these projects addressed
technologies with a TRL of 8, which supports the demonstration targets of Action 6 of the
SET Plan. Energy and resource efficiency projects reported the largest energy savings
with 17% on average, followed by projects concerning process design/performance with
12% energy savings on average. Projects concerned with large-scale energy-intensive
industries, such as steel and cement, reported lower relative emissions savings on
average, but these could still lead to large absolute savings.82 Interestingly, 14 projects
on carbon dioxide utilisation responded regarding energy efficiency and estimated
energy savings of 10% on average.
81 Our survey did not ask respondents to specify the type of energy saved (primary, final, fossil, etc), which should be borne in mind when interpreting the results. 82 Most respondents to the survey did not provide absolute saving estimates, however, and the scale of savings cannot be accurately inferred from sector alone, which should be borne in mind when interpreting the results.
22
Energy saving compared to relevant current
practices in the EU
Num
ber
of
pro
ject
s
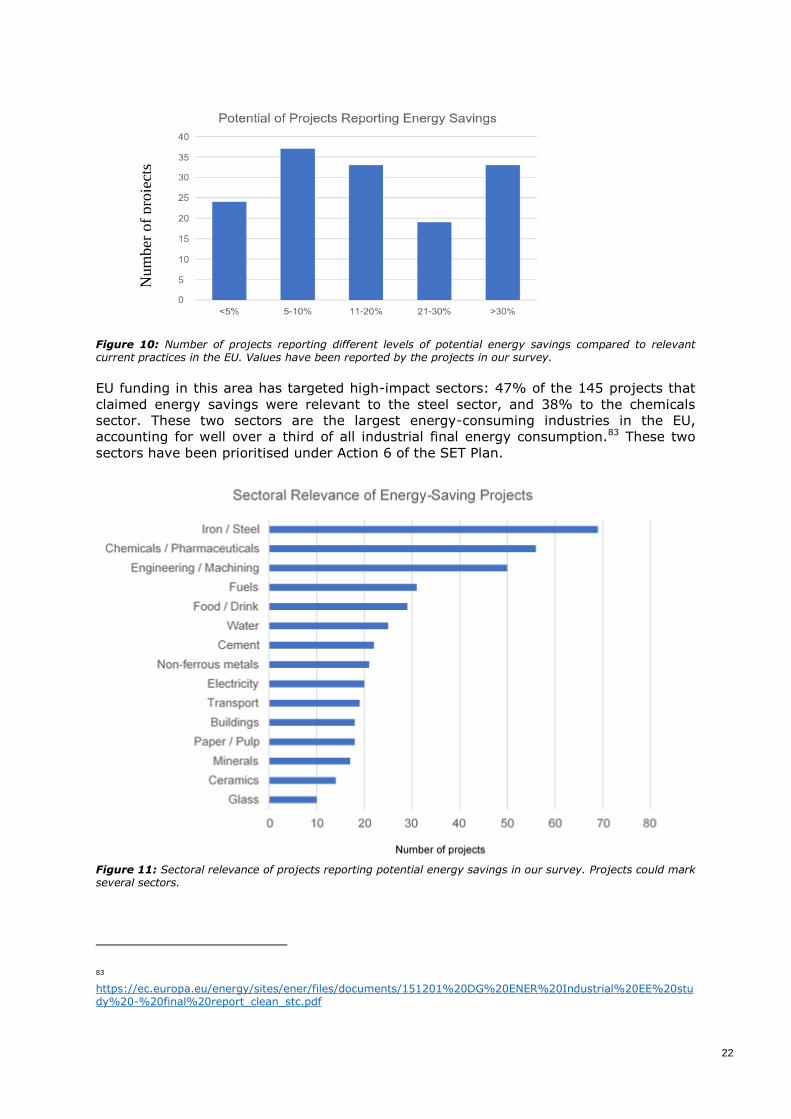
Figure 10: Number of projects reporting different levels of potential energy savings compared to relevant current practices in the EU. Values have been reported by the projects in our survey.
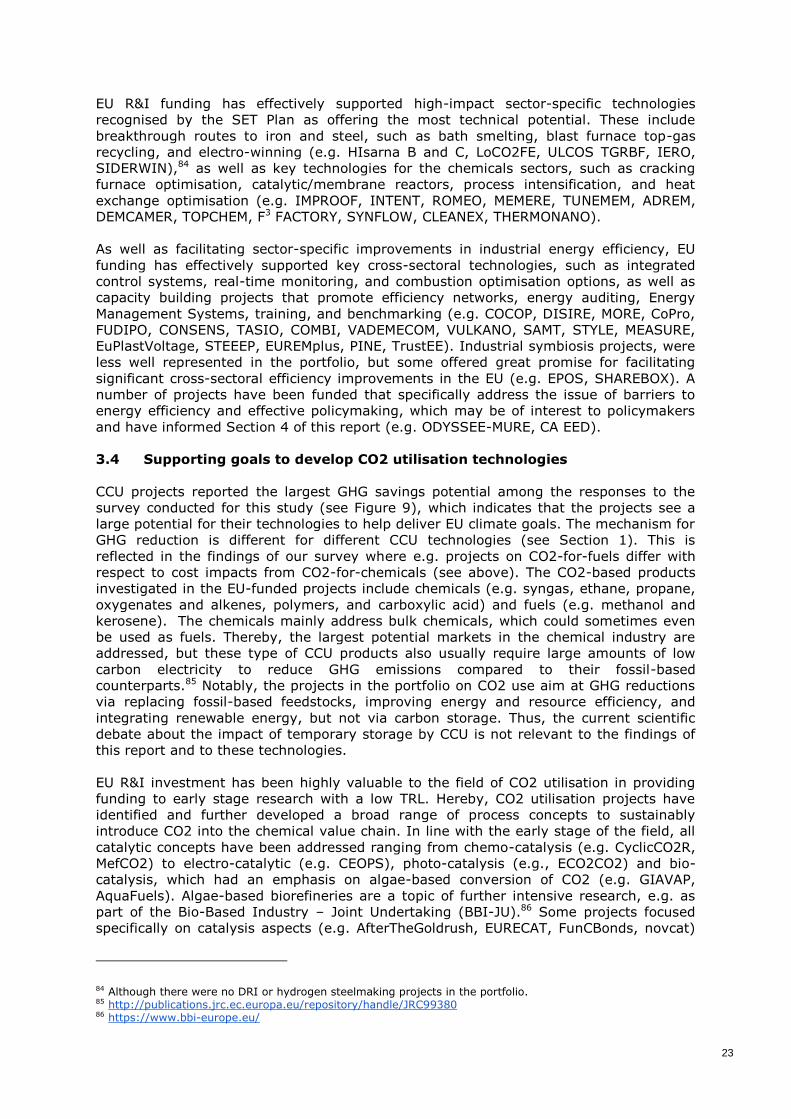
EU funding in this area has targeted high-impact sectors: 47% of the 145 projects that
claimed energy savings were relevant to the steel sector, and 38% to the chemicals
sector. These two sectors are the largest energy-consuming industries in the EU,
accounting for well over a third of all industrial final energy consumption.83 These two
sectors have been prioritised under Action 6 of the SET Plan.
Figure 11: Sectoral relevance of projects reporting potential energy savings in our survey. Projects could mark several sectors.
83 https://ec.europa.eu/energy/sites/ener/files/documents/151201%20DG%20ENER%20Industrial%20EE%20study%20-%20final%20report_clean_stc.pdf
23
EU R&I funding has effectively supported high-impact sector-specific technologies
recognised by the SET Plan as offering the most technical potential. These include
breakthrough routes to iron and steel, such as bath smelting, blast furnace top-gas
recycling, and electro-winning (e.g. HIsarna B and C, LoCO2FE, ULCOS TGRBF, IERO,
SIDERWIN),84 as well as key technologies for the chemicals sectors, such as cracking
furnace optimisation, catalytic/membrane reactors, process intensification, and heat
exchange optimisation (e.g. IMPROOF, INTENT, ROMEO, MEMERE, TUNEMEM, ADREM,
DEMCAMER, TOPCHEM, F3 FACTORY, SYNFLOW, CLEANEX, THERMONANO).
As well as facilitating sector-specific improvements in industrial energy efficiency, EU
funding has effectively supported key cross-sectoral technologies, such as integrated
control systems, real-time monitoring, and combustion optimisation options, as well as
capacity building projects that promote efficiency networks, energy auditing, Energy
Management Systems, training, and benchmarking (e.g. COCOP, DISIRE, MORE, CoPro,
FUDIPO, CONSENS, TASIO, COMBI, VADEMECOM, VULKANO, SAMT, STYLE, MEASURE,
EuPlastVoltage, STEEEP, EUREMplus, PINE, TrustEE). Industrial symbiosis projects, were
less well represented in the portfolio, but some offered great promise for facilitating
significant cross-sectoral efficiency improvements in the EU (e.g. EPOS, SHAREBOX). A
number of projects have been funded that specifically address the issue of barriers to
energy efficiency and effective policymaking, which may be of interest to policymakers
and have informed Section 4 of this report (e.g. ODYSSEE-MURE, CA EED).
3.4 Supporting goals to develop CO2 utilisation technologies
CCU projects reported the largest GHG savings potential among the responses to the
survey conducted for this study (see Figure 9), which indicates that the projects see a
large potential for their technologies to help deliver EU climate goals. The mechanism for
GHG reduction is different for different CCU technologies (see Section 1). This is
reflected in the findings of our survey where e.g. projects on CO2-for-fuels differ with
respect to cost impacts from CO2-for-chemicals (see above). The CO2-based products
investigated in the EU-funded projects include chemicals (e.g. syngas, ethane, propane,
oxygenates and alkenes, polymers, and carboxylic acid) and fuels (e.g. methanol and
kerosene). The chemicals mainly address bulk chemicals, which could sometimes even
be used as fuels. Thereby, the largest potential markets in the chemical industry are
addressed, but these type of CCU products also usually require large amounts of low
carbon electricity to reduce GHG emissions compared to their fossil-based
counterparts.85 Notably, the projects in the portfolio on CO2 use aim at GHG reductions
via replacing fossil-based feedstocks, improving energy and resource efficiency, and
integrating renewable energy, but not via carbon storage. Thus, the current scientific
debate about the impact of temporary storage by CCU is not relevant to the findings of
this report and to these technologies.
EU R&I investment has been highly valuable to the field of CO2 utilisation in providing
funding to early stage research with a low TRL. Hereby, CO2 utilisation projects have
identified and further developed a broad range of process concepts to sustainably
introduce CO2 into the chemical value chain. In line with the early stage of the field, all
catalytic concepts have been addressed ranging from chemo-catalysis (e.g. CyclicCO2R,
MefCO2) to electro-catalytic (e.g. CEOPS), photo-catalysis (e.g., ECO2CO2) and bio-
catalysis, which had an emphasis on algae-based conversion of CO2 (e.g. GIAVAP,
AquaFuels). Algae-based biorefineries are a topic of further intensive research, e.g. as
part of the Bio-Based Industry – Joint Undertaking (BBI-JU).86 Some projects focused
specifically on catalysis aspects (e.g. AfterTheGoldrush, EURECAT, FunCBonds, novcat)
84 Although there were no DRI or hydrogen steelmaking projects in the portfolio. 85 http://publications.jrc.ec.europa.eu/repository/handle/JRC99380 86 https://www.bbi-europe.eu/
24
or CO2 capture (e.g. NoCO2, CaOling, IOLICAP, CAPSOL, RECaL, ASC2), while other
projects consider the entire value chain from feedstock supply to the final product (e.g.
DirectFuel, MIRACLES, BioWalk4Biofuels). Key breakthroughs towards the development
of carbon dioxide technologies have also been achieved in various projects with
demonstration of novel technologies in continuous production (e.g. CyclicCO2R,
ECO2CO2) and along the full value chain (e.g. SOLAR-JET).
EU funding not only supported the technological development of the field, but also the
development of an understanding of the potential of CCU for policy challenges. In this
regard, information-oriented projects like SCOT as well as reports and studies on
CCU (e.g. by JRC, Carbon Count/Ecofys’ 2013 study for DG Climate Action) have been
very valuable to provide techno-economic and environmental assessments, and to
propose action plans for policy.87 88 For carbon dioxide utilisation, Climate-KIC
established the flagship enCO2re to fund research with a focus on valorisation and has
also had a strong impact on start-up development, while also serving as a technology
platform and supporting knowledge dissemination.89 The SCOT project has developed a
Joint Action Plan for Smart CO2 Transformation in Europe90. Through this better
understanding, the critical needs of certain CCU technologies, e.g. for clean electricity,
have been identified as well as further promising options for CO2 utilisations beyond the
fuel and bulk chemical market. The EU-funding portfolio has therefore been expanded to
integrate projects offering high GHG savings while also reducing operation cost, albeit in
smaller markets than fuels (e.g. Carbon4PUR). CO2 conversion and valorisation by
mineralisation has already been recognised as highly promising since it could offer both
valuable products, e.g. for the building sector, and carbon storage.91 Still, CO2
valorisation by mineralisation is still largely unexplored.
The EU-funded projects have also provided significant support for policy implementation
by identifying current barriers for the large-scale implementation of CO2 utilisation. The
major barriers for CO2 utilisation projects are the low price of fossil feedstocks (DEMA,
ECO2CO2), the often higher operating costs, and the low price of the substitute fossil-
based products. The projects draw attention to their need for an explicit definition of the
role of captured and avoided CO2 by utilisation in the current phase of the EU ETS
scheme and for agreed rules for life-cycle assessment (LCA) specific to CCU
technologies. These insights have been picked up in the current revision of the Fuel
Quality Directive, which will include CO2-based fuels and where the greenhouse gas
intensity of novel transport fuels will be calculated through a common LCA methodology.
A workshop series has also been started on the definition of LCA for CCU.92
87 http://publications.jrc.ec.europa.eu/repository/handle/JRC99380 88 https://www.ecofys.com/en/project/assessing-co2-reuse-technologies/ 89 http://enco2re.climate-kic.org/ 90 www.scotproject.org/images/SCOT%20JAP.pdf 91 http://publications.jrc.ec.europa.eu/repository/bitstream/JRC86324/co2%20re-use%20workshop%20report__isbn__online__eur__pages.pdf 92 https://ec.europa.eu/energy/en/content/workshop-life-cycle-analysis-carbon-capture-utilisation-6-june-2017
25
4. POLICY RECOMMENDATIONS
Having outlined the potential of the projects in the study portfolio, this section seeks to
identify non-technological barriers to realising this potential, and recommend policy
approaches that could alleviate these barriers to help deliver the policy challenges
identified in Section 1.
Four broad policy recommendations are set out below with accompanying measures.
These have been derived directly from the projects in the portfolio. Firstly, through the
survey conducted for this study, which asked Project Coordinators what they thought
would be the most significant barriers and beneficial policies for their projects’
innovations up to 2050.93 And secondly through analysing specific learnings from
relevant projects in the portfolio. This was then complemented with a review of the
recent white and grey literature, and consultation with stakeholders at a workshop, to
turn the information from the projects into more concrete and evidenced
recommendations for policymakers’ consideration. (For further information on the survey
please see Appendices 2–5.)
The recommendations have been designed to be barrier-responsive, and focus on high-
impact interventions, while remaining consistent with existing EU policies, and respecting
instrument-neutrality.
93 Survey participants were asked to provide their long-term view on barriers and policies up to 2050, so as to
capture issues relevant to the market uptake stage as well as the R&I stage. This is a speculative exercise (especially for projects with a lower TRL) and we should bear in mind that Coordinators are (typically) not decision-makers within companies, nor policy experts. Nevertheless, it is assumed that they are an informed audience that is relatively well placed to provide a view on barriers and policies in relation to their own innovations, which may be of interest to policymakers.
26
4.1 Remove barriers to energy efficiency investment
There is significant technical potential to improve industrial efficiency, as the discussion
in section 3 and the literature suggests. To unlock this potential and attract investment,
the EU will have to create stable long-term economic conditions, and a hospitable
regulatory environment, as well as alleviate a range of economic and non-economic
barriers, which the following two actions seek to address.
The EU should promote cutting-edge auditing and energy management within
active energy efficiency communities. An extensive literature suggests that many
economic energy efficiency opportunities are not pursued, due to a range of behavioural
and knowledge barriers, such as imperfect information, insufficient skills, organisational
inertia, and bounded rationality. 94 95 This is corroborated by our survey, which found
that on average, 63% of energy efficiency respondents rated these barriers Very
Significant or Significant to the uptake of their innovations: more than any other type of
barrier. To tackle this problem, the EU must work with Member States to promote active
energy efficiency communities that practise cutting-edge auditing and energy
management, and use their results to mobilise energy efficiency investments.
The ODYSSEE-MURE project has identified audit promotion as one of the most effective
policy interventions, and there is significant scope for the EU to do more in this area. 96
Under the EED, large enterprises are required to conduct energy audits every four years,
and Member States must implement policies to promote energy auditing among SMEs.97
The CA EED project has found in a preliminary assessment, however, that Member
States have implemented these requirements with varying degrees of success, and
auditing among industrial SMEs still faces significant barriers, which is corroborated by
the wider literature. 98 99 100 The effectiveness of energy audits also critically depends on
the method used, and the auditor’s awareness of energy saving opportunities, which are
numerous and constantly evolving.
The EU should continue to fund projects in this area, which have proven their value in
the past. For instance, PInE (funded under IEE) unlocked €8.4m of investment in three
years through an SME auditing programme, leading to 6,056 toe/year primary energy
savings, and 12,505 tCO2/year of GHG emissions reduction.101 The EU should also
promote best practice in high-quality auditing among Member States, developing central
resources for this purpose. To this end, as well as developing tools and templates, the
EU should build and maintain a central library of energy saving opportunities, based on
Member State audit data, and the latest exploitable results from EU and Member State
R&I.102 This would improve auditors’ awareness of opportunities, and ensure audits take
account of the latest technological developments. Complementary incentives could then
be provided for companies prepared to implement new technologies in the database,
either at EU or Member State level, supporting market uptake of innovation.
To roll out cutting-edge auditing, the EU will have to build skills capacity. Indeed, the CA
EED project has identified that Member States are concerned about a shortage of energy
94 http://sro.sussex.ac.uk/53957/1/WP102011_Barriers_to_Industrial_Energy_Efficiency_-_A_Literature_Review.pdf 95 http://proceedings.eceee.org/papers/proceedings2012/5-172-12_Cagno.pdf?returnurl... 96 http://www.measures-odyssee-mure.eu/successful-detail-measures.asp 97 http://eur-lex.europa.eu/legal-content/EN/TXT/?qid=1399375464230&uri=CELEX:32012L0027 98 http://www.ca-eed.eu/private-area/outcomes/executive-summary-report 99 https://www.iea.org/publications/freepublications/publication/SME_2015.pdf 100 https://ec.europa.eu/energy/sites/ener/files/documents/EED-Art8-Energy%20audits%20recommendations-Task%205-report%20FINAL.pdf 101 http://www.pineaudit.eu/eng/resources.aspx 102 https://ec.europa.eu/energy/sites/ener/files/documents/EED-Art8-Energy%20audits%20recommendations-Task%205-report%20FINAL.pdf
27
auditors, and the quality of auditors. This is also recognised in the literature, and
corroborated by our survey, which found that almost 60% of energy efficiency
respondents said that inadequate skills were a Very Significant or Significant barrier to
the uptake of their innovations. 103 104 The EU should continue to fund capacity building
projects, e.g. the EUREM programme, which now offers training in 19 European
countries, and has trained over 4,500 energy managers.105 In addition, the EU should
encourage harmonisation of qualification requirements across Member States (so as not
to constrain auditors’ activity within international companies), and explore the possibility
of working with Member States on capacity building under the new Blueprint for Sectoral
Cooperation on Skills. 106 107
While periodic audits are very valuable, the EU must also promote the implementation of
Energy Management Systems (EnMSs) that ensure companies consider energy
consumption in their day-to-day decision making.108 Indeed, 56% of energy efficiency
respondents to our survey said that promoting EnMSs would be Very Helpful or Helpful
to supporting uptake of their innovations, and the value of EnMS is widely acknowledged
in the literature.109 110 The EED exempts large enterprises from the requirement to
conduct energy audits every four years if they have implemented an EnMS, but there is
no requirement to have an EnMS, and implementation varies significantly between
Member States.111 112 Furthermore, SMEs are particularly unlikely to have an Energy
Management System due to their more limited resources. For SMEs, minimising the
administrative burden of energy audits and EnMS seems therefore particularly
important. The EU should continue to fund projects that promote EnMSs (e.g. EXBESS),
and support dissemination of best practice in terms of Member State policies. It is
evident, for instance, that fiscal reliefs for implementing EnMS have proven very
effective in Germany, which has over 2,000 ISO 50001 certifications (more than any
other country in the world).113 The CA EED project has also drawn attention to the value
of simplified web-based EnMSs for SMEs, and SMEs’ particular need for financial and
technical support to implement energy management practices.114
Truly effective auditing and energy management does not happen in isolation, but in
energy efficiency communities. Companies must communicate and compare practices to
identify potential, share expertise among interested actors in energy efficiency markets
(including financial actors), and motivate each other to implement opportunities. A
number of Member States have adopted initiatives in this regard, but there is significant
103 http://www.esd-ca.eu/outcomes/executive-summary-report 104 https://ec.europa.eu/energy/sites/ener/files/documents/151201%20DG%20ENER%20Industrial%20EE%20study%20-%20final%20report_clean_stc.pdf 105 eurem-plus.eu/download/attachments/511082775/Final%20Report_Web.pdf 106 http://www.ca-eed.eu/private-area/outcomes/executive-summary-report 107 http://ec.europa.eu/social/main.jsp?catId=738&langId=en&pubId=7969 108 https://www.oecd.org/sti/ind/DSTI-SU-SC(2014)14-FINAL-ENG.pdf 109 https://ec.europa.eu/energy/sites/ener/files/documents/151201%20DG%20ENER%20Industrial%20EE%20study%20-%20final%20report_clean_stc.pdf 110 https://ec.europa.eu/energy/sites/ener/files/documents/EED-Art8-Energy%20audits%20recommendations-Task%205-report%20FINAL.pdf 111 http://eur-lex.europa.eu/legal-content/EN/TXT/?qid=1399375464230&uri=CELEX:32012L0027 112 http://publications.jrc.ec.europa.eu/repository/bitstream/JRC95432/survey%20of%20energy%20audits%20and%20energy%20management%20systems%20in%20the%20member%20states_pub.pdf 113 http://publications.jrc.ec.europa.eu/repository/bitstream/JRC95432/survey%20of%20energy%20audits%20and%20energy%20management%20systems%20in%20the%20member%20states_pub.pdf
114 http://www.esd-ca.eu/outcomes/executive-summary-report
28
potential to do more.115 The ODYSSEE-MURE project, for instance, has recommended the
wider adoption of Learning Energy Efficiency Networks that work well in Germany, and
the STEEEP project has identified the need to promote benchmarking activities, which
allow companies to compare their performance using open data and software tools.116 117
Similarly, several respondents to our survey, recommended wider use of open data tools
and national sectoral initiatives. The EU should encourage Member States to adopt such
approaches, and continue to fund projects in this area. STEEEP, for instance, worked
with 36 Chambers of Commerce and Industry across 10 EU countries to reach over 600
multi-sector SMEs.118 EuPlastVoltage, meanwhile, established a voluntary agreement
covering 60% of European plastic production, which commits the signatories to a
collective reduction in energy consumption of 20% by 2020 (compared to 2007
levels).119 And BESS/EXBESS built and implemented a web-based benchmarking toolkit
for SMEs in 19 EU countries.120
The EU should de-risk investment and channel capital towards energy efficiency
by promoting standardisation, bundling, and securitisation. As well as the non-
economic barriers discussed above, there are of course very significant economic
barriers to implementing efficiency improvements on the scale required to meet EU
policy goals. The Energy Efficiency Financial Institutions Group (EEFIG), for instance, has
estimated that €4.25 trillion additional investment in energy efficiency (across all
sectors) is needed by 2050, compared to the current business-as-usual pathway.121
EEFIG notes that investment is constrained by high risk premiums and short payback
expectations, as well as the disaggregated and complex nature of investments, which
increases due diligence costs for lenders and inhibits access to capital markets. This is
corroborated by our survey: 70% of energy efficiency respondents said that inadequate
ROI by investors’ standards would be a Very Significant or Significant barrier to the
uptake of their innovations; and 62% said that limited availability of capital would be
Very Significant or Significant.
In addition to the existing financing mechanisms at EU and Member State level, the EU
should promote standardised project assessment to facilitate accurate risk assessment
and enable the application of innovative financing models that widen access to low-cost
capital. The central library of energy saving opportunities that has already been
proposed above, could provide the basis for this standardised financial assessment of
projects and benchmarking of energy efficiency performances and paybacks, building on
the example of EEFIG’s De-Risking Energy Efficiency Platform (DEEP).122 Furthermore,
energy efficiency communities (also proposed above) could serve as a key enabler of
bundling, which reduces due diligence costs for financial institutions, making financing
more viable. Indeed, EEFIG has recognised that aggregation can be facilitated via local
and regional authorities, as well as trade associations and Chambers of Commerce.123
The EU should fund projects that work with energy efficiency communities to put
together bundled financing propositions, and explore whether Project Development
115 http://eur-lex.europa.eu/legal-content/EN/TXT/?qid=1490870135947&uri=CELEX:52016SC0404 116 http://www.odyssee-mure.eu/publications/policy-brief/networks-energy-efficiency.pdf 117 www.steeep.eu/assets/Uploads/Steeep-success-stories-brochure-web.pdf 118 http://steeep.eu/
119 http://www.euplastvoltage.eu/uploads/downloads/voluntary-agreement.pdf 120 https://ec.europa.eu/energy/intelligent/projects/sites/iee-projects/files/projects/documents/exbess_factsheet_final.pdf 121 https://ec.europa.eu/energy/sites/ener/files/documents/Final%20Report%20EEFIG%20v%209.1%2024022015%20clean%20FINAL%20sent.pdf 122 https://deep.eefig.eu/ 123 https://ec.europa.eu/energy/sites/ener/files/documents/Final%20Report%20EEFIG%20v%209.1%2024022015%20clean%20FINAL%20sent.pdf
29
Assistance facilities could be used to support industrial energy efficiency projects more in
the future.124
Beyond bundling and typical ESCO financing models, standardisation of project
assessment could also enable securitisation of pooled energy efficiency loans, creating
green asset-backed securities (ABS) that channel investment from the wider capital
markets into sustainable industry projects. Developing a securitisation market is a key
objective of the EU’s provisionally agreed Securitisation Regulation, and applying
securitisation to energy efficiency investments (following the example of renewable
electricity investments) has attracted interest in recent years.125 126 Indeed, the TrustEE
project is developing a securitisation vehicle that could provide a model for this method
of financing in the future.127 To make sure that green ABS are visible to sustainability-
minded investors, it is notable that the High-Level Expert Group on Sustainable Finance
has recently recommended introducing classifications and standards for sustainable
assets and funds, as well as ensuring that fiduciary duties more accurately reflect the
sustainability objectives of investors.128
124 https://ec.europa.eu/easme/en/project-development-assistance-pda 125 https://www.consilium.europa.eu/en/policies/capital-markets-union/securitisation/# 126 http://spm.ei.columbia.edu/files/2014/09/SPM_Probst_FinancingCleanEnergy.pdf 127 https://www.trust-ee.eu/ 128 https://ec.europa.eu/info/sites/info/files/170713-sustainable-finance-report_en.pdf
30
4.2 Optimise scale-up of challenge-relevant technologies with smart R&I
Bringing breakthrough technologies to market to deliver the policy goals set out in
Section 1 will require very significant financial support and smart R&I policies from the
EU. Indeed, the Pascal Lamy report has recommended doubling R&I funding in FP9, and
taking a mission-driven approach that is optimised to deliver solutions to societal
challenges.129 The need for further funding and support for scaling up was particularly
noted by the respondents to the survey conducted for this study: 73% (and 84% of CCU
projects in particular) said that inadequate R&I support to prove their technology at
scale was a Very Significant or Significant barrier to the uptake of their innovations: the
highest rated barrier by some margin. The EU must marshal public and private financial
resources and communication capabilities to ensure that projects of relevance to policy
challenges progress in their TRL journey and are proven at scale.
The EU should optimise R&I funding by introducing standardised impact
metrics and strengthening results communication. When reviewing project
proposals, the Commission considers criteria such as improvement on current practice in
terms of environmental impacts, as well as cost-saving potential (which is an important
co-benefit and factor in determining uptake). More can be done to standardise project
impact metrics, however, as well as consider environmental and cost impacts on a life-
cycle basis, with a view to measuring improvements in absolute rather than proportional
terms at an EU level (which is most relevant to measuring impact against policy goals).
Indeed, this was noted by several respondents to our survey. To this end, the
Commission should consider building an official moving baseline of value chain practices
in the EU (based on growth forecasts and BAU assumptions), as well as an official
economic uptake model (including energy and carbon price forecasts), and develop a
methodology for standardised assessment of project impact using these tools.
Standardised metrics are not just important to select the best projects at the proposal
stage; they would also allow the Commission to better capture the value of project
results, which is vital to communicating success, and judging which projects are most
deserving of further funding. Furthermore, such standardised data would allow for
aggregation of project impacts (with appropriate consideration of double counting
issues), enabling the Commission to measure the extent to which EU-funded R&I is on
track to deliver solutions to key policy goals (which could then inform future R&I
strategy). This data should also be made available for legitimate research purposes
(such as P4P reports), and the EU should consider requiring projects to publish KPI
information in their periodic reports to improve transparency. The need for a
comprehensive and centralised evaluation system has been noted by the High Level
Group on Maximising the Impact of EU Research and Innovation to better capture and
communicate results.130
In this area, several respondents to our survey recommended doing more to help
projects publicise successful results, and a number cited the ERC Proof of Concept Grant
as an example of best practice in successive funding. Public and Private Partnerships
have a key role to play in communicating success and connecting projects to further
sources of funding. Indeed, 70% of respondents to our survey said PPPs were Very
Helpful or Helpful, with specific comments calling for continued EU support for the SPIRE
PPP beyond 2020.131 The European Commission should also consider funding CSA
129 https://ec.europa.eu/research/evaluations/pdf/archive/other_reports_studies_and_documents/hlg_2017_report.pdf 130 https://ec.europa.eu/research/evaluations/pdf/archive/other_reports_studies_and_documents/hlg_2017_report.pdf#view=fit&pagemode=none 131 https://www.spire2030.eu/
31
projects in this area under Horizon 2020 and FP9, with the purpose of sharing R&I
results and learnings.
The EU should lower barriers to scaling up technology by promoting open
innovation centres, and coordinating multiple sources of funding for First of a
Kind (FOAK) demonstrations. The SCOT project has drawn attention to the particular
need for shared modular pilot plant facilities and verification centres to support the
technological advancement of CCU technologies.132 Such open innovation centres (which
would also benefit energy efficiency projects in the lower TRL range) are shared facilities
that provide access to equipment and technology services for projects seeking to move
from laboratory validation to industrial prototypes. Shared Open Innovation Test Beds
are under discussion for the Horizon 2020 Work Programme for 2018-20, and should be
considered an important area for support under FP9.133
A particularly critical and challenging step for projects is raising funding for a FOAK
demonstration, which calls for a targeted policy response. Indeed, 71% of respondents
to our survey said that it would be Very Helpful or Helpful to coordinate multiple sources
of funding for FOAK demonstrations. ICF has suggested a catalytic approach to raising
capital, where the EU uses loans, grants, and equity instruments on a first-loss basis to
crowd-in private investment for projects that address SET Plan priorities.134 They suggest
that the EU could provide grants through the ETS Phase IV Innovation Fund, loans
through the recently established Energy Demonstration Projects facility (part of
InnovFin), and equity through a new dedicated FOAK fund.135 136 Demonstration and
scale-up projects in relevant SET Plan areas could also form a specific focus of calls
under FP9 and the Innovation Fund, covering projects up to TRL 9. To reduce the
technical risk of private investment in this area, as well as first-loss financing, the EU
should consider payment upfront in stages, or milestone funding, as recommended by
stakeholders at a workshop on the design of the Innovation Fund.137 The EU should also
encourage Member States to provide specific support for demonstrations, under the new
more permissive State Aid rules, and review whether industrial research aid intensity
limits should be raised further after 2020, in light of the particular challenges facing
FOAK demonstrations, and their relevance to more ambitious goals beyond the 2020
framework.138
132 http://cordis.europa.eu/result/rcn/197021_en.html 133 https://ec.europa.eu/programmes/horizon2020/sites/horizon2020/files/h2020-leit-nmbp-2018-2020_pre-publ.pdf 134 http://ec.europa.eu/research/energy/pdf/innovative_financial_instruments_for_FOAK_in_the_field_of_Energy.pdf 135 https://ec.europa.eu/clima/sites/clima/files/events/docs/0115/20170612_report_en.pdf 136 https://ec.europa.eu/inea/sites/inea/files/g_schonwalder_innovfin.pdf 137 https://ec.europa.eu/clima/sites/clima/files/events/docs/0115/20170612_report_en.pdf 138 http://europa.eu/rapid/press-release_MEMO-14-368_en.htm
32
4.3 Take an evidence-based approach to integrating CCU into the policy
framework
CCU technologies have the potential to address a variety of policy challenges, such as
reducing GHGs and other emissions, supporting the transition to a circular economy,
strengthening energy security, and acting as an enabler for CCS. The EU should continue
the current exploration of this potential, and identify the CCU technologies and settings
that will best deliver benefits. Once identified as beneficial, CO2 utilisation technologies
should then be integrated into the relevant areas of EU policy.
The EU should develop harmonised LCA methodologies to assess and
benchmark CCU technologies. For the further development of CCU technologies, the
performance and wider societal implications must be measured and benchmarked for
each CCU technology to alternative technologies to determine the appropriate level of
policy support. This information is also urgently needed to de-risk investment and
improve planning security for industry, as recognised by the ECRN Workshop on Launch
Phase II of Model Demonstrator Regions - Gaseous Industrial Effluents as Non-Fossil
Feedstock for Sustainable Chemicals Production.139
The EU needs reliable and comparable techno-economic and environmental assessments
of CCU technologies. Currently, the Scientific Advice Mechanism High Level Group
clarifies under what circumstances CCU for fuels, chemicals and materials can deliver
climate benefits and their total climate mitigation potential in the medium and longer
term, as well as how to account for the climate mitigation potential of CO2 incorporated
in these products considering that the CO2 will remain bound for different periods of
time and then may be released in the atmosphere.140 In addition, the EU has started a
workshop series on Life Cycle Assessment of CCU.141 It is important to continue efforts
to harmonise the LCA methodology for CCU, and to define suitable product category
rules to provide a consistent basis for the assessment of different CCU technologies.142 143 Almost three-quarters of CCU projects that responded to our survey said that
harmonised LCA standards would be Very Helpful or Helpful. The EU should make it a
short-term priority to establish generalised yet practical LCA workflows that could be
used across technologies and throughout the technology development and funding
processes. These workflows should clarify system boundaries, allocation procedures and
provide harmonised scenarios for background data, e.g. on electricity. EU activities in
this regard should be coordinated and aligned with member states and industry. Life-
cycle costing should also be considered. Expanding the scope to all dimensions of
sustainability (environment, economy, social) seems a desirable goal for future
developments.
In roadmaps and standards, the EU should consider how best to use renewable energy
for comparing CCU to other technologies since an assessment has to account for the
efficient use of limited resources. A limiting resource for many CCU technologies is the
availability of low-carbon energy, which is often required to achieve GHG savings. The
availability of low-carbon energy depends on location and infrastructure. Thereby, local
opportunities such as the valorisation of residual waste streams with low calorific value
can be exploited. Still, the coordinated and integrated development of renewable energy
capabilities at Member-State and European level remains a prerequisite for many CCU
technologies. Often, CCU technologies rely then on the further conversion of renewable
energy into hydrogen. The development of cost-efficient and carbon-efficient hydrogen
139 www.ecrn.net/documents/DGGROWD2_ECRN_Workshop_Lombardy_09-11-2016_summary.pdf
140 https://ec.europa.eu/research/sam/index.cfm?pg=ccu 141 https://ec.europa.eu/energy/en/content/workshop-life-cycle-analysis-carbon-capture-utilisation-6-june-2017 142 https://www.iso.org/standard/38131.html 143 http://dx.doi.org/10.1016/j.jclepro.2015.02.012
33
production technologies (see e.g., ELECTRA, SOPHIA) is therefore often critical to enable
CCU. Due to this dependency, the efficiency in the use of renewable energy to reduce
environmental impacts should be a guiding criterion for the development of open
technology roadmaps and should be reflected in standards (e.g. in RED fuel
sustainability criteria) via definition in BREF benchmarks. To move towards low-carbon
industries, renewable energy is most efficiently used by those technologies leading to
the largest environmental impact reductions per energy input compared to alternative
mitigation options.144 145 As long as renewable energy is limited, appropriate benchmark
technologies for the use of low-carbon energy could be defined (e.g. Power-to-Heat,
which could also use large amounts of renewable energy and would thus compete with
CCU).
The EU should extend market support to CCU technologies with demonstrated
benefits both from the emissions perspective in ETS and from the demand
perspective, e.g. under the Renewable Energy Directive. In contrast to many
energy efficiency opportunities, CCU innovations would often increase operating costs:
66% of the CCU respondents to our survey said that high operating costs were a Very
Significant or Significant barrier to the uptake of their exploitable results, and a
significant share estimated that their innovations would increase costs by over 50%.
Overall, CCU respondents rated economic barriers as Very Significant or Significant more
often than any other type of barrier, and 65% of the barriers cited by CCU projects in
comments were economic. This holds in particular for CO2 conversion to fuel
technologies, which have the largest potential market among CCU products. CO2-based
fuels can often utilise existing infrastructure thereby reducing capital expenditures but
still do not seem economically viable.146 Studies expect that CO2-based fuels will be
needed to reach future GHG emission targets.147 CO2-based fuels should therefore be
recognised as candidates for future synthetic fuels, for which development needs and the
future role are discussed in the recent commission staff working document ‘Towards
clean, competitive and connected mobility: the contribution of Transport Research and
Innovation to the Mobility package’, but without reference to CO2-based fuels.148
Overcoming economic obstacles to implementing CCU in the EU would require significant
market support for CCU products and captured CO2. This could take various forms, for
instance, incorporating CCU-fuels as an option to fulfil renewable fuel quotas as already
proposed by the Commission in the proposal for REDII (2020-30),149 certifying CO2-
feedstock content in chemicals and plastics, and proper accounting of CO2 feedstock-use
in the ETS. 150 151 Over 80% of CCU projects that responded to our survey said that
promoting markets for CCU products would be Very Helpful or Helpful to the uptake of
their exploitable results, and 78% said that promoting markets for captured CO2 would
be Very Helpful or Helpful.
The EU should account for CO2 reuse and storage within the ETS. The Council of the
European Union’s 2017 General Approach on amending the ETS Directive 2003/87/EC
has proposed including environmentally safe carbon capture and utilisation as an
incentivised technology if CO2 is stored or avoided on a sufficient scale.152 However,
144 http://dx.doi.org/10.1039/C4EE03051F 145 https://doi.org/10.1016/j.jcou.2017.10.001 146 http://www.theicct.org/publications/co2-based-synthetic-fuel-assessment-EU 147 https://www.dena.de/de/integrierte-energiewende/ 148
http://ec.europa.eu/transparency/regdoc/?fuseaction=list&coteId=10102&year=2017&number=223&version=ALL&language=en 149 Under the names waste-based fossil fuels and renewable liquid and gaseous transport fuel of non-biological
origin. 150 http://eur-lex.europa.eu/legal-content/EN/TXT/?uri=CELEX:52016PC0767R(01) 151 http://eur-lex.europa.eu/legal-content/EN/TXT/?uri=CELEX:52016PC0767R%2801%29 152 http://data.consilium.europa.eu/doc/document/ST-6841-2017-INIT/en/pdf
34
Article 12 3(a) of the current ETS Directive excuses installations from the obligation to
surrender allowances for emissions that are captured and stored, but there is no
equivalent derogation for installations capturing emissions for utilisation.153 This
exemption should be extended to installations where emissions are captured for use in
applications that offer permanent storage, e.g. mineralisation. The corresponding
monitoring and verification methodology would need to be established. For other CCU
applications, the situation is more complicated, because the captured CO2 is re-emitted
at the end-of-life, which may happen in a non-ETS sector not covered by the carbon
price. An exemption at point of capture should not be provided in this instance, because
it would incentivise moving emissions outside of the jurisdiction of the carbon price. At
the same time, however, an exemption should be provided to the final emitter in the
chain to avoid double counting when end-of-life emissions would happen within the ETS.
For instance, if CO2 emissions were captured from one ETS installation, processed by a
second into a CO2-based fuel, and finally burnt by a third, the EU should exempt the
final installation from having to surrender allowances for the emissions associated with
burning the CCU-fuel, following the approach taken with biomass (see Annex IV of the
ETS Directive). When end-of-life emissions would happen outside the ETS, however,
there are no allowances to surrender at the final installation and there would be no
incentive to capture and use CO2. In this case, the EU should explore demand-side
incentives, such as recognising CCU transport fuels in RED quotas, or eco-design
standards and quotas for inclusion of CCU-chemicals in products. With these principles,
all CO2 emissions from ETS sectors would be counted once within the ETS, while
incentivising all beneficial CCU pathways even outside the ETS.
Finally, the EU should investigate potential contributions of CCU beyond mitigating
climate change. CCU can enable the development of new, innovative products with the
potential of creating entirely new markets (e.g. novel polymers) or providing solutions
for existing markets with improved environmental performance (e.g. while CO2-based
fuels have been shown to be less efficient for climate change mitigation than CCS, they
could provide diesel-type drop-in fuels reducing both NOx and soot emissions, while
avoiding conflict with the food sector).154 155 Further contributions may include reducing
import dependency through a shift from imported fossil carbon feedstock to locally
captured CO2 and European resources. This shift is likely to increase resource security,
decrease price-volatility of chemical products, promote job creation, and ensure
continued technological leadership of European industries in low carbon emissions
technologies. R&I is needed to evaluate these scenarios in particular with regard to the
need for renewable power and for the development of sustainable value chains. By
taking an evidence-based approach, the full potential of CCU can be exploited.
153 http://eur-lex.europa.eu/legal-content/EN/TXT/?uri=CELEX:02003L0087-20140430 154 http://dx.doi.org/10.1039/C7EE02819A 155 http://dx.doi.org/10.1039/c7ee01657c
35
4.4 Develop a supportive framework to promote industrial symbiosis
Industrial Symbiosis (IS) can enable both energy efficiency and CO2 utilisation, and has
the potential to play a role in delivering EU goals relating to emissions reduction, the
circular economy, industrial competitiveness, and smart cities. Industrial clustering has a
long and successful history in the chemicals industry, but there is potential to adopt
similar approaches in other industries, and across sectors.156 The barriers to IS are
particularly profound, however, and there is little policy in place at EU or Member State
level to address this, meaning that the potential of IS remains largely untapped.
The European Commission has encouraged Member States to promote IS in its Roadmap
to a Resource Efficient Europe, and has recognised the role of IS in the Circular
Economy.157 158 In addition, the Commission’s 2017 Waste-to-Energy Communication
adopted in response to the Circular Economy Package, supports the idea of industrial
symbiosis, where a waste-to-energy plant processes the waste of neighbouring
industries and provides them with heat and power in return, resulting in emissions
savings.159 Nevertheless, there is no legal requirement at EU-level for Member States to
introduce policies in this area currently, and research undertaken on behalf of the
Commission has found that 20 Member States provide little support for IS, and six
provide none at all.160 The EU has funded projects in the past that seek to unlock the
potential of IS, such as the National Industrial Symbiosis Programme (NISP) in the UK
(under the ERDF), and has started to fund IS projects under Horizon 2020, but it is still a
relatively underexplored area.161 162 Only three out of 208 projects that responded to our
survey, for instance, identified themselves as IS projects: less than 1.5%.
The EU should take action to fill this policy and funding gap, promoting the dissemination
of best practice in policy at the Member-State level, and supporting IS-facilitating
projects and investments under FP9 and other funds (such as ERDF and the Cohesion
Fund). More ambitiously, the EU should consider developing an Industrial Symbiosis
Strategy, and exploring the viability of legislating to require Member States to promote
IS in the future, assuming it is consistent with the principle of subsidiarity. Broadly
speaking, IS policy could be modelled on energy efficiency policy, and benefit from
learnings on CO2 use. This might include, for instance, extending auditing requirements
to include consideration of IS, and developing best practice on IS (something that
several respondents to our survey specifically recommended in comments), which might
be done under the IED framework, following the model of the generic BREF on energy
efficiency.163
The EU should alleviate barriers to IS by promoting networks, information-
sharing tools, and capacity-building initiatives. Non-economic barriers facing
typical energy efficiency and CCU projects are more extreme in the case of IS, due to
the poor visibility of opportunities across companies (especially if they are from different
sectors), the lack of skilled IS practitioners, and the absence of decision-making
structures spanning companies. Furthermore, sharing information between companies is
inhibited by concerns about confidentiality, and implementing projects is complicated by
156 The Smart Delta Resources platform in the Netherlands is a good example of potential in this respect: https://www.smartdeltaresources.com/en 157 http://eur-lex.europa.eu/legal-content/EN/TXT/?uri=CELEX:52011DC0571 158 http://ec.europa.eu/environment/circular-economy/index_en.htm 159 The recovery of materials found in incinerator bottom ash is another opportunity for symbiosis mentioned. 160 http://ec.europa.eu/environment/enveco/resource_efficiency/pdf/business/RE_in_Business_M1_IndustrialSymbiosis.pdf 161 http://www.nispnetwork.com/about-nisp 162 http://cordis.europa.eu/programme/rcn/664555_en.html 163 http://eippcb.jrc.ec.europa.eu/reference/BREF/ENE_Adopted_02-2009.pdf
36
business risks associated with interdependency, and the need to negotiate how to share
capital expenditure and cost savings. 164
To address these barriers, the EU should promote IS networks to get companies working
together on energy and resource efficiency.165 This has proven effective in certain
Member States, such as the UK, Finland, and Ireland, but otherwise has not been widely
explored in the EU. In the UK, the National Industrial Symbiosis Programme (NISP)
brought together over 15,000 companies to work on IS from 2005-13, saving almost 40
million tonnes of industrial carbon emissions, and generating cost savings well over £1
billion.166 In Ireland, the resource exchange network (Smile) was launched in 2011 and
by 2016 had engaged over 1,400 companies.167 168 And in 2015 the NISP model was
exported to Finland, with the launch of the Finnish Industrial Symbiosis System (FISS),
which currently has over 600 member companies.169
The EU should fund network-building initiatives like NISP, taking a steer from successful
projects that have built energy efficiency networks. These IS initiatives, for instance,
might bring companies together via Chambers of Commerce and Industry (cf. STEEEP),
or under a voluntary agreement (cf. EuPlastVoltage). The EU should also encourage
Member States to support network-building initiatives: the experience of NISP, which
only ran for 8 years in the UK despite delivering impressive results, is a testament to the
importance of national government funding.170
To facilitate the exchange of information between companies in networks, the EU should
promote IS information platforms and tools. Identifying IS opportunities depends on
companies sharing information about their energy, material, and utility streams.
Portugal has had a waste/resource trading platform since 2010, and the EU has
supported several projects in this area, but more needs to be done to develop and
disseminate informational tools, and encourage harmonisation of platforms across
Member States.171 The NISP project, for instance, has developed SYNERGie®: a web-
based resource database, which the Horizon 2020 project SHAREBOX is currently
transforming into a system that will allow users to monitor and trade resource streams
in real-time.172 SYMBIOPTIMA, meanwhile, is developing a cross-sectoral energy and
resource management platform based on a ‘human-mimetic’ model that considers the
life cycle impact of a cluster.173 One serious barrier to sharing information, however, is
the confidential nature of data, which can often deter companies from exploring IS
opportunities. The EPOS project creatively addresses this problem by developing sectoral
blueprints of resource streams, enabling companies to sidestep confidentiality issues and
identify cross-sectoral IS opportunities on a generic level before progressing to more
serious commercial discussions.174
164 Due to the low number of industrial symbiosis projects that responded to our survey, this account of barriers and the attendant recommendations are informed by specific projects in the portfolio (such as EPOS) as well as the A.SPIRE survey (which covered a subset of the projects in our study portfolio), and a review of the literature on the subject. 165 This was also the recommendation of the European Resource Efficiency Platform (EREP) in 2014: http://ec.europa.eu/environment/resource_efficiency/documents/erep_manifesto_and_policy_recommendations_31-03-2014.pdf 166 http://www.nispnetwork.com/about-nisp/a-proven-track-record 167 http://www.smileexchange.ie/ 168 https://www.independent.ie/regionals/corkman/news/national-waste-prevention-award-for-smile-resource-35202933.html 169 http://www.industrialsymbiosis.fi/home-en-gb/ 170 https://ec.europa.eu/environment/ecoap/about-eco-innovation/experts-interviews/20140127_industrial-symbiosis-realising-the-circular-economy_en 171 http://www.moronline.pt/UK/ 172 http://www.international-synergies.com/news/introducing-sharebox-a-systemic-leap-forward-for-industrial-symbiosis/ 173 http://www.symbioptima.eu/index.php/project/description 174 https://www.spire2030.eu/sites/default/files/users/user222/Epos-docs/HullPC/Blueprints.pdf

37
Implementing IS requires highly skilled and trusted practitioners to coordinate and
advise companies. The EU should support capacity building projects that train IS
specialists and encourage Member States to do the same, in the same way that it has
promoted projects to train energy auditors and managers. NISP has identified that IS
practitioners are the key to the success of their model, and have expressed aspirations
to establish an International Centre for Applied IS.175 NISP practitioners retain a link with
academia through membership of the International Society for Industrial Ecology, and
also help build in-house skills by training employees within participating companies in
the network.176 177
175 http://www.wrap.org.uk/sites/files/wrap/Pathway%20Report.pdf 176 https://is4ie.org/about/introduction 177 http://www.international-synergies.com/our-approach/education-and-training/
38
The EU should work with Member States to ensure that waste regulation and
planning policies facilitate resource exchange and industrial clustering. The
viability of industrial symbiosis is affected by waste regulations that can unintentionally
create obstacles to transferring resource streams between companies. The need to
address this problem is recognised in the literature, and was identified by the EPOS
project, as well as several IS projects in our portfolio that responded to a survey
conducted by A.SPIRE (which is not publicly available). 178 179 The Commission has
proposed harmonising how Member States apply the legal definition of ‘by-product’ and
‘end-of-waste status’ as part of the circular economy package, which is a welcome step
forward.180 Beyond harmonisation, however, the EU should do more to ensure that, as a
general rule, resource streams used in industrial symbiosis are classified as ‘by-products’
rather than ‘waste’, as proposed by the European Parliament.181 This might, for instance,
involve relaxing condition (b) in paragraph 1 of Article 5 in the Waste Framework
Directive (that requires no further processing of a resource for it to be classified as a ‘by-
product’), which has been identified as a barrier to industrial symbiosis.182 More
ambitiously, in the longer term the EU should consider the definition of waste and the
issue of its ownership. A growing literature suggests that moving towards a circular
economy may require a new understanding of waste as a common pool resource.183 184
Opportunities to share energy and resources, including CO2, often depend on location
and infrastructure for gathering and transporting materials, which is largely out of the
hands of individual companies. The EU should encourage Member States to facilitate IS
through their planning decisions and infrastructure investments, promoting industrial
clusters and building smart cities. Indeed, the EPOS project and ICF have both
recognised the need for policy in this regard.185 186 One recent EU initiative that may
serve as a model in this area is the European Sustainable Chemicals Support Service
that is helping six model regions develop sustainable chemical production practices,
including exploring using local waste and CO2 as feedstock.187 Another promising
approach from the UNEP and SETAC Life Cycle Initiative is to develop hotspot analysis
methods and tools that can help policymakers design optimally sustainable societies.188
The EU should also ensure that State Aid guidelines do not unduly inhibit Member States
from providing incentives for clustering, such as fiscal reliefs or subsidies.
178 https://publications.europa.eu/en/publication-detail/-/publication/d659518c-78d3-45a1-ad2e-d112c80e1614 179 https://www.spire2030.eu/sites/default/files/users/user222/Epos-docs/epos%20insights%206_v2.pdf 180 http://eur-lex.europa.eu/legal-content/EN/TXT/?uri=CELEX:52015PC0595 181 http://www.europarl.europa.eu/sides/getDoc.do?pubRef=-//EP//TEXT+TA+P8-TA-2017-
0070+0+DOC+XML+V0//EN&language=EN 182 http://ec.europa.eu/environment/integration/research/newsalert/pdf/291na2_en.pdf 183 http://onlinelibrary.wiley.com/wol1/doi/10.1111/j.1530-9290.2011.00403.x/full 184 https://papers.ssrn.com/sol3/papers.cfm?abstract_id=2983631 185 https://www.spire2030.eu/sites/default/files/users/user222/Epos-docs/epos%20insights%206_v2.pdf 186 https://ec.europa.eu/energy/sites/ener/files/documents/151201%20DG%20ENER%20Industrial%20EE%20study%20-%20final%20report_clean_stc.pdf 187 http://ec.europa.eu/growth/content/commission-selects-6-model-regions-lead-way-toward-sustainable-chemical-industry-0_is 188 http://ec.europa.eu/growth/content/commission-selects-6-model-regions-lead-way-toward-sustainable-chemical-industry-0_is
39
Appendix 1—Project Identification
Results
Since 2007, we estimate that the EU has funded 559 projects under FP7, H2020, RFCS,
and IEE that are relevant to this study: 488 concerning industrial energy efficiency, and
71 concerning CCU.
Definitions
We took industry to comprise the SPIRE sectors,189 as well as glass, food/drink,
paper/pulp, and refining. Industrial energy efficiency was taken to mean using less
energy to achieve a certain end within these sectors, compared to their current
practices, or their possible future practices. Projects that concerned both industrial
energy efficiency and CCU, were counted as CCU projects.
Method
To find the 559 projects, we reviewed all IEE SAVE industry projects, and all RFCS steel
projects from 2007 onwards.190 191 FP7 and Horizon 2020 projects were found via
CORDIS, applying word searches and filters, and reviewing thousands of abstracts.192
The word searches we used to find the energy efficiency projects were as follows:
"energy effic*", "reduce energy", save energy", "energy saving", "energy
reduction, "less energy", "lower energy", "energy consumption", "energy
management", "process energy", "process intensification", "process
optimisation", "membrane", "cataly*", "industrial symbiosis", "heat recovery",
"heat transfer", "efficient furnace", "efficient combustion", "efficient steam
boiler", "heat generation", "process heat", "process electricity", "process
design", "thermal efficiency", "waste valorisation", "resource
efficiency"+"energy", "energy penalty", "saving energy", "effic*" (on FP7 NMP
section)
189 https://www.spire2030.eu/spire/the-association 190 http://ec.europa.eu/energy/intelligent/projects/ 191 http://ec.europa.eu/research/industrial_technologies/rfcs_pubs.html 192 http://cordis.europa.eu/
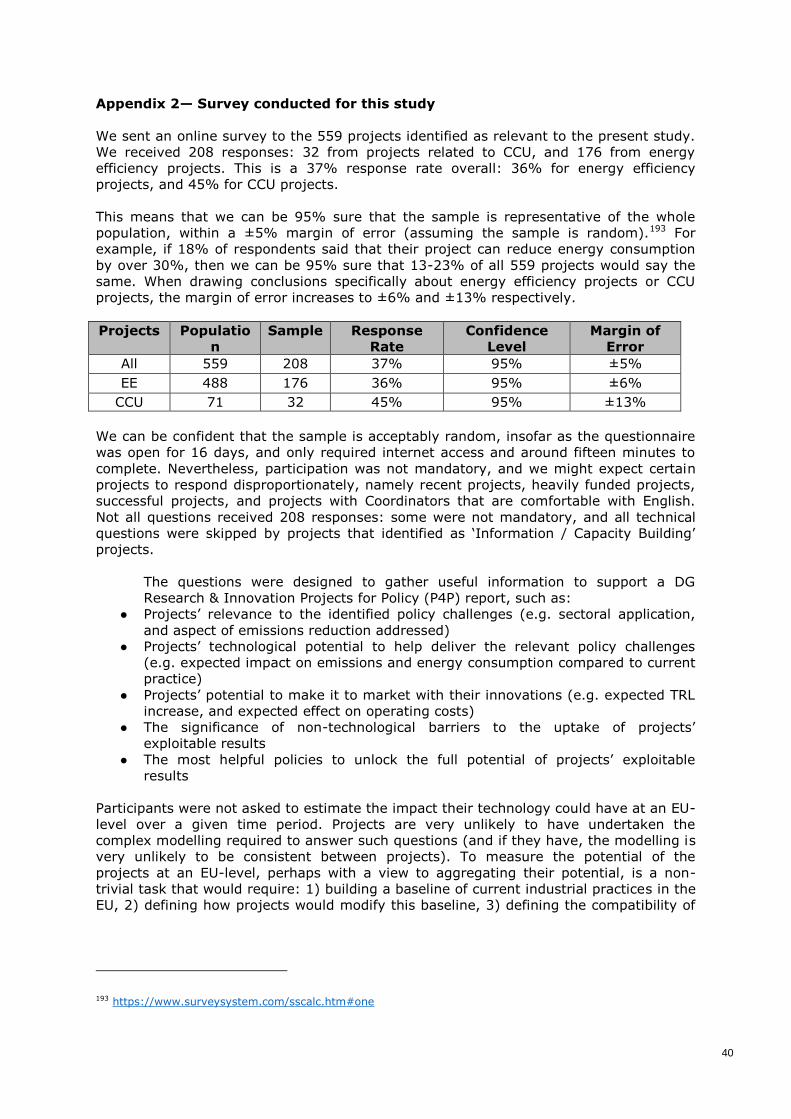
40
Appendix 2— Survey conducted for this study
We sent an online survey to the 559 projects identified as relevant to the present study.
We received 208 responses: 32 from projects related to CCU, and 176 from energy
efficiency projects. This is a 37% response rate overall: 36% for energy efficiency
projects, and 45% for CCU projects.
This means that we can be 95% sure that the sample is representative of the whole
population, within a ±5% margin of error (assuming the sample is random).193 For
example, if 18% of respondents said that their project can reduce energy consumption
by over 30%, then we can be 95% sure that 13-23% of all 559 projects would say the
same. When drawing conclusions specifically about energy efficiency projects or CCU
projects, the margin of error increases to ±6% and ±13% respectively.
Projects Populatio
n
Sample Response
Rate
Confidence
Level
Margin of
Error
All 559 208 37% 95% ±5%
EE 488 176 36% 95% ±6%
CCU 71 32 45% 95% ±13%
We can be confident that the sample is acceptably random, insofar as the questionnaire
was open for 16 days, and only required internet access and around fifteen minutes to
complete. Nevertheless, participation was not mandatory, and we might expect certain
projects to respond disproportionately, namely recent projects, heavily funded projects,
successful projects, and projects with Coordinators that are comfortable with English.
Not all questions received 208 responses: some were not mandatory, and all technical
questions were skipped by projects that identified as ‘Information / Capacity Building’
projects.
The questions were designed to gather useful information to support a DG
Research & Innovation Projects for Policy (P4P) report, such as:
● Projects’ relevance to the identified policy challenges (e.g. sectoral application,
and aspect of emissions reduction addressed)
● Projects’ technological potential to help deliver the relevant policy challenges
(e.g. expected impact on emissions and energy consumption compared to current
practice)
● Projects’ potential to make it to market with their innovations (e.g. expected TRL
increase, and expected effect on operating costs)
● The significance of non-technological barriers to the uptake of projects’
exploitable results
● The most helpful policies to unlock the full potential of projects’ exploitable
results
Participants were not asked to estimate the impact their technology could have at an EU-
level over a given time period. Projects are very unlikely to have undertaken the
complex modelling required to answer such questions (and if they have, the modelling is
very unlikely to be consistent between projects). To measure the potential of the
projects at an EU-level, perhaps with a view to aggregating their potential, is a non-
trivial task that would require: 1) building a baseline of current industrial practices in the
EU, 2) defining how projects would modify this baseline, 3) defining the compatibility of
193 https://www.surveysystem.com/sscalc.htm#one
41
the projects’ different technologies (to avoid issues of double counting), and 4) building
an economic/uptake model.194
The questions concerning technical potential were framed at the project level, which was
appropriate for a lot of projects, but difficult for broad open-ended projects concerning a
wide range of practices or case studies. These projects sometimes answered ‘Don’t
Know’ or ‘Not Applicable’ to these questions, even though they may have the potential to
deliver significant energy and emissions savings. This has a conservative effect on the
aggregated figures in some cases.
194 For example, ICF’s 2015 study on energy efficiency takes this approach: https://ec.europa.eu/energy/sites/ener/files/documents/151201%20DG%20ENER%20Industrial%20EE%20study%20-%20final%20report_clean_stc.pdf
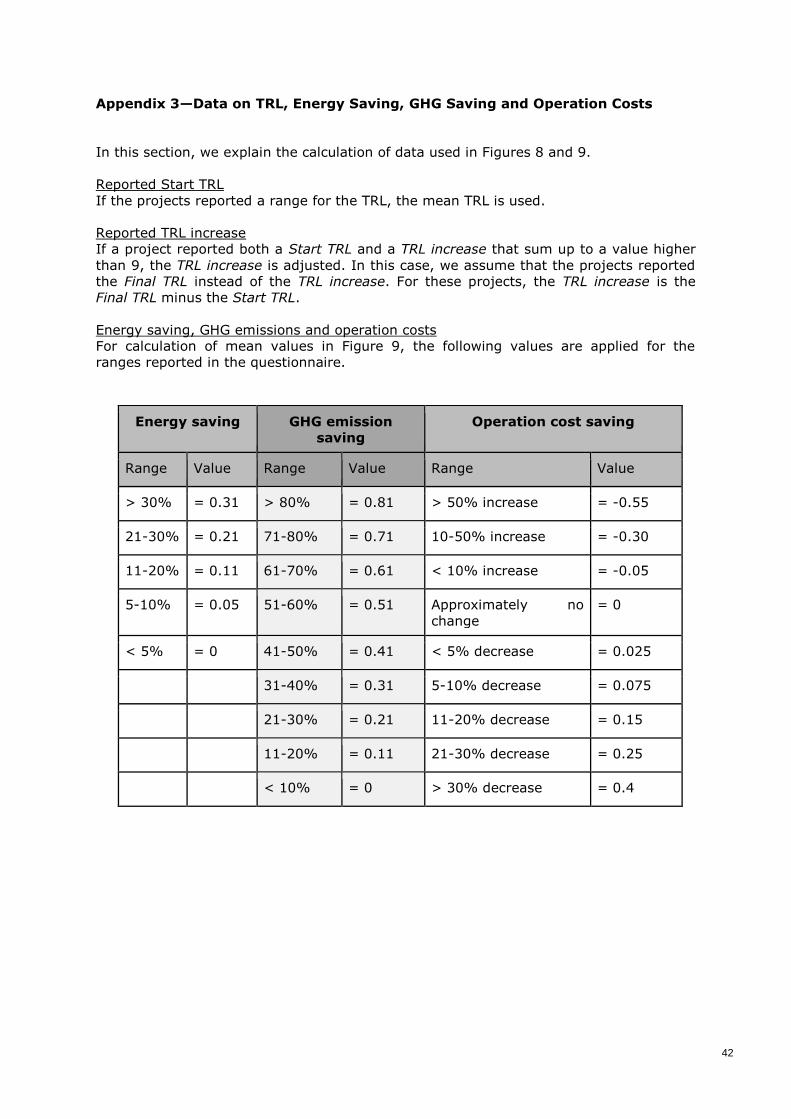
42
Appendix 3—Data on TRL, Energy Saving, GHG Saving and Operation Costs
In this section, we explain the calculation of data used in Figures 8 and 9.
Reported Start TRL
If the projects reported a range for the TRL, the mean TRL is used.
Reported TRL increase
If a project reported both a Start TRL and a TRL increase that sum up to a value higher
than 9, the TRL increase is adjusted. In this case, we assume that the projects reported
the Final TRL instead of the TRL increase. For these projects, the TRL increase is the
Final TRL minus the Start TRL.
Energy saving, GHG emissions and operation costs
For calculation of mean values in Figure 9, the following values are applied for the
ranges reported in the questionnaire.
Energy saving GHG emission
saving
Operation cost saving
Range Value Range Value Range Value
> 30% = 0.31 > 80% = 0.81 > 50% increase = -0.55
21-30% = 0.21 71-80% = 0.71 10-50% increase = -0.30
11-20% = 0.11 61-70% = 0.61 < 10% increase = -0.05
5-10% = 0.05 51-60% = 0.51 Approximately no
change
= 0
< 5% = 0 41-50% = 0.41 < 5% decrease = 0.025
31-40% = 0.31 5-10% decrease = 0.075
21-30% = 0.21 11-20% decrease = 0.15
11-20% = 0.11 21-30% decrease = 0.25
< 10% = 0 > 30% decrease = 0.4
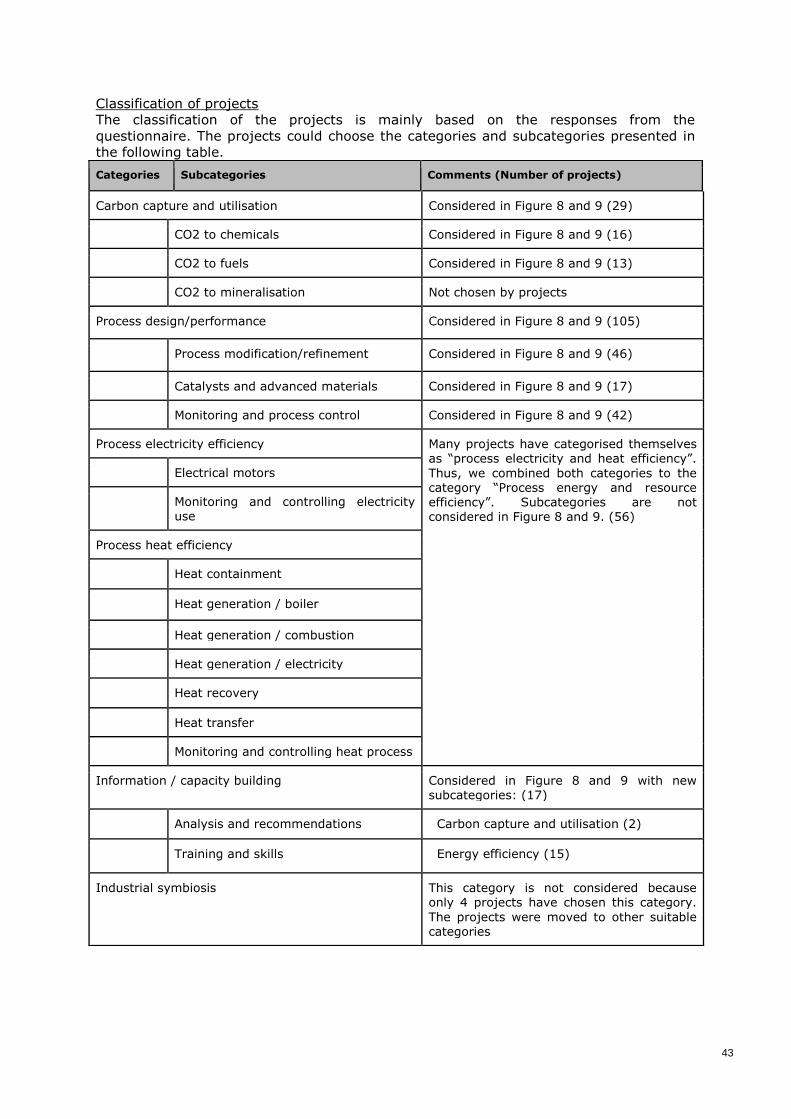
43
Classification of projects
The classification of the projects is mainly based on the responses from the
questionnaire. The projects could choose the categories and subcategories presented in
the following table.
Categories Subcategories Comments (Number of projects)
Carbon capture and utilisation Considered in Figure 8 and 9 (29)
CO2 to chemicals Considered in Figure 8 and 9 (16)
CO2 to fuels Considered in Figure 8 and 9 (13)
CO2 to mineralisation Not chosen by projects
Process design/performance Considered in Figure 8 and 9 (105)
Process modification/refinement Considered in Figure 8 and 9 (46)
Catalysts and advanced materials Considered in Figure 8 and 9 (17)
Monitoring and process control Considered in Figure 8 and 9 (42)
Process electricity efficiency Many projects have categorised themselves as “process electricity and heat efficiency”.
Thus, we combined both categories to the category “Process energy and resource efficiency”. Subcategories are not considered in Figure 8 and 9. (56)
Electrical motors
Monitoring and controlling electricity use
Process heat efficiency
Heat containment
Heat generation / boiler
Heat generation / combustion
Heat generation / electricity
Heat recovery
Heat transfer
Monitoring and controlling heat process
Information / capacity building Considered in Figure 8 and 9 with new subcategories: (17)
Analysis and recommendations Carbon capture and utilisation (2)
Training and skills Energy efficiency (15)
Industrial symbiosis This category is not considered because only 4 projects have chosen this category.
The projects were moved to other suitable categories
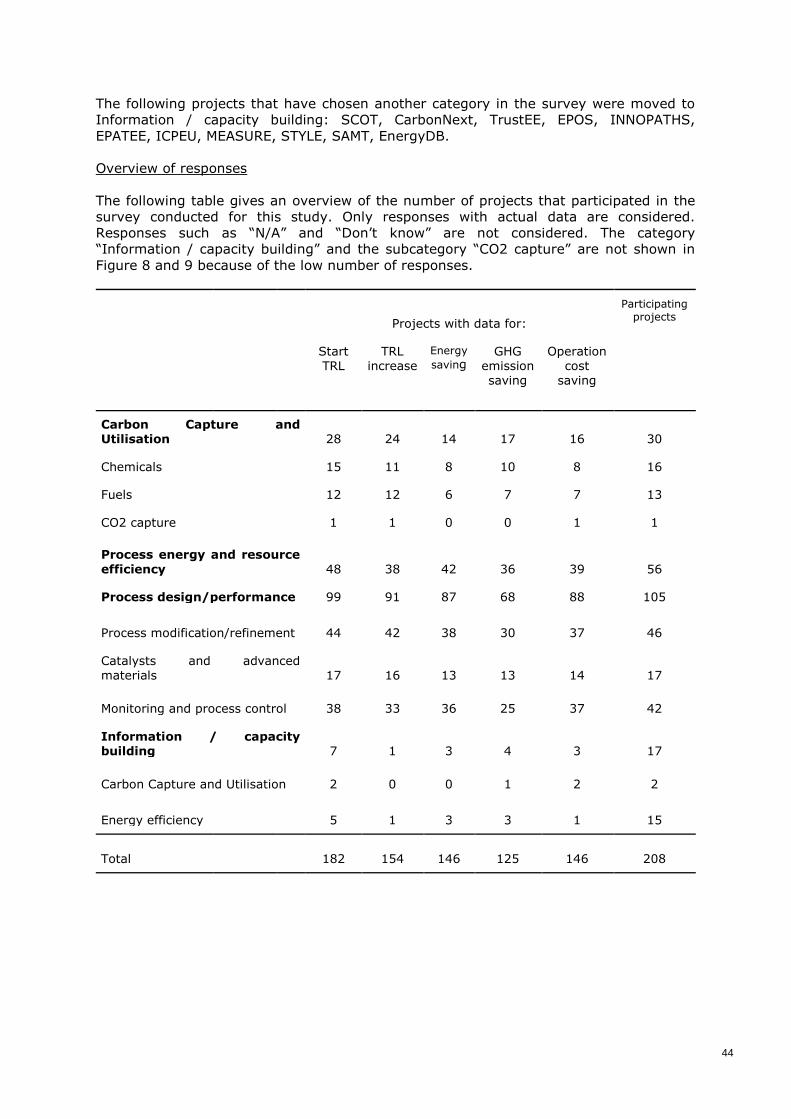
44
The following projects that have chosen another category in the survey were moved to
Information / capacity building: SCOT, CarbonNext, TrustEE, EPOS, INNOPATHS,
EPATEE, ICPEU, MEASURE, STYLE, SAMT, EnergyDB.
Overview of responses
The following table gives an overview of the number of projects that participated in the
survey conducted for this study. Only responses with actual data are considered.
Responses such as “N/A” and “Don’t know” are not considered. The category
“Information / capacity building” and the subcategory “CO2 capture” are not shown in
Figure 8 and 9 because of the low number of responses.
Projects with data for:
Participating projects
Start TRL
TRL increase
Energy
saving GHG
emission saving
Operation cost
saving
Carbon Capture and Utilisation 28 24 14 17 16 30
Chemicals 15 11 8 10 8 16
Fuels 12 12 6 7 7 13
CO2 capture 1 1 0 0 1 1
Process energy and resource
efficiency 48 38 42 36 39 56
Process design/performance 99 91 87 68 88 105
Process modification/refinement 44 42 38 30 37 46
Catalysts and advanced materials 17 16 13 13 14 17
Monitoring and process control 38 33 36 25 37 42
Information / capacity building 7 1 3 4 3 17
Carbon Capture and Utilisation 2 0 0 1 2 2
Energy efficiency 5 1 3 3 1 15
Total 182 154 146 125 146 208
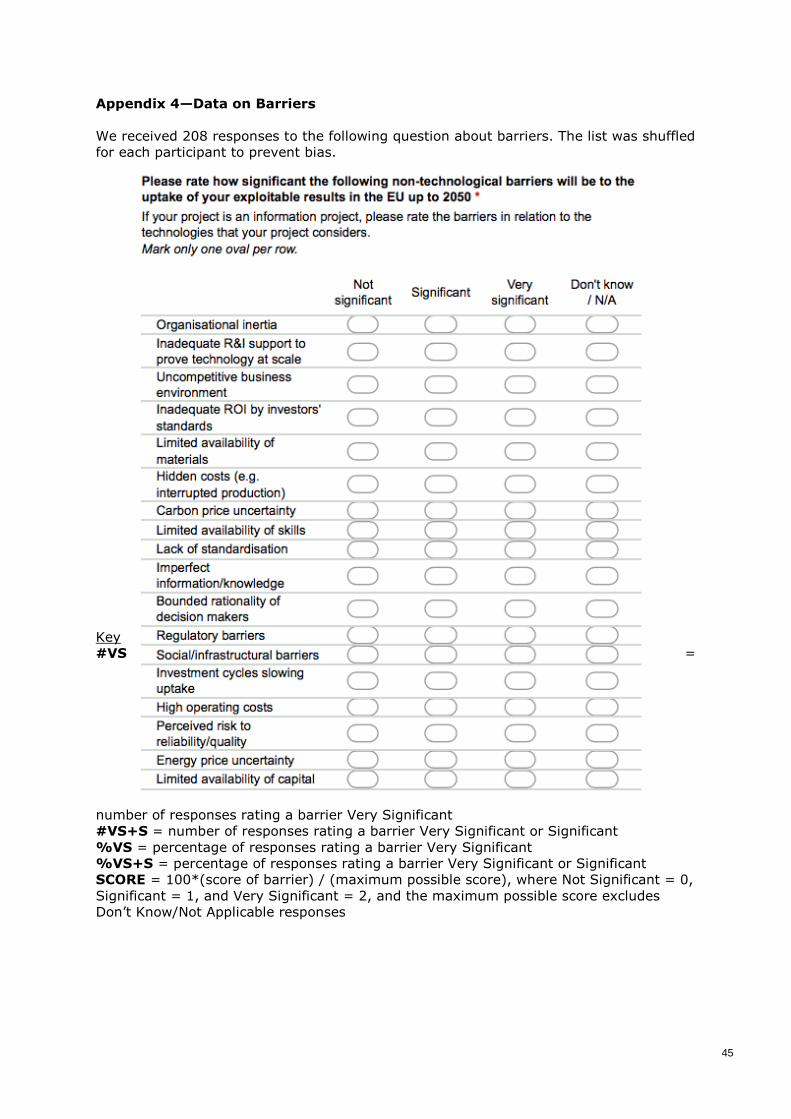
45
Appendix 4—Data on Barriers
We received 208 responses to the following question about barriers. The list was shuffled
for each participant to prevent bias.
Key
#VS =
number of responses rating a barrier Very Significant
#VS+S = number of responses rating a barrier Very Significant or Significant
%VS = percentage of responses rating a barrier Very Significant
%VS+S = percentage of responses rating a barrier Very Significant or Significant
SCORE = 100*(score of barrier) / (maximum possible score), where Not Significant = 0,
Significant = 1, and Very Significant = 2, and the maximum possible score excludes
Don’t Know/Not Applicable responses
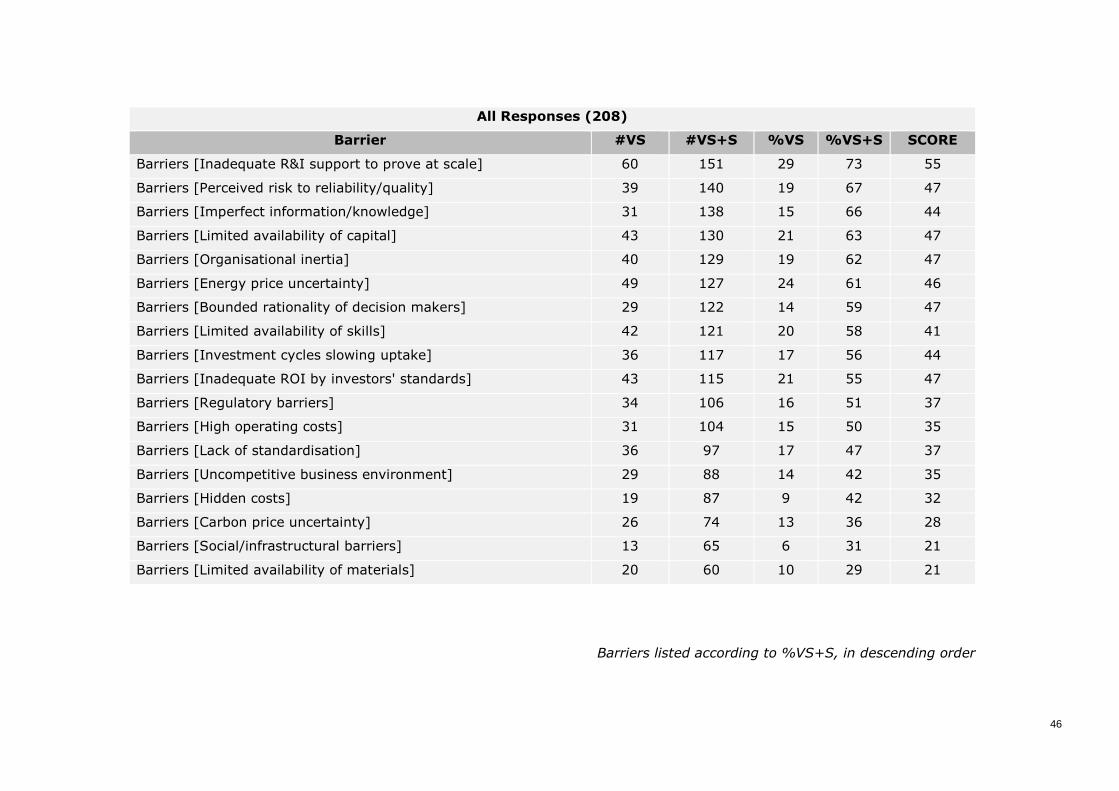
46
Barriers listed according to %VS+S, in descending order
All Responses (208)
Barrier #VS #VS+S %VS %VS+S SCORE
Barriers [Inadequate R&I support to prove at scale] 60 151 29 73 55
Barriers [Perceived risk to reliability/quality] 39 140 19 67 47
Barriers [Imperfect information/knowledge] 31 138 15 66 44
Barriers [Limited availability of capital] 43 130 21 63 47
Barriers [Organisational inertia] 40 129 19 62 47
Barriers [Energy price uncertainty] 49 127 24 61 46
Barriers [Bounded rationality of decision makers] 29 122 14 59 47
Barriers [Limited availability of skills] 42 121 20 58 41
Barriers [Investment cycles slowing uptake] 36 117 17 56 44
Barriers [Inadequate ROI by investors' standards] 43 115 21 55 47
Barriers [Regulatory barriers] 34 106 16 51 37
Barriers [High operating costs] 31 104 15 50 35
Barriers [Lack of standardisation] 36 97 17 47 37
Barriers [Uncompetitive business environment] 29 88 14 42 35
Barriers [Hidden costs] 19 87 9 42 32
Barriers [Carbon price uncertainty] 26 74 13 36 28
Barriers [Social/infrastructural barriers] 13 65 6 31 21
Barriers [Limited availability of materials] 20 60 10 29 21
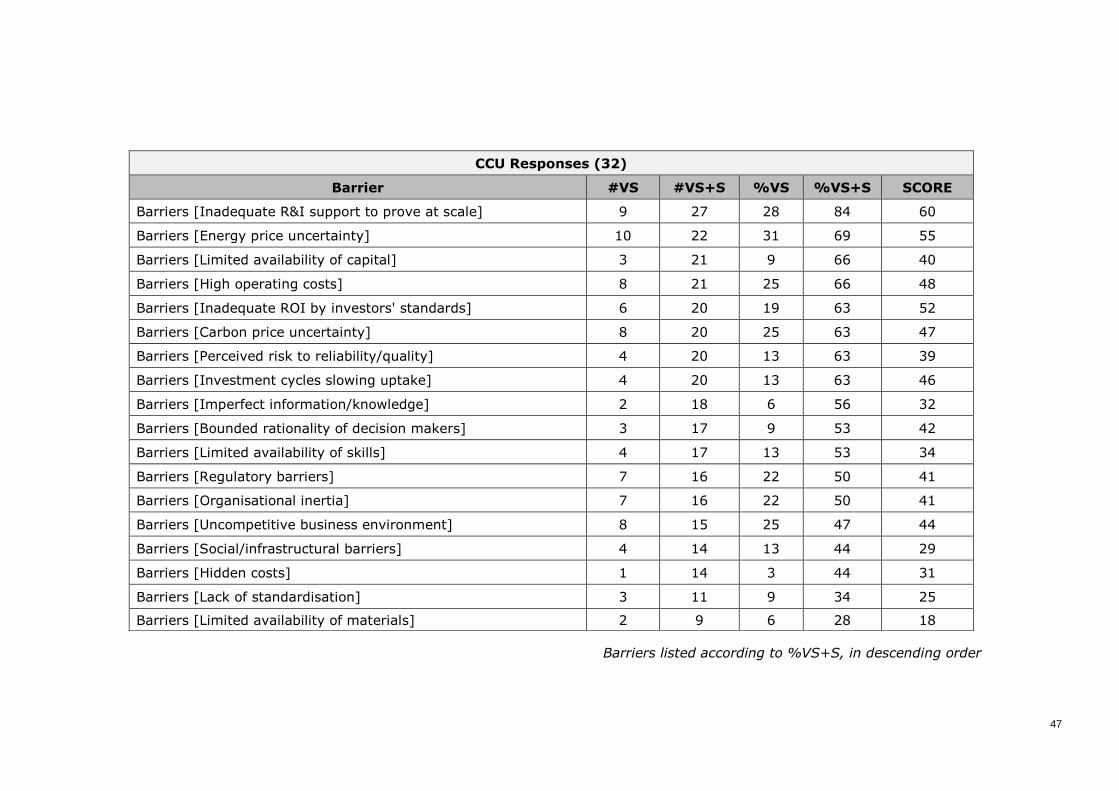
47
Barriers listed according to %VS+S, in descending order
CCU Responses (32)
Barrier #VS #VS+S %VS %VS+S SCORE
Barriers [Inadequate R&I support to prove at scale] 9 27 28 84 60
Barriers [Energy price uncertainty] 10 22 31 69 55
Barriers [Limited availability of capital] 3 21 9 66 40
Barriers [High operating costs] 8 21 25 66 48
Barriers [Inadequate ROI by investors' standards] 6 20 19 63 52
Barriers [Carbon price uncertainty] 8 20 25 63 47
Barriers [Perceived risk to reliability/quality] 4 20 13 63 39
Barriers [Investment cycles slowing uptake] 4 20 13 63 46
Barriers [Imperfect information/knowledge] 2 18 6 56 32
Barriers [Bounded rationality of decision makers] 3 17 9 53 42
Barriers [Limited availability of skills] 4 17 13 53 34
Barriers [Regulatory barriers] 7 16 22 50 41
Barriers [Organisational inertia] 7 16 22 50 41
Barriers [Uncompetitive business environment] 8 15 25 47 44
Barriers [Social/infrastructural barriers] 4 14 13 44 29
Barriers [Hidden costs] 1 14 3 44 31
Barriers [Lack of standardisation] 3 11 9 34 25
Barriers [Limited availability of materials] 2 9 6 28 18
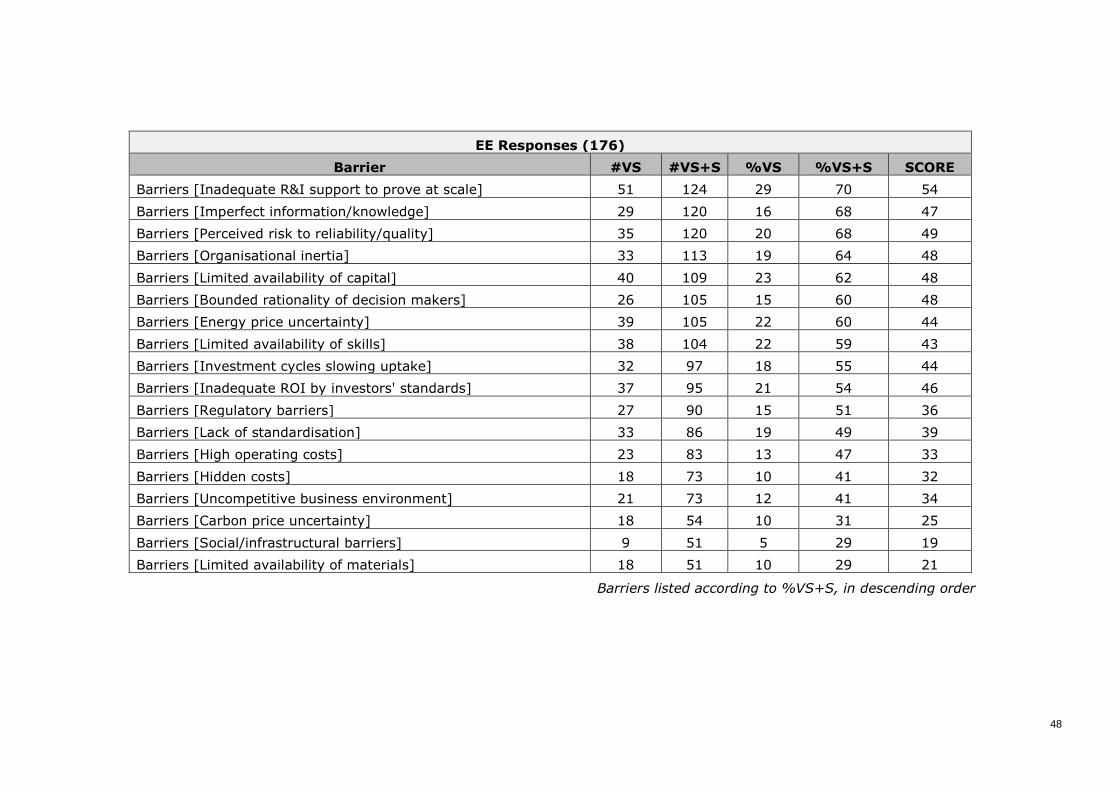
48
Barriers listed according to %VS+S, in descending order
EE Responses (176)
Barrier #VS #VS+S %VS %VS+S SCORE
Barriers [Inadequate R&I support to prove at scale] 51 124 29 70 54
Barriers [Imperfect information/knowledge] 29 120 16 68 47
Barriers [Perceived risk to reliability/quality] 35 120 20 68 49
Barriers [Organisational inertia] 33 113 19 64 48
Barriers [Limited availability of capital] 40 109 23 62 48
Barriers [Bounded rationality of decision makers] 26 105 15 60 48
Barriers [Energy price uncertainty] 39 105 22 60 44
Barriers [Limited availability of skills] 38 104 22 59 43
Barriers [Investment cycles slowing uptake] 32 97 18 55 44
Barriers [Inadequate ROI by investors' standards] 37 95 21 54 46
Barriers [Regulatory barriers] 27 90 15 51 36
Barriers [Lack of standardisation] 33 86 19 49 39
Barriers [High operating costs] 23 83 13 47 33
Barriers [Hidden costs] 18 73 10 41 32
Barriers [Uncompetitive business environment] 21 73 12 41 34
Barriers [Carbon price uncertainty] 18 54 10 31 25
Barriers [Social/infrastructural barriers] 9 51 5 29 19
Barriers [Limited availability of materials] 18 51 10 29 21
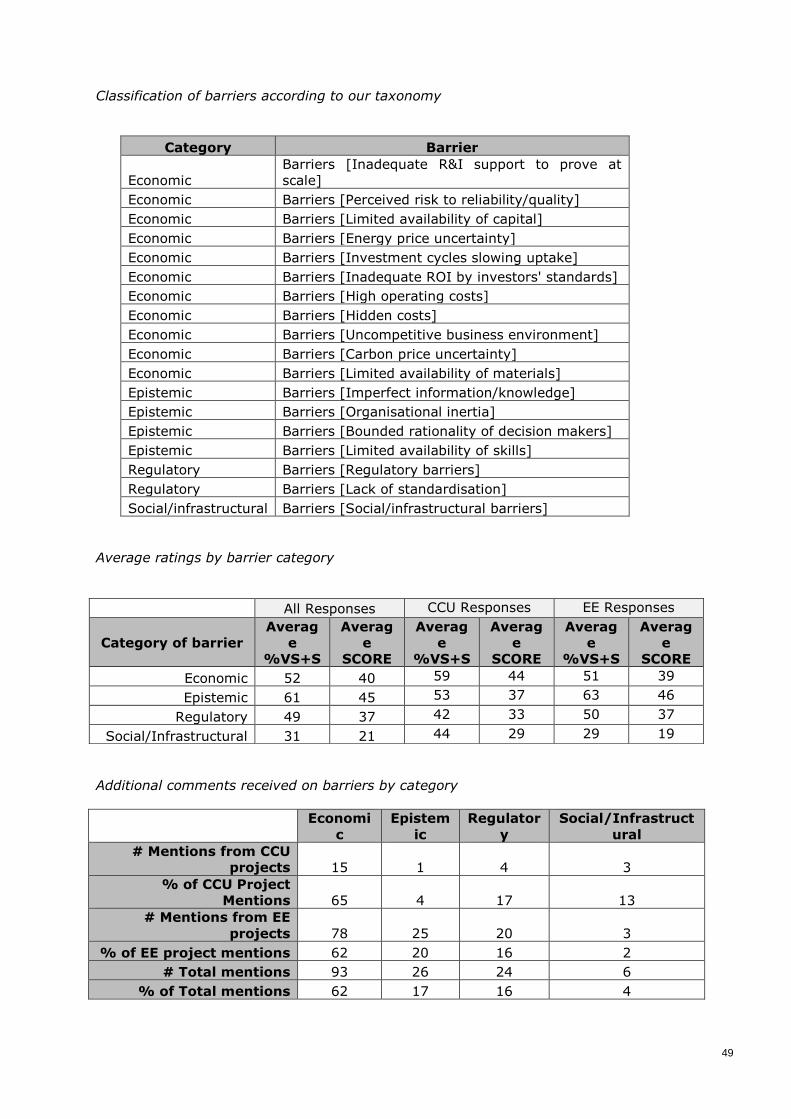
49
Classification of barriers according to our taxonomy
Category Barrier
Economic
Barriers [Inadequate R&I support to prove at
scale]
Economic Barriers [Perceived risk to reliability/quality]
Economic Barriers [Limited availability of capital]
Economic Barriers [Energy price uncertainty]
Economic Barriers [Investment cycles slowing uptake]
Economic Barriers [Inadequate ROI by investors' standards]
Economic Barriers [High operating costs]
Economic Barriers [Hidden costs]
Economic Barriers [Uncompetitive business environment]
Economic Barriers [Carbon price uncertainty]
Economic Barriers [Limited availability of materials]
Epistemic Barriers [Imperfect information/knowledge]
Epistemic Barriers [Organisational inertia]
Epistemic Barriers [Bounded rationality of decision makers]
Epistemic Barriers [Limited availability of skills]
Regulatory Barriers [Regulatory barriers]
Regulatory Barriers [Lack of standardisation]
Social/infrastructural Barriers [Social/infrastructural barriers]
Average ratings by barrier category
Additional comments received on barriers by category
Economi
c
Epistem
ic
Regulator
y
Social/Infrastruct
ural
# Mentions from CCU
projects 15 1 4 3
% of CCU Project
Mentions 65 4 17 13
# Mentions from EE
projects 78 25 20 3
% of EE project mentions 62 20 16 2
# Total mentions 93 26 24 6
% of Total mentions 62 17 16 4
All Responses CCU Responses EE Responses
Category of barrier
Averag
e
%VS+S
Averag
e
SCORE
Averag
e
%VS+S
Averag
e
SCORE
Averag
e
%VS+S
Averag
e
SCORE
Economic 52 40 59 44 51 39
Epistemic 61 45 53 37 63 46
Regulatory 49 37 42 33 50 37
Social/Infrastructural 31 21 44 29 29 19
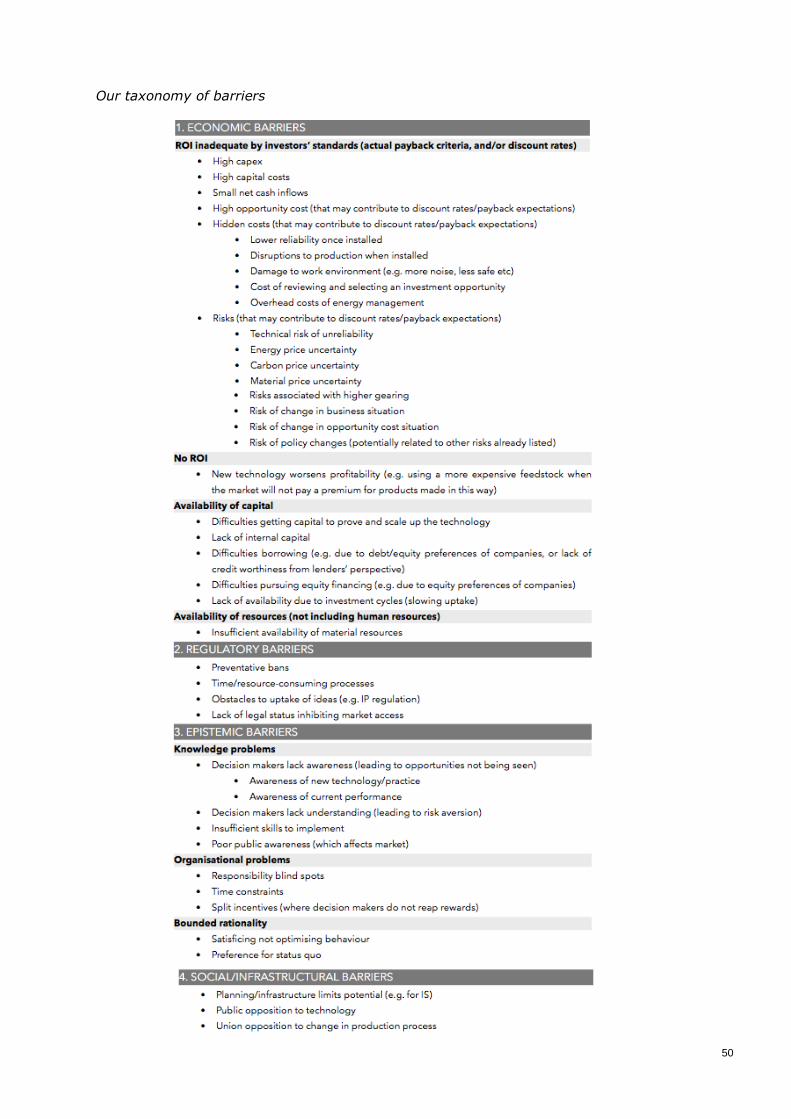
50
Our taxonomy of barriers
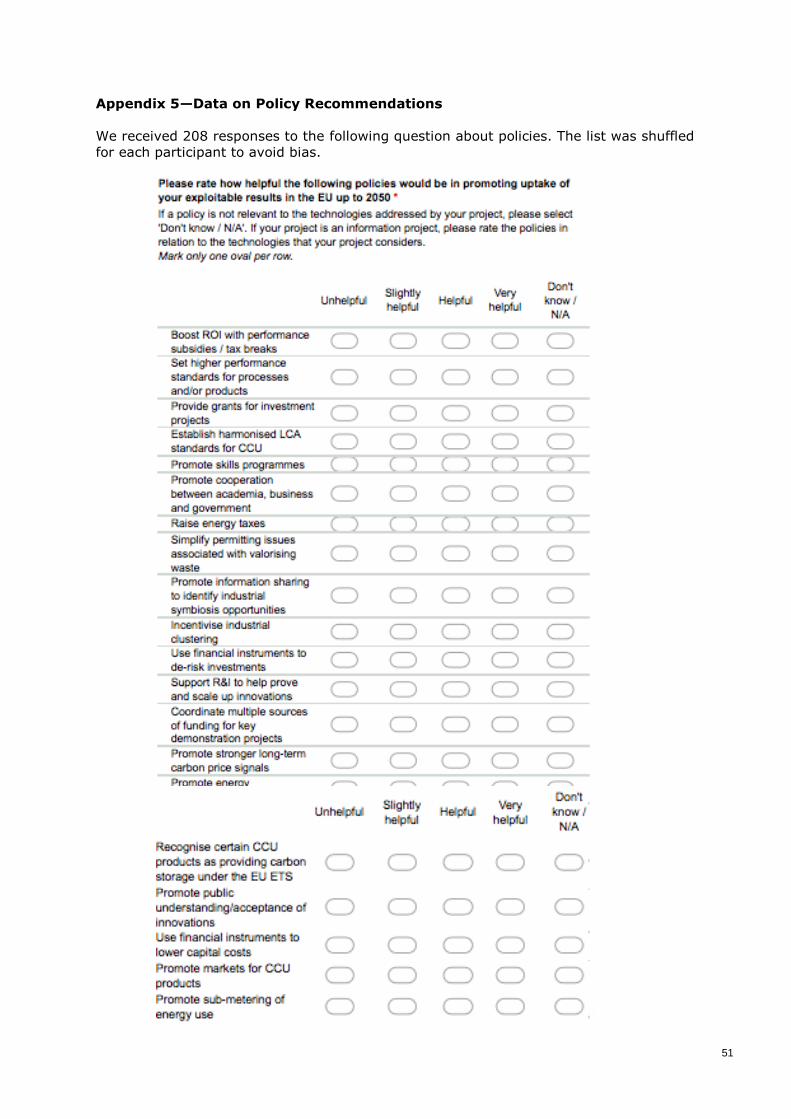
51
Appendix 5—Data on Policy Recommendations
We received 208 responses to the following question about policies. The list was shuffled
for each participant to avoid bias.

52
Key
#VH = number of responses rating a barrier Very Helpful
#VH+H = number of responses rating a barrier Very Helpful or Helpful
#VH+H+SH = number of responses rating a barrier Very Helpful, Helpful, or Slightly
Helpful
%VH = percentage of responses rating a barrier Very Helpful
%VH+H = percentage of responses rating a barrier Very Helpful or Helpful
%VH+H+SH = percentage of responses rating a barrier Very Helpful, Helpful, or
Slightly Helpful
SCORE = 100*(score of policy) / (maximum possible score) where Unhelpful = 0,
Slightly Helpful = 1, Helpful = 2, and Very Helpful = 3, and the maximum possible score
excludes Don’t Know / Not Applicable responses
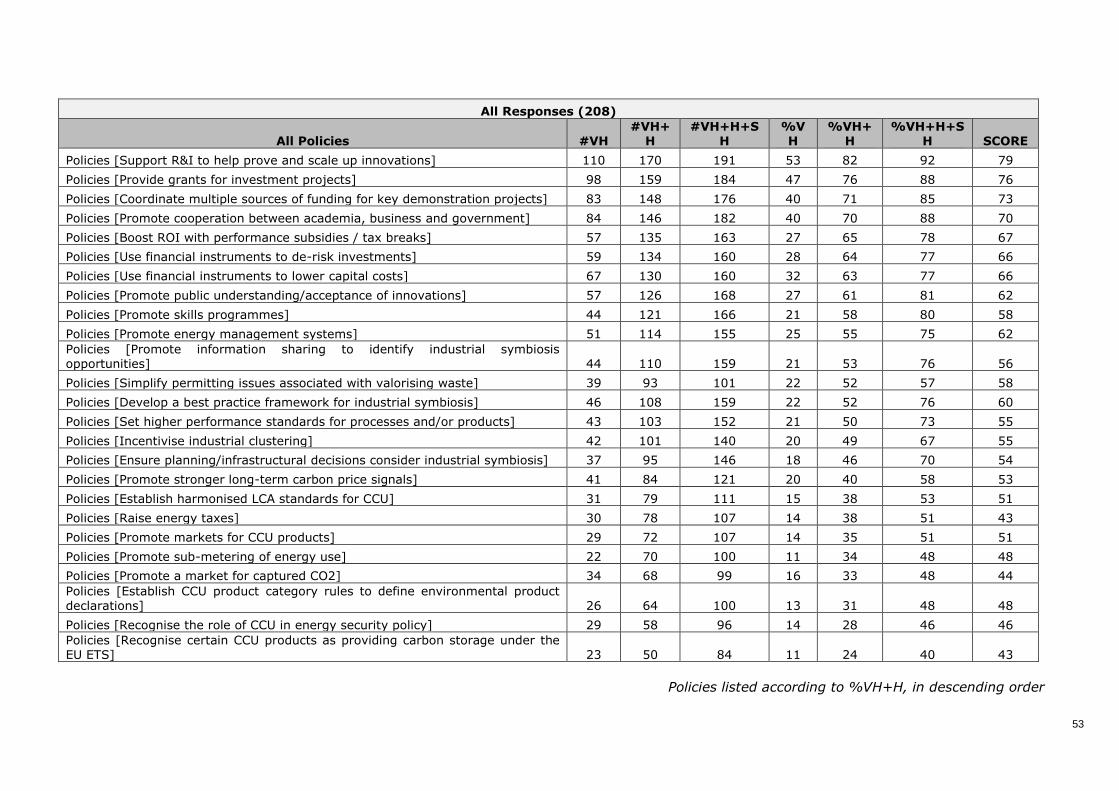
53
All Responses (208)
All Policies #VH #VH+
H #VH+H+S
H %VH
%VH+H
%VH+H+SH SCORE
Policies [Support R&I to help prove and scale up innovations] 110 170 191 53 82 92 79
Policies [Provide grants for investment projects] 98 159 184 47 76 88 76
Policies [Coordinate multiple sources of funding for key demonstration projects] 83 148 176 40 71 85 73
Policies [Promote cooperation between academia, business and government] 84 146 182 40 70 88 70
Policies [Boost ROI with performance subsidies / tax breaks] 57 135 163 27 65 78 67
Policies [Use financial instruments to de-risk investments] 59 134 160 28 64 77 66
Policies [Use financial instruments to lower capital costs] 67 130 160 32 63 77 66
Policies [Promote public understanding/acceptance of innovations] 57 126 168 27 61 81 62
Policies [Promote skills programmes] 44 121 166 21 58 80 58
Policies [Promote energy management systems] 51 114 155 25 55 75 62
Policies [Promote information sharing to identify industrial symbiosis opportunities] 44 110 159 21 53 76 56
Policies [Simplify permitting issues associated with valorising waste] 39 93 101 22 52 57 58
Policies [Develop a best practice framework for industrial symbiosis] 46 108 159 22 52 76 60
Policies [Set higher performance standards for processes and/or products] 43 103 152 21 50 73 55
Policies [Incentivise industrial clustering] 42 101 140 20 49 67 55
Policies [Ensure planning/infrastructural decisions consider industrial symbiosis] 37 95 146 18 46 70 54
Policies [Promote stronger long-term carbon price signals] 41 84 121 20 40 58 53
Policies [Establish harmonised LCA standards for CCU] 31 79 111 15 38 53 51
Policies [Raise energy taxes] 30 78 107 14 38 51 43
Policies [Promote markets for CCU products] 29 72 107 14 35 51 51
Policies [Promote sub-metering of energy use] 22 70 100 11 34 48 48
Policies [Promote a market for captured CO2] 34 68 99 16 33 48 44
Policies [Establish CCU product category rules to define environmental product declarations] 26 64 100 13 31 48 48
Policies [Recognise the role of CCU in energy security policy] 29 58 96 14 28 46 46
Policies [Recognise certain CCU products as providing carbon storage under the EU ETS] 23 50 84 11 24 40 43
Policies listed according to %VH+H, in descending order
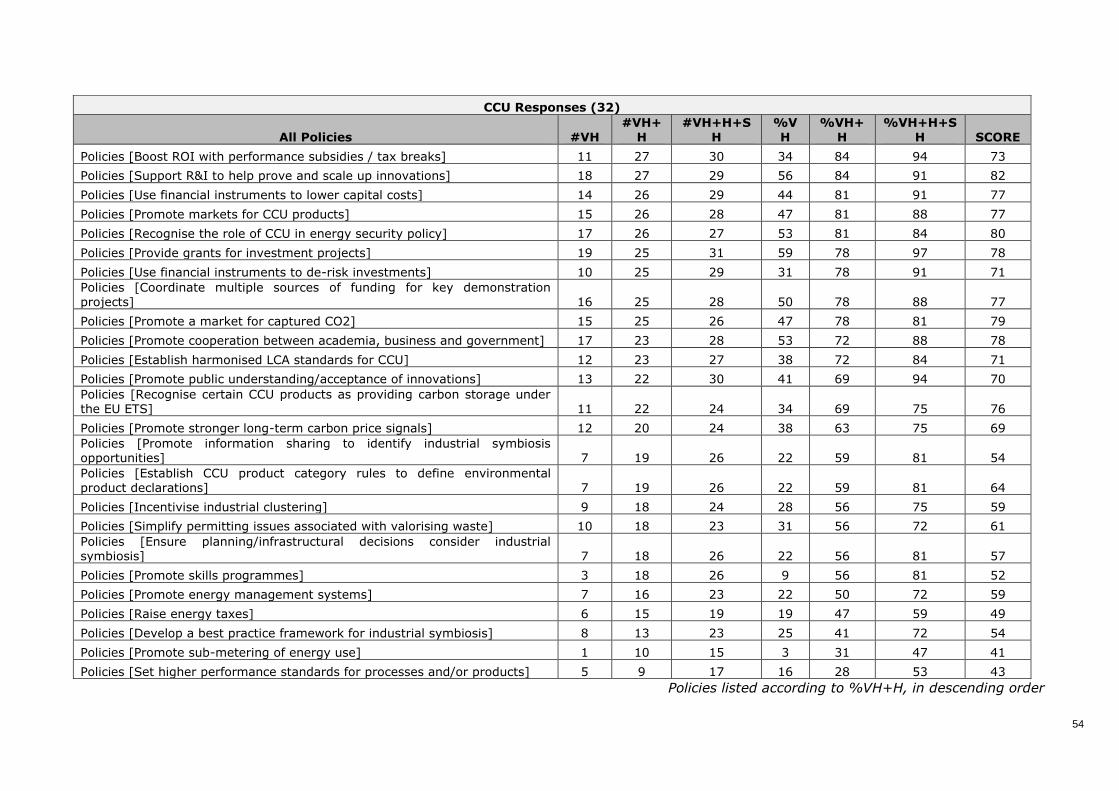
54
Policies listed according to %VH+H, in descending order
CCU Responses (32)
All Policies #VH #VH+
H #VH+H+S
H %VH
%VH+H
%VH+H+SH SCORE
Policies [Boost ROI with performance subsidies / tax breaks] 11 27 30 34 84 94 73
Policies [Support R&I to help prove and scale up innovations] 18 27 29 56 84 91 82
Policies [Use financial instruments to lower capital costs] 14 26 29 44 81 91 77
Policies [Promote markets for CCU products] 15 26 28 47 81 88 77
Policies [Recognise the role of CCU in energy security policy] 17 26 27 53 81 84 80
Policies [Provide grants for investment projects] 19 25 31 59 78 97 78
Policies [Use financial instruments to de-risk investments] 10 25 29 31 78 91 71
Policies [Coordinate multiple sources of funding for key demonstration projects] 16 25 28 50 78 88 77
Policies [Promote a market for captured CO2] 15 25 26 47 78 81 79
Policies [Promote cooperation between academia, business and government] 17 23 28 53 72 88 78
Policies [Establish harmonised LCA standards for CCU] 12 23 27 38 72 84 71
Policies [Promote public understanding/acceptance of innovations] 13 22 30 41 69 94 70
Policies [Recognise certain CCU products as providing carbon storage under the EU ETS] 11 22 24 34 69 75 76
Policies [Promote stronger long-term carbon price signals] 12 20 24 38 63 75 69
Policies [Promote information sharing to identify industrial symbiosis opportunities] 7 19 26 22 59 81 54
Policies [Establish CCU product category rules to define environmental product declarations] 7 19 26 22 59 81 64
Policies [Incentivise industrial clustering] 9 18 24 28 56 75 59
Policies [Simplify permitting issues associated with valorising waste] 10 18 23 31 56 72 61
Policies [Ensure planning/infrastructural decisions consider industrial symbiosis] 7 18 26 22 56 81 57
Policies [Promote skills programmes] 3 18 26 9 56 81 52
Policies [Promote energy management systems] 7 16 23 22 50 72 59
Policies [Raise energy taxes] 6 15 19 19 47 59 49
Policies [Develop a best practice framework for industrial symbiosis] 8 13 23 25 41 72 54
Policies [Promote sub-metering of energy use] 1 10 15 3 31 47 41
Policies [Set higher performance standards for processes and/or products] 5 9 17 16 28 53 43
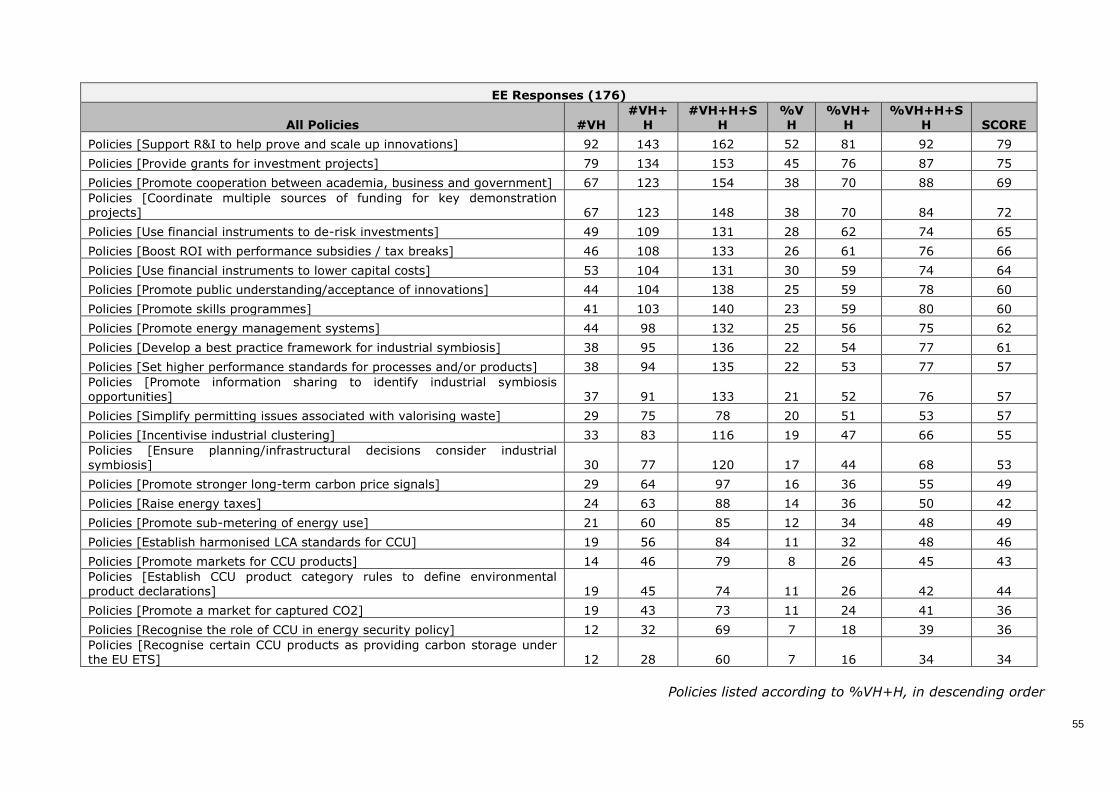
55
EE Responses (176)
All Policies #VH #VH+
H #VH+H+S
H %VH
%VH+H
%VH+H+SH SCORE
Policies [Support R&I to help prove and scale up innovations] 92 143 162 52 81 92 79
Policies [Provide grants for investment projects] 79 134 153 45 76 87 75
Policies [Promote cooperation between academia, business and government] 67 123 154 38 70 88 69
Policies [Coordinate multiple sources of funding for key demonstration projects] 67 123 148 38 70 84 72
Policies [Use financial instruments to de-risk investments] 49 109 131 28 62 74 65
Policies [Boost ROI with performance subsidies / tax breaks] 46 108 133 26 61 76 66
Policies [Use financial instruments to lower capital costs] 53 104 131 30 59 74 64
Policies [Promote public understanding/acceptance of innovations] 44 104 138 25 59 78 60
Policies [Promote skills programmes] 41 103 140 23 59 80 60
Policies [Promote energy management systems] 44 98 132 25 56 75 62
Policies [Develop a best practice framework for industrial symbiosis] 38 95 136 22 54 77 61
Policies [Set higher performance standards for processes and/or products] 38 94 135 22 53 77 57
Policies [Promote information sharing to identify industrial symbiosis opportunities] 37 91 133 21 52 76 57
Policies [Simplify permitting issues associated with valorising waste] 29 75 78 20 51 53 57
Policies [Incentivise industrial clustering] 33 83 116 19 47 66 55
Policies [Ensure planning/infrastructural decisions consider industrial symbiosis] 30 77 120 17 44 68 53
Policies [Promote stronger long-term carbon price signals] 29 64 97 16 36 55 49
Policies [Raise energy taxes] 24 63 88 14 36 50 42
Policies [Promote sub-metering of energy use] 21 60 85 12 34 48 49
Policies [Establish harmonised LCA standards for CCU] 19 56 84 11 32 48 46
Policies [Promote markets for CCU products] 14 46 79 8 26 45 43
Policies [Establish CCU product category rules to define environmental product declarations] 19 45 74 11 26 42 44
Policies [Promote a market for captured CO2] 19 43 73 11 24 41 36
Policies [Recognise the role of CCU in energy security policy] 12 32 69 7 18 39 36
Policies [Recognise certain CCU products as providing carbon storage under the EU ETS] 12 28 60 7 16 34 34
Policies listed according to %VH+H, in descending order
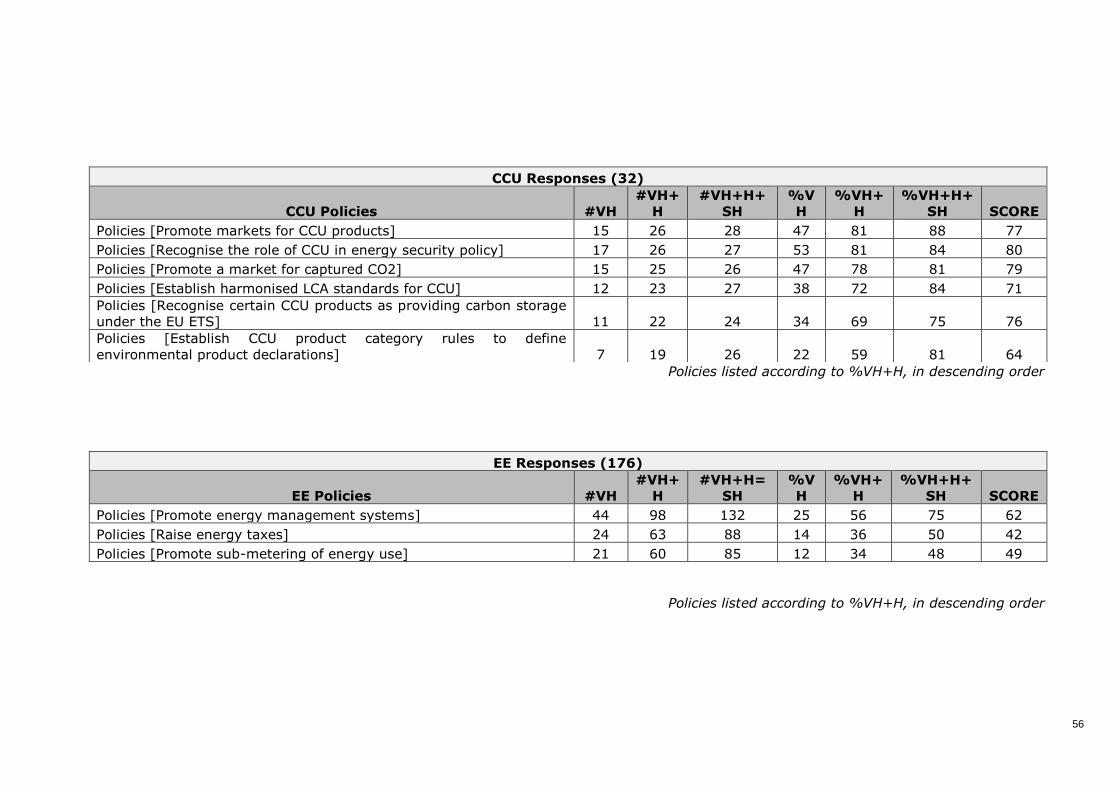
56
Policies listed according to %VH+H, in descending order
Policies listed according to %VH+H, in descending order
CCU Responses (32)
CCU Policies #VH
#VH+
H
#VH+H+
SH
%V
H
%VH+
H
%VH+H+
SH SCORE
Policies [Promote markets for CCU products] 15 26 28 47 81 88 77
Policies [Recognise the role of CCU in energy security policy] 17 26 27 53 81 84 80
Policies [Promote a market for captured CO2] 15 25 26 47 78 81 79
Policies [Establish harmonised LCA standards for CCU] 12 23 27 38 72 84 71
Policies [Recognise certain CCU products as providing carbon storage
under the EU ETS] 11 22 24 34 69 75 76
Policies [Establish CCU product category rules to define
environmental product declarations] 7 19 26 22 59 81 64
EE Responses (176)
EE Policies #VH
#VH+
H
#VH+H=
SH
%V
H
%VH+
H
%VH+H+
SH SCORE
Policies [Promote energy management systems] 44 98 132 25 56 75 62
Policies [Raise energy taxes] 24 63 88 14 36 50 42
Policies [Promote sub-metering of energy use] 21 60 85 12 34 48 49
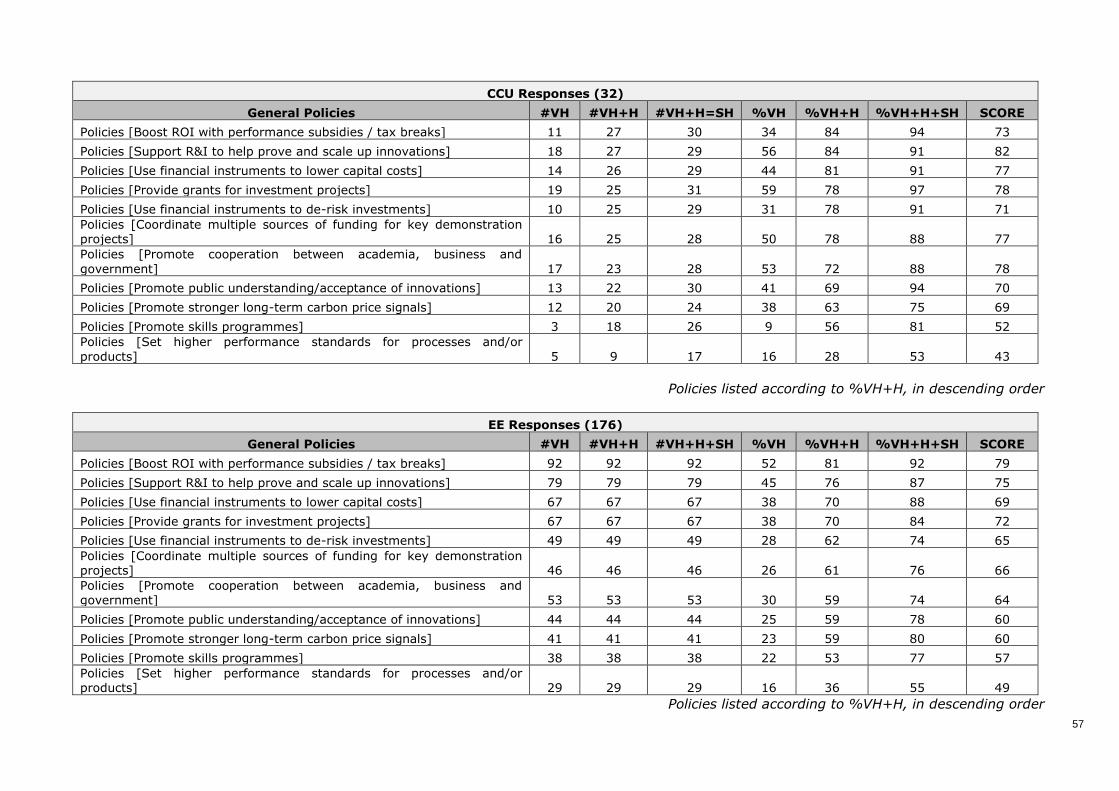
57
CCU Responses (32)
General Policies #VH #VH+H #VH+H=SH %VH %VH+H %VH+H+SH SCORE
Policies [Boost ROI with performance subsidies / tax breaks] 11 27 30 34 84 94 73
Policies [Support R&I to help prove and scale up innovations] 18 27 29 56 84 91 82
Policies [Use financial instruments to lower capital costs] 14 26 29 44 81 91 77
Policies [Provide grants for investment projects] 19 25 31 59 78 97 78
Policies [Use financial instruments to de-risk investments] 10 25 29 31 78 91 71
Policies [Coordinate multiple sources of funding for key demonstration projects] 16 25 28 50 78 88 77
Policies [Promote cooperation between academia, business and
government] 17 23 28 53 72 88 78
Policies [Promote public understanding/acceptance of innovations] 13 22 30 41 69 94 70
Policies [Promote stronger long-term carbon price signals] 12 20 24 38 63 75 69
Policies [Promote skills programmes] 3 18 26 9 56 81 52
Policies [Set higher performance standards for processes and/or
products] 5 9 17 16 28 53 43
Policies listed according to %VH+H, in descending order
EE Responses (176)
General Policies #VH #VH+H #VH+H+SH %VH %VH+H %VH+H+SH SCORE
Policies [Boost ROI with performance subsidies / tax breaks] 92 92 92 52 81 92 79
Policies [Support R&I to help prove and scale up innovations] 79 79 79 45 76 87 75
Policies [Use financial instruments to lower capital costs] 67 67 67 38 70 88 69
Policies [Provide grants for investment projects] 67 67 67 38 70 84 72
Policies [Use financial instruments to de-risk investments] 49 49 49 28 62 74 65
Policies [Coordinate multiple sources of funding for key demonstration projects] 46 46 46 26 61 76 66
Policies [Promote cooperation between academia, business and government] 53 53 53 30 59 74 64
Policies [Promote public understanding/acceptance of innovations] 44 44 44 25 59 78 60
Policies [Promote stronger long-term carbon price signals] 41 41 41 23 59 80 60
Policies [Promote skills programmes] 38 38 38 22 53 77 57
Policies [Set higher performance standards for processes and/or products] 29 29 29 16 36 55 49
Policies listed according to %VH+H, in descending order
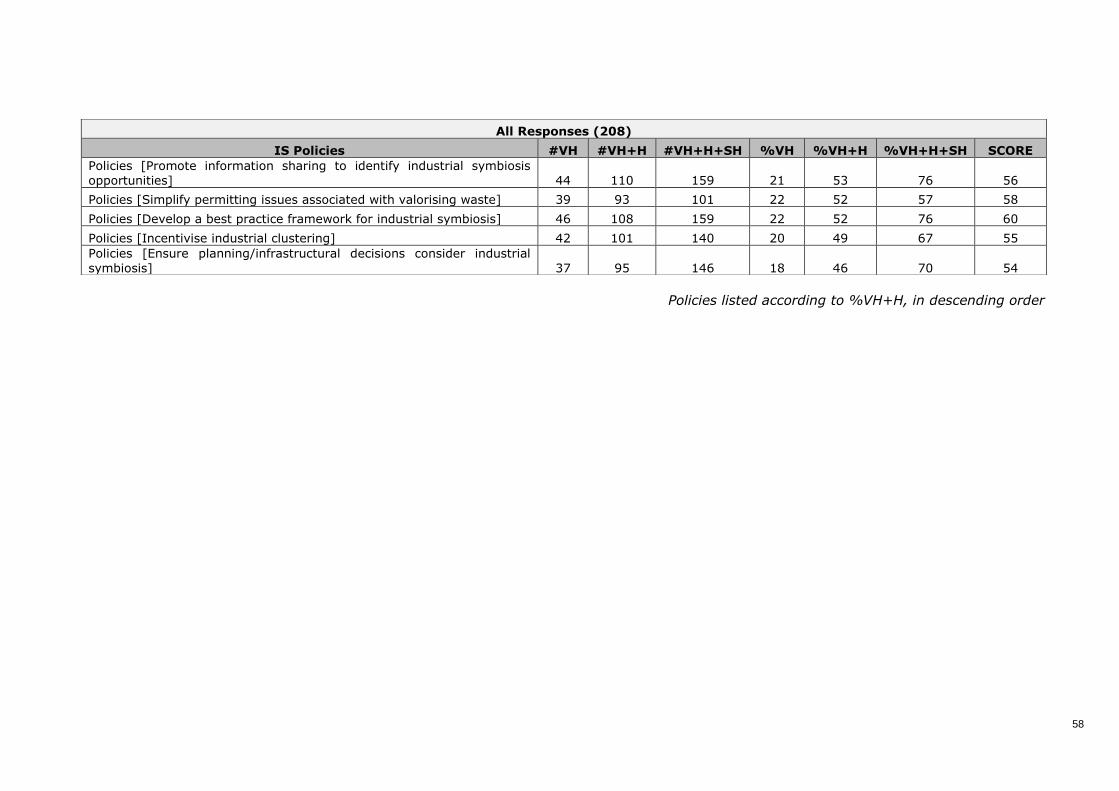
58
Policies listed according to %VH+H, in descending order
All Responses (208)
IS Policies #VH #VH+H #VH+H+SH %VH %VH+H %VH+H+SH SCORE
Policies [Promote information sharing to identify industrial symbiosis
opportunities] 44 110 159 21 53 76 56
Policies [Simplify permitting issues associated with valorising waste] 39 93 101 22 52 57 58
Policies [Develop a best practice framework for industrial symbiosis] 46 108 159 22 52 76 60
Policies [Incentivise industrial clustering] 42 101 140 20 49 67 55
Policies [Ensure planning/infrastructural decisions consider industrial
symbiosis] 37 95 146 18 46 70 54
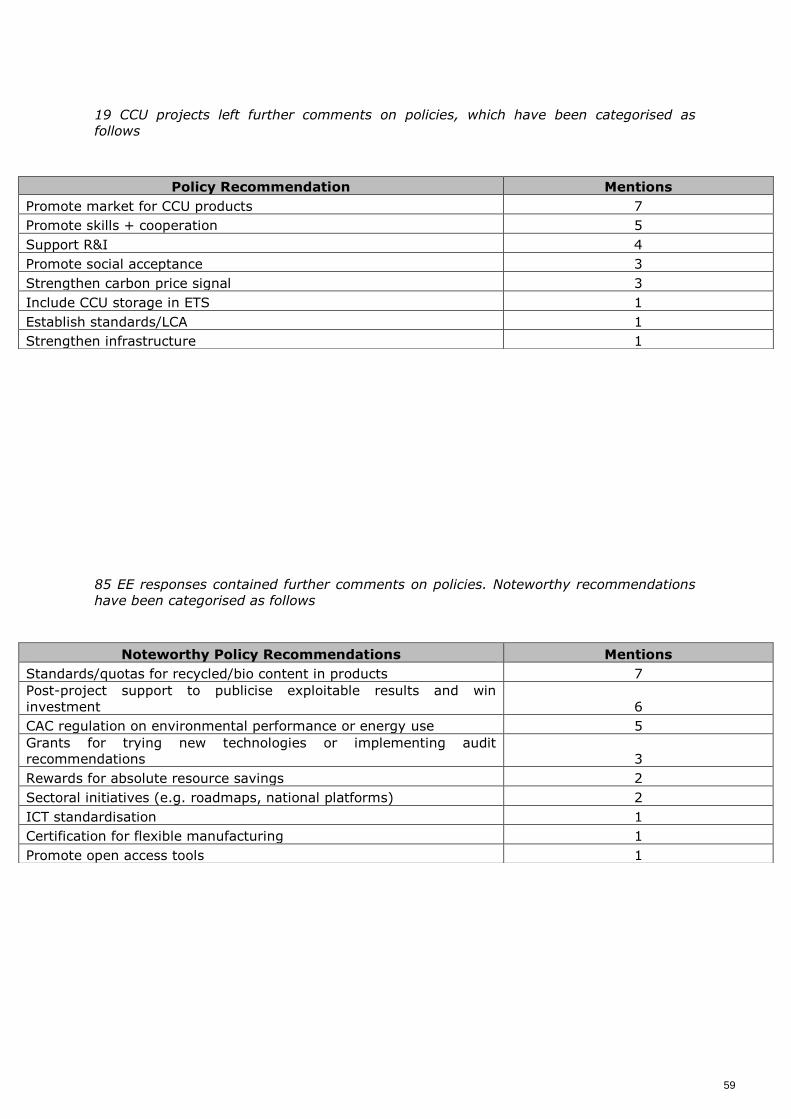
59
19 CCU projects left further comments on policies, which have been categorised as
follows
85 EE responses contained further comments on policies. Noteworthy recommendations
have been categorised as follows
Policy Recommendation Mentions
Promote market for CCU products 7
Promote skills + cooperation 5
Support R&I 4
Promote social acceptance 3
Strengthen carbon price signal 3
Include CCU storage in ETS 1
Establish standards/LCA 1
Strengthen infrastructure 1
Noteworthy Policy Recommendations Mentions
Standards/quotas for recycled/bio content in products 7
Post-project support to publicise exploitable results and win
investment 6
CAC regulation on environmental performance or energy use 5
Grants for trying new technologies or implementing audit
recommendations 3
Rewards for absolute resource savings 2
Sectoral initiatives (e.g. roadmaps, national platforms) 2
ICT standardisation 1
Certification for flexible manufacturing 1
Promote open access tools 1
Getting in touch with the EU
IN PERSON
All over the European Union there are hundreds of Europe Direct Information Centres.
You can find the address of the centre nearest you at: http://europa.eu/contact
ON THE PHONE OR BY E-MAIL
Europe Direct is a service that answers your questions about the European Union.
You can contact this service
– by freephone: 00 800 6 7 8 9 10 11 (certain operators may charge for these calls),
– at the following standard number: +32 22999696 or
– by electronic mail via: http://europa.eu/contact
Finding information about the EU
ONLINE
Information about the European Union in all the official languages of the EU is
available on the Europa website at:
http://europa.eu
EU PUBLICATIONS
You can download or order free and priced EU publications from EU Bookshop at:
http://bookshop.europa.eu. Multiple copies of free publications may be obtained
by contacting Europe Direct or your local information centre (see
http://europa.eu/contact)
EU LAW AND RELATED DOCUMENTS
For access to legal information from the EU, including all EU law since 1951 in all the
official language versions,
go to EUR-Lex at: http://eur-lex.europa.eu
OPEN DATA FROM THE EU
The EU Open Data Portal (http://data.europa.eu/euodp/en/data) provides access to
datasets from the EU. Data can be downloaded and reused for free, both for
commercial and
non-commercial purposes.
This study has been carried out to support related work on an initiative of DG Research
and Innovation called ‘Projects for Policy’ initiative (P4P). It deals specifically with 'Low-
Carbon Process Industries through Energy Efficiency and Carbon Dioxide Utilisation'. The
study objective is to assess the related results of research projects funded at EU level
under different instruments, including Horizon 2020. These results should accordingly
support the deployment of novel low carbon technologies in industry. The study includes
the assessment of a large portfolio of European funded research projects (559 in total),
complemented by a review of the literature in the field and a survey specifically designed
to obtain policy relevant input from project stakeholders. The last section of the report
proposes recommendations, with specific measures, to make the European industry more
sustainable and competitive, contributing to the realisation of the COP21 objectives. DG
Research and Innovation will soon publish its own assessment.
Studies and reports
[Ca
talo
gu
e n
um
be
r]