Embed Size (px)
Citation preview

Indian Institute of Management, Ahmedabad, India
Priyadarshi R. ShuklaIndian Institute of Management, Ahmedabad
Presented in:LCS‐RNet 6th Annual ConferenceRome, Italy October 1‐2, 2014
How can research serve international policy‐making towards Low Carbon Development Path?
Looking Forward
Plenary 4: Big win‐win is here in directing low carbon resilient development path

Indian Institute of Management, Ahmedabad, India
Presentation Agenda
1.Elements of ‐…Science‐Policy‐… Nexus
2.‘Big win‐win’ from the Past Assessments• Attributing causality to Climate Change • Articulating Pathways to Low Carbon Future
3.Looking Forward: ‐...Policy‐Science‐…Nexus• Research driven by policy‐makers’ agenda• Science benchmarked to ‘reality’• ‘End‐to‐End’ solutions that deliver multiple dividends• Community Driven; Cooperative Research

Indian Institute of Management, Ahmedabad, India
Elements of ‐…Science‐Policy‐… Nexus
1. Holistic and Integrative Perspective • What, Where, When? • How, Who?
2. Policy relevant Science• Integration of:
– Information across all Scientific disciplines – Develop methods and tools
• Find ‘insights’, ‘implications’ and ‘means’ for policy formulation and implementation
• Innovations & Information (Futuristic/Strategic Platforms)
3. Research informing Policy• Addressing key questions occupying policy‐maker’s minds• Outreach at Policy Forums

Indian Institute of Management, Ahmedabad, India
Policy and Science Nexus: What & How?
SciencePolicy•Domains•Actions
Policy Process
Policy• Options• Means
Objectives

Indian Institute of Management, Ahmedabad, India
Integrated Policy Assessment Framework
ATMOSPHERIC COMPOSITION CLIMATE & SEA LEVEL
HUMAN ACTIVITIES ECOSYSTEMS
MAGICCAtmospheric Chemistry
MAGICCOcean Carbon
Cycle
MAGICCClimate
MAGICC--Ocean· temperature
· sea level
ERBEnergy System
ERBOther Human
Systems
ALUAg., L'stock & Forestry
(none)Coastal System
MAGICCTerrestrial
Carbon Cyc.
ALUCrops & Forestry
Un-managed Eco-system & Animals
ALUHydrology
Indian Institute of Management, Ahmedabad, India
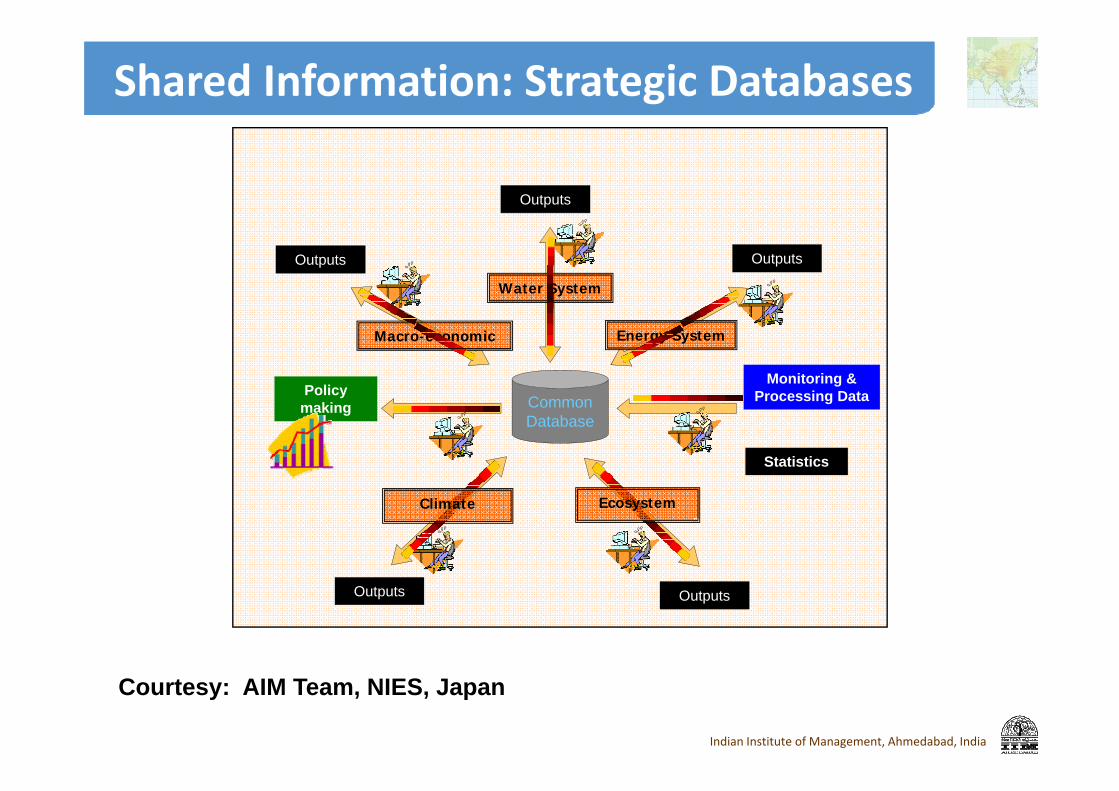
Shared Information: Strategic Databases
OutputsOutputs
OutputsOutputs
Outputs
CommonDatabase
Monitoring & Processing Data
Water System
Energy SystemMacro-economic
Climate Ecosystem
Policy making
Statistics
Courtesy: AIM Team, NIES, Japan

Indian Institute of Management, Ahmedabad, India
Policy and Science Nexus: Where, Who and When?
Space Time
Global Long‐term
National Medium‐term
Local Short‐term

Indian Institute of Management, Ahmedabad, India
‘Big win-win’ into ‘Low Carbon Resilient Development’:
Select Examples of Present/PastResearch Informing Policy

Indian Institute of Management, Ahmedabad, India
Evidence of Anthorpogenic Influence on Climate Change
IPCC SAR: The balance of evidence suggests a discernible human influence on global climate
IPCC TAR: "There is new and stronger evidence that most of the warming observed over the last 50 years is attributable to human activities".[
IPCC AR4: Anthropogenic warming of the climate system is widespreadand can be detected in temperature observations taken at the surface, in the free atmosphere and in the oceans. Evidence of the effect of external influences, both anthropogenic and natural, on the climate system has continued to accumulate since the TAR
IPCC AR5: it is "extremely likely" that human influence was the dominant cause of global warming between 1951 and 2010.[4]

Indian Institute of Management, Ahmedabad, India
There has been a considerable increase in national and sub‐national mitigation policies since AR4.
Based on Figures 15.1 and 13.3
Working Group III contribution to the IPCC Fifth Assessment Report
IPCC WGIII AR5

Indian Institute of Management, Ahmedabad, India
About half of cumulative anthropogenic CO2 emissions between 1750 and 2010 have occurred in the last 40 years.
IPCC WGIII AR5
Based on Figure 5.3
Indian Institute of Management, Ahmedabad, India
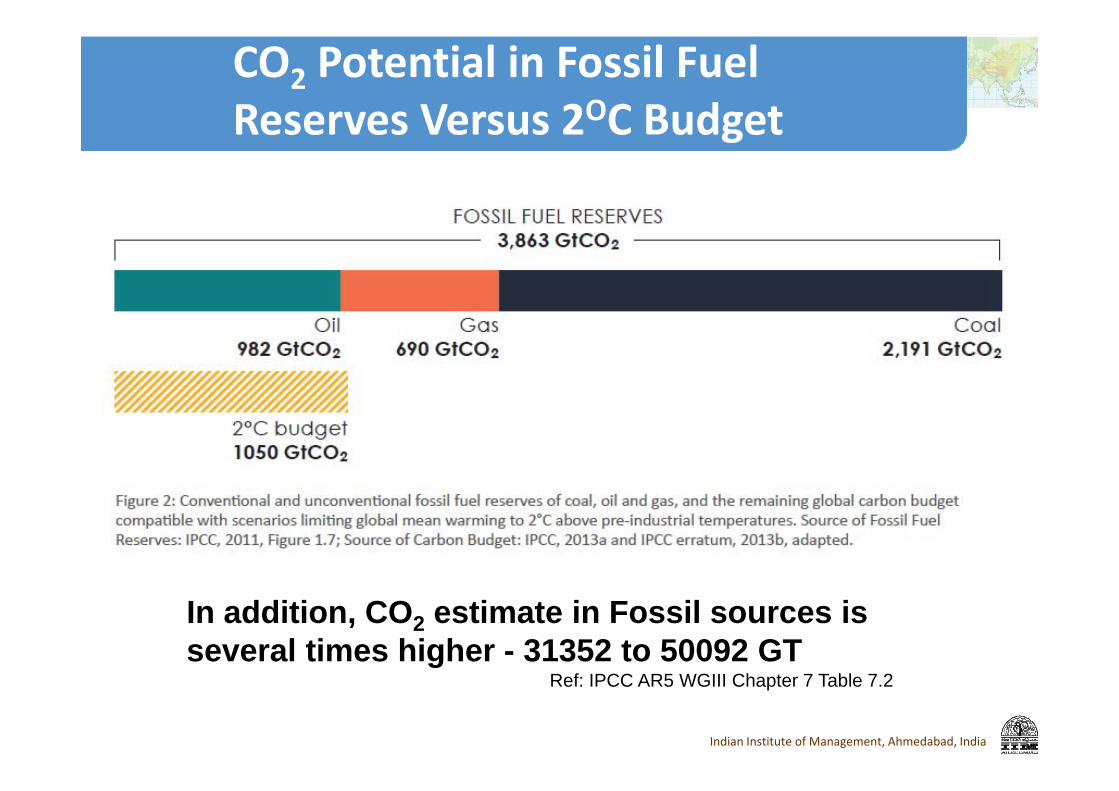
CO2 Potential in Fossil Fuel Reserves Versus 2OC Budget
In addition, CO2 estimate in Fossil sources is several times higher - 31352 to 50092 GT
Ref: IPCC AR5 WGIII Chapter 7 Table 7.2

Indian Institute of Management, Ahmedabad, India
Delayed mitigation significantly increases the challenge to reach low concentration targets
Current Cancun Pledges imply increased mitigation challenges for reaching 2°C
Figure SPM.5IPCC WGIII AR5

Indian Institute of Management, Ahmedabad, India
In cost‐effective 2°C mitigation strategies, emissions have peaked and emission levels in 2030 tend to be lower than today
Cost-effective mitigation
50 GtCO2e
Delayed mitigation
Figure SPM.5IPCC WGIII AR5
Assessment building on work of AMPERE project(Riahi et al., 2014, Tech. For. & Soc. Change, online first)
Current Cancun Pledges imply increased mitigation challenges for reaching 2°C

Indian Institute of Management, Ahmedabad, India
IPCC WGIII AR5
Figure SPM.9
Substantial reductions in emissions would require large changes in investment patterns.

Indian Institute of Management, Ahmedabad, India
Mitigation costs vary widely, but are relatively modest compared to overall economic growth under idealized assumptions.
Consumption losses in cost‐effective implementation scenarios
[% reduction in consumption relative to baseline]
[percentage point reduction in annualized
consumption growth rate]
2100 Concentration (ppm CO2eq)
2030 2050 2100 2010‐2100
450 (430–480) 1.7 (1.0–3.7) 3.4 (2.1–6.2) 4.8 (2.9–11.4) 0.06 (0.04–0.14)
500 (480–530) 1.7 (0.6–2.1) 2.7 (1.5–4.2) 4.7 (2.4–10.6) 0.06 (0.03–0.13)
550 (530–580) 0.6 (0.2–1.3) 1.7 (1.2–3.3) 3.8 (1.2–7.3) 0.04 (0.01–0.09)
580–650 0.3 (0–0.9) 1.3 (0.5–2.0) 2.3 (1.2–4.4) 0.03 (0.01–0.05)
By comparison overall consumption grows by 300-900% in the baselines
Costs exclude benefits of mitigation (reduced impacts as well as other co-benefits(e.g. improvements for local air quality).
Table SPM.2
Indian Institute of Management, Ahmedabad, India
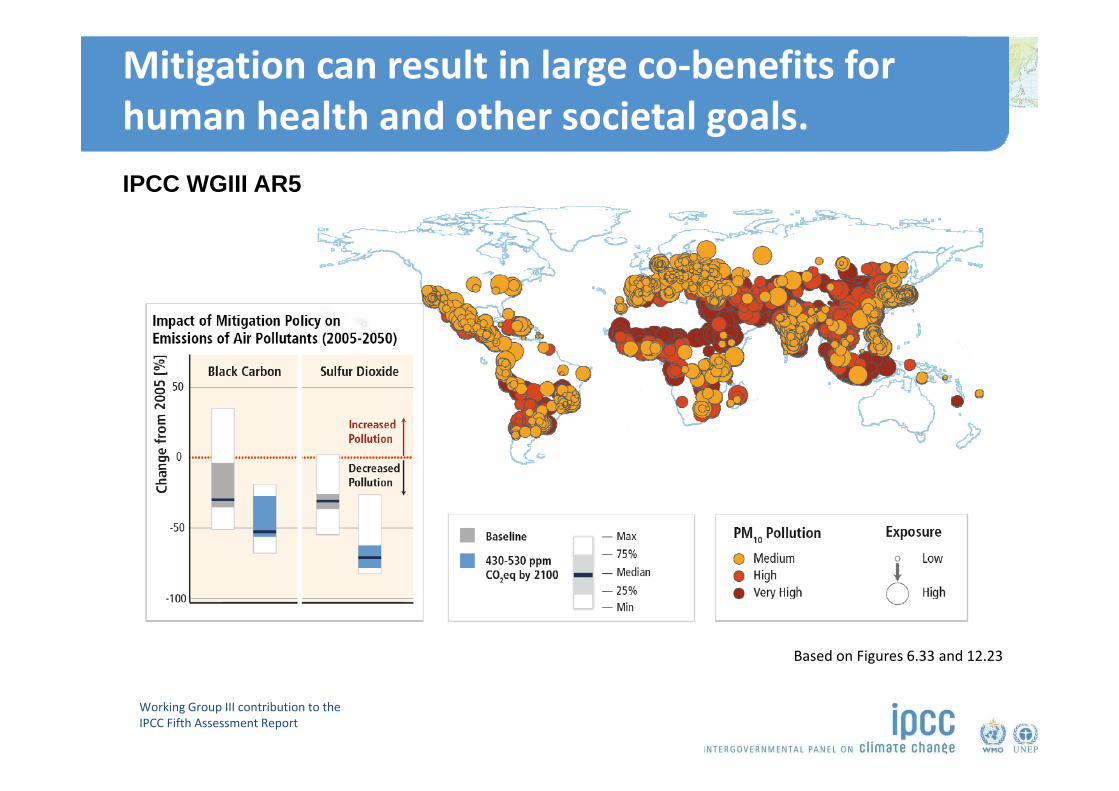
Mitigation can result in large co‐benefits for human health and other societal goals.
Based on Figures 6.33 and 12.23
Working Group III contribution to the IPCC Fifth Assessment Report
IPCC WGIII AR5

Indian Institute of Management, Ahmedabad, India
Looking Forward: ‐...Policy‐Science‐…Nexus• Rethinking Research Perspective • Cooperative and Community Driven Research• ‘Insights + Numbers’ with End‐to‐End Solutions

Indian Institute of Management, Ahmedabad, India
Rethinking Research Perspective
1. ‘Horses for Courses’ Approach to Research
2. Align low carbon research with
3. Look beyond obvious (conventional) options
4. Cooperation (low transaction costs & risks) + Competition (market efficiency)
5. New and Multiple Instruments to Facilitate Change
Indian Institute of Management, Ahmedabad, India20
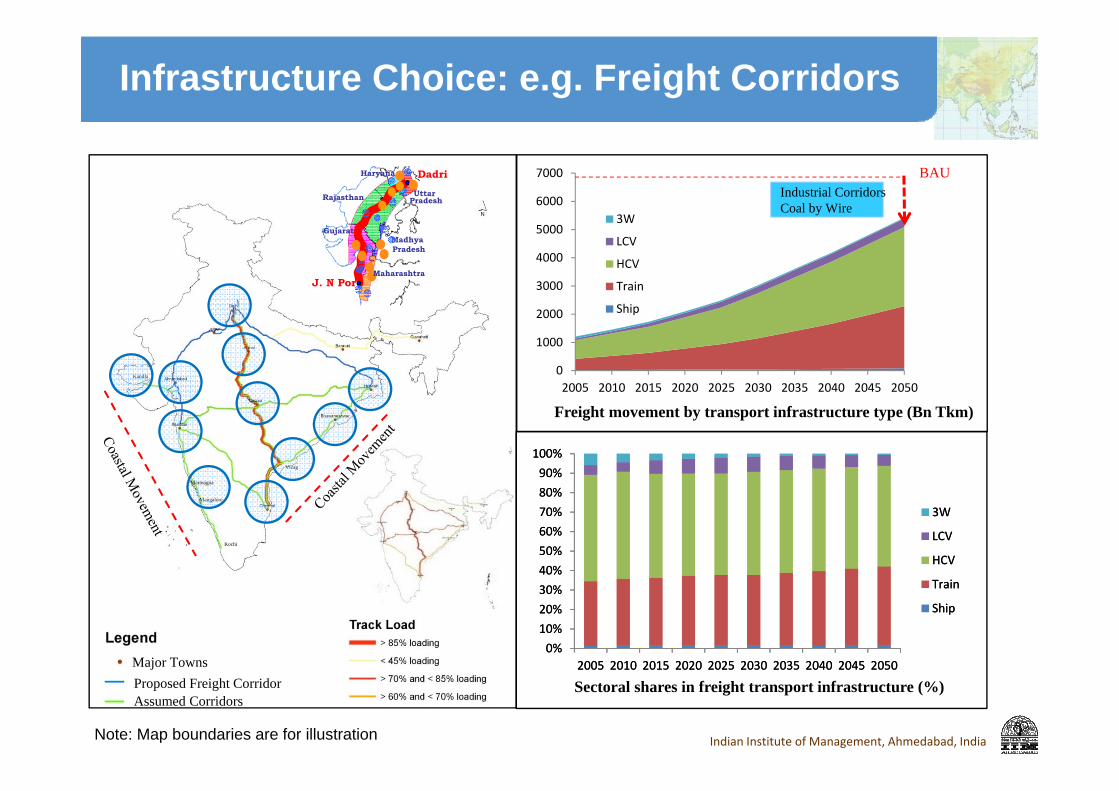
Haryana Dadri
J. N Port
Rajasthan
Maharashtra
GujaratMadhya Pradesh
Haryana
Uttar Pradesh
Major TownsProposed Freight CorridorAssumed Corridors
Kandla
Kochi
Mangalore
Vizag
Marmagoa
Freight movement by transport infrastructure type (Bn Tkm)
0%10%20%30%40%50%60%70%80%90%100%
2005 2010 2015 2020 2025 2030 2035 2040 2045 2050
3W
LCV
HCV
Train
Ship
Sectoral shares in freight transport infrastructure (%)
0
1000
2000
3000
4000
5000
6000
7000
2005 2010 2015 2020 2025 2030 2035 2040 2045 2050
3W
LCV
HCV
Train
Ship
BAUIndustrial CorridorsCoal by Wire
0%10%20%30%40%50%60%70%80%90%100%
2005 2010 2015 2020 2025 2030 2035 2040 2045 2050
3W
LCV
HCV
Train
Ship
Infrastructure Choice: e.g. Freight Corridors
Note: Map boundaries are for illustration
Indian Institute of Management, Ahmedabad, India
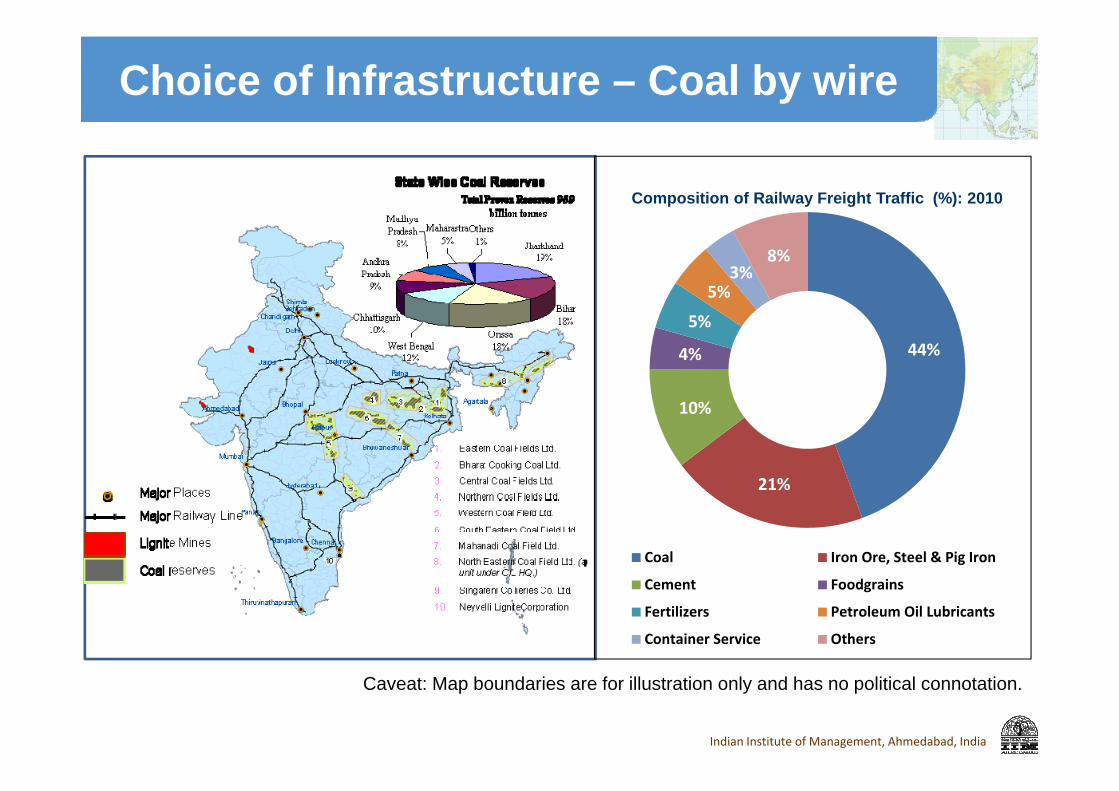
44%
21%
10%
4%
5%
5%3%
8%
Coal Iron Ore, Steel & Pig Iron
Cement Foodgrains
Fertilizers Petroleum Oil Lubricants
Container Service Others
Composition of Railway Freight Traffic (%): 2010
Caveat: Map boundaries are for illustration only and has no political connotation.
Choice of Infrastructure – Coal by wire

Indian Institute of Management, Ahmedabad, India
Co-benefits of South-Asia Integrated Energy-Water Market
Benefit (Saving) Cumulative from 2010 to 2030
$ Billion % GDP
Energy 60 Exa Joule 321 0.87
CO2 Equiv. 5.1 Billion Ton 28 0.08
SO2 50 Million Ton 10 0.03
Total 359 0.98
• More Water for Food Production (MDG1)
• 16 GW additional Hydropower (MDG1&7)
• Flood control (MDG1&7)
• Lower energy prices would enhance competitiveness of regional industries (MDG1)
¨
!.
!.
!.
!. !.
!.
!.!.!.!.
F
F
Ѻ
ѺѺ
India
China
Iran
Pakistan
Afghanistan
OmanMyanmar (Burma)
Thailand
Nepal
Turkmenistan
Saudi Arabia
Tajikistan
Yemen
Bangladesh
Sri Lanka
Bhutan
Uzbekistan
Somalia
United Arab Emirates
Qatar
Laos
Malaysia
Bahrain
IndonesiaMaldives
Pune
GayaKota
Guna
Gadag
Kochi
Patna
Delhi
Anand
Dadra
SuratOlpad
Kalol
Panvel
Hassan
Dispur
Ambala
Nangal
Kanpur
Jhansi
UjjainJhabua
Valsad
NadiadRajkot
SolapurGuhagarChiptun
Chennai
Nellore
Kolkata
Sangrur
Sonipat
AuraiyaGwalior
Chotila Bharuch
PalmanerChittoor
Kokinada
LudhianaBathinda
Bareilly
Vijaypur
Mahesana
Tutikorin
MangaloreBangalore
Vijaywada
Faridabad
Ratnagiri
Kayankulam
Coimbatore
Jagdishpuri
Shahjahanpur
Vishakhapattnam
Tiruchchirappalli
Herat
MultanQuetta
Khuzdar
Karachi
DelaramKandhar
South-ParsIranshaharBandar-e-Abbas
Legend Important PlacesExisting Gas Pipelines
Proposed Gas PipelinesExisting LNG terminalsProposed LNG terminalsExisting Gas Basin
Gas Pipelines under construction
Proposed Gas Basin¨
Spill-over Benefits / Co-Benefits
Integrated S-Asia Energy Market – Co-benefits
Indian Institute of Management, Ahmedabad, India
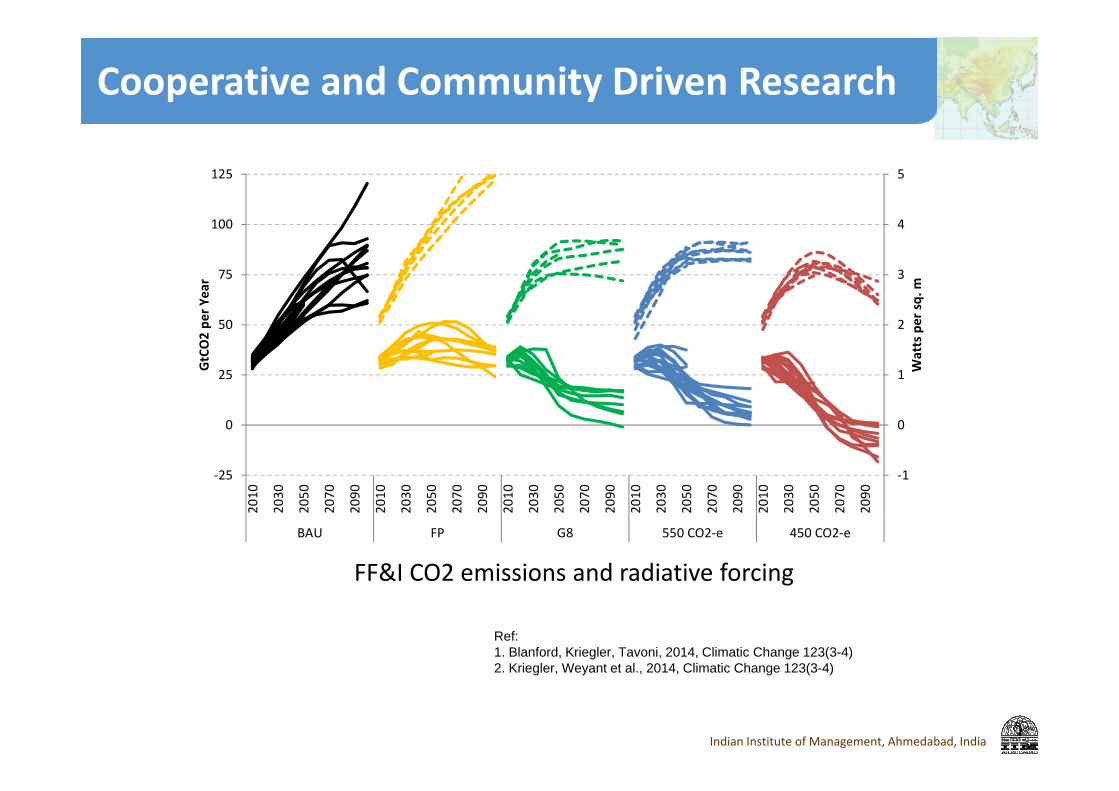
Cooperative and Community Driven Research
FF&I CO2 emissions and radiative forcing
‐1
0
1
2
3
4
5
‐25
0
25
50
75
100
125
2010
2030
2050
2070
2090
2010
2030
2050
2070
2090
2010
2030
2050
2070
2090
2010
2030
2050
2070
2090
2010
2030
2050
2070
2090
BAU FP G8 550 CO2‐e 450 CO2‐e
Watts per sq. m
GtCO2 pe
r Year
Ref: 1. Blanford, Kriegler, Tavoni, 2014, Climatic Change 123(3-4)2. Kriegler, Weyant et al., 2014, Climatic Change 123(3-4)

Indian Institute of Management, Ahmedabad, India
‘Insights + Numbers’ with End‐to‐End Solutions
1. Research is framed to find generic ‘insights’ and ‘numbers’;
2. Reframing of research is therefore the needed to address dynamics at ‘specifics’ and propose ‘End‐to‐End’ solutions
3. Free market competition delivers economic efficiency where perfect ‘rule of law’ institutions exist; the diversity of contexts needs ‘cooperation’ to be the driving force of low carbon policies
4. Stakeholder engagement is vital for cooperation and to minimize ‘transaction costs and risks’ of implementing ‘ideal’ solutions
5. Shared and Inclusive vision is vital to propose and implement ‘End‐to‐End’ solutions

Indian Institute of Management, Ahmedabad, India
1. Low carbon research has made eminent contributions to climate policymaking
2. The shifting context needs research to find new directions and approaches
3. Research needs greater global engagement, especially of developing countries where new opportunities, in the short‐run, may prevent long‐term ‘lock‐ins’
4. Low carbon research needs to be more sharing, caring and daring.
Policymakers have shown keen interest in low carbon policy research and would support knowledge networks so long as research is purposive, inclusive and practical.
Conclusions: Looking Forward
Thank you