Embed Size (px)
Citation preview
plied for the projection of carbon dioxide (CO2) emission and design
of LCS scenario. This preliminary research focuses on energy-related
CO2 emission.
Semarang City’s CO2 emission is estimated to be 5,282 ktCO2e in
2015 based on collected data. The industry sector is a sector emit-
ting the largest CO2 in Semarang City. This sector accounts for nearly
half of the total emission.
Two kinds of scenarios, namely Business as Usual (BaU) scenario
and Countermeasure (CM) scenario, are prepared to analyze reduc-
tion potential of CO2 emission in future. In BaU scenario, it is as-
sumed that there is no policy or technology intervention to reduce
carbon emission, while attempt to reduce carbon emission is as-
sumed in CM scenario. In the CM scenario, Semarang City Govern-
ment will promote five LCS actions and implement various LCS pro-
jects belonged to the actions. One of the action named “Sustainable
Transport”, which promotes energy efficient vehicle and modal shift,
will contribute to the reduction of 4,220 ktCO2e. These actions and
projects help Semarang City to reduce total CO2 emission in 2030 by
29% compared to BaU scenario. CO2 emission per GDP, which is 39.4
tCO2e/bil. Rp in 2015, will be decreased to 26.9 tCO2e/bil. Rp in BaU
scenario and to 19.2 tCO2e/bil. Rp in CM scenario by 2030. Besides,
CO2 emission per capita is 3.3 tCO2e/person in 2015 and will be in-
creased by more than 3 times from 2015 to 2030 in BaU scenario. On
the other hand, it will be reduced to 7.8 tCO2e/person from BaU
scenario in CM scenario.
In conclusion, Semarang City has a potential to reduce CO2 emis-
sion corresponding to INDC of Indonesia. The city can be developed
more effectively and efficiently with contribution to the mitigation of
world climate change.
The phenomenon of climate change in the last few decades has
become one of the strategic issues for all over the world, including
Indonesia. At the G20 Summit in Pittsburgh and COP15 in Copenha-
gen, Indonesia is committed to taking part in reducing greenhouse
gases (GHG) by 26% with domestic resources and 41% with interna-
tional assistance in 2020. The commitments are then followed up by
the formulation of Presidential Regulation No. 61/2011 and No.
71/2011 on national action plans for GHG reduction. This regulation
provides the basis for ministries, institutions and local governments
to implement programs/activities aimed at reducing GHG emissions
from key development sectors. The Presidential Regulation has man-
dated local governments to develop Local Action Plans for Green-
house Gas Emission Reduction. Moreover, Indonesia has set uncon-
ditional reduction target of 29% and conditional reduction target up
to 41 % of the business as usual scenario by 2030 in Intended Na-
tionally Determined Contribution (INDC) in 2015.
Following up the Presidential Regulation 61/2011 and 71/2011,
Semarang City as one of the cities in Indonesia has a liability in the
GHG reduction activities. This research on the low carbon society
(LCS) scenario for Semarang City are carried out aiming to contribu-
tion to promoting climate change actions and policies in the city.
This study is one of the outcomes of the collaboration among Mu-
nicipality of Semarang, Diponegoro University and Asia-Pacific Inte-
grated Model (AIM) team in Japan.
The research are begun with collecting data and information
related to socioeconomic parameters and energy consumption. A lot
of domestic and international sources are used to estimate both
current and future status of Semarang City. The entire data is pro-
cessed with the help of Extended Snapshot (ExSS) tool. ExSS is ap-
1
LOW CARBON SOCIETY SCENARIOLOW CARBON SOCIETY SCENARIOLOW CARBON SOCIETY SCENARIO
SEMARANG 2030SEMARANG 2030SEMARANG 2030 Research Model
2015 2030BaU 2030CM 2030BaU/2015 2030CM/2030BaU
CO2 emission (ktCO2e) 5,282 22,409 16,009 4.24 0.71
Industry 2,524 14,577 10,826 5.77 0.74
Commercial 571 4,042 2,665 7.08 0.66
Residential 748 1,174 862 1.57 0.73
Passenger transport 1,351 2,093 1,246 1.55 0.60
Freight transport 87 523 410 5.99 0,78
CO2 emission per GDP (tCO2e/bil. Rp) 39.4 26.9 19.2 0.68 0.71
CO2 emission per capita (tCO2e/person) 3.3 10.9 7.8 3.29 0.71
Table 1. CO2 emission by sector
Based on collected data of Semarang City in 2015 and infor-
mation such as the national economic vision, “Masterplan for Accel-
eration and Expansion of Indonesia's Economic Development 2011-
2025”, socioeconomic indicators for 2030 has been projected as
shown in Table 2. There will have been an increase in the number of
each socioeconomic factor by 2030.
SOCIOECONOMIC VISION Table 2. Main socioeconomic indicators in Semarang City
Population of Semarang City will grow by 464,733 people from
2015 to 2030 or 1.29 times as much as population in 2015. This situ-
ation is similar to the number of households in Semarang City. The
number of households will also increase by 1.46 times compared to
the number in 2015. Growth of the number of households is a little
bit faster than population growth because household size will be-
As described in Table 2, the increase of macroeconomic indicators
occurred by 2030 is about 6 times as much as the value in 2015. There
are three aspects underlying the macroeconomic conditions which are
gross regional domestic product (GRDP), GRDP per capita and final
consumption expenditure.
First, the value of GRDP in 2015, which amounted to 134,207 bil. Rp,
will have increased to as big as 834,197 bil. Rp by 2030. Manufacturing
of food, textile and transport equipment and Information and commu-
nication technology (ICT) industry will lead the economic growth of this
area as written in the masterplan. The largest contributor to GRDP in
Semarang City is the secondary sector. Table 3 and Figure 1 indicate the
change of economic structure in Semarang City. GRDP of Semarang City
in 2030 will still be dominated by the secondary sector, especially the
In connection with the increasing socioeconomic aspects of Semarang
City, transport demand will also grow by 2030. Freight transport volume will
increase by 5.99 times from 2015, while growth rate of passenger transport
volume between 2015 and 2030 is 1.55. Freight transport demand will
change rapidly leaded by the growing manufacturing output.
Figure 2 describes modal share in passenger transport . In BaU scenario,
modal share is assumed not to be changed from 2015. On the other hand,
modal shift from motorbikes and private cars to public transportation such
us buses, bus rapid transits (BRTs) and railways are expected in CM scenario.
Modal share of public transportation will have reached to 25% by 2030 in
CM scenario.
2
Unit 2015 2030 2030/2015
Population persons 1,595,267 2,060,000 1.29
No. of households households 471,327 686,667 1.46
GRDP per capita mil. Rp 84 405 4.81
GRDP bil. Rp 134,207 834,197 6.22
Primary industry 1,373 3,590 2.61
Secondary industry 73,340 440,906 6.01
Tertiary industry 59,493 389,701 6.55
Final consumption bil. Rp 79,822 486,134 6.09
Gross capital formation bil. Rp 99,697 607,179 6.09
Export bil. Rp 37,563 228,772 6.09
Import bil. Rp 114,672 690,811 6.02
Commercial floor area thous. m2 50,252 330,043 6.57
Transport demand
Passenger transport mil. pass-km 18,342 28,422 1.55
Freight transport mil. ton-km 3,391 20,307 5.99
Table 3. GRDP by economic activity
2015 2030 2030/2015
Primary industry 1,373 3,590 2.61
Secondary industry 73,340 440,906 6.01
Mining and quarrying 261 1,414 5.41
Foods, beverage and tobacco 17,885 110,507 6.18
Paper, paper products and printing 408 2,165 5.30
Chemicals and pharmaceuticals 6,785 35,783 5.27
Non-metal mineral products 459 1,490 3.24
Basic metals 2,840 17,264 6.08
Metal products, machinery and equipment 2,804 17,162 6.12
Other manufacturing 5,695 32,959 5.79
Construction 36,201 222,162 6.14
Tertiary industry 59,493 389,701 6.55
Electricity, gas, water and waste 250 1,658 6.62
Wholesale and retail trade 18,966 124,395 6.56
Transport and communications 14,669 99,352 6.77
Financial, real estate and company services 10,452 67,700 6.48
Other services 15,157 96,597 6.37
Total 134,207 834,197 6.22
Macro Economy
Population and Household
Transportation
Figure 2. Modal share in passenger transport
construction industry, followed by the tertiary sector, and the last is
the primary sector. Nevertheless, the increase in GRDP in the second-
ary sector is not greater than that of the tertiary sector. Growth rates
of the primary, secondary and tertiary sectors between 2015 and 2030
are 2.61 times, 6.01 times and 6.55 times.
Second is GRDP per capita. GRDP per capita in 2015 was 84 mil. Rp
and will have reached to 405 mil. Rp by 2030. GRDP per capita will
increase by 4.81 times compared with that in 2015.
As a result of population growth and income increase caused by
economic growth, final consumption expenditure in the year 2030 will
also have increased rapidly. The increase in the year 2030 equals to
6.09 times as large as that in 2015. There is a connection between
consumption expenditure and GRDP, especially in the high increase in
tertiary sectors, namely Transport and communications; Electricity, gas,
water and waste; Wholesale and retail trade; and Financial, real estate
and company services.
Figure 1. GRDP share by economic activity
0% 20% 40% 60% 80% 100%
2015
2030BaU
2030CM
Modal share in passenger transport
Walk, Bicycle Motorbike Car Bus, BRT Railway, MRT
0%
10%
20%
30%
40%
50%
60%
70%
80%
90%
100%
2015 2030
GR
DP
sh
are
(%
)
Other services
Financial, real estate and company services
Transport and Communications
Wholesale and retail trade
Electricity, gas, water and waste
Construction
Other manufacturing
Metal products, machinery and equipment
Basic metals
Non-metal mineral products
Chemicals and pharmaceuticals
Paper, paper products and printing
Foods, beverage and tobacco
Mining and quarrying
Agriculture, forestry, and fisheries
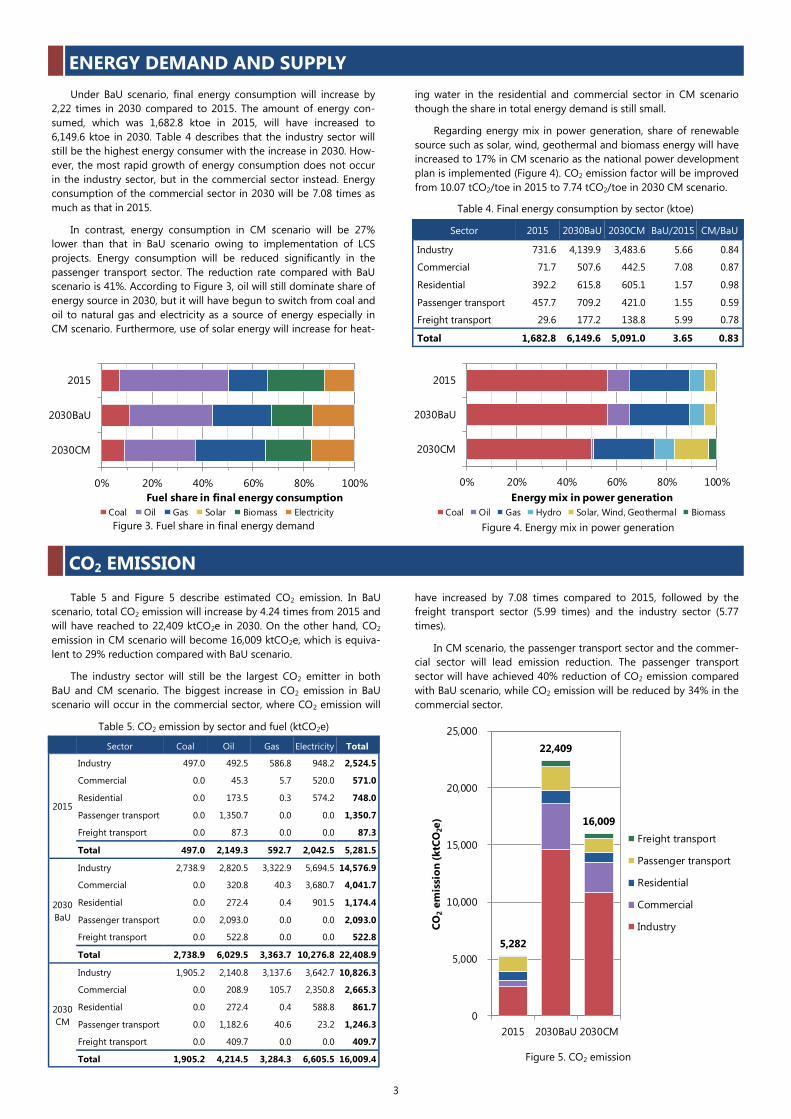
Table 5. CO2 emission by sector and fuel (ktCO2e)
Under BaU scenario, final energy consumption will increase by
2,22 times in 2030 compared to 2015. The amount of energy con-
sumed, which was 1,682.8 ktoe in 2015, will have increased to
6,149.6 ktoe in 2030. Table 4 describes that the industry sector will
still be the highest energy consumer with the increase in 2030. How-
ever, the most rapid growth of energy consumption does not occur
in the industry sector, but in the commercial sector instead. Energy
consumption of the commercial sector in 2030 will be 7.08 times as
much as that in 2015.
In contrast, energy consumption in CM scenario will be 27%
lower than that in BaU scenario owing to implementation of LCS
projects. Energy consumption will be reduced significantly in the
passenger transport sector. The reduction rate compared with BaU
scenario is 41%. According to Figure 3, oil will still dominate share of
energy source in 2030, but it will have begun to switch from coal and
oil to natural gas and electricity as a source of energy especially in
CM scenario. Furthermore, use of solar energy will increase for heat-
Table 4. Final energy consumption by sector (ktoe)
3
Table 5 and Figure 5 describe estimated CO2 emission. In BaU
scenario, total CO2 emission will increase by 4.24 times from 2015 and
will have reached to 22,409 ktCO2e in 2030. On the other hand, CO2
emission in CM scenario will become 16,009 ktCO2e, which is equiva-
lent to 29% reduction compared with BaU scenario.
The industry sector will still be the largest CO2 emitter in both
BaU and CM scenario. The biggest increase in CO2 emission in BaU
scenario will occur in the commercial sector, where CO2 emission will
Figure 5. CO2 emission
Sector 2015 2030BaU 2030CM BaU/2015 CM/BaU
Industry 731.6 4,139.9 3,483.6 5.66 0.84
Commercial 71.7 507.6 442.5 7.08 0.87
Residential 392.2 615.8 605.1 1.57 0.98
Passenger transport 457.7 709.2 421.0 1.55 0.59
29.6 177.2 138.8 Freight transport 5.99 0.78
Total 1,682.8 6,149.6 5,091.0 3.65 0.83
ENERGY DEMAND AND SUPPLY
CO2 EMISSION
0% 20% 40% 60% 80% 100%
2015
2030BaU
2030CM
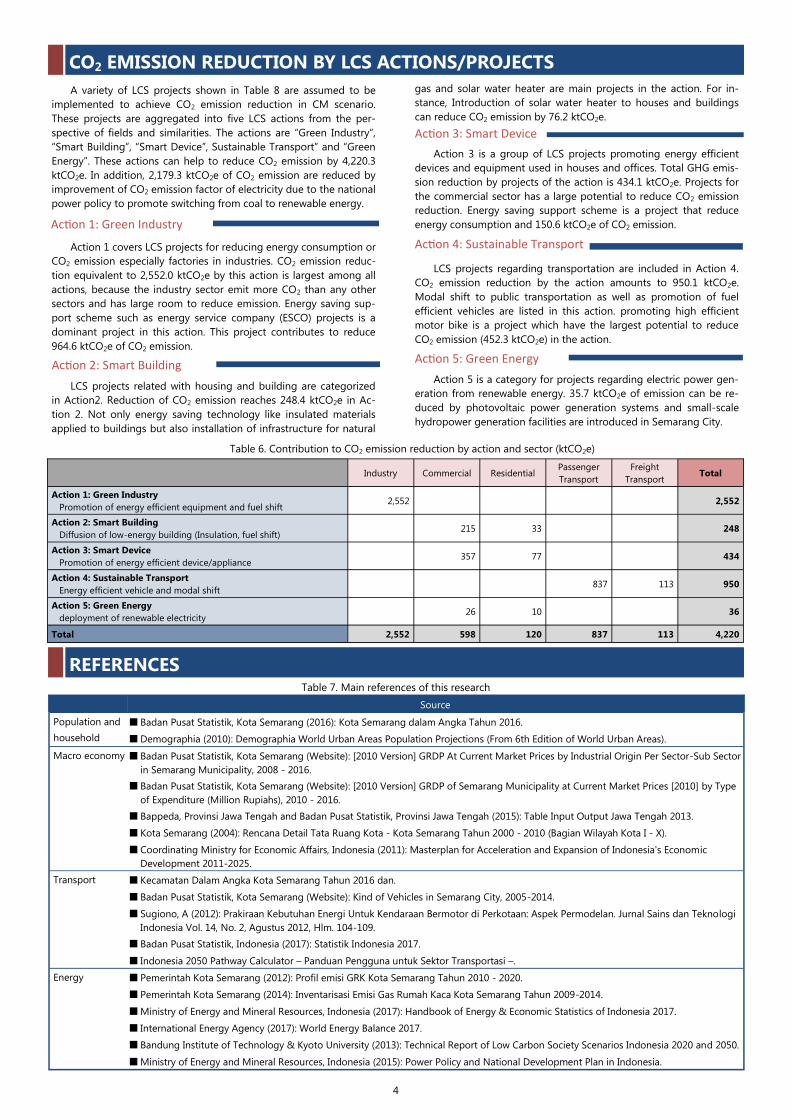
Energy mix in power generation
Coal Oil Gas Hydro Solar, Wind, Geothermal Biomass
Sector Coal Oil Gas Electricity Total
2015
Industry 497.0 492.5 586.8 948.2 2,524.5
Commercial 0.0 45.3 5.7 520.0 571.0
Residential 0.0 173.5 0.3 574.2 748.0
Passenger transport 0.0 1,350.7 0.0 0.0 1,350.7
Freight transport 0.0 87.3 0.0 0.0 87.3
Total 497.0 2,149.3 592.7 2,042.5 5,281.5
2030
BaU
Industry 2,738.9 2,820.5 3,322.9 5,694.5 14,576.9
Commercial 0.0 320.8 40.3 3,680.7 4,041.7
Residential 0.0 272.4 0.4 901.5 1,174.4
Passenger transport 0.0 2,093.0 0.0 0.0 2,093.0
Freight transport 0.0 522.8 0.0 0.0 522.8
Total 2,738.9 6,029.5 3,363.7 10,276.8 22,408.9
2030
CM
Industry 1,905.2 2,140.8 3,137.6 3,642.7 10,826.3
Commercial 0.0 208.9 105.7 2,350.8 2,665.3
Residential 0.0 272.4 0.4 588.8 861.7
Passenger transport 0.0 1,182.6 40.6 23.2 1,246.3
Freight transport 0.0 409.7 0.0 0.0 409.7
Total 1,905.2 4,214.5 3,284.3 6,605.5 16,009.4
0% 20% 40% 60% 80% 100%
2015
2030BaU
2030CM
Fuel share in final energy consumption
Coal Oil Gas Solar Biomass Electricity
have increased by 7.08 times compared to 2015, followed by the
freight transport sector (5.99 times) and the industry sector (5.77
times).
In CM scenario, the passenger transport sector and the commer-
cial sector will lead emission reduction. The passenger transport
sector will have achieved 40% reduction of CO2 emission compared
with BaU scenario, while CO2 emission will be reduced by 34% in the
commercial sector.
Figure 3. Fuel share in final energy demand Figure 4. Energy mix in power generation
ing water in the residential and commercial sector in CM scenario
though the share in total energy demand is still small.
Regarding energy mix in power generation, share of renewable
source such as solar, wind, geothermal and biomass energy will have
increased to 17% in CM scenario as the national power development
plan is implemented (Figure 4). CO2 emission factor will be improved
from 10.07 tCO2/toe in 2015 to 7.74 tCO2/toe in 2030 CM scenario.
5,282
22,409
16,009
0
5,000
10,000
15,000
20,000
25,000
2015 2030BaU 2030CM
CO
2e
mis
sio
n (
ktC
O2e
)
Freight transport
Passenger transport
Residential
Commercial
Industry
A variety of LCS projects shown in Table 8 are assumed to be
implemented to achieve CO2 emission reduction in CM scenario.
These projects are aggregated into five LCS actions from the per-
spective of fields and similarities. The actions are “Green Industry”,
“Smart Building”, “Smart Device”, Sustainable Transport” and “Green
Energy”. These actions can help to reduce CO2 emission by 4,220.3
ktCO2e. In addition, 2,179.3 ktCO2e of CO2 emission are reduced by
improvement of CO2 emission factor of electricity due to the national
power policy to promote switching from coal to renewable energy.
CO2 EMISSION REDUCTION BY LCS ACTIONS/PROJECTS
Action 1 covers LCS projects for reducing energy consumption or
CO2 emission especially factories in industries. CO2 emission reduc-
tion equivalent to 2,552.0 ktCO2e by this action is largest among all
actions, because the industry sector emit more CO2 than any other
sectors and has large room to reduce emission. Energy saving sup-
port scheme such as energy service company (ESCO) projects is a
dominant project in this action. This project contributes to reduce
964.6 ktCO2e of CO2 emission.
LCS projects related with housing and building are categorized
in Action2. Reduction of CO2 emission reaches 248.4 ktCO2e in Ac-
tion 2. Not only energy saving technology like insulated materials
applied to buildings but also installation of infrastructure for natural
Action 3 is a group of LCS projects promoting energy efficient
devices and equipment used in houses and offices. Total GHG emis-
sion reduction by projects of the action is 434.1 ktCO2e. Projects for
the commercial sector has a large potential to reduce CO2 emission
reduction. Energy saving support scheme is a project that reduce
energy consumption and 150.6 ktCO2e of CO2 emission.
LCS projects regarding transportation are included in Action 4.
CO2 emission reduction by the action amounts to 950.1 ktCO2e.
Modal shift to public transportation as well as promotion of fuel
efficient vehicles are listed in this action. promoting high efficient
motor bike is a project which have the largest potential to reduce
CO2 emission (452.3 ktCO2e) in the action.
4
Action 2: Smart Building
Action 1: Green Industry
Action 3: Smart Device
Action 4: Sustainable Transport
Industry Commercial Residential Passenger
Transport
Freight
Transport Total
Action 1: Green Industry
Promotion of energy efficient equipment and fuel shift 2,552 2,552
Action 2: Smart Building
Diffusion of low-energy building (Insulation, fuel shift) 215 33 248
Action 3: Smart Device
Promotion of energy efficient device/appliance 357 77 434
Action 4: Sustainable Transport
Energy efficient vehicle and modal shift 837 113 950
Action 5: Green Energy
deployment of renewable electricity 26 10 36
Total 2,552 598 120 837 113 4,220
Table 6. Contribution to CO2 emission reduction by action and sector (ktCO2e)
Action 5 is a category for projects regarding electric power gen-
eration from renewable energy. 35.7 ktCO2e of emission can be re-
duced by photovoltaic power generation systems and small-scale
hydropower generation facilities are introduced in Semarang City.
Action 5: Green Energy
REFERENCES
Source
Population and
household
■ Badan Pusat Statistik, Kota Semarang (2016): Kota Semarang dalam Angka Tahun 2016.
■ Demographia (2010): Demographia World Urban Areas Population Projections (From 6th Edition of World Urban Areas).
Macro economy ■ Badan Pusat Statistik, Kota Semarang (Website): [2010 Version] GRDP At Current Market Prices by Industrial Origin Per Sector-Sub Sector
in Semarang Municipality, 2008 - 2016.
■ Badan Pusat Statistik, Kota Semarang (Website): [2010 Version] GRDP of Semarang Municipality at Current Market Prices [2010] by Type
of Expenditure (Million Rupiahs), 2010 - 2016.
■ Bappeda, Provinsi Jawa Tengah and Badan Pusat Statistik, Provinsi Jawa Tengah (2015): Table Input Output Jawa Tengah 2013.
■ Kota Semarang (2004): Rencana Detail Tata Ruang Kota - Kota Semarang Tahun 2000 - 2010 (Bagian Wilayah Kota I - X).
■ Coordinating Ministry for Economic Affairs, Indonesia (2011): Masterplan for Acceleration and Expansion of Indonesia's Economic
Development 2011-2025.
Transport ■ Kecamatan Dalam Angka Kota Semarang Tahun 2016 dan.
■ Badan Pusat Statistik, Kota Semarang (Website): Kind of Vehicles in Semarang City, 2005-2014.
■ Sugiono, A (2012): Prakiraan Kebutuhan Energi Untuk Kendaraan Bermotor di Perkotaan: Aspek Permodelan. Jurnal Sains dan Teknologi
Indonesia Vol. 14, No. 2, Agustus 2012, Hlm. 104-109.
■ Badan Pusat Statistik, Indonesia (2017): Statistik Indonesia 2017.
■ Indonesia 2050 Pathway Calculator – Panduan Pengguna untuk Sektor Transportasi –.
Energy ■ Pemerintah Kota Semarang (2012): Profil emisi GRK Kota Semarang Tahun 2010 - 2020.
■ Pemerintah Kota Semarang (2014): Inventarisasi Emisi Gas Rumah Kaca Kota Semarang Tahun 2009-2014.
■ Ministry of Energy and Mineral Resources, Indonesia (2017): Handbook of Energy & Economic Statistics of Indonesia 2017.
■ International Energy Agency (2017): World Energy Balance 2017.
■ Bandung Institute of Technology & Kyoto University (2013): Technical Report of Low Carbon Society Scenarios Indonesia 2020 and 2050.
■ Ministry of Energy and Mineral Resources, Indonesia (2015): Power Policy and National Development Plan in Indonesia.
Table 7. Main references of this research
gas and solar water heater are main projects in the action. For in-
stance, Introduction of solar water heater to houses and buildings
can reduce CO2 emission by 76.2 ktCO2e.
4
Table 8. CO2 emission reduction by project
5
PROJECTS TO ACHIEVE LOW CARBON SOCIETY
Action Project Sector
Emission
reduction
(ktCO2e)
1 Green Industry 1-01 Energy saving support scheme such as ESCO (Energy Saving Company) project for Industry 964.6
1-02 Installation high energy efficiency facilities Industry 346.6
1-03 Regional energy supply system Industry 489.7
1-04 Improvement of kiln and furnace technology Industry 692.3
1-05 Promotion of fuel shift of furnaces and boilers from coal to natural gas Industry 58.8
Total 2,552.0
2 Smart Building 2-01 Installation of insulated glasses to commercial buildings Commercial 84.1
2-02 Installation of insulated glasses to houses Residential 12.2
2-03 Introduction of incentive to low energy buildings Commercial 15.9
2-04 Introduction of insulating material to houses Residential 7.0
2-05 Energy efficiency technology applied to buildings Commercial 35.8
2-06 Shift to natural gas in buildings Commercial 17.1
2-07 Introduction of solar water heater to commercial buildings Commercial 52.3
2-08 Introduction of solar water heater to households Residential 23.9
Total 248.4
3 Smart Device 3-01 Energy saving support scheme such as ESCO (Energy Saving Company) project for Commercial 150.6
3-02 High efficiency lighting in commercial buildings Commercial 66.5
3-03 High efficiency lighting in households Residential 22.8
3-04 High efficiency air conditioners (such as air conditioners with inverter controllers) Commercial 137.3
3-05 High efficiency air conditioners (such as air conditioners with inverter controllers) Residential 33.7
3-06 Promotion of energy-efficient appliances Residential 23.1
Total 434.1
4 Sustainable Transport 4-01 Promotion of eco-driving with digital tachographs Transport 7.2
4-02 Wide-range traffic control Transport 28.8
4-03 Expansion of frequencies and routes of bus and BRT Transport 96.2
4-04 Development of public transportation like railway and MRT Transport 98.6
4-05 Shift to CNG bus Transport 6.1
4-06 Introduction of electric motorbikes Transport 61.5
4-07 Promotion of energy-efficient vehicles (cars for passenger) Transport 452.3
4-08 Promotion of energy-efficient vehicles (motorbikes) Transport 86.7
4-09 Promotion of energy-efficient vehicles (trucks) Transport 112.8
Total 950.1
5 Green Energy 5-01 Introduction of photovoltaic power generation to commercial buildings Commercial 24.3
5-02 Introduction of photovoltaic power generation to households Residential 9.7
5-03 Introduction of small-scale hydropower generation (at water distribution stations) Commercial 1.7
Total 35.7
Improvement of CO2 emission factor of electricity 2,179.1
6,399.5 Total
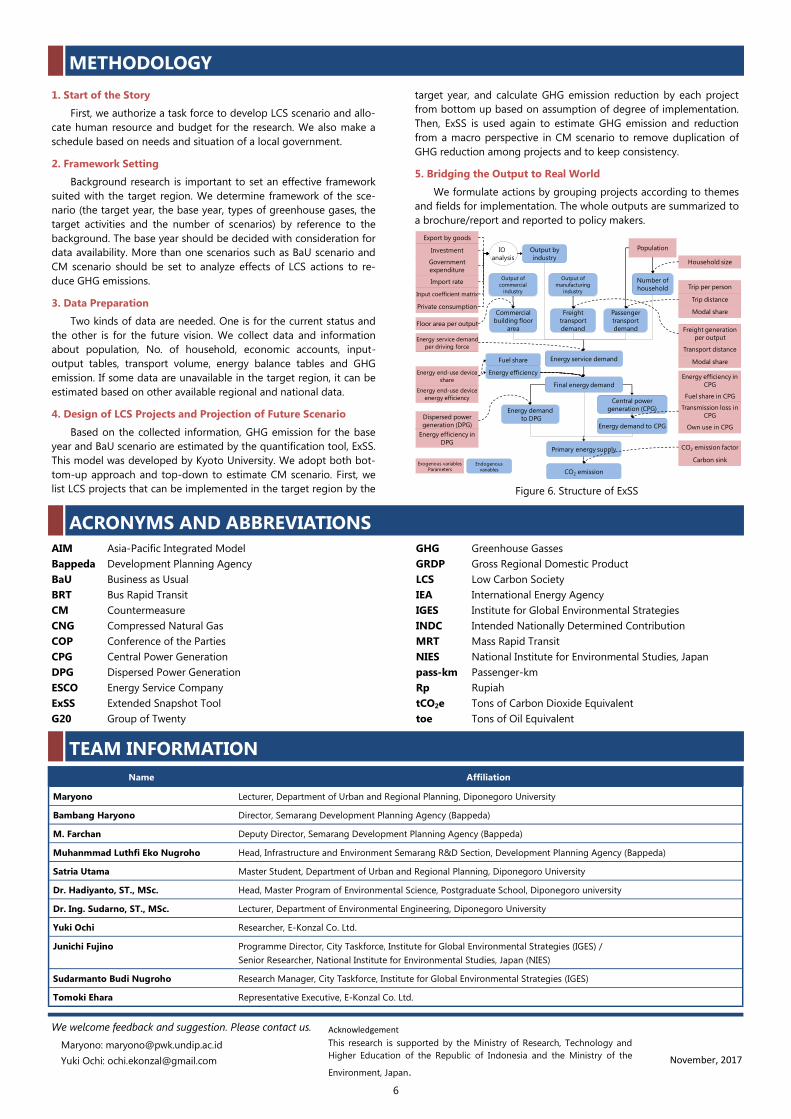
1. Start of the Story
First, we authorize a task force to develop LCS scenario and allo-
cate human resource and budget for the research. We also make a
schedule based on needs and situation of a local government.
2. Framework Setting
Background research is important to set an effective framework
suited with the target region. We determine framework of the sce-
nario (the target year, the base year, types of greenhouse gases, the
target activities and the number of scenarios) by reference to the
background. The base year should be decided with consideration for
data availability. More than one scenarios such as BaU scenario and
CM scenario should be set to analyze effects of LCS actions to re-
duce GHG emissions.
3. Data Preparation
Two kinds of data are needed. One is for the current status and
the other is for the future vision. We collect data and information
about population, No. of household, economic accounts, input-
output tables, transport volume, energy balance tables and GHG
emission. If some data are unavailable in the target region, it can be
estimated based on other available regional and national data.
4. Design of LCS Projects and Projection of Future Scenario
Based on the collected information, GHG emission for the base
year and BaU scenario are estimated by the quantification tool, ExSS.
This model was developed by Kyoto University. We adopt both bot-
tom-up approach and top-down to estimate CM scenario. First, we
list LCS projects that can be implemented in the target region by the
METHODOLOGY
AIM Asia-Pacific Integrated Model
Bappeda Development Planning Agency
BaU Business as Usual
BRT Bus Rapid Transit
CM Countermeasure
CNG Compressed Natural Gas
COP Conference of the Parties
CPG Central Power Generation
DPG Dispersed Power Generation
ESCO Energy Service Company
ExSS Extended Snapshot Tool
G20 Group of Twenty
6
target year, and calculate GHG emission reduction by each project
from bottom up based on assumption of degree of implementation.
Then, ExSS is used again to estimate GHG emission and reduction
from a macro perspective in CM scenario to remove duplication of
GHG reduction among projects and to keep consistency.
5. Bridging the Output to Real World
We formulate actions by grouping projects according to themes
and fields for implementation. The whole outputs are summarized to
a brochure/report and reported to policy makers.
Figure 6. Structure of ExSS
ACRONYMS AND ABBREVIATIONS
Export by goods
Government
expenditure
Investment
Import rate
Input coefficient matrix
Household size
Floor area per outputFreight generation
per output
Transport distance
Modal share
Trip per person
Trip distance
Modal share
Energy service demand
per driving force
Fuel share
Energy efficiency
CO2 emission factor
IO
analysis
Output by
industry
Population
Number of
household
Output of
commercial
industry
Commercial
building floor
area
Freight
transport
demand
Passenger
transport
demand
Energy service demand
Output of
manufacturing
industry
Exogenous variablesParameters
Endogenous variables
Final energy demand
Energy demand
to DPG
Central power
generation (CPG)
Energy demand to CPG
Primary energy supply
Dispersed power
generation (DPG)
CO2 emission
Energy efficiency in
DPG
Energy efficiency in
CPG
Fuel share in CPG
Transmission loss in
CPG
Own use in CPG
Energy end-use device
share
Energy end-use device
energy efficiency
Carbon sink
Private consumption
Acknowledgement
This research is supported by the Ministry of Research, Technology and
Higher Education of the Republic of Indonesia and the Ministry of the
Environment, Japan.
TEAM INFORMATION
Name Affiliation
Maryono Lecturer, Department of Urban and Regional Planning, Diponegoro University
Bambang Haryono Director, Semarang Development Planning Agency (Bappeda)
M. Farchan Deputy Director, Semarang Development Planning Agency (Bappeda)
Muhanmmad Luthfi Eko Nugroho Head, Infrastructure and Environment Semarang R&D Section, Development Planning Agency (Bappeda)
Satria Utama Master Student, Department of Urban and Regional Planning, Diponegoro University
Dr. Hadiyanto, ST., MSc. Head, Master Program of Environmental Science, Postgraduate School, Diponegoro university
Dr. Ing. Sudarno, ST., MSc. Lecturer, Department of Environmental Engineering, Diponegoro University
Yuki Ochi Researcher, E-Konzal Co. Ltd.
Junichi Fujino Programme Director, City Taskforce, Institute for Global Environmental Strategies (IGES) /
Senior Researcher, National Institute for Environmental Studies, Japan (NIES)
Sudarmanto Budi Nugroho Research Manager, City Taskforce, Institute for Global Environmental Strategies (IGES)
Tomoki Ehara Representative Executive, E-Konzal Co. Ltd.
We welcome feedback and suggestion. Please contact us.
Maryono: [email protected]
Yuki Ochi: [email protected]
GHG Greenhouse Gasses
GRDP Gross Regional Domestic Product
LCS Low Carbon Society
IEA International Energy Agency
IGES Institute for Global Environmental Strategies
INDC Intended Nationally Determined Contribution
MRT Mass Rapid Transit
NIES National Institute for Environmental Studies, Japan
pass-km Passenger-km
Rp Rupiah
tCO2e Tons of Carbon Dioxide Equivalent
toe Tons of Oil Equivalent
November, 2017