Embed Size (px)
Citation preview

Final Report 500
Mechanistic Evaluation of Asphalt MixturesContaining Thiopave Additives
by
Louay N. Mohammad, Ph.D.Samuel B. Cooper, III, Ph.D., P.E.
Mostafa Elseifi, Ph.D., P.E.
LTRC and LSU
4101 Gourrier Avenue | Baton Rouge, Louisiana 70808 (225) 767-9131 | (225) 767-9108 fax | www.ltrc.lsu.edu
Louisiana Transportation Research Center

1. Report No. FHWA/LA.12/500
2. Government Accession No. 3. Recipient's
Catalog No.
4. Title and Subtitle
Laboratory Evaluation of the Performance of HMA mixtures containing Thiopave additives
5. Report Date April 2016 6. Performing Organization Code LTRC Project Number: 736-99-1653 State Project Number: 10-5B
7. Author(s)
Louay Mohammad, Ph.D., Samuel B. Cooper, III, Ph.D., P.E. Mostafa Elseifi, Ph.D., P.E.
8. Performing Organization Report No.
9. Performing Organization Name and Address Louisiana Transportation Research Center 4101 Gourrier Avenue Baton Rouge, LA 70809
10. Work Unit No.
11. Contract or Grant No. State Project Number: 736-99-1653 LTRC Project Number:10-5B
12. Sponsoring Agency Name and Address
Shell Oil USA 910 Louisiana Street Houston, Texas 77002
13. Type of Report and Period Covered
Final Report Period Covered: July 2009 – June 2010
14. Sponsoring Agency Code
15. Supplementary Notes
Conducted in Cooperation with the U.S. Department of Transportation, Federal Highway Administration 16. Abstract
The objective of this study was to compare the laboratory mechanistic properties of sulfur-modified warm mix asphalt (WMA) to conventional asphalt mixtures. Three mixtures, two hot mix asphalt (HMA) and one WMA, were prepared. The first mixture included an unmodified asphalt binder classified as PG 64-22, the second mixture contained a styrene butadiene styrene (SBS) elastomeric modified binder classified as PG 70-22, and the third mixture was a WMA that incorporated a sulfur-based mix additive and PG 64-22 binder. A suite of tests were performed to evaluate the rutting performance, moisture resistance, fatigue endurance, fracture resistance, and thermal cracking resistance of the three mixtures. Results of the experimental program showed that the rutting performance of sulfur-modified WMA was comparable or superior to conventional mixes prepared with polymer-modified and unmodified asphalt binders. Results of the modified Lottman test showed that the moisture resistance of the sulfur-modified mixture was comparable to conventional mixes. Additionally, fracture and fatigue properties, as measured by the semi-circular bend (SCB) and beam fatigue tests, show that the sulfur-modified WMA mixture possessed stiffer properties than that of a conventional polymer-modified mixture. Thermal stress restrained specimen test (TSRST) test results showed that the sulfur-modified WMA had a greater fracture stress than the polymer-modified mixture. However, there was no statistical significance between the average fracture temperatures for the mixes tested..
17. Key Words
Thiopave, Warm Mix, Sulfur, Mechanistic Properties
18. Distribution Statement Unrestricted. This document is available through the
National Technical Information Service, Springfield, VA
21161.
19. Security Classif. (of this report)
20. Security Classif. (of this page)
21. 52
22. Price
TECHNICAL REPORT STANDARD PAGE


Project Review Committee
Each research project will have an advisory committee appointed by the LTRC Director. The
Project Review Committee is responsible for assisting the LTRC Administrator or Manager
in the development of acceptable research problem statements, requests for proposals, review
of research proposals, oversight of approved research projects, and implementation of
findings. LTRC appreciates the dedication of the following Project Review Committee
Members in guiding this research study to fruition.
LTRC Manager
Samuel B. Cooper, III, Ph.D., P.E.
Materials Research Manager
Members
Mark Bouldin, Shell USA
Richard May, Shell USA
Gary Fitts, Shell USA
Norm Pugh, Shell USA
Directorate Implementation Sponsor
Janice Williams, P.E.
DOTD Chief Engineer


Mechanistic Evaluation of Asphalt Mixtures
Containing Thiopave Additives
by
Louay N. Mohammad, Ph.D.
Professor of Civil and Environmental Engineering
Director, Engineering Materials Characterization Research Facility
Samuel B. Cooper, III, Ph.D., P.E.
Materials Research Administrator
Louisiana Transportation Research Center
Mostafa Elseifi, Ph.D., P.E.
Assistant Professor
Department of Civil and Environmental Engineering
Louisiana State University
LTRC Project Number: 10-5B
State Project Number: 736-99-1653
conducted for
Louisiana Department of Transportation and Development
Louisiana Transportation Research Center
The contents of this report reflect the views of the author/principal investigator who is
responsible for the facts and the accuracy of the data presented herein. The contents do not
necessarily reflect the views or policies of the Louisiana Department of Transportation and
Development or the Louisiana Transportation Research Center. This report does not
constitute a standard, specification, or regulation.
April 2016


iii
ABSTRACT
The objective of this study was to compare the laboratory mechanistic properties of sulfur-
modified warm mix asphalt (WMA) to conventional asphalt mixtures. Three mixtures, two
hot mix asphalt (HMA) and one WMA, were prepared. The first mixture included an
unmodified asphalt binder classified as PG 64-22, the second mixture contained a styrene
butadiene styrene (SBS) elastomeric modified binder classified as PG 70-22, and the third
mixture was a WMA that incorporated a sulfur-based mix additive and PG 64-22 binder. A
suite of tests were performed to evaluate the rutting performance, moisture resistance, fatigue
endurance, fracture resistance, and thermal cracking resistance of the three mixtures. Results
of the experimental program showed that the rutting performance of sulfur-modified WMA
was comparable or superior to conventional mixes prepared with polymer-modified and
unmodified asphalt binders. Results of the modified Lottman test showed that the moisture
resistance of the sulfur-modified mixture was comparable to conventional mixes.
Additionally, fracture and fatigue properties, as measured by the semi-circular bend (SCB)
and beam fatigue tests, show that the sulfur-modified WMA mixture possessed stiffer
properties than that of a conventional polymer-modified mixture. Thermal stress restrained
specimen test (TSRST) test results showed that the sulfur-modified WMA had a greater
fracture stress than the polymer-modified mixture. However, there was no statistical
significance between the average fracture temperatures for the mixes tested.


v
ACKNOWLEDGMENTS
The financial support provided by Shell, Inc is greatly appreciated. The contents of this
paper do not necessarily reflect the official views or policies of the Louisiana Department of
Transportation and Development (DOTD) or the Louisiana Transportation Research Center
(LTRC).


vii
IMPLEMENTATION STATEMENT
This study compared the laboratory mechanistic properties of sulfur-modified warm mix
asphalt (WMA) to conventional asphalt mixtures. Construction of field test sections of
asphalt mixtures containing sulfur-modified additives alongside conventional asphalt
mixtures are recommended to evaluate constructability, long term performance and
environmental impacts. The implementation phase of this project shall provide an
environmental assessment on the safety use of this technology on these field trials.


ix
TABLE OF CONTENTS
ABSTRACT ............................................................................................................................. iii
ACKNOWLEDGMENTS .........................................................................................................v
IMPLEMENTATION STATEMENT .................................................................................... vii
TABLE OF CONTENTS ......................................................................................................... ix
LIST OF TABLES ................................................................................................................... xi
LIST OF FIGURES ............................................................................................................... xiii
INTRODUCTION .....................................................................................................................1
OBJECTIVE ..............................................................................................................................3
SCOPE .......................................................................................................................................5
METHODOLOGY ....................................................................................................................7
Background ................................................................................................................... 7
Materials ....................................................................................................................... 8
Hot Mix Asphalt Mixture Design ............................................................................... 10
Experimental Plan ....................................................................................................... 12
DISCUSSION OF RESULTS..................................................................................................13
Rutting......................................................................................................................... 13
Loaded Wheel Tester ...................................................................................... 13
Flow Number .................................................................................................. 13
Repeated Shear at Constant Height ................................................................. 14
Dynamic Modulus (54°C (77°F), 5 Hz) .......................................................... 15
Durability .................................................................................................................... 15
Modified Lottman ........................................................................................... 15
Fatigue/Fracture Cracking .......................................................................................... 16
Semi-Circular Bend Fracture Test .................................................................. 16
Beam Fatigue Test .......................................................................................... 17
Dynamic Modulus (25°C (77°), 5 Hz) ............................................................ 18
Dissipated Creep Strain Energy ...................................................................... 19
Low Temperature Cracking ........................................................................................ 20
Thermal Stress Restrained Specimen Test ...................................................... 20
Summary of the Results .............................................................................................. 20
CONCLUSIONS......................................................................................................................23
RECOMMENDATIONS .........................................................................................................25
ACRONYMS, ABBREVIATIONS, AND SYMBOLS ..........................................................27
REFERENCES ........................................................................................................................29
APPENDIX A ..........................................................................................................................31

x
Performance Testing ................................................................................................... 31
Loaded Wheel Tester (LWT) .......................................................................... 31
Flow Number (FN) ......................................................................................... 31
Repeated Shear at Constant Height (RSCH) .................................................. 32
Semi-Circular Bend (SCB) ............................................................................. 32
Modified Lottman ........................................................................................... 33
Beam Fatigue .................................................................................................. 34
Dissipated Creep Strain Energy (DCSE) ........................................................ 34
Thermal Stress Restrained Specimen Test (TSRST) ...................................... 35
Dynamic Modulus (E*)................................................................................... 35

xi
LIST OF TABLES
Table 1 Louisiana asphalt cement PG specification test results ............................................... 9
Table 2 Wearing course job mix formula ............................................................................... 11
Table 3 Test factorial .............................................................................................................. 12
Table 4 Summary of test results .............................................................................................. 21


xiii
LIST OF FIGURES
Figure 1 Illustration of the laboratory preparation of sulfur-modified asphalt mixture
materials ..................................................................................................................... 8
Figure 2 Mixture aggregate gradation curve ........................................................................... 10
Figure 3 LWT test results ....................................................................................................... 13
Figure 4 Flow number test results ........................................................................................... 14
Figure 5 Repeated shear at constant height test results .......................................................... 14
Figure 6 Dynamic modulus rutting parameter ........................................................................ 15
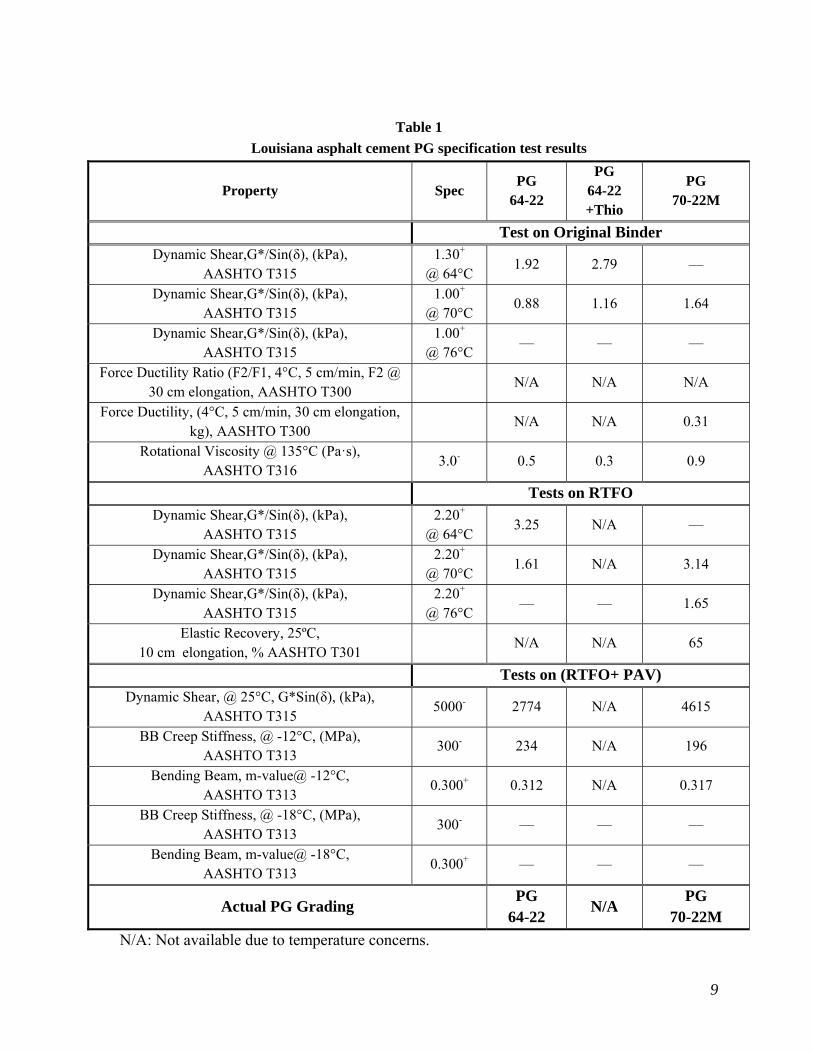
Figure 7 Modified Lottman test results ................................................................................... 16
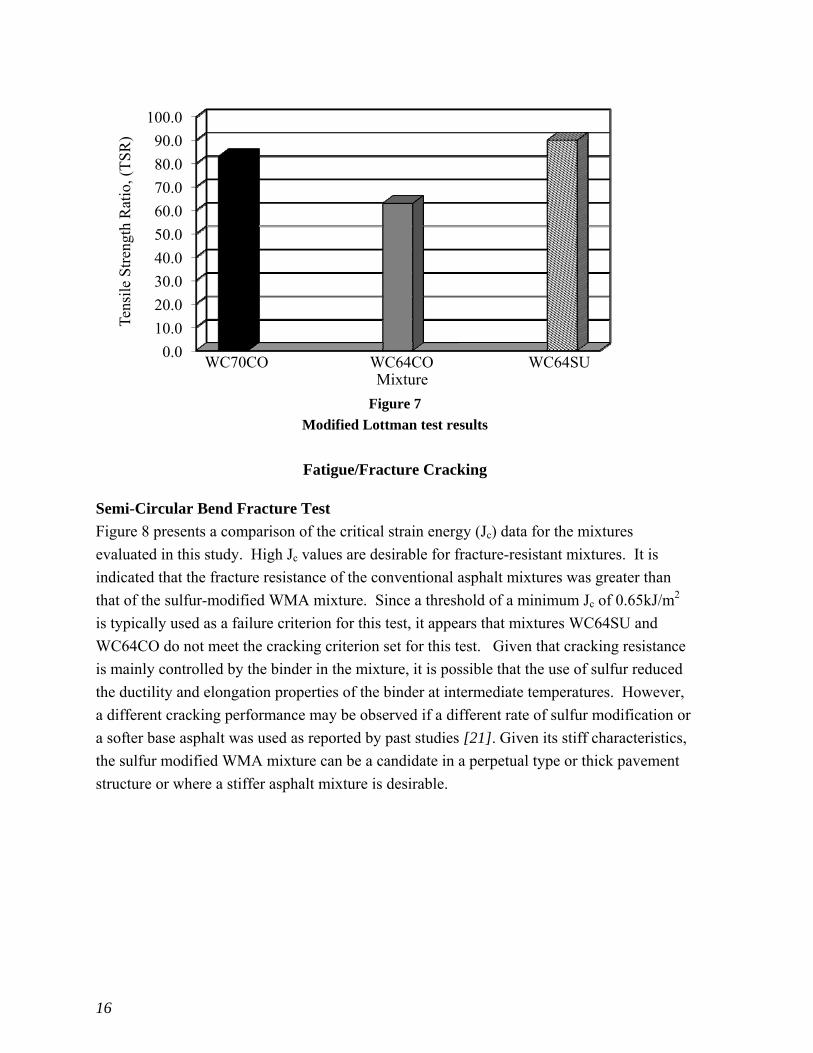
Figure 8 Semi-circular bend test results ................................................................................. 17
Figure 9 Fatigue stiffness vs. number of cycles ...................................................................... 18
Figure 10 Number of cycles to failure (Nf) vs. microstrain .................................................... 18
Figure 11 Dynamic modulus fatigue factor ............................................................................ 19
Figure 12 Dissipated creep strain energy test results .............................................................. 19
Figure 13 Thermal stress restrained specimen test results ...................................................... 20
Figure A.1 The Hamburg-Type Loaded Wheel Tester (LWT) .............................................. 31
Figure A.2 The semi-circular bending test ............................................................................. 33
Figure A.3 Dissipated creep strain energy determination ....................................................... 35


INTRODUCTION
In the past few years, many highway agencies experienced a significant increase in
construction bid prices. One major reason for this sharp increase is the rise in energy costs
and the price of liquid asphalt cement, a petroleum product. While the price of asphalt has
recently eased, economists widely agree that a sharp rebound in the price of petroleum
products will take place as the US economy recovers from the current recession. Crude oil
prices increased in 2009 from $35 to $80 a barrel confirming economists’ forecast that a
sharp rebound in the price of petroleum products will take place in the near future. As no
slowdown in freight transportation growth is forecasted in the near future, it is imperative
that innovative technologies that can improve the energy and resource efficiency of pavement
construction operations be introduced to ensure continuous growth of the economy.
Since the 1970s, attempts have been made to use sulfur as a binder extender in order to
reduce the amount of asphalt binder required in the mixture and to improve the mix
mechanistic characteristics [1]. However, the concept of using sulfur in hot-mix asphalt
(HMA) materials was abandoned in the 1980s after environmental and safety problems were
encountered during installation and doubts about the cost viability of the modification were
expressed [2]. Segregation of the additive from the binder was also reported due to the large
difference in density between sulfur and asphalt binder [3]. In spite of the installation
difficulties, sulfur-modification was found effective in enhancing the fatigue performance
and stiffness characteristics of the mixture as compared to conventional mixtures [4]. The
idea reappeared in the late 1990s with the development of a new class of solid dust-free
sulfur product known as Shell Thiopave®. Many of the safety problems encountered earlier
appeared to have been solved, as long as the mixture is produced at a target mixing
temperature of 140 ± 5°C. Since warm-mix asphalt (WMA) is designed to reduce the mixing
temperature during production by 16 to 55oC lower than with typical HMA, the use of sulfur
in the production of WMA may offer the potential to reduce energy and asphalt consumption
in the preparation of asphalt mixtures.
Conventional mixtures were prepared by mixing aggregate blends with two virgin binders: an
unmodified asphalt binder classified as PG 64-22 and a polymer-modified binder classified
as PG 70-22. Performance testing included evaluation of the rutting and fatigue
performances of the produced mixtures using a suite of laboratory testing procedures.


3
OBJECTIVE
The objective of this study was to characterize the laboratory performance of conventional
HMA mixtures and mixtures containing Thiopave additives through their fundamental
engineering properties. Specific objectives included comparing the laboratory performance of
conventional HMA wearing course mixtures to similar WMA mixtures that contain Thiopave
additives.


5
SCOPE
The research team conducted a limited factorial to determine the optimum proportions of
Thiopave additives. The loaded wheel tracking (LWT) and semi-circular bend (SCB) test
were conducted as part of the screening factorial. The optimum percentage of Thiopave
additives was determined to be 40 percent.
Three HMA mixtures meeting DOTD specification were designed and examined. The first
mixture was a conventional wearing course mixture using PG70-22 polymer modified
asphalt cement; the second mixture was a conventional wearing course using unmodified
PG64-22; and the third mixture was a wearing course mixture containing a binder consisting
of 60 percent PG64-22 unmodified asphalt cement and 40 percent Thiopave additives. The
mixture performance tests that were conducted were the Modified Lottman Test, dissipated
creep strain energy (DCSE), semi-circular bend (SCB), dynamic modulus (E*), flow number,
loaded wheel tracking (LWT), flexural bending fatigue, thermal stress restrained specimen
test (TSRST) and repeated shear at constant height (RSCH). Triplicate samples were tested
in all cases, excluding the LWT test where duplicate samples were tested.


7
METHODOLOGY
Background
Recent investigations of the new class of sulfur extended technologies were reported in the
literature. Thiopave®, usually added at a ratio ranging from 30 to 40 percent from the binder
weight, consists of pre-treated solid pellets that melt at a temperature above 120°C, Figure
1(d). The pellets are pretreated in order to reduce the emissions of harmful pollutants, such
as hydrogen sulphide gas, during production and to lower the mixing and compaction
temperature required for the modified mixture. During mixing, part of the sulfur bonds with
the binder at a high temperature and reduces its viscosity while improving its elongation
characteristics. The remaining part of the sulfur precipitates as the mixture cools down and
crystallizes as a coated aggregate binder. These crystalline particles stiffen the mixture and
act as a strengthening agent at a high temperature resulting in an improved rutting resistance.
Sulfur modification also acts as an extender to the binder in the mixture, resulting in a
decrease in the required asphalt cement content in the mixture. Given the difference in the
density between the two components, it is recommended to maintain the volume fraction of
the binder phase unchanged in the modified mixture based on the following relationship [3]:
Sulfur + Binder % = )(100
100
binders GRPR
AR
(1)
where,
Sulfur + Binder % = binder and sulfur content in the mixture;
A = Percentage of binder by weight in conventional mixture (%);
R = Sulfur to binder substitution ratio (1.90);
Ps = weight percentage of sulfur in the modified blend; and
G = specific gravity of the unmodified binder.
Strickland et al., (2008) evaluated the performance of sulfur-modified mixtures in the
laboratory [3]. Rutting resistance of the prepared mixtures was evaluated using the Asphalt
Pavement Analyzer (APA) test at 58°C and the mixture stiffness modulus was measured at a
temperature ranging from -10 to 30°C. In addition, the low temperature performance was
evaluated using the TSRST. Results of this analysis indicated that the rutting and stiffness
modulus of the mixture has improved. In addition, using sulfur enhanced the elongation
properties of the mix at a low temperature. A comprehensive experimental program also
evaluated the moisture resistance and dynamic modulus of sulfur-modified asphalt mixtures
[1]. Results showed that the sulfur-modified mixture had a lower tensile-strength ratio

8
(TSR) after curing but greater dynamic moduli for all combinations of test temperatures and
frequencies.
(a) (b) (c)
(d) (e) (f)
Figure 1
Illustration of the laboratory preparation of sulfur-modified asphalt mixture materials
(a) Liquid Asphalt Binder, (b) Compaction Additive, (c) Blending Compaction Additive
with the Asphalt Binder, (d) Pre-treated Thiopave Additive, (e) Heated Aggregate and
Asphalt Binder in Mixing Bucket, (f) Pre-treated Thiopave Additive Blended with
Heated Aggregate and Asphalt Binder
Materials
Two asphalt binders meeting the Louisiana specification for PG 64-22 and PG 70-22
(elastomeric polymer modified, M) were compared in this study, as shown in Table 1. In
addition, the PG 64-22 binder was blended with 40 percent Thiopave additives. Special
precautions were used, with respect to maximum temperature, when testing the binder
containing Thiopave additives. Table 1 presents the properties of the asphalt cement used in
this study, indicating that the PG 64-22 and PG 70-22(M) passed all specification
requirements for their respective grading. The binder containing Thiopave additives could
not be evaluated completely to determine the PG grading, due to emission concerns while
conducting the rolling thin film oven (RTFO) and pressure aging vessel (PAV) aging
procedures.
9
Table 1
Louisiana asphalt cement PG specification test results
Property Spec PG
64-22
PG 64-22 +Thio
PG 70-22M
Test on Original Binder Dynamic Shear,G*/Sin(δ), (kPa),
AASHTO T315 1.30+
@ 64°C 1.92 2.79 —
Dynamic Shear,G*/Sin(δ), (kPa), AASHTO T315
1.00+
@ 70°C 0.88 1.16 1.64
Dynamic Shear,G*/Sin(δ), (kPa), AASHTO T315
1.00+
@ 76°C — — —
Force Ductility Ratio (F2/F1, 4°C, 5 cm/min, F2 @ 30 cm elongation, AASHTO T300
N/A N/A N/A
Force Ductility, (4°C, 5 cm/min, 30 cm elongation, kg), AASHTO T300
N/A N/A 0.31
Rotational Viscosity @ 135°C (Pa·s), AASHTO T316
3.0- 0.5 0.3 0.9
Tests on RTFO Dynamic Shear,G*/Sin(δ), (kPa),
AASHTO T315 2.20+
@ 64°C 3.25 N/A —
Dynamic Shear,G*/Sin(δ), (kPa), AASHTO T315
2.20+
@ 70°C 1.61 N/A 3.14
Dynamic Shear,G*/Sin(δ), (kPa), AASHTO T315
2.20+
@ 76°C — — 1.65
Elastic Recovery, 25ºC, 10 cm elongation, % AASHTO T301
N/A N/A 65
Tests on (RTFO+ PAV) Dynamic Shear, @ 25°C, G*Sin(δ), (kPa),
AASHTO T315 5000- 2774 N/A 4615
BB Creep Stiffness, @ -12°C, (MPa), AASHTO T313
300- 234 N/A 196
Bending Beam, m-value@ -12°C, AASHTO T313
0.300+ 0.312 N/A 0.317
BB Creep Stiffness, @ -18°C, (MPa), AASHTO T313
300- — — —
Bending Beam, m-value@ -18°C, AASHTO T313
0.300+ — — —
Actual PG Grading PG
64-22 N/A
PG 70-22M
N/A: Not available due to temperature concerns.

10
Hot Mix Asphalt Mixture Design
Superpave HMA mixtures meeting DOTD specification (Ninitial = 8-, Ndesign = 100-, Nfinal =
160-gyrations), were designed according to AASHTO TP28, “Standard Practice for
Designing Superpave HMA” and Section 502 of the 2006 Louisiana Standard Specifications
for Roads and Bridges [5]. In particular, the optimum asphalt cement content was
determined based on volumetric (VTM = 2.5 - 4.5 percent, VMA ≥ 12%, VFA = 68% -78%)
and densification (%Gmm at Ninitial ≤ 89, %Gmm at Nfinal ≤ 98) requirements. Siliceous
limestone aggregates and coarse natural sand that are commonly used in Louisiana were
included in this study. The three aggregate gradation blends evaluated in this study are
presented graphically in Figure 2. In addition, limestone aggregates were tested to determine
their aggregate consensus properties. The consensus properties test items included coarse
aggregate angularity (CAA), fine aggregate angularity (FAA), flat and elongated (F&E)
particles, and sand equivalency (SE).
Figure 2
Mixture aggregate gradation curve
0
10
20
30
40
50
60
70
80
90
100
Per
cen
t P
assi
ng
Sieve Size (mm)
WC70CO
0.075 12.5 19.0 25.0.600
0.300 1.18 2.36 4.75 9.50.150

11
The job mix formulas for all mixtures considered in this study are summarized in
Table 2. The design-optimum asphalt cement-binder content for the mixtures indicated is
similar. Table 2
Wearing course job mix formula
Mixture Designation WC70CO WC64CO WC64SU
Mix Type 19.0 mm (3/4 in.) Superpave
Aggregate
#67 LS 36% 36% 36%
#78 LS 24% 24% 24%
#11 LS 34% 34% 34%
CS 6% 6% 6%
Binder type PG 70-22M PG 64-22
PG 64-22
+Thiopave+
KB2550
Binder Content, % 4.0 4.0 3.0*
% Gmm at NIni 87.0 87.0 87.0
% Gmm at NMax 97.6 97.6 97.6
Design air void, % 3.7 3.7 3.7
VMA, % 13 13 13
VFA, % 68 68 68
Metric (U.S.) Sieve Composite Gradation Blend
37. 5 mm (1½ in.) 100 100 100
25.0 mm (1 in.) 100 100 100
19.0 mm (3/4 in.) 96 96 96
12. 5 mm (1/2 in.) 75 75 75
9. 5 mm (3/8 in.) 59 59 59
4. 75 mm (No. 4) 43 43 43
2. 36 mm (No. 8) 31 31 31
1. 18 mm (No. 16) 20 20 20
0.600 mm (No. 30) 11 11 11
0.300 mm (No. 50) 8 8 8
0.150 mm (No. 100) 6 6 6
0.075 mm (No. 200) 4.5 4.5 4.5
Note: LS: Limestone, CS: Coarse Sand, WC: Wearing Course, CO: Control, SU: Sulfur Modified, M:
Elastomeric Polymer Modified,
*60/40KB: WMA with 60% PG 64-22 + 40% Thiopave® Additive.

12
Experimental Plan
An experimental factorial was developed in order to determine the mechanistic properties of
the mixtures.
Table 3 shows the test factorial evaluated in this study. Notice that for the RSCH, beam
fatigue, and TSRST, test samples for WC64CO were not evaluated.
Table 3
Test factorial
Mixture
Performance Test
Rutting Durability Fatigue Cracking Low Temp
Cracking
LWT FN RSCH E*@
54°C Lottman ITS SCB Beam E*@25°C DCSE TSRST
WC70CO 2 3 3 3 6 3 9 3 3 3 3
WC64CO 2 3 N/A 3 6 3 9 N/A 3 3 N/A
WC64SU 2 3 3 3 6 3 9 3 3 3 3

13
DISCUSSION OF RESULTS
Rutting
Loaded Wheel Tester
Figure 3 compares rutting performance of the three mixes evaluated in this study. This test
predicts an acceptable rut performance for a mixture that achieves a maximum rut depth of
6.0 mm (0.2 in.) after 20,000 passes. As shown in Figure 3, mixture WC64CO had the
largest rut depth at 20,000 cycles followed by WC64SU and WC70CO. It is noted that
mixtures WC70CO and WC64SU exhibited a rut depth at 20,000 cycles that is less than or
equal to 6.0 mm (0.2 in.). It is also noted that the WC64CO mixture failed the 6.0 mm (0.2
in) criteria used by DOTD.
Figure 3
LWT test results
Flow Number
Figure 4 presents the FN for the three mixtures evaluated in this study. The FN is defined as
the number of cycles at which tertiary flow occurs on a cumulative permanent strain versus
number of cycles curve. It is noted that the greater the FN, the higher the mixture’s
resistance to permanent deformation. As shown in Figure 4, the sulfur-modified WMA
mixture (WC64SU) outperformed both conventional mixtures including the polymer-
modified mix in its resistance to permanent deformation.
0.0
5.0
10.0
15.0
20.0
WC70CO WC64CO WC64SU
3.5
10.9
5.9
Rut
Dep
th, m
m @
20K
pa
sses
Mixture

14
Figure 4
Flow number test results
Repeated Shear at Constant Height
Figure 5 presents the results of the RSCH test for the WC70CO and WC64SU mixtures. The
permanent shear strain at 5,000 cycles is used to evaluate the mixtures’ susceptibility to
permanent deformation [19]. In this test, a lower permanent shear strain value is indicative
of a reduced susceptibility to rutting failure. As shown in Figure 5, the sulfur-modified
WMA mixture (WC64SU) had a lower permanent shear strain at 5,000 cycles than the
conventional polymer-modified mixture (WC70CO).
Figure 5
Repeated shear at constant height test results
0
2,000
4,000
6,000
8,000
10,000
Flo
w N
umbe
r
Mixture
WC70CO WC64CO WC64SU
0.0000
0.0020
0.0040
0.0060
0.0080
0.0100
0.0120
0.0140
0.0160
0.0180
Pla
stic
She
ar S
trai
n at
500
0 C
ycle
s
MixtureWC70CO WC64SU

15
Dynamic Modulus (54°C (77°F), 5 Hz)
The dynamic modulus results are analyzed to evaluate a rutting parameter. This parameter is
typically achieved by dividing the E* by the sine of the phase angle at 54°C (77˚F) and 5 Hz.
Figure 6 shows the comparison of the three mixtures evaluated in the lab study. The results
show the addition of Thiopave additives resulted in a similar rut parameter to the WC64CO
mixture.
Figure 6
Dynamic modulus rutting parameter
These findings agree with other investigators, who have reported that the use of sulfur-
modification improves the permanent deformation resistance of the mixture at high
temperatures [3], [20]. The improved rutting performance is due to the stiffening effect of
the sulfur crystals, which acts as a structuring agent for mixtures at high temperatures.
Durability
Modified Lottman
Figure 7 presents the moisture-resistance performance of the three mixtures based on the
modified Lottman test results. While it appears from these results that the sulfur-modified
WMA had a greater TSR than the conventional mixes, statistical analysis presented in the
next section showed that this difference was not statistically significant. Considering that an
80 percent minimum TSR is necessary, the WC64CO mix would fail this requirement.
0.0
10.0
20.0
30.0
40.0
50.0
60.0
70.0
80.0
90.0
100.0
E*/
sinδ
, @ 5
4°C
, 5H
z
MixtureWC70CO WC64SUWC64CO
16
Figure 7
Modified Lottman test results
Fatigue/Fracture Cracking
Semi-Circular Bend Fracture Test
Figure 8 presents a comparison of the critical strain energy (Jc) data for the mixtures
evaluated in this study. High Jc values are desirable for fracture-resistant mixtures. It is
indicated that the fracture resistance of the conventional asphalt mixtures was greater than
that of the sulfur-modified WMA mixture. Since a threshold of a minimum Jc of 0.65kJ/m2
is typically used as a failure criterion for this test, it appears that mixtures WC64SU and
WC64CO do not meet the cracking criterion set for this test. Given that cracking resistance
is mainly controlled by the binder in the mixture, it is possible that the use of sulfur reduced
the ductility and elongation properties of the binder at intermediate temperatures. However,
a different cracking performance may be observed if a different rate of sulfur modification or
a softer base asphalt was used as reported by past studies [21]. Given its stiff characteristics,
the sulfur modified WMA mixture can be a candidate in a perpetual type or thick pavement
structure or where a stiffer asphalt mixture is desirable.
0.0
10.0
20.0
30.0
40.0
50.0
60.0
70.0
80.0
90.0
100.0Te
nsil
e S
tren
gth
Rat
io, (
TS
R)
MixtureWC70CO WC64CO WC64SU

17
Figure 8
Semi-circular bend test results
Beam Fatigue Test
Figure 9 shows the results of the fatigue stiffness. The mixture containing Thiopave additives
resulted in higher initial stiffness but failed sooner than the conventional mixture at all strain
levels. This result is expected due to the stiffening properties of the sulfur additives. Figure
10 illustrates the relationship between the number of cycles to failure and the strain level
applied to the specimen; mixture WC64CO was not tested in fatigue. (As shown in Figure
10, the polymer-modified mix (WC70CO) had a flatter slope at higher strain levels, which
indicates that the modified mixture will exhibit a greater fatigue life at a higher bending
strain). Other investigators have also reported that the average fatigue life of conventional
mixtures is longer than sulfur-modified mixes at high strain levels [1]. This may be caused
by the stiffening effect of the sulfur additive due to the crystallization of the sulfur particles
during mixing. The results from this test are consistent with that observed from the SCB test.
Given its stiffness properties, the higher modulus of sulfur modified mixtures will reduce the
magnitude of strain induced in the pavement.
0.0
0.1
0.2
0.3
0.4
0.5
0.6
0.7
0.8
0.9
1.0Jc
, KJ/
m2
MixtureWC70CO WC64CO WC64SU

18
Figure 9
Fatigue stiffness vs. number of cycles
Figure 10
Number of cycles to failure (Nf) vs. microstrain
Dynamic Modulus (25°C (77°), 5 Hz)
The results from the dynamic modulus test were analyzed to determine the fatigue properties
of the mixtures. Figure 11 shows the results of this analysis. The figure shows the mixture
containing Thiopave additives had a much higher fatigue factor than the conventional
100
1000
10000
1 10 100 1000 10000 100000 1000000 10000000
Fatige
Stiffness (ksi)
Number of Cycles
WC70CO‐200 µε WC70CO‐400 µε WC70CO‐600 µεWC64SU‐300 µε WC64SU‐400 µε WC64SU‐600 µε
y = 21,127,202.4776e‐0.0112x
R² = 0.9959
y = 812,819.0313e‐0.0105x
R² = 0.7997
1
10
100
1000
10000
100000
1000000
0 100 200 300 400 500 600 700
Number of Cycles to Failure (Ns)
Micro‐strain
WC70CO
WC64SU

19
mixtures, indicating that the mixture containing Thiopave has a lower fatigue resistance than
the conventional mixtures.
Figure 11
Dynamic modulus fatigue factor
Dissipated Creep Strain Energy
Figure 12 presents the mean DCSE values for the mixtures evaluated in this study. Mixtures
that exhibit lower DCSE values are more susceptible to cracking than mixtures having higher
values. As shown in this figure, the WC70CO mixture had the highest DCSE values and is,
therefore, less prone to cracking at the tested temperature of 10°C (50˚F). However, all
mixtures met the 0.75 KJ/m3 cracking criterion set for this test [15].
Figure 12
Dissipated creep strain energy test results
0.0
50.0
100.0
150.0
200.0
250.0
300.0
350.0
400.0
450.0E
* x
sinδ
, @ 2
5°C
, 5H
z
Mixture
WC70CO WC64CO WC64SU
0.0
0.5
1.0
1.5
2.0
2.5
3.0
DC
SE
, KJ/
m3
Mixture
WC70CO WC64CO WC64SU

20
Low Temperature Cracking
Thermal Stress Restrained Specimen Test
Figure 13 presents the results of the thermal stress restrained specimen test; mixture
WC64CO was not tested. As shown in Figure 13, mixture WC70CO had a lower fracture
temperature than mixture WC64SU. However, statistical analysis presented in the next
section showed that this difference was not statistically significant. The difference in fracture
temperature may be caused by the stiffening effect of the sulfur on the binder, which reduced
its ductility and its ability to dissipate the applied stress at low temperatures. This may also
indicate that the glass transition temperature of the binder increased due to the sulfur
modification, which increased the critical temperature at which fractures were observed.
Figure 13
Thermal stress restrained specimen test results
Summary of the Results
Laboratory test results were statistically analyzed and grouped using the analysis of variance
(ANOVA) procedure provided in the Statistical Analysis System (SAS) program. A multiple
comparison procedure with a significance level of 5 percent was performed for the means.
The results of the statistical grouping were reported with the letters A, B, C, D, and so forth.
The letter A was assigned to the highest mean followed by the other letters in appropriate
order. A double (or more) letter designation, such as A/B, indicates that the difference in the
means is not clear-cut, and that the results could fall in either category.
-40
-39
-38
-37
-36
-35
-34
-33
-32
Cri
tica
l Tem
pera
ture
, °C
MixtureWC70CO WC64SU

21
Table 4 summarizes the statistical ranking of the laboratory test results for the three mixture
types considered in the LTRC study. In general, WC64SU exhibited improved high
temperature performance when compared to WC64CO and WC70CO. It is noted that
WC64SU exhibited reduced intermediate temperature performance as indicated by the SCB
test. However, there was no statistical difference between WC64SU and WC64CO for the
DCSE test. TSRST results showed that WC64SU had greater fracture stress than WC70CO.
There was no statistical significance between the average fracture temperatures for the mixes
tested.
Table 4
Summary of test results
Moisture
Resistance Rutting Fatigue Fracture Low Temperature
MIX ID TSR LWT RSCH Fn Beam
Fatigue DSCE Jc
TSRST
(Fracture
Temp)
TSRST
(Fracture
Stress)
WC64CO A1 B1 N/A C N/A B B1 N/A N/A
WC70CO A A A B A A A A B
WC64SU A A A A B B C1 A A 1. Indicates failed criterion


23
CONCLUSIONS
Mechanistic properties of warm mix asphalt mixtures containing Thiopave additives were
determined and compared to conventional hot mix asphalt mixtures. A suite of tests were
performed to evaluate the rutting performance, moisture resistance, fatigue endurance,
fracture resistance, and thermal cracking resistance of the three mixtures using the Hamburg
type loaded-wheel tester, the flow number test, the repeated shear at constant height (RSCH)
test, the modified Lottman test, the beam fatigue test, the dynamic modulus, the semi-circular
bending test (SCB), the dissipated creep strain energy (DCSE) test, and the thermal stress
restrained specimen test (TSRST).
Results of the LWT, RSCH, and FN tests showed that the rutting performance of the sulfur-
modified WMA mixture was comparable to the conventional mixtures prepared with
polymer-modified and unmodified asphalt binders.
Results of the modified Lottman test showed that the sulfur-modified WMA had comparable
moisture resistance to the conventional mixes.
Fracture and fatigue properties showed that the sulfur-modified WMA mixture exhibited
reduced fatigue and fracture resistance when compared to the other mixtures. This is due to
the stiffening of the mixture provided by the sulfur modifier. Given its stiff characteristics,
the sulfur-modified mixture can be a candidate in a perpetual type or thick pavement
structure or where a stiffer asphalt mixture is desirable.
TSRST results showed that the sulfur-modified WMA mixture had a greater fracture stress
than the polymer-modified mixture. However, there was no statistical significance between
the average fracture temperatures for the mixes tested.


25
RECOMMENDATIONS
This study compared the laboratory mechanistic properties of sulfur-modified warm mix
asphalt (WMA) to conventional asphalt mixtures. Based on the results of this laboratory
study, it is recommended that field trials of asphalt mixtures containing sulfur-modified
additives be conducted to evaluate long term performance as well as environmental impact.
A possible source of a field trial is the Louisiana Accelerated Loading Facility.


27
ACRONYMS, ABBREVIATIONS, AND SYMBOLS
AADTT Average annual daily truck traffic
AASHTO American Association of State Highway and Transportation Officials
ASTM American Society for Testing and Materials
ATM Asphalt treated mixture
APA Asphalt pavement analyzer
CA Coarse aggregate
CAA Coarse aggregate angularity
CS Coarse sand
DOTD Department of Transportation and Development
DSCE Dissipated Creep Strain Energy
E* Dynamic Modulus
EE Elastic energy
FA Fine aggregate
FAA Fine aggregate angularity
FE Fracture energy
F&E Flat and elongated
FHWA Federal Highway Administration
FN Flow number
FWD Falling weight deflectometer
GR Granite
HMA Hot mix asphalt
HMAC Hot mix asphalt cement
ITS Indirect tensile strength
JMF Job mix formula
LAPA Louisiana Asphalt Pavement Association
LFWD Light falling weight deflectometer
LS Limestone
LTRC Louisiana Transportation Research Center
LVDT Linearly variable differential transducer
LWT Loaded wheel tracking
MEPDG Mechanistic Empirical Pavement Design Guide
MTS Material Testing System
NCHRP National Cooperative Highway Research Program
NV Novaculite
PAV Pressure Aging Vessel

28
PG Performance graded
PLS Porous limestone
PSPA Portable Seismic Pavement Analyzer
RAP Reclaimed asphalt pavement
RLT Repeated load triaxial
RTFO Rolling Thin Film Oven
RY Rhyolite
SBS Styrene Butadiene Styrene
SCB Semi-circular bend
SCT Static compression test
SE Sand Equivalency
SGC Superpave gyratory compactor
SS Sandstone
TF Film thickness
TI Toughness index
TSR Tensile strength ratio
TSRST Thermal Stress Restrained Specimen Test
USW Ultrasonic Surface Wave
WMA Warm mix asphalt

29
REFERENCES
1. Timm, D; Tran, N; Taylor, A; Robbins, M; and Powell, B. “Evaluation of Mixture
Performance and Structural Capacity of Pavements Using Shell Thiopave®.” Phase I:
Mix Design, Laboratory Performance Evaluation and Structural Pavement Analysis and
Design. NCAT Report 09-05, Auburn, AL, 2009.
2. Deme, I; and Kennedy, B. “Use of Sulfur in Asphalt Pavements.” Paper presented at the
5th International Symposium on Pavement Surface Characteristics, Roads and Airfield,
Toronto, CA, 2004.
3. Strickland, D; Colange, J; Martin, M; and Deme, I. “Performance Properties of Sulphur
Extended Asphalt Mixtures with Modified Sulphur Pellets.” International Society of
Asphalt Pavement, 2008.
4. Kennedy, T.W; Haas, R; Smith, P; Kennepohl, G.A; and Hignell, E.T. “Engineering
Evaluation of Sulphur-Asphalt Mixtures.” Transportation Research Record 659.
Transportation Research Board, National Research Council, Washington, D.C., 1997.12-
17.
5. Louisiana Standard Specifications for Roads and Bridges, Louisiana Department of
Transportation and Development, Baton Rouge, Louisiana, 2006.
6. AASHTO, American Association of State Highways and Transportation Officials.
“Hamburg Wheel-Track Testing of Compacted Hot-Mix Asphalt (HMA).” AASHTO
Designation 324, Washington D.C., 2007.
7. Bonaquist, R.F; Christensen, D.W; and Stump, W. “Simple Performance Tester for
Superpave Mix Design: First-Article Development and Evaluation.” National
Cooperative Highway Research Program (NCHRP) Report 513, Transportation Research
Board, National Research Council, Washington, D.C., 2003.
8. AASHTO, American Association of State Highways and Transportation Officials.
“AASHTO TP7 Standard Test Method for Determining the Permanent Deformation and
Fatigue Cracking Characteristics of Hot Mix Asphalt (HMA) Using the Simple Shear
Test (SST) Device.” AASHTO TP7, Washington D.C., 2001.
9. Wu, Z; Mohammad, L.N; Wang, L.B; Mull, M.A. “Fracture Resistance Characterization
of Superpave Mixtures Using the Semi-Circular Bending Test.” Journal of ASTM
International, Vol. 2, No. 3., 2005.
10. AASHTO, American Association of State Highways and Transportation Officials.
“Standard Method of Test for Resistance of Compacted Asphalt Mixtures to Moisture-
Induced Damage.” AASHTO T 283-03, Washington D.C., 2003.
11. AASHTO, American Association of State Highways and Transportation Officials.
“Standard Method of Test for Determining the Fatigue Life of Compacted Hot-Mix

30
Asphalt (HMA) Subjected to Repeated Flexural Bending.” AASHTO T 321, Washington
D.C., 2007.
12. Witczak, M.W. “Laboratory Determination of resilient Modulus for Flexible Pavement
Design.” Research Results Digest, National Cooperative Highway Research Program
(NCHRP) Report 1-28A, Transportation Research Board of the National Academies, No.
285. 2004.
13. AASHTO, American Association of State Highways and Transportation Officials.
“Creep Compliance and Strength of Hot-Mix Asphalt.” AASHTO T322, Washington
D.C., 1993.
14. Roque, R; Birgisson, B; Zhang, Z; Sangpetngam, B; and Grant, T. “Implementation of
SHRPP Indirect Tension Tester to Mitigate Cracking in Asphalt Pavements and
Overlays.” Final Report Submitted to Florida Department of Transportation, University
of Florida, Gainesville, May 2002.
15. Roque, R; Birgisson, B; Drakos, C; and Dietrich, B. “Development and Field Evaluation
of Energy-Based Criteria for Top-Down Cracking Performance of Hot-Mix Asphalt.”
Journal of the Association of Asphalt Paving Technologists. Vol. 73, Baton Rouge,
Louisiana, 2004.
16. Alshamsi, K.S. “Development of Mix Design Methodology for Asphalt Mixtures with
Analytically Formulated Aggregate Structures.” Ph.D. Dissertation, Louisiana State
University and Agricultural and Mechanical College, Baton Rouge, Louisiana, May,
2006.
17. AASHTO, American Association of State Highways and Transportation Officials.
“Standard Test Method for Thermal Stress Restrained Specimen Tensile Strength.”
AASHTO TP 10, Washington D.C., 1993.
18. AASHTO, American Association of State Highways and Transportation Officials.
“Standard Test Method for Determining Dynamic Modulus of Hot-Mix Asphalt (HMA).”
AASHTO TP 62, Washington D.C., 2003.
19. Sousa, J; Solaimanian, M; and Weissman, S. “Development and Use of the Repeated
Shear Test (Constant Height): An Optional Mix Design Tool.” SHRP-A-698, Strategic
Highway Research Program, National Research Council, Washington, D.C., 1994.
20. Taylor, A; Tran, N; May, R; Timm, D; Robbins, M; and Powell, B. “Laboratory
Evaluation of Sulfur-Modified Warm Mix.” Journal of the Association of Asphalt Paving
Technologists, Vol. 79, pp. 403-442., 2010.
21. Lee, D.Y. “Modification of Asphalt and Asphalt Paving Mixtures by Sulfur Additives.”
Industrial & Engineering Chemistry Product Research and Development, Vol. 14, No. 3,
1975, pp. 171-177.

31
APPENDIX A
Performance Testing
Loaded Wheel Tester (LWT)
Rutting performance of the mix was assessed using a Hamburg-type LWT, manufactured by
PMW, Inc. of Salina, Kansas. This test is considered a torture test that produces damage by
rolling a 703N (158 lb.) steel wheel across the surface of a slab that is submerged in 50°C
(122°F) water for 20,000 passes at 56 passes a minute; see Figure A.1. A maximum allowable
rut depth of 6 mm (0.24 in.) at 20,000 passes at 50ºC (122°F) was used as a failure criteria.
Figure A.1
The Hamburg-Type Loaded Wheel Tester (LWT)
Flow Number (FN)
The flow number test was used to assess the permanent deformation characteristics of paving
materials by applying a repeated dynamic load for several thousand repetitions on a cylindrical
asphalt sample. The FN is defined as the starting point, or cycle number, at which tertiary flow
occurs on a cumulative permanent strain curve obtained during the test. This test uses a loading
cycle of 1.0 second in duration, and consists of applying a 0.1-second haversine load followed by
a 0.9-second rest period [7]. Permanent axial strains are recorded throughout the test. The test
was conducted at an effective temperature Teff and stress level of 54°C (129.2°F) and 207 kPa
(30 PSI), respectively. This test is applicable to laboratory prepared specimens 100 mm (3.9 in.)
in diameter and 150 mm (5.9 in.) in height for mixtures with nominal maximum size aggregate
less than or equal to 37.5 mm (1.5 in.).

32
Repeated Shear at Constant Height (RSCH)
The RSCH test is used as an indicator of accumulated permanent deformation. This test was
conducted according to AASHTO TP7 Procedure F. It is a controlled stress test that applies
haversine shear stress pulses to a cylindrical specimen. The shear stress amplitude is applied with
a maximum shear stress of 68 kPa (9.9 PSI) for a loading time of 0.1 second and a rest period of
0.6 seconds. A varying axial load is applied automatically during each cycle to maintain the
specimen at constant thickness or height. Repetitive loading is applied for a total of 5,000
repetitions or until 5 percent permanent shear strain is reached by the sample. The primary
response variable from this test is the cumulative permanent shear strain at the end of testing [8].
Semi-Circular Bend (SCB)
Fatigue cracking potential was assessed using the SCB test developed by Wu et al.[9]. This test
characterizes the fracture resistance of HMA mixtures based on fracture mechanics principals,
the critical strain energy release rate, also called the critical value of J-integral, or Jc. Figure
presents the three-point bend load configuration and typical test result outputs from the SCB test.
To determine the critical value of J-integral (Jc), semi-circular specimens with at least two
different notch depths need to be tested for each mixture. In this study, three notch depths of
25.4 mm (1.0 in.), 31.8 mm (1.3 in.), and 38 mm (1.5 in.) were selected based on an a/rd ratio
(the notch depth to the radius of the specimen) between 0.5 and 0.75. The test temperature was
selected to be 25°C (77°F). The semi-circular specimen is loaded monotonically till fracture
failure under a constant cross-head deformation rate of 0.5 mm/min (0.02 in/min) in a three-point
bending load configuration. The load and deformation are continuously recorded and the critical
value of J-integral (Jc) is determined using the following equation (9):
122
2
1
1 1
aab
U
b
UJc
(2)
where,
b = sample thickness;
a = the notch depth; and
U = the strain energy to failure.

33
Figure A.2
The semi-circular bending test
Modified Lottman
The Modified Lottman test was used to evaluate the effect of saturation and accelerated water
conditioning on compacted HMA samples utilizing freeze-thaw cycles. This method quantifies
HMA mixtures’ sensitivity to moisture damage, which is necessary to assure durability and long-
lasting hot mix asphalt. Numerical values of retained indirect-tensile properties are obtained by
comparing conditioned samples, samples subjected to vacuum saturation and freeze-thaw cycles,
to unconditioned samples. “Unconditioned” samples are samples that are not saturated nor
subjected to freeze-thaw cycles. For each mix used in the study, six – 150- (5.91) x 95-mm (3.7
in.) diameter samples were compacted with a Superpave gyratory compactor (SGC) to an air
void content of 7 ± 0.5 percent. After compaction and air void determination, the six SGC
samples were subdivided into two groups of three samples so that the average air void contents
of the two subsets were approximately equivalent. The “unconditioned” sample subset was
stored at room temperature for 24 ± 3 hours. Afterwards the “unconditioned” specimens were
wrapped or placed in a heavy duty, leak-proof plastic bag and then placed in a 25 ± 0.5°C (77 ±
1°F) water bath for 2 hours ± 10 minutes. The “unconditioned” specimens were then tested to
determine the indirect tensile strength for each sample. The “conditioned” samples were placed
in a freezer at -17.8°C (0°F) for 16 to 18 hours. After the freezing cycle, the conditioned
samples were placed in a 60°C (140°F) water bath for 24 hours. Upon completion of the
freeze/thaw cycle, the indirect tensile strength for the conditioned samples was determined. The
average indirect tensile strength was determined for both conditioned and unconditioned samples
by summing the test values and then determining the average value. The TSR is defined as the
ratio of the conditioned to the unconditioned indirect tensile strength [10].
Typical Load-deformation results from the semi-circular fracture test
0.00
0.50
1.00
1.50
2.00
2.50
0.00 0.50 1.00 1.50 2.00
Deformation, mm
Lo
ad,
kN
25.4mmnotch31.8mmnotch38.0mmnotch

34
Beam Fatigue
Beam fatigue testing is used to characterize the fatigue properties of a mixture. This test was
conducted according to AASHTO T321 protocol at 25ºC (77ºF). It is a strain-controlled test in
which a beam 318 mm (15 in.) long by 63.5 mm (2.5 in.) wide by 50.8 mm (2.0 in.) high is
subjected to 4-point bending. The strain level selected was selected such that failure does not
occur prior to 10,000 cycles. The center deflection of the beam was continuously measured and
used in the computation of the stiffness. Failure was defined as the load cycle at which the
specimen exhibits a 50 percent reduction in stiffness. The number of cycles to failure (Nf) was
used in the analyses. The reported test results were the average of three test samples [11].
Dissipated Creep Strain Energy (DCSE)
The DCSE threshold represents the energy that the mixture can tolerate before it fractures. The
evaluation of DCSE of an HMA mixture involves two individual laboratory tests performed on
the same specimen. The indirect resilient modulus (MR) test and the indirect tensile strength
(ITS) test were conducted at 10°C (50°F) on the same specimen to calculate the dissipated strain
energy[12], [13]. Triplicate specimens of 150 mm (5.9 in.) in diameter and 50 mm (2.0 in.) in
thickness were used. The test specimens were conditioned at 10°C (50°F) for four hours before
a 200-cycle haversine load with 0.1 second loading period and 0.4 second rest period in each
loading cycle was applied along the diametrical plane on the specimen. A conditioning loading
sequence was applied before beginning the actual test in order to obtain uniform measurements
in load and deformation. Then, a four-cycle haversine compressive load was applied and load
and deformation data recorded continuously. The magnitude of the applied load should be such
that it results in a deformation as close as possible to 100 microstrains. After one test was
completed, the specimen was rotated 90 degrees and tested again. The resilient modulus was
calculated from the average value of the two test results. Once the MR test finished, the ITS test
was then performed on the same specimen.
The DCSE calculation used in this study was introduced by Rogue et al. ([14], [15]) and later
used by Alshamsi [14], [15,][16]. As indicated in Figure A.3, DCSE is defined as the fracture
energy (FE) minus the elastic energy (EE). The fracture energy is defined as the area under the
stress-strain curve up to the point where the specimen begins to fracture. As shown in Figure
A.3, the area within the curve OA and X-axis (i.e., Area OAB) is the fracture energy. The elastic
energy is the energy resulting in elastic deformation. Therefore, MR, calculated from the
resilient modulus test, is selected as the slope of the line AC and the area of triangle ABC is
taken as the elastic energy (EE). The failure strain (f), peak tensile strength (St) and fracture
energy are determined from the ITS test. A rather clear picture of DCSE calculation is described
below:

35
0
f
tr
SM (3)
R
tfR
M
)SM(
0 (4)
EE = )(S ft 02
1 (5)
DCSE = FE – EE (6)
Strain
Str
ess
(P
si)
A
BCO
Tensile Strength
Dissipated Creep Strain Energy (DE)
Elastic Energy(EE)
f
MR
MR
Figure A.3
Dissipated creep strain energy determination
Thermal Stress Restrained Specimen Test (TSRST)
This test was used to determine the tensile strength and fracture temperature of compacted
bituminous mixtures by measuring the tensile load in a specimen which is cooled at a constant
rate 10°C/hour (50°F/hour) while being restrained from contraction. The test was conducted in
accordance with AASHTO TP-10 [17]. The samples tested for this study were compacted beams
254 mm (10 in.) long by 50.8 mm (2 in.) wide by 50.8 mm (2 in.) high.
Dynamic Modulus (E*)
Dynamic modulus describes the mixture’s stiffness over a range temperatures and frequencies
which could be encountered during performance. This test consists of applying a uniaxial
sinusoidal (i.e., haversine) compressive stress to an unconfined or confined HMA cylindrical test
specimen. The stress-to-strain relationship under a continuous sinusoidal loading for linear

36
viscoelastic materials is defined by a complex number called the “complex modulus” (E*). The
absolute value of the complex modulus, |E*|, is defined as the dynamic modulus. The dynamic
modulus is mathematically defined as the maximum (i.e., peak) dynamic stress (σ0) divided by
the peak recoverable axial strain (ε0):
0
0* ||
E (7)
The dynamic modulus test consists of testing samples at 4.4, 20, 37.8, and 54.4oC (40, 70, 100
and 130oF) at loading frequencies of 0.1, 0.5, 1.0, 5, 10, and 25 Hz at each temperature for the
development of master curves for use in pavement response and performance analysis. The
haversine compressive stress was applied on each sample to achieve a target vertical strain level
of 100 microns in an unconfined test mode. The test was conducted in accordance with
AASHTO TP-62 [18].

This public document is published at a total cost of $250
42 copies of this public document were published in this fi rst
printing at a cost of $250. The total cost of all printings of
this document including reprints is $250. This document was
published by Louisiana Transportation Research Center to
report and publish research fi ndings as required in R.S. 48:105.
This material was duplicated in accordance with standards for
printing by state agencies established pursuant to R.S. 43:31.
Printing of this material was purchased in accordance with the
provisions of Title 43 of the Louisiana Revised Statutes.