Embed Size (px)
Citation preview

LouisianaFor The Fiscal Year Ended June 30, 2012P O P U LA R A N N U A L F I N A N C I A L R E P O RT
1
The Popular Annual Financial Report (Popular Report) is prepared within six months after the close of each fiscal year end in accordance
with Louisiana Revised Statute (LRS) 39:80(B) with the express purpose of providing a brief, objective, and easily understood analysis
of the State’s financial performance for the preceding year, as well as facilitating wide dissemination of the report to the public. It
presents selected basic information about the State’s revenues, expenditures, financial position, budget, service efforts, and performance.
The information is presented in a non-technical format and is intended to summarize and explain the basic financial condition and the
operations of the State for the fiscal year covered by the Comprehensive Annual Financial Report (CAFR) for the State of Louisiana.
The financial data presented in the “Government-wide Financial Analysis” and “General Fund Balance Sheet” sections of this report use
the same accounting measurements and principles as the CAFR.
The CAFR is prepared in accordance with Generally Accepted Accounting Principles (GAAP) and is independently audited by the Office
of the Legislative Auditor of the State of Louisiana. Conversely, this report is unaudited and includes financial data (in the “Government
-wide Financial Analysis” section) that departs from GAAP since it does not include the entire GAAP reporting entity (such as discrete
component units of the State) and includes only selected financial data. Additionally, the data found in the “Budgetary Information”
section departs from GAAP because it is prepared on a non-GAAP budgetary basis.
The source of all illustrations is the 2012 and/or prior year CAFRs unless otherwise indicated.
A copy of the CAFR can be obtained on the Office of Statewide Reporting and Accounting Policy’s (OSRAP) website at
www.doa.louisiana.gov/osrap/cafr-2.htm.
Introduction
Louisiana’s employment has continued on a positive track. It is
estimated that in 2012 Louisiana will reach 1,945,700 jobs. That
represents 3.2% increase or an additional 61,600 jobs since the
trough of the recession. This represents a new employment record
for the state.
Several factors are behind this job growth. The State’s huge
chemical industry is doing very well due to gaining market share
from the Europeans. Several chemical firms have announced
expansion plans which have been very good for the industrial
construction sector. Recovery in the Gulf of Mexico has picked up
considerable steam generating jobs in the exploration companies
and those firms that provide goods and services to that sector.
Louisiana’s unemployment rate decreased by .2% in 2011.
Louisiana is expected to add 22,700 jobs in 2013 and another
27,500 jobs in 2014.
In 2011, Louisiana’s median household income increased by $1,215
while income per capita increased by $1,528. The following tables
illustrate comparisons between Louisiana and the U.S.
Economic Outlook

2
Government-Wide Financial Analysis
State revenue totaled $25.5 billion in fiscal year 2011-2012. These
revenues and other state assets were used to support government
programs. The accompanying chart shows revenue by source.
Federal grants (capital and operating) comprised 51% of the state’s
revenue and were for specific purposes.
Government-Wide Revenues Government-Wide Expenses
Government-wide activities provide a broad overview of the State’s finances similar to private-sector accounting. The government-wide
activities present the financial position and operating results of the state. Discrete component units (such as colleges and universities) are
excluded from this analysis (see introduction to the PAFR) because the PAFR focuses on primary government entities. Fiduciary funds
(such as pension funds) are also excluded from the State’s government-wide financial statements in the CAFR as well as the PAFR
because the State cannot use these assets to finance its operations. However, the Net Pension Obligation (NPO) of the fiduciary funds are
included in this analysis and the CAFR because it is a liability of the State.
The government-wide statements of the State reflect total assets of $31 billion ($2 billion decrease from prior year) and total liabilities of
approximately $16.8 billion ($711 million increase from prior year). As a result, total net assets (assets less liabilities) equaled
approximately $14.2 billion at June 30, 2012, a decrease of $1 billion or 8.6% from last year. On the Statement of Activities (Operating
Statement) total expenditures exceeded total revenue by $700 million as indicated below (see Management’s Discussion & Analysis in
the CAFR for an explanation of increases and decreases).
Number of State Employees
Louisiana Popular Report for the Fiscal Year Ended June 30, 2012
On a government-wide basis, the State spent $26.2 billion. As
depicted in the accompanying chart, health and welfare
represents the State’s largest spending category accounting for
37% of the State’s spending for the fiscal year. Education and
general government closely follow, accounting for 25% and
20% of the state’s spending, respectively.
Louisiana employed 85,863 state civil service employees in fiscal year 2012. This represented a reduction of 3,011 (3.39%) fulltime
positions in the fiscal year 2012 budget, which was accomplished through the elimination of positions, as well as a combination of
retirements and attrition.

3
The balance sheet of the General Fund,
the chief operating fund of the State, is
generally of special interest to the
public and legislators. The majority of
funds created by legislative act or in the
Constitution (commonly referred to as
“statutorily dedicated funds”) are now
reported in the State General Fund for
CAFR reporting purposes. Regardless
of the CAFR presentation as required
by generally accepted accounting
principles, these funds are still
maintained as individual self-balancing
accounts in the State Treasury as
required by state statute.
At June 30, 2012, the General Fund had
assets of $7.6 billion and liabilities of
$4 billion, leaving a total fund balance
of $3.6 billion. Of this balance, $2.3
billion is comprised of statutorily
dedicated funds and $1.3 billion of
General Fund (Direct) and is depicted
in the chart.
General Fund Balance Sheet
GASB 54 revised fund balance categories to
focus on the extent to which the government is
bound to honor constraints on the specific
purposes for which fund sources can be spent.
The accompanying chart depicts the five fund
categories of the General Fund for the past two
fiscal years.
Nonspendable Fund Balance - amount that
will never convert to cash, such as inventories
of supplies.
Restricted Fund Balance - the portion of fund
balance with externally imposed constraints
from creditors or from Constitutional
restrictions.
Committed Fund Balance - resources
constrained by limitations imposed by the
Legislature. These are usually statutorily
dedicated funds whose resources are to be used
for specific purposes as defined in legislative
acts.
Assigned Fund Balance - amount intended to
be used for specific purposes and are usually
created by the Joint Legislative Committee on
the Budget approvals of year-end encumbrance
roll-overs into the subsequent fiscal year.
Unassigned Fund Balance - any excess that
has not been classified or committed to one of
the categories above.

4 Louisiana Popular Report for the Fiscal Year Ended June 30, 2012
Federal Grant Revenue The federal government awards financial assistance to the State in the form of Federal Grants. These federal grants have increased over
the years since Hurricanes Katrina and Rita in 2005 but decreased in 2012. For the fiscal year ended June 30, 2012, health and welfare
programs received federal grants totaling $6 billion, followed secondly by general government and third by education, receiving $4.3
billion and $1.3 billion, respectively, with the remainder going to other functions.
Louisiana derives considerable revenue from mineral resources, so the direction of varying oil and natural gas prices adds another
element of uncertainty to Louisiana’s economic status. Average oil prices have ranged from a low of $13.47 per barrel in 1998, to a high
of $104.86 per barrel in 2008. The average price per barrel in 2011 was $101.40. The accompanying graph depicts the total state
revenue from minerals produced primarily from oil and gas from Louisiana lands and water bottoms for each of the past fifteen years.
Also presented is the average crude oil price per barrel for the same time period.
Mineral Revenue

5
General Government Expenditures Governmental fund expenditures totaled $25.9 billion. These expenditures include $2.8 billion for payroll and related employee costs,
$21.1 billion for costs related to operating services and other charges, and $2 billion for capital outlay. The sources of funding for these
expenditures include $13.5 billion in state funding and $12.4 billion in federal funding. The Louisiana Department of Culture,
Recreation, and Tourism, the Louisiana Department of Education, and the Louisiana Department of Transportation and Development
comprise $8.2 billion of these expenditures, of which $6.2 billion is state funded and $2 billion is federally funded. Debt service and
intergovernmental expenditures are not depicted in these functional graphs and total more than $1.4 billion.
6 Louisiana Popular Report for the Fiscal Year Ended June 30, 2012
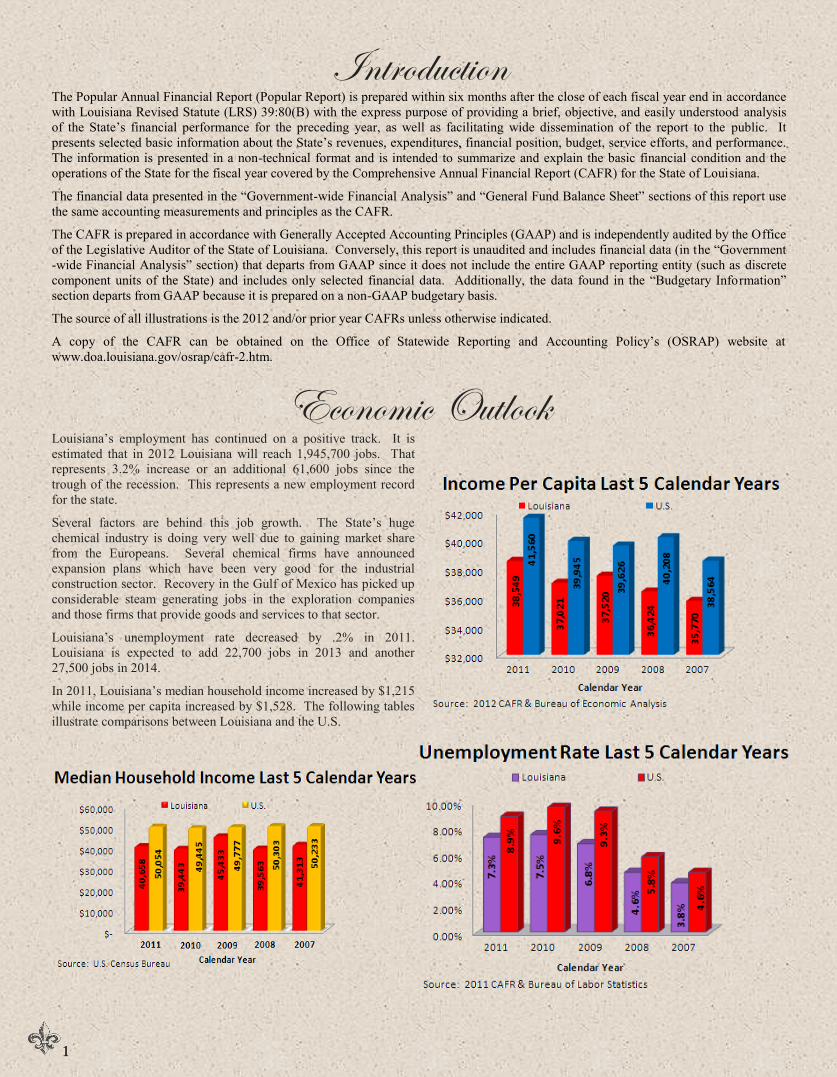
State Debt LRS 39:1365(25) and 39:1402(D) limit the
authorization and issuance, respectively, of general
obligation bonds. Good debt management has
produced positive results. “Debt service per capita”
is the amount the State will pay per person for the
general obligation debt of the State. Based on U.S.
Census Bureau population statistics, the debt service
per capita for fiscal year 2011 was $755. (Fiscal
year 2012 is not available due to the unavailability
of the 2012 population estimate at the date of this
printing.)
Budgetary Information Revenues
The State of Louisiana is legally required to prepare a balanced annual budget, and all state agencies are required to adhere to the budget
during the fiscal year. The accompanying graph depicts the budgeted and actual revenues and illustrates the performance of the State in
adhering to the legally adopted revenue budget. The revenues are presented by source, which is mostly comprised of federal grants and
various taxes. All budgeted revenues of the General Appropriation Bill for all funds, including the General Fund, are included in this
depiction.
Expenditures While the revenue graph depicts the revenue budget by
sources of revenue, as well as actual receipts by source
of all funds, the expenditure graph depicts budgeted
and actual expenditures of the General Fund, which is
the chief operating fund of the State. The
accompanying graph illustrates the budgeted and actual
expenditures of the General Fund by function of
government. It also illustrates the State’s performance
in adhering to the legally adopted expenditures budget.
7
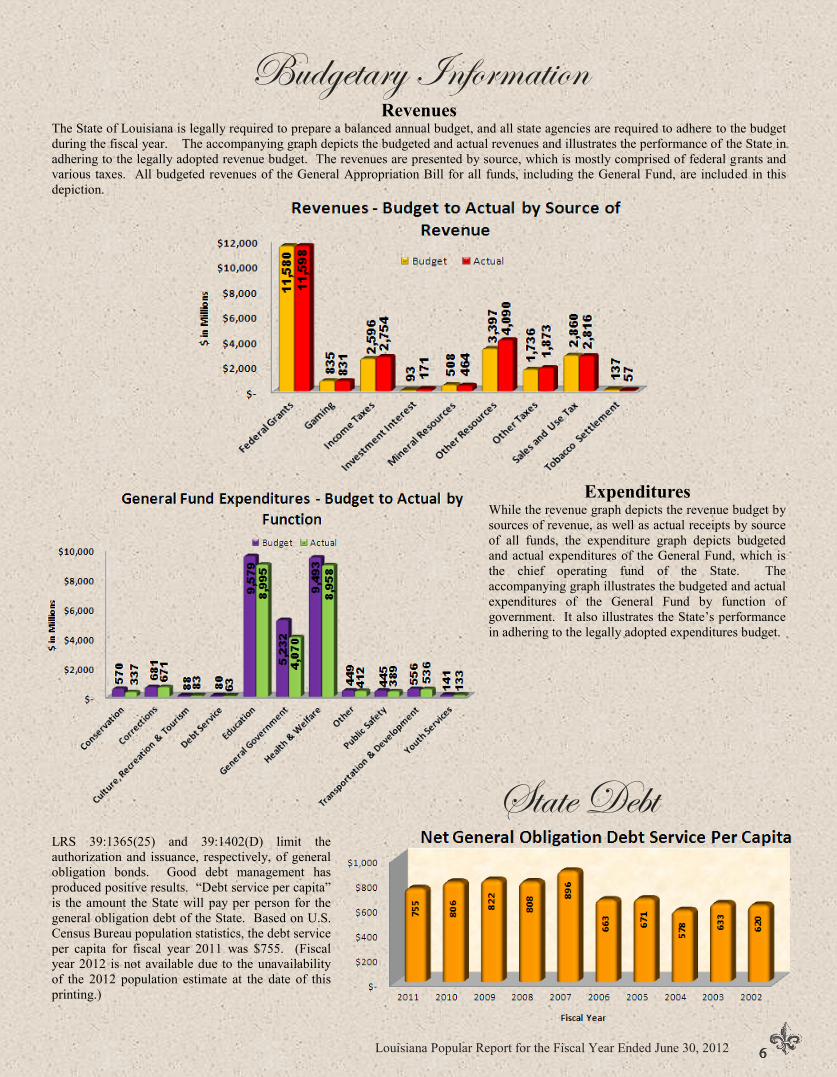
Budget Stabilization Fund The Budget Stabilization Fund was created in 1990 for use as a source of funding in times of declining revenues. The fund receives its
monies from excess mineral revenues, non-recurring revenues, monies in excess of the expenditure limit, and other monies appropriated
by the legislature. The monies can be spent if the official forecast for recurring revenues for the next fiscal year is less than the official
forecast of recurring revenues for the current fiscal year, or if a deficit for the current fiscal year is projected due to a decrease in
recurring revenues. For fiscal year 2012, $2 million in interest earnings was deposited into the Budget Stabilization Fund. According to
LRS 39:94, no appropriation or deposit to the fund shall be made if such appropriation or deposit would cause the balance in the fund to
exceed four percent of total State revenue receipts for the previous fiscal year. The Budget Stabilization Fund cap was $777 million for
fiscal year 2012. There were $205 million of expenditures from the fund for fiscal year 2012. The fund balance of the Budget
Stabilization Fund was $443 million at the end of fiscal year 2012.
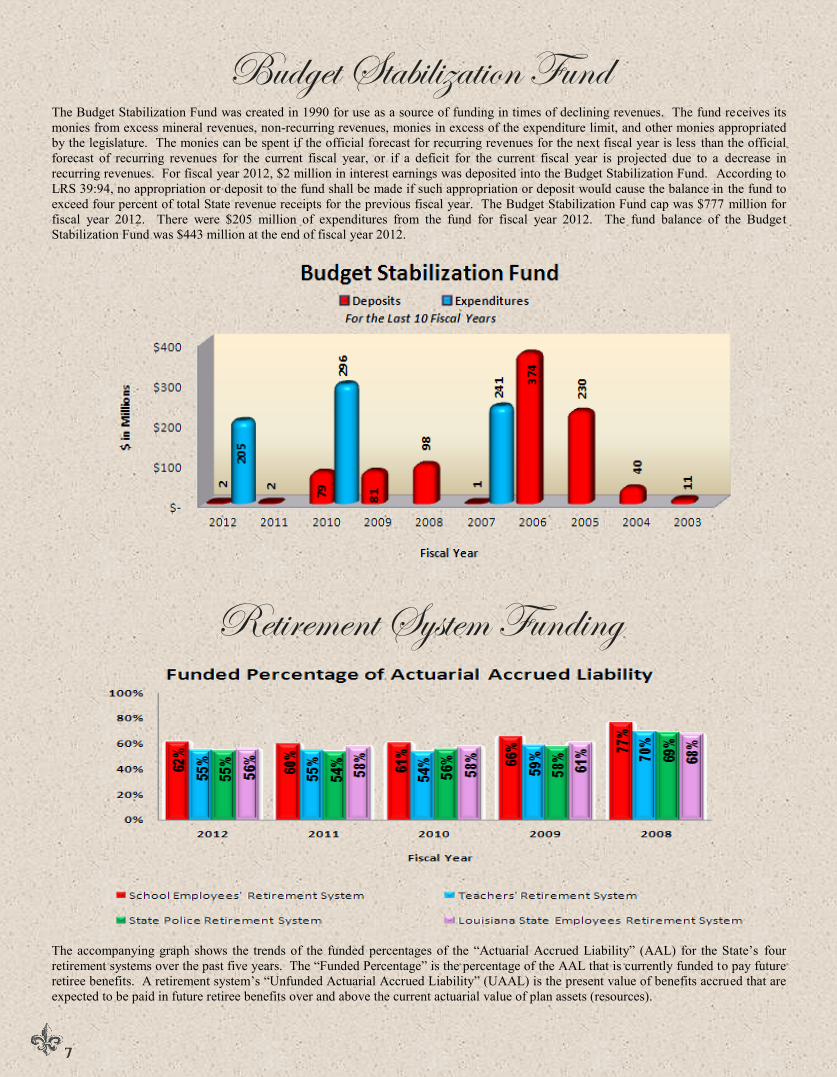
Retirement System Funding
The accompanying graph shows the trends of the funded percentages of the “Actuarial Accrued Liability” (AAL) for the State’s four
retirement systems over the past five years. The “Funded Percentage” is the percentage of the AAL that is currently funded to pay future
retiree benefits. A retirement system’s “Unfunded Actuarial Accrued Liability” (UAAL) is the present value of benefits accrued that are
expected to be paid in future retiree benefits over and above the current actuarial value of plan assets (resources).

Louisiana Popular Report for the Fiscal Year Ended June 30, 2012 8
Other Postemployment Benefits
Louisiana’s Division of Administration, Office of
Group Benefits (OGB), is the administrator of plans
that provide other postemployment benefits (OPEB) to
eligible participants for healthcare and life insurance
benefits. Substantially all state employees become
eligible for postemployment benefits if they reach
normal retirement age while working for the State and
are a member of OGB. Through self-insured and self-
funded OGB programs, premiums are collected and
benefits are paid as they become due in accordance
with an agreement between the employers and plan
members, and their beneficiaries.
Effective July 1, 2007, the State began reporting the
liability for other postemployment benefits (net OPEB
obligation). Each year the State records the adjusted
annual required contribution (ARC) less contributions.
The ARC represents the normal cost and a portion of
the unfunded actuarial accrued liability amortized over
thirty years. The net OPEB obligation at the end of
fiscal year 2012 was approximately $2.2 billion and is
reported on the Statement of Net Assets in the CAFR.
The unfunded actuarial accrued liability (UAAL) that is
expected to be paid in future retiree benefits over and
above current resources was approximately $4.9
billion.
Louisiana maintains 13,043 bridges and 60,579 miles of roads and streets. Construction of roads and bridges continues to occur
throughout the State through Louisiana’s Transportation Infrastructure Model for Economic Development (TIMED) program. The
TIMED program was established to expand and improve transportation infrastructure across Louisiana. The program includes widening
536 miles of two-lane highways to four lanes and new construction or improvements to three major bridge projects. To date, eight (50%)
of the sixteen major transportation projects have been completed. The completed projects are U.S. 90 from Morgan City to Houma;
WestBank Expressway in Jefferson Parish; Tchoupitoulas Street Corridor in Greater New Orleans; West Napoleon Boulevard in
Jefferson Parish; LA 15 from the Louisiana state line in Natchez, Mississippi to Monroe, LA; John James Audubon Mississippi River
Bridge; and improvements to the New Orleans International Airport and Port of New Orleans. Department of Transportation and
Development (DOTD) infrastructure expenditures for the fiscal year ended June 30, 2012 totaled approximately $863 million.
The accompanying chart depicts the total DOTD infrastructure expenditures for the last five fiscal years.
Transportation
In M
illi
on
s
9
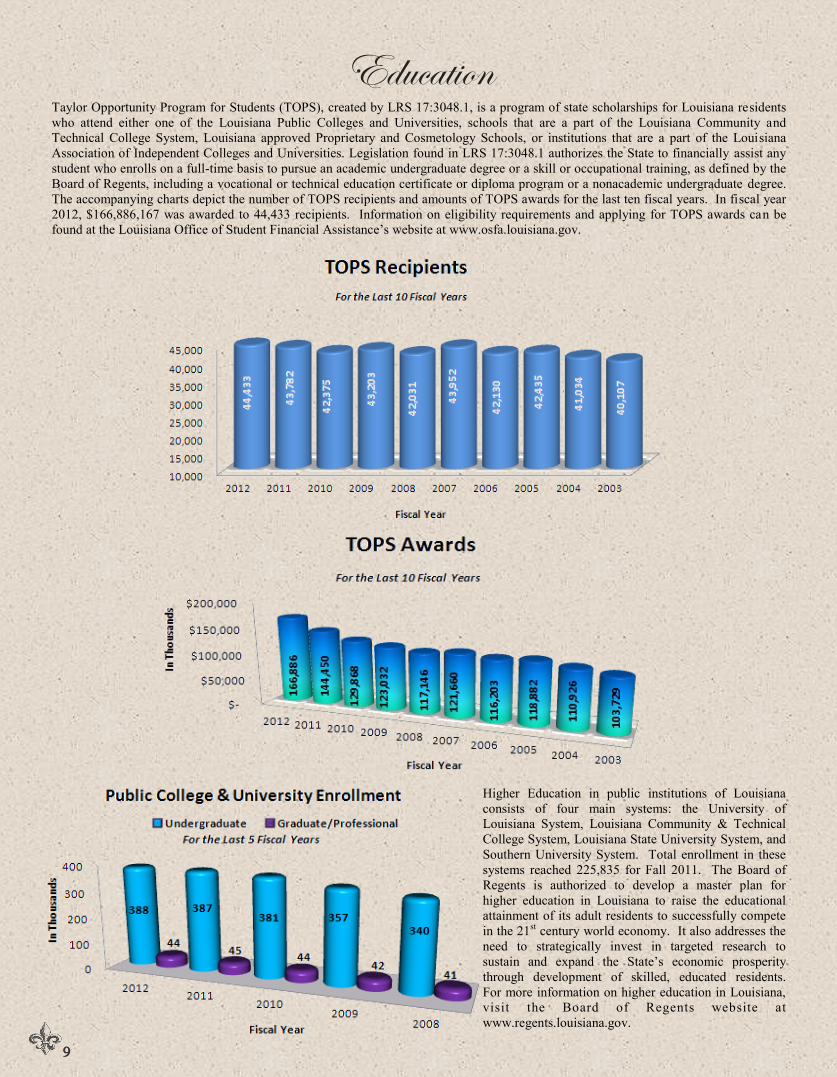
Taylor Opportunity Program for Students (TOPS), created by LRS 17:3048.1, is a program of state scholarships for Louisiana residents
who attend either one of the Louisiana Public Colleges and Universities, schools that are a part of the Louisiana Community and
Technical College System, Louisiana approved Proprietary and Cosmetology Schools, or institutions that are a part of the Louisiana
Association of Independent Colleges and Universities. Legislation found in LRS 17:3048.1 authorizes the State to financially assist any
student who enrolls on a full-time basis to pursue an academic undergraduate degree or a skill or occupational training, as defined by the
Board of Regents, including a vocational or technical education certificate or diploma program or a nonacademic undergraduate degree.
The accompanying charts depict the number of TOPS recipients and amounts of TOPS awards for the last ten fiscal years. In fiscal year
2012, $166,886,167 was awarded to 44,433 recipients. Information on eligibility requirements and applying for TOPS awards can be
found at the Louisiana Office of Student Financial Assistance’s website at www.osfa.louisiana.gov.
Education
Higher Education in public institutions of Louisiana
consists of four main systems: the University of
Louisiana System, Louisiana Community & Technical
College System, Louisiana State University System, and
Southern University System. Total enrollment in these
systems reached 225,835 for Fall 2011. The Board of
Regents is authorized to develop a master plan for
higher education in Louisiana to raise the educational
attainment of its adult residents to successfully compete
in the 21st century world economy. It also addresses the
need to strategically invest in targeted research to
sustain and expand the State’s economic prosperity
through development of skilled, educated residents.
For more information on higher education in Louisiana,
visit the Board of Regents website at
www.regents.louisiana.gov.

10
This public document was published at a total cost of $1,025.00. One Thousand (1,000) copies of this public document were published in this first printing at a cost of $1.03 per document. This document was published for public distribution by the Division of Administration, Office of Statewide Reporting and Accounting Policy, to reflect an overview of the financial condition of the state for the fiscal year ended June 30, 2012, under the authority of LRS 39:80(B). This material was printed in accordance with the standards for printing by state agencies pursuant to LRS 43:31.
WEBSITE ADDRESSES
State of Louisiana www.louisiana.gov
Office of the Governor www.gov.louisiana.gov
Division of Administration www.doa.louisiana.gov/doa Office of Statewide Reporting and Accounting Policy www.doa.louisiana.gov/osrap
Louisiana is dedicated to providing its residents with the best social welfare and
economic security available. Many programs and services have been established to
aid individuals in need of benefits from the health and welfare system. Louisiana
healthcare, which incurs much of the state’s expenses, has made significant
improvements in the provisions of health and welfare services to its residents. The
Medicaid program, which is one of the largest health insurance programs in the
State, provided medical services for slightly over one million Louisiana residents
during the fiscal year ended June 30, 2012. Services were provided to 54,180
elderly, 180,212 disabled, 105,793 adult residents, as well as, 685,044 children.
The overall enrollment increased by 9,244 individuals. *
*Enrollment figures are estimated based on information obtained from the Department of Health and Hospital and are revised yearly; however, only the original estimates are reported here.
Health and Welfare
Animal, forestry, fisheries, and plant
commodities make up the multi-billion dollar
agriculture industry in Louisiana. Agricultural
and natural resource industries provide
diversification of the economy of Louisiana and
provide economic benefits to urban and rural
communities. This table depicts the gross farm
value, i.e., the commodity’s contribution to
economic activity in the state, and the value
added due to cleaning, processing, packaging,
marketing and transporting the commodity to
yield the total contribution to the state’s
economy. Forestry produced the most income of
all agricultural commodities, followed by
poultry production which was the largest animal
agricultural industry.
Louisiana Agricultural and Natural Resources 2011
(in dollars)
Commodity Gross Farm Value Value Added Total Value
Cattle (calves) $ 398,525,864 $ 49,815,733 $ 448,341,597
Horses 436,564,000 45,839,220 482,403,220
Poultry 795,406,415 775,521,254 1,570,927,669
Aquaculture (e.g. crawfish) 264,063,740 178,243,025 442,306,765
Fisheries/Marine (e.g. seafood) 189,440,490 184,704,478 374,144,968
Cotton 255,862,482 51,172,496 307,034,978
Feed Grain Crops 517,752,389 90,606,668 608,359,057
Forestry 801,066,244 2,202,932,171 3,003,998,415
Rice 366,223,301 109,866,990 476,090,291
Soybeans 458,052,976 68,707,946 526,760,922
Sugarcane 638,404,290 443,052,577 1,081,456,867
Other 965,465,789 376,327,157 1,341,792,946
TOTAL ALL COMMODITIES $ 6,086,827,980 $ 4,576,789,715 $ 10,663,617,695
Source: LA Summary of Agriculture and Natural Resources
LSU AgCenter
Unofficial statistics
Louisiana Agricultural and Natural Resources
Louisiana’s Medicaid expenditures are grouped into two types, Medical Vendor Program
(MVP) and Medical Vendor Administration, both of which are jointly funded by state
and federal dollars. Medicaid expenditures for the fiscal year ended June, 30, 2012
totaled $6.9 billion with $1.4 billion funded by State General Fund; $606 million funded
by other state funding sources; and $4.9 billion funded by federal funds.
Louisiana is in the process of transforming Medicaid by moving away from a strictly fee-
for-service system to a coordinated care system. Under the new Bayou Health delivery
system, Louisiana’s Medicaid and Louisiana Children’s Health Insurance Program
(LaCHIP) recipients will receive coordinated health care services which should lead to
better access, more choices and improved health for patients, with provider rates no less
than those in fee-for-service Medicaid. As of June 30, 2012, approximately 879,167
enrolled members received coordinated health care services through the six health plans
of Bayou Health, namely Amerigroup, Community Health Solutions, Louisiana
Healthcare Connections, LaCare, Legacy Medicaid and United Health Care.
Louisiana Popular Report for the Fiscal Year Ended June 30, 2012

www.doa.la.gov/osrap/popularreport.htm