Embed Size (px)
Citation preview
1
LOT, Lifetime Optimisation Tool,
Mastiek en Hechtlaag vermoeiing
M. Huurman & L.T. Mo (Technische Universiteit Delft)
J. Moraal & R.N. Khedoe
(Technische Universiteit Delft)
Samenvatting Zoab is de standaard deklaag op het Nederlandse hoofdwegennet. Rafeling is het meest maatgevende schadebeeld van zoab en in verreweg de meeste gevallen bepalend voor de levensduur. De levensduur van zoab is korter dan de levensduur van de rest van de verhardingsconstructie. Binnen het Innovatie Programma Geluid van de DVS heeft rafeling in zoab daarom veel aandacht gekregen, hetgeen de ontwikkeling van LOT heeft mogelijk gemaakt. LOT is een meso-mechanische tool waarmee spanningen en rekken in het zoab-mengsel berekend worden. De tool beschouwt zoab als een constructie bestaande uit steentjes die met mastiek aan elkaar zijn geplakt. LOT berekent de belasting van de mastiek en van de hechtlaagjes tussen steen en mastiek en berekent de levensduur op basis hiervan. LOT rust op drie pijlers die gezamenlijk bepalend zijn voor de fenomenen die zich in zoab afspelen: wielbelasting, gedrag van mastiek en steen-mastiek hechtlaagjes, mengselgeometrie. De bijdrage geeft inzicht in de manier waarop het vermoeiingsgedrag van mastiek en van de hechtlaagjes tussen steen en mastiek met diverse laboratoriumproeven is bepaald. Om op een eenvoudige mannier aan zowel mastiek en hechtlaagjes te kunnen meten zijn nieuwe proeven bedacht. Deze proeven kunnen eenvoudig in de DSR (Dynamic Shear Rheometer) en/of DMA (Dynamic Material Analyser) worden uitgevoerd. De proeven zijn op schaal, d.w.z. de afmetingen van de proefstukjes liggen in de orde van millimeters, net als de mastiekbruggen in een zoab mengsel. Vooral de proeven aan steen-mastiek hechtlaagjes zijn uniek. Er zijn proeven gedaan op maagdelijk en op verouderd materiaal. Bovendien is de invloed van vochtindringing in het onderzoek meegenomen. Op basis van de metingen zijn schademodellen opgesteld en parameters bepaald. Aan het einde van de bijdrage worden de modellen toegepast op de in zoab megsels optredende respons zoals met LOT berekend.
2
1. INTRODUCTION PA (Porous Asphalt Concrete) is the standard surfacing material on the Dutch primary road network. Approximately 70% of this network is surfaced with PA. This is mainly due to the advantages that follow from the application of PA, i.e. reduced traffic noise and no splash and spray in wet weather conditions. Ravelling is the most significant type of damage in PA and in most cases by far decisive for PA service life. The Delft University of Technology is involved in meso-mechanical mechanistic modelling of asphaltic materials since the early 2000’s (1). In 2002 the Dutch Road and Hydraulic Engineering Institute (DVS) of the Ministry of Transport, Public Works and Water Management started a 5 year research into PA ravelling. And, as part of that research the Delft University of Technology was contracted in 2006 to develop a Lifetime Optimisation Tool (LOT) for the mechanistic analysis of PA. The LOT program aimed for the development of a meso-mechanical tool that gives insight into the phenomena that take place in PA mixtures during tyre passages. Use is made of Finite Element (FE) models. These models basically translate the PA surface load, the mixture geometry and the response behaviour of the mortar into signals of stress and strain at various locations in the PA mixture. By interpretation of the computed stress and strain signals the life expectancy of t PA is estimated. As indicated, LOT is based on mechanical analyses of in-mixture phenomena. Such an approach requires information and modelling of; the PA mixture geometry, the PA mortar response, the load signals on individual stones at the PA surface, PA mortar fatigue behaviour and finally the fatigue behaviour of the PA stone-mortar adhesive zone. To enable the quantification of aging effects the various material component properties need to be known as a function of aging. Also the effects of water on material component properties need to be investigated so that the effects of water ingress on PA design life become known. This paper discusses mortar fatigue and adhesive zone damage measurements. Also the interpretation of the results and their representation in damage models are discussed. At the end of the paper implementation of the models is explained on the basis of exemplary output of LOT response calculations.
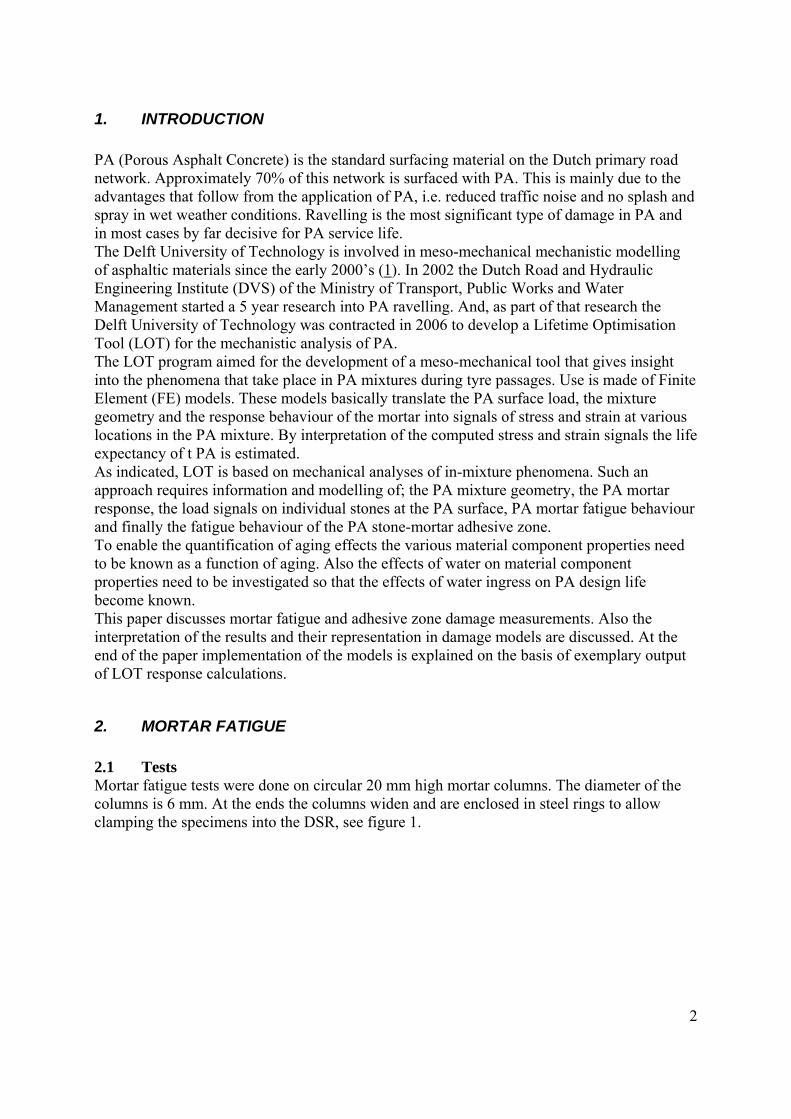
2. MORTAR FATIGUE 2.1 Tests Mortar fatigue tests were done on circular 20 mm high mortar columns. The diameter of the columns is 6 mm. At the ends the columns widen and are enclosed in steel rings to allow clamping the specimens into the DSR, see figure 1.
1.65
0
-1.65
Location of highest stress
Straight edged middle part.
Shear stress [MPa]
Location of highest stress
4 mm steel ring, Inner diameter 7 mm
4 mm steel ring, Inner diameter 7 mm
10 mm central part Cylinder with diameter 6 mm
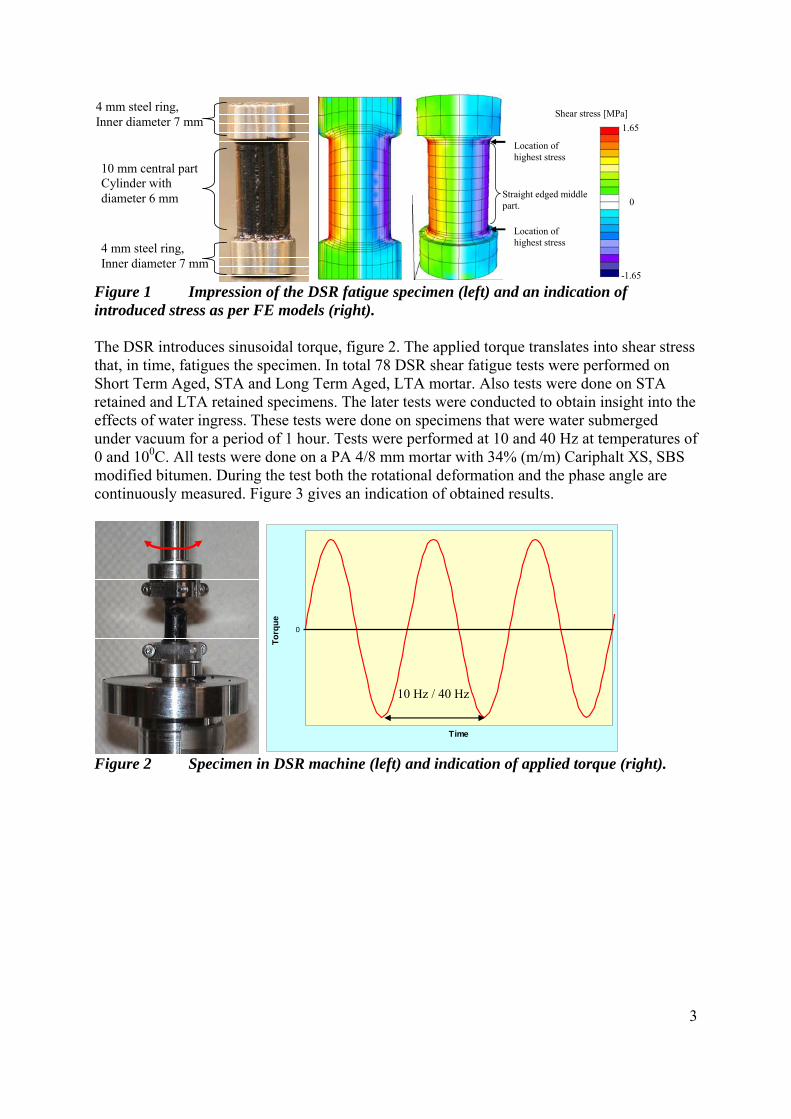
Figure 1 Impression of the DSR fatigue specimen (left) and an indication of introduced stress as per FE models (right). The DSR introduces sinusoidal torque, figure 2. The applied torque translates into shear stress that, in time, fatigues the specimen. In total 78 DSR shear fatigue tests were performed on Short Term Aged, STA and Long Term Aged, LTA mortar. Also tests were done on STA retained and LTA retained specimens. The later tests were conducted to obtain insight into the effects of water ingress. These tests were done on specimens that were water submerged under vacuum for a period of 1 hour. Tests were performed at 10 and 40 Hz at temperatures of 0 and 100C. All tests were done on a PA 4/8 mm mortar with 34% (m/m) Cariphalt XS, SBS modified bitumen. During the test both the rotational deformation and the phase angle are continuously measured. Figure 3 gives an indication of obtained results.
Time
Torq
ue
0
10 Hz / 40 Hz
Figure 2 Specimen in DSR machine (left) and indication of applied torque (right).
3
DSR shear fatigue test40Hz-10C-AW-L_02
0.00E+00
1.00E-02
2.00E-02
3.00E-02
4.00E-02
5.00E-02
6.00E-02
7.00E-02
8.00E-02
9.00E-02
0 1000 2000 3000 4000 5000 6000 7000 8000 9000
test time [s]
0
20
40
60
80
100
120
140
160
180
200
raw
pha
se [d
egre
es]
disp
lace
men
t [ra
d]
displacement rad raw phase degrees
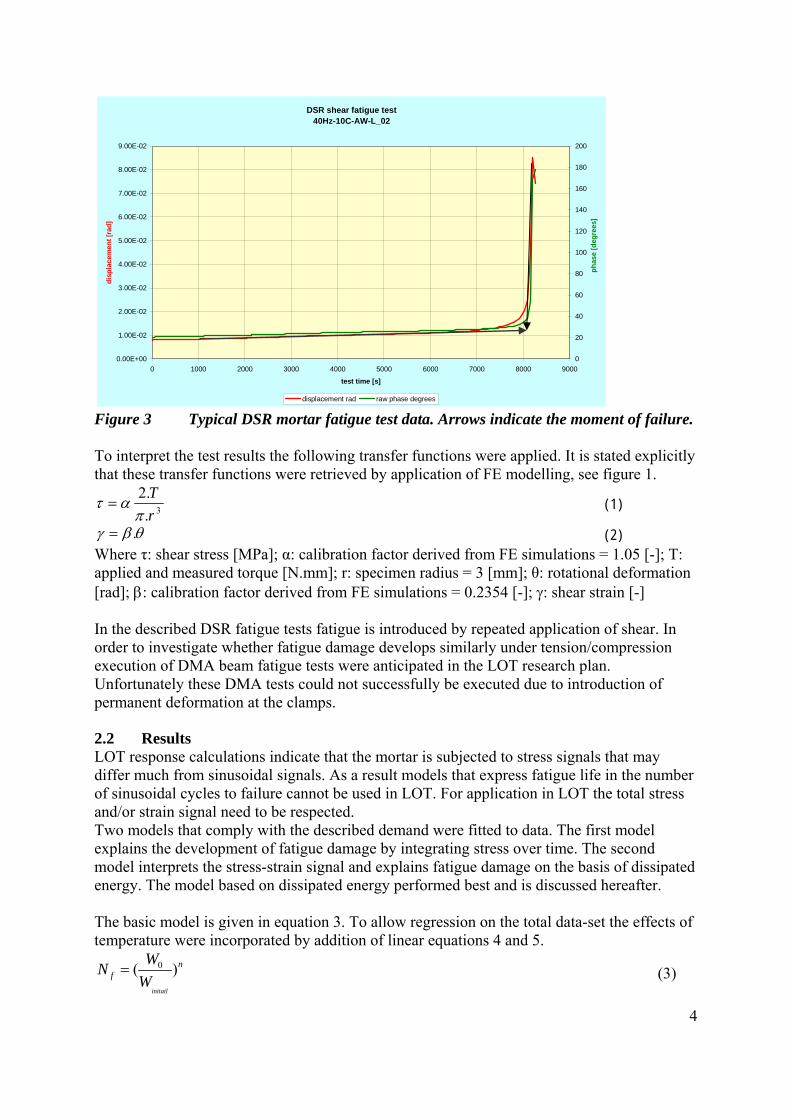
Figure 3 Typical DSR mortar fatigue test data. Arrows indicate the moment of failure. To interpret the test results the following transfer functions were applied. It is stated explicitly that these transfer functions were retrieved by application of FE modelling, see figure 1.
3..2rT
πατ = (1)
θβγ .= (2) Where τ: shear stress [MPa]; α: calibration factor derived from FE simulations = 1.05 [-]; T: applied and measured torque [N.mm]; r: specimen radius = 3 [mm]; θ: rotational deformation [rad]; β: calibration factor derived from FE simulations = 0.2354 [-]; γ: shear strain [-] In the described DSR fatigue tests fatigue is introduced by repeated application of shear. In order to investigate whether fatigue damage develops similarly under tension/compression execution of DMA beam fatigue tests were anticipated in the LOT research plan. Unfortunately these DMA tests could not successfully be executed due to introduction of permanent deformation at the clamps. 2.2 Results LOT response calculations indicate that the mortar is subjected to stress signals that may differ much from sinusoidal signals. As a result models that express fatigue life in the number of sinusoidal cycles to failure cannot be used in LOT. For application in LOT the total stress and/or strain signal need to be respected. Two models that comply with the described demand were fitted to data. The first model explains the development of fatigue damage by integrating stress over time. The second model interprets the stress-strain signal and explains fatigue damage on the basis of dissipated energy. The model based on dissipated energy performed best and is discussed hereafter. The basic model is given in equation 3. To allow regression on the total data-set the effects of temperature were incorporated by addition of linear equations 4 and 5.
0( )initail
nf
WNW
=
(3)
4
Where n: Material constant [-]; W0: Reference energy [MPa];Winitial: Dissipated energy per cycle in initial phase [MPa]
Tban 33 += (4) TbaW 440 += (5)
2.0
3.0
4.0
5.0
6.0
7.0
8.0
2.0E+00 3.0E+00 4.0E+00 5.0E+00 6.0E+00 7.0E+00 8.0E+00Log N-measured [-]
Log
N-m
odel
led
[-]
virgin aged
virgin+water aged+water
STA
STA,
STA
STA,
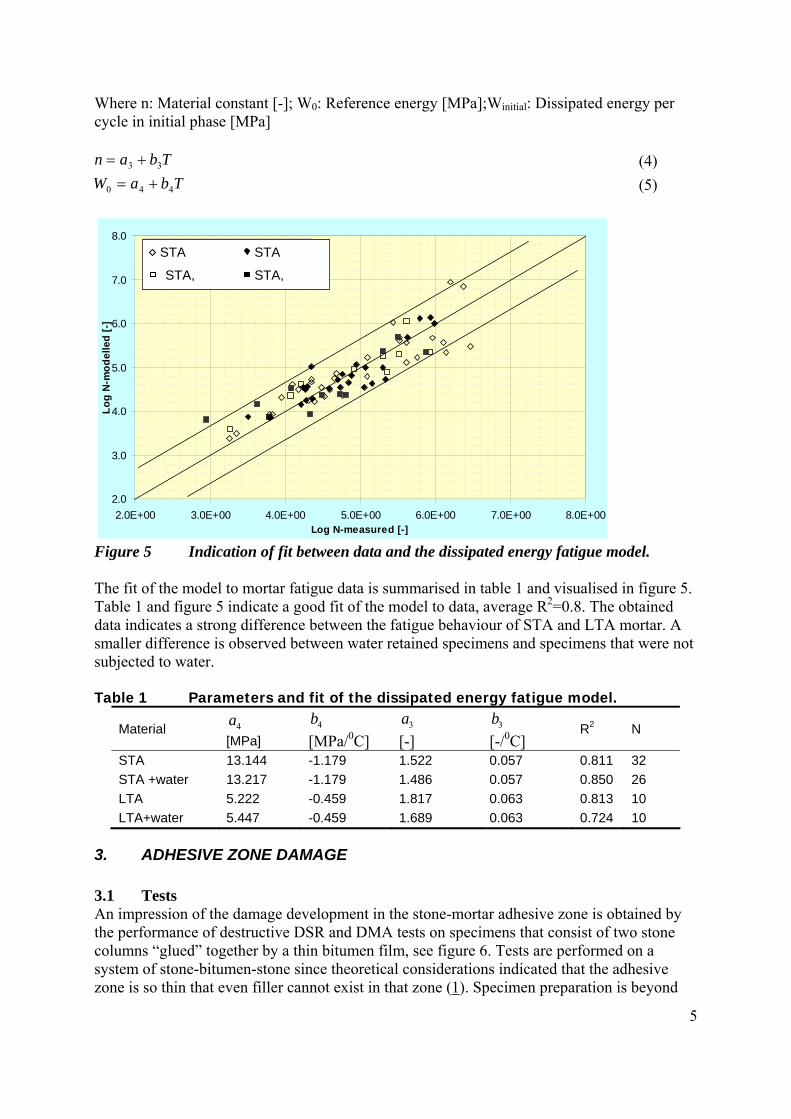
Figure 5 Indication of fit between data and the dissipated energy fatigue model. The fit of the model to mortar fatigue data is summarised in table 1 and visualised in figure 5. Table 1 and figure 5 indicate a good fit of the model to data, average R2=0.8. The obtained data indicates a strong difference between the fatigue behaviour of STA and LTA mortar. A smaller difference is observed between water retained specimens and specimens that were not subjected to water. Table 1 Parameters and fit of the dissipated energy fatigue model.
Material 4a [MPa]
4b [MPa/0C]
3a [-]
3b [-/0C]
R2 N
STA 13.144 -1.179 1.522 0.057 0.811 32 STA +water 13.217 -1.179 1.486 0.057 0.850 26 LTA 5.222 -0.459 1.817 0.063 0.813 10 LTA+water 5.447 -0.459 1.689 0.063 0.724 10
3. ADHESIVE ZONE DAMAGE 3.1 Tests An impression of the damage development in the stone-mortar adhesive zone is obtained by the performance of destructive DSR and DMA tests on specimens that consist of two stone columns “glued” together by a thin bitumen film, see figure 6. Tests are performed on a system of stone-bitumen-stone since theoretical considerations indicated that the adhesive zone is so thin that even filler cannot exist in that zone (1). Specimen preparation is beyond
5
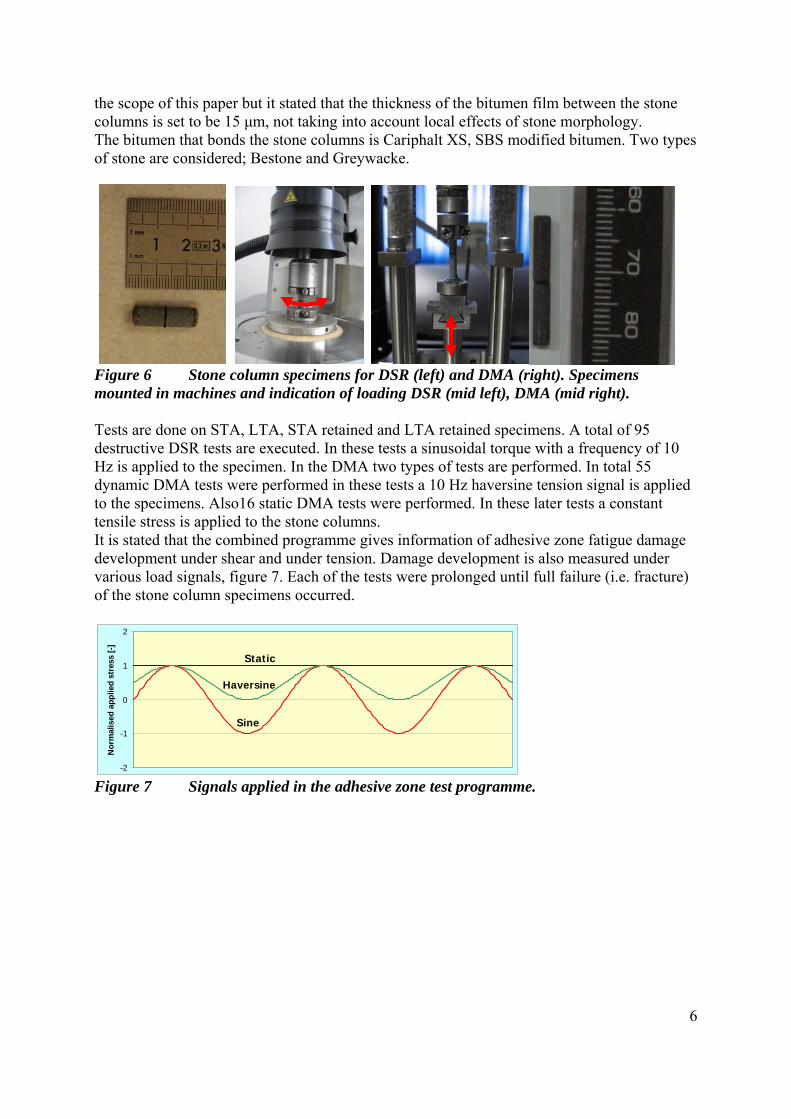
the scope of this paper but it stated that the thickness of the bitumen film between the stone columns is set to be 15 μm, not taking into account local effects of stone morphology. The bitumen that bonds the stone columns is Cariphalt XS, SBS modified bitumen. Two types of stone are considered; Bestone and Greywacke.
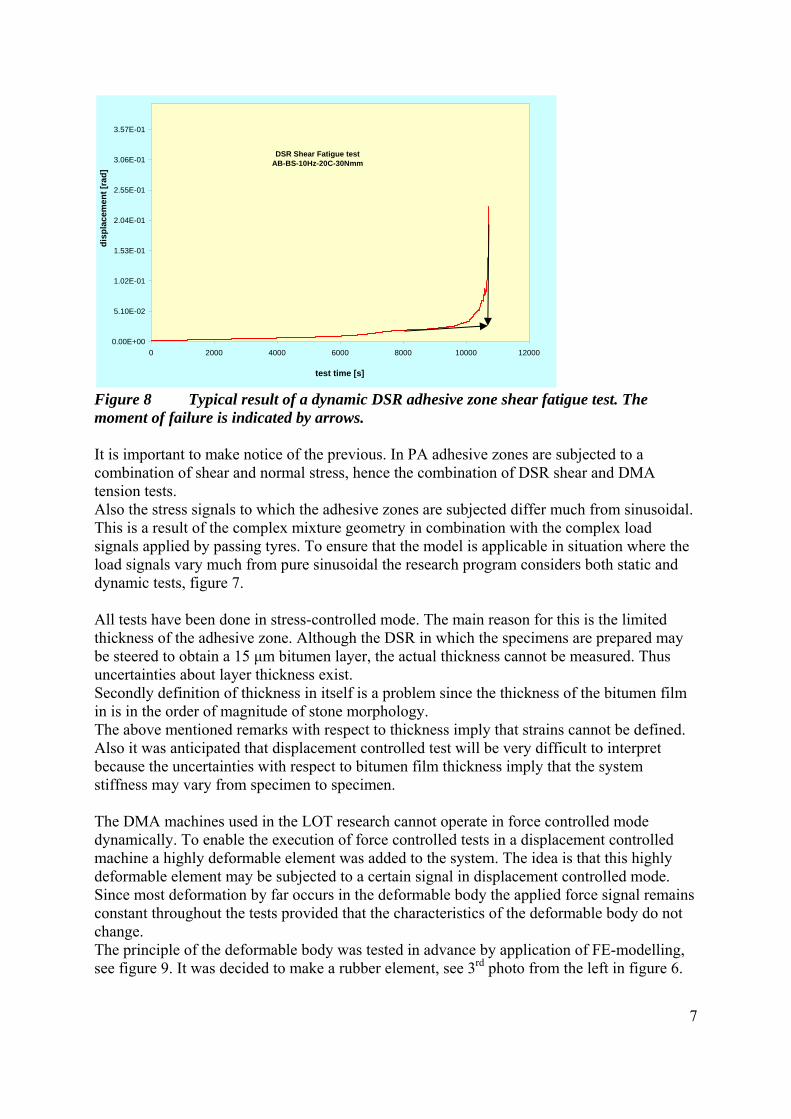
Figure 6 Stone column specimens for DSR (left) and DMA (right). Specimens mounted in machines and indication of loading DSR (mid left), DMA (mid right). Tests are done on STA, LTA, STA retained and LTA retained specimens. A total of 95 destructive DSR tests are executed. In these tests a sinusoidal torque with a frequency of 10 Hz is applied to the specimen. In the DMA two types of tests are performed. In total 55 dynamic DMA tests were performed in these tests a 10 Hz haversine tension signal is applied to the specimens. Also16 static DMA tests were performed. In these later tests a constant tensile stress is applied to the stone columns. It is stated that the combined programme gives information of adhesive zone fatigue damage development under shear and under tension. Damage development is also measured under various load signals, figure 7. Each of the tests were prolonged until full failure (i.e. fracture) of the stone column specimens occurred.
-2
-1
0
1
2
Nor
mal
ised
app
lied
stre
ss [-
]
Static
Sine
Haversine
Figure 7 Signals applied in the adhesive zone test programme.
6
DSR Shear Fatigue testAB-BS-10Hz-20C-30Nmm
0.00E+00
5.10E-02
1.02E-01
1.53E-01
2.04E-01
2.55E-01
3.06E-01
3.57E-01
0 2000 4000 6000 8000 10000 12000
test time [s]
disp
lace
men
t [ra
d]
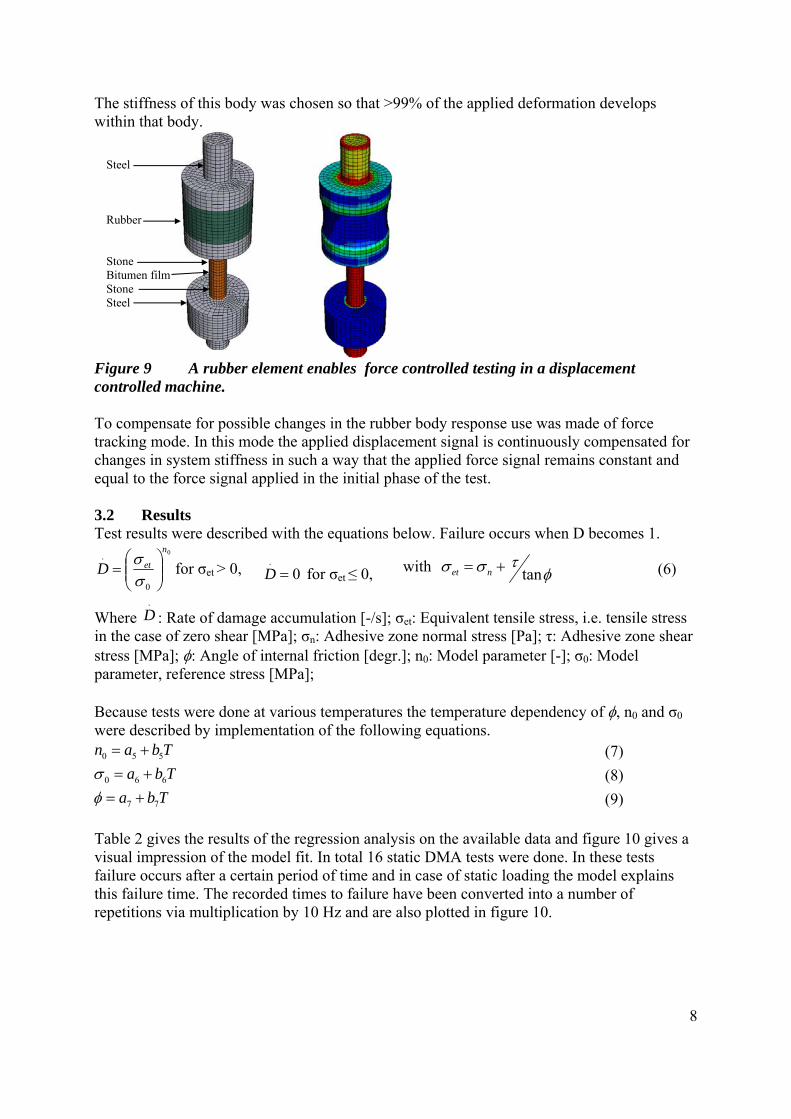
Figure 8 Typical result of a dynamic DSR adhesive zone shear fatigue test. The moment of failure is indicated by arrows. It is important to make notice of the previous. In PA adhesive zones are subjected to a combination of shear and normal stress, hence the combination of DSR shear and DMA tension tests. Also the stress signals to which the adhesive zones are subjected differ much from sinusoidal. This is a result of the complex mixture geometry in combination with the complex load signals applied by passing tyres. To ensure that the model is applicable in situation where the load signals vary much from pure sinusoidal the research program considers both static and dynamic tests, figure 7. All tests have been done in stress-controlled mode. The main reason for this is the limited thickness of the adhesive zone. Although the DSR in which the specimens are prepared may be steered to obtain a 15 μm bitumen layer, the actual thickness cannot be measured. Thus uncertainties about layer thickness exist. Secondly definition of thickness in itself is a problem since the thickness of the bitumen film in is in the order of magnitude of stone morphology. The above mentioned remarks with respect to thickness imply that strains cannot be defined. Also it was anticipated that displacement controlled test will be very difficult to interpret because the uncertainties with respect to bitumen film thickness imply that the system stiffness may vary from specimen to specimen. The DMA machines used in the LOT research cannot operate in force controlled mode dynamically. To enable the execution of force controlled tests in a displacement controlled machine a highly deformable element was added to the system. The idea is that this highly deformable element may be subjected to a certain signal in displacement controlled mode. Since most deformation by far occurs in the deformable body the applied force signal remains constant throughout the tests provided that the characteristics of the deformable body do not change. The principle of the deformable body was tested in advance by application of FE-modelling, see figure 9. It was decided to make a rubber element, see 3rd photo from the left in figure 6.
7
The stiffness of this body was chosen so that >99% of the applied deformation develops within that body.
Steel Rubber Stone Bitumen film Stone Steel
Figure 9 A rubber element enables force controlled testing in a displacement controlled machine. To compensate for possible changes in the rubber body response use was made of force tracking mode. In this mode the applied displacement signal is continuously compensated for changes in system stiffness in such a way that the applied force signal remains constant and equal to the force signal applied in the initial phase of the test. 3.2 Results Test results were described with the equations below. Failure occurs when D becomes 1.
0
0
.n
etD ⎟⎟⎠
⎞⎜⎜⎝
⎛=
σσ for σet > 0, 0
.=D for σet ≤ 0, with φ
τσσ tan+= net (6)
Where : Rate of damage accumulation [-/s]; σ.
D et: Equivalent tensile stress, i.e. tensile stress in the case of zero shear [MPa]; σn: Adhesive zone normal stress [Pa]; τ: Adhesive zone shear stress [MPa]; φ: Angle of internal friction [degr.]; n0: Model parameter [-]; σ0: Model parameter, reference stress [MPa]; Because tests were done at various temperatures the temperature dependency of φ, n0 and σ0 were described by implementation of the following equations.
0 5 5n a b T= + (7)
0 6 6a b Tσ = + (8)
7 7a b Tφ = + (9) Table 2 gives the results of the regression analysis on the available data and figure 10 gives a visual impression of the model fit. In total 16 static DMA tests were done. In these tests failure occurs after a certain period of time and in case of static loading the model explains this failure time. The recorded times to failure have been converted into a number of repetitions via multiplication by 10 Hz and are also plotted in figure 10.
8
2
2.5
3
3.5
4
4.5
5
5.5
6
6.5
7
2 2.5 3 3.5 4 4.5 5 5.5 6 6.5 7
Log N-measured
Log
N-m
mod
elle
dBS+V BS+ABS+V+W BS+A+WGS+V GS+AGS+V+W GS+A+W
BS STA BS STA+R GS STA GS STA+R
BS LTA BS LTA+R GS LTA GS LTA+R
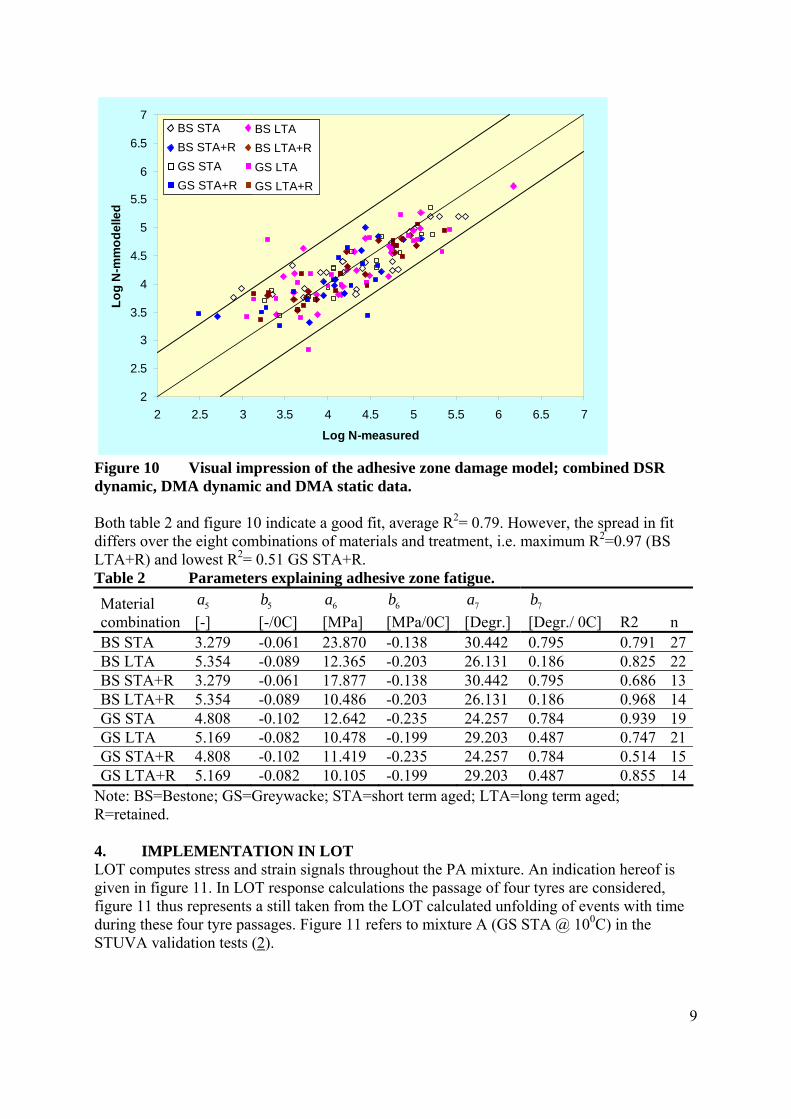
Figure 10 Visual impression of the adhesive zone damage model; combined DSR dynamic, DMA dynamic and DMA static data. Both table 2 and figure 10 indicate a good fit, average R2= 0.79. However, the spread in fit differs over the eight combinations of materials and treatment, i.e. maximum R2=0.97 (BS LTA+R) and lowest R2= 0.51 GS STA+R. Table 2 Parameters explaining adhesive zone fatigue. Material combination
5a [-]
5b [-/0C]
6a [MPa]
6b [MPa/0C]
7a [Degr.]
7b [Degr./ 0C] R2 n
BS STA 3.279 -0.061 23.870 -0.138 30.442 0.795 0.791 27BS LTA 5.354 -0.089 12.365 -0.203 26.131 0.186 0.825 22BS STA+R 3.279 -0.061 17.877 -0.138 30.442 0.795 0.686 13BS LTA+R 5.354 -0.089 10.486 -0.203 26.131 0.186 0.968 14GS STA 4.808 -0.102 12.642 -0.235 24.257 0.784 0.939 19GS LTA 5.169 -0.082 10.478 -0.199 29.203 0.487 0.747 21GS STA+R 4.808 -0.102 11.419 -0.235 24.257 0.784 0.514 15GS LTA+R 5.169 -0.082 10.105 -0.199 29.203 0.487 0.855 14
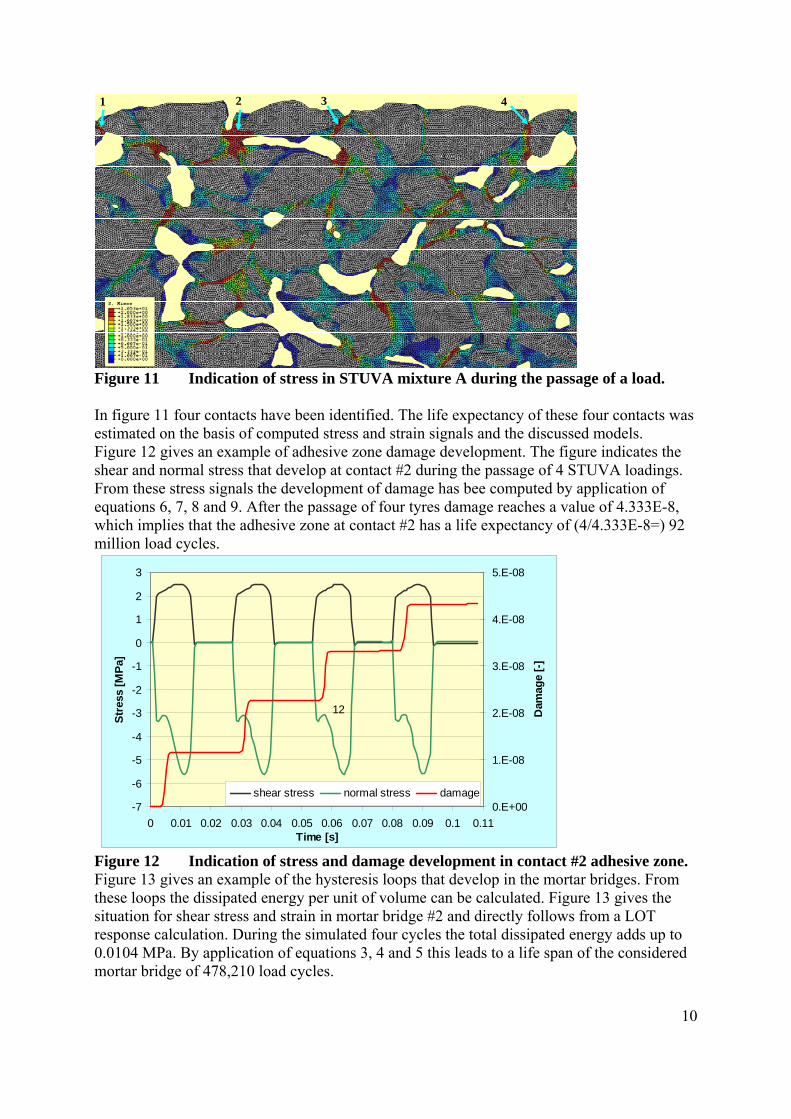
Note: BS=Bestone; GS=Greywacke; STA=short term aged; LTA=long term aged; R=retained. 4. IMPLEMENTATION IN LOT LOT computes stress and strain signals throughout the PA mixture. An indication hereof is given in figure 11. In LOT response calculations the passage of four tyres are considered, figure 11 thus represents a still taken from the LOT calculated unfolding of events with time during these four tyre passages. Figure 11 refers to mixture A (GS STA @ 100C) in the STUVA validation tests (2).
9
1 2 3 4
Figure 11 Indication of stress in STUVA mixture A during the passage of a load. In figure 11 four contacts have been identified. The life expectancy of these four contacts was estimated on the basis of computed stress and strain signals and the discussed models. Figure 12 gives an example of adhesive zone damage development. The figure indicates the shear and normal stress that develop at contact #2 during the passage of 4 STUVA loadings. From these stress signals the development of damage has bee computed by application of equations 6, 7, 8 and 9. After the passage of four tyres damage reaches a value of 4.333E-8, which implies that the adhesive zone at contact #2 has a life expectancy of (4/4.333E-8=) 92 million load cycles.
-7
-6
-5
-4
-3
-2
-1
0
1
2
3
0 0.01 0.02 0.03 0.04 0.05 0.06 0.07 0.08 0.09 0.1 0.11Time [s]
Stre
ss [M
Pa]
0.E+00
1.E-08
2.E-08
3.E-08
4.E-08
5.E-08
Dam
age
[-]
shear stress normal stress damage
12
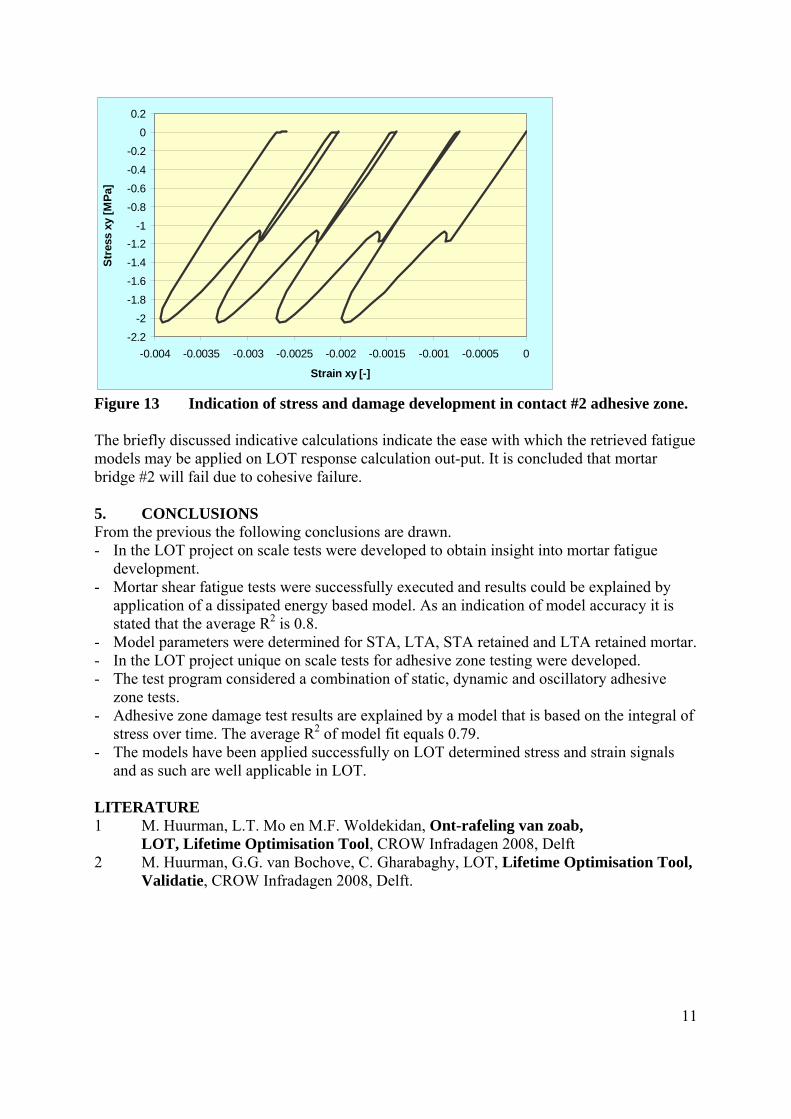
Figure 12 Indication of stress and damage development in contact #2 adhesive zone. Figure 13 gives an example of the hysteresis loops that develop in the mortar bridges. From these loops the dissipated energy per unit of volume can be calculated. Figure 13 gives the situation for shear stress and strain in mortar bridge #2 and directly follows from a LOT response calculation. During the simulated four cycles the total dissipated energy adds up to 0.0104 MPa. By application of equations 3, 4 and 5 this leads to a life span of the considered mortar bridge of 478,210 load cycles.
10
-2.2
-2
-1.8
-1.6
-1.4
-1.2-1
-0.8
-0.6
-0.4
-0.2
0
0.2
-0.004 -0.0035 -0.003 -0.0025 -0.002 -0.0015 -0.001 -0.0005 0
Strain xy [-]
Stre
ss x
y [M
Pa]
Figure 13 Indication of stress and damage development in contact #2 adhesive zone. The briefly discussed indicative calculations indicate the ease with which the retrieved fatigue models may be applied on LOT response calculation out-put. It is concluded that mortar bridge #2 will fail due to cohesive failure. 5. CONCLUSIONS From the previous the following conclusions are drawn. - In the LOT project on scale tests were developed to obtain insight into mortar fatigue
development. - Mortar shear fatigue tests were successfully executed and results could be explained by
application of a dissipated energy based model. As an indication of model accuracy it is stated that the average R2 is 0.8.
- Model parameters were determined for STA, LTA, STA retained and LTA retained mortar. - In the LOT project unique on scale tests for adhesive zone testing were developed. - The test program considered a combination of static, dynamic and oscillatory adhesive
zone tests. - Adhesive zone damage test results are explained by a model that is based on the integral of
stress over time. The average R2 of model fit equals 0.79. - The models have been applied successfully on LOT determined stress and strain signals
and as such are well applicable in LOT. LITERATURE 1 M. Huurman, L.T. Mo en M.F. Woldekidan, Ont-rafeling van zoab,
LOT, Lifetime Optimisation Tool, CROW Infradagen 2008, Delft 2 M. Huurman, G.G. van Bochove, C. Gharabaghy, LOT, Lifetime Optimisation Tool, Validatie, CROW Infradagen 2008, Delft.
11