Embed Size (px)
Citation preview
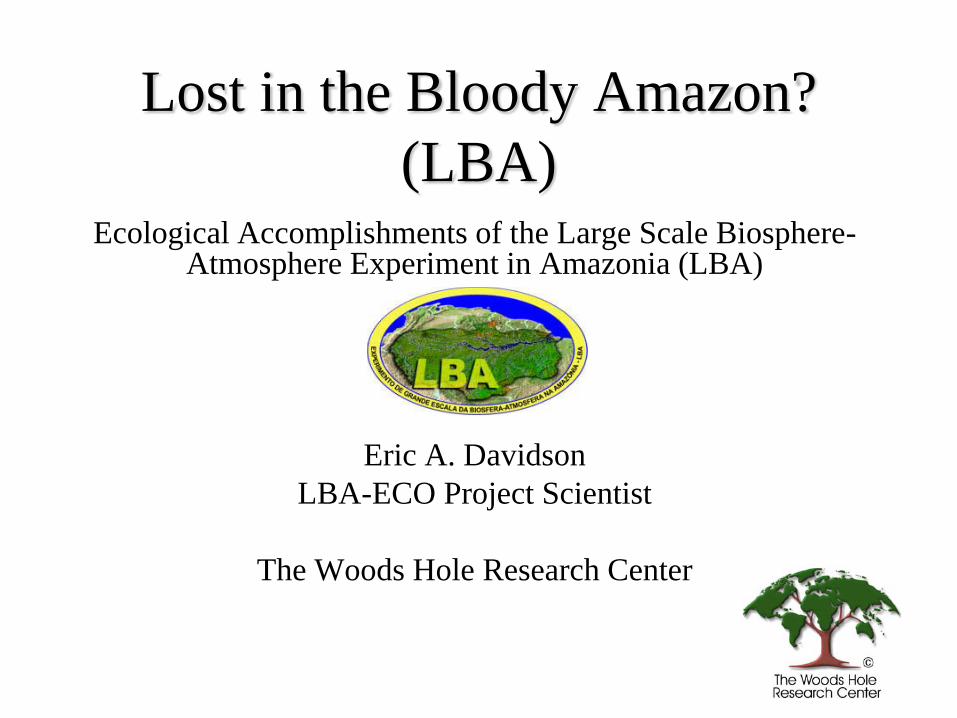
Ecological Accomplishments of the Large Scale Biosphere-Atmosphere Experiment in Amazonia (LBA)
Eric A. DavidsonLBA-ECO Project Scientist
The Woods Hole Research Center
Lost in the Bloody Amazon?(LBA)
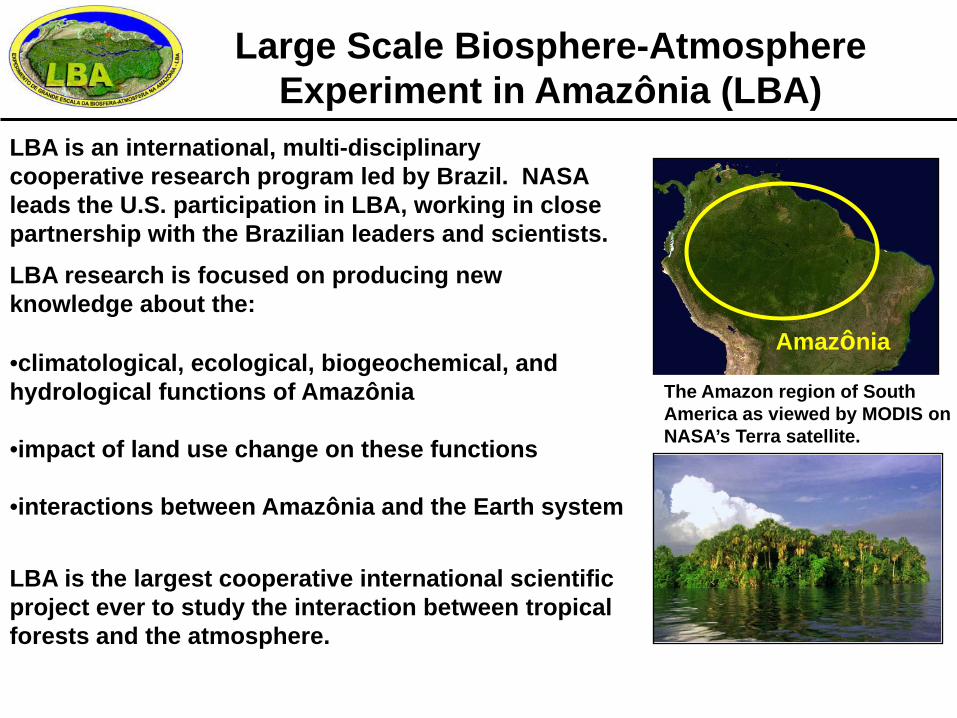
Large Scale Biosphere-Atmosphere Experiment in Amazônia (LBA)
Amazônia
The Amazon region of South America as viewed by MODIS on NASA’s Terra satellite.
LBA is an international, multi-disciplinary cooperative research program led by Brazil. NASA leads the U.S. participation in LBA, working in close partnership with the Brazilian leaders and scientists.
LBA is the largest cooperative international scientific project ever to study the interaction between tropical forests and the atmosphere.
•climatological, ecological, biogeochemical, and hydrological functions of Amazônia
•impact of land use change on these functions
•interactions between Amazônia and the Earth system
LBA research is focused on producing new knowledge about the:
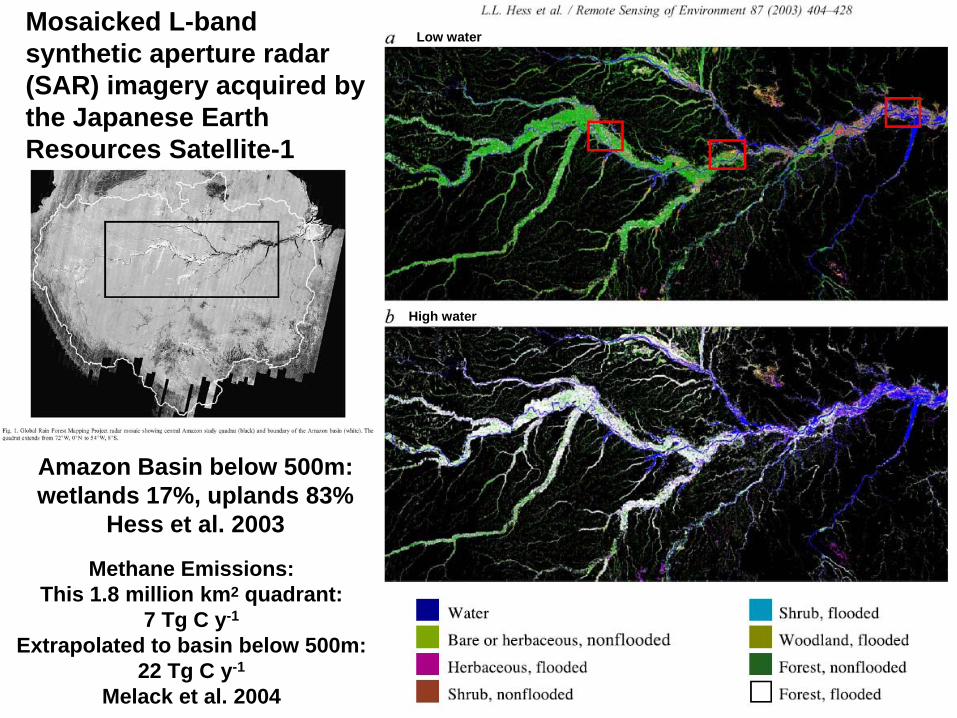
Low water
High water
Amazon Basin below 500m: wetlands 17%, uplands 83%
Hess et al. 2003
Methane Emissions:This 1.8 million km2 quadrant:
7 Tg C y-1
Extrapolated to basin below 500m: 22 Tg C y-1
Melack et al. 2004
Mosaicked L-band synthetic aperture radar (SAR) imagery acquired by the Japanese Earth Resources Satellite-1
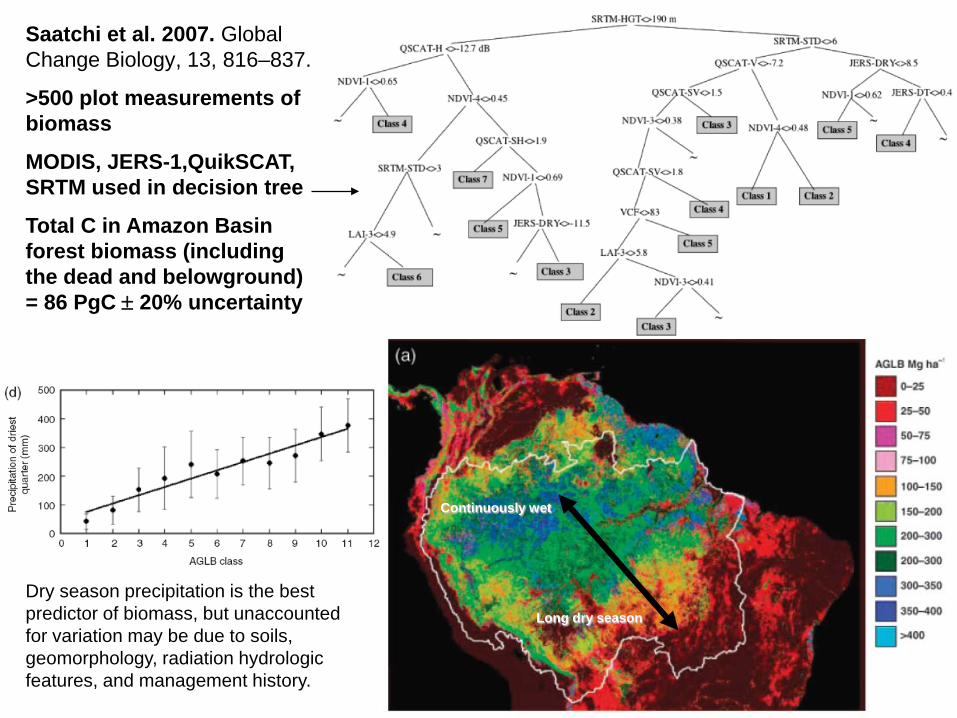
Saatchi et al. 2007. Global Change Biology, 13, 816–837.
>500 plot measurements of biomass
MODIS, JERS-1,QuikSCAT, SRTM used in decision tree
Total C in Amazon Basin forest biomass (including the dead and belowground) = 86 PgC ± 20% uncertainty
Dry season precipitation is the best predictor of biomass, but unaccounted for variation may be due to soils, geomorphology, radiation hydrologic features, and management history.
Continuously wet
Long dry season
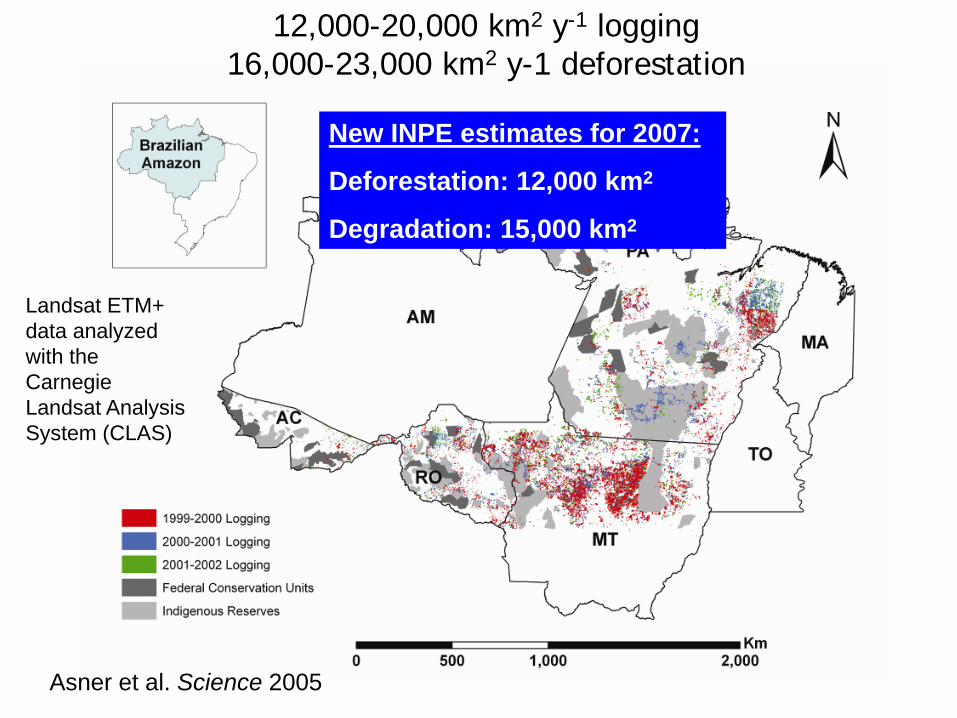
12,000-20,000 km2 y-1 logging16,000-23,000 km2 y-1 deforestation
Asner et al. Science 2005
Landsat ETM+ data analyzed with the Carnegie Landsat Analysis System (CLAS)
New INPE estimates for 2007:
Deforestation: 12,000 km2
Degradation: 15,000 km2
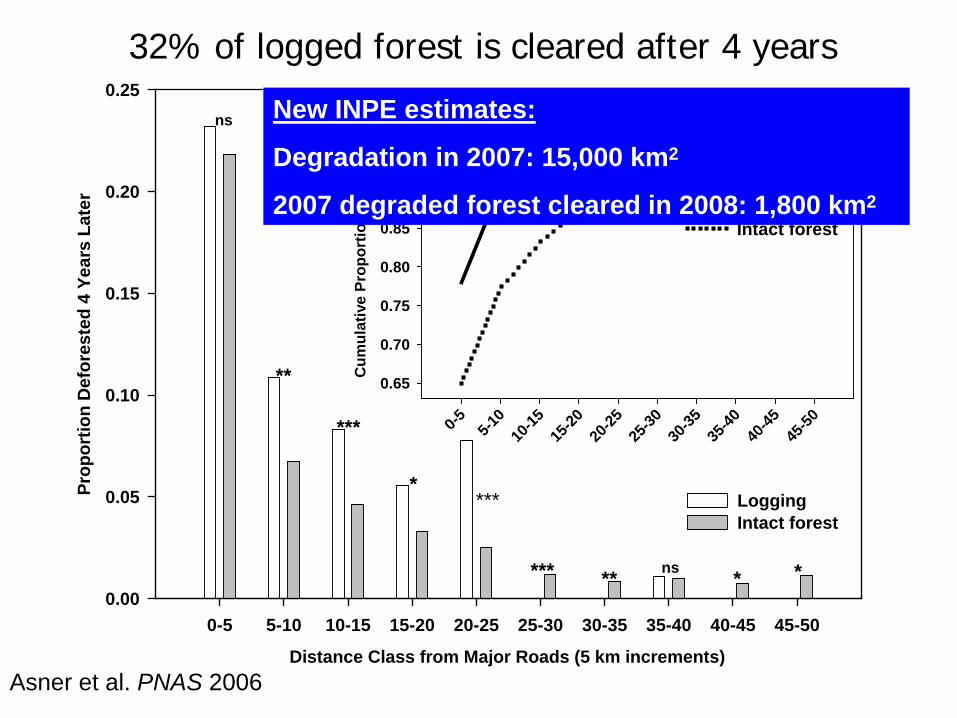
Distance Class from Major Roads (5 km increments)
0-5 5-10 10-15 15-20 20-25 25-30 30-35 35-40 40-45 45-50
Prop
ortio
n D
efor
este
d 4
Year
s La
ter
0.00
0.05
0.10
0.15
0.20
0.25ns
**
***
****
*** ** ns * *
0-5 5-10
10-15
15-20
20-25
25-30
30-35
35-40
40-45
45-50
Cum
ulat
ive
Prop
ortio
n of
Tot
al A
rea
0.65
0.70
0.75
0.80
0.85
0.90
0.95
1.00
Logging Intact forest
Logging Intact forest
Asner et al. PNAS 2006
32% of logged forest is cleared after 4 years
New INPE estimates:
Degradation in 2007: 15,000 km2
2007 degraded forest cleared in 2008: 1,800 km2
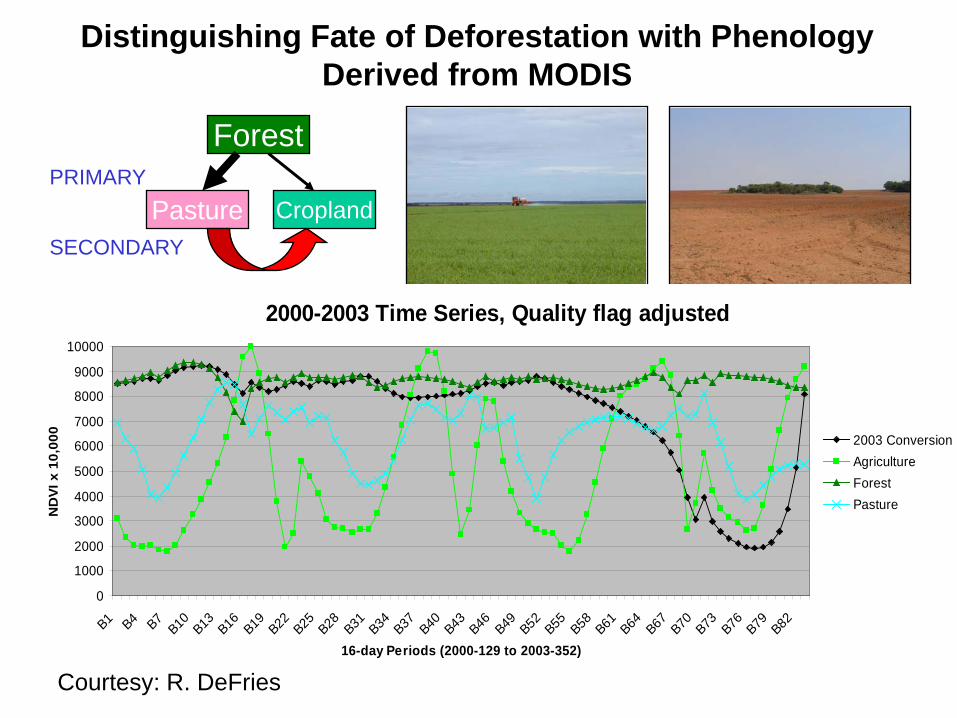
Distinguishing Fate of Deforestation with Phenology Derived from MODIS
Forest
Pasture CroplandPRIMARY
SECONDARY
2000-2003 Time Series, Quality flag adjusted
0
1000
2000
3000
4000
5000
6000
7000
8000
9000
10000
B1 B4 B7B10 B13 B16 B19 B22 B25 B28 B31 B34 B37 B40 B43 B46 B49 B52 B55 B58 B61 B64 B67 B70 B73 B76 B79 B82
16-day Periods (2000-129 to 2003-352)
ND
VI x
10,
000
2003 ConversionAgricultureForestPasture
Courtesy: R. DeFries
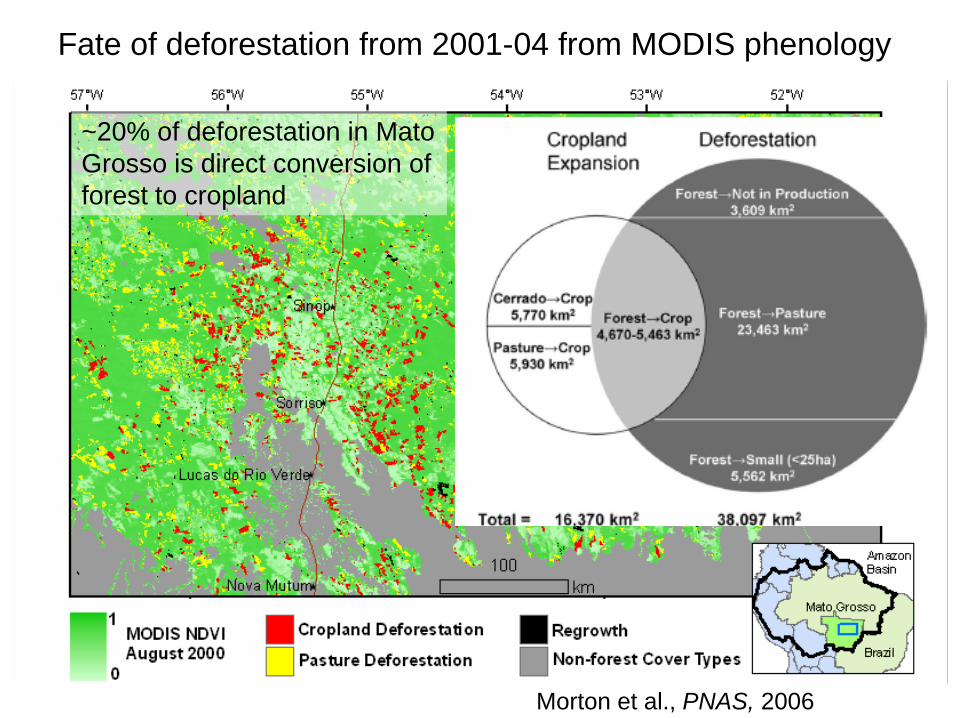
Morton et al., PNAS, 2006
Fate of deforestation from 2001-04 from MODIS phenology
~20% of deforestation in Mato Grosso is direct conversion of forest to cropland
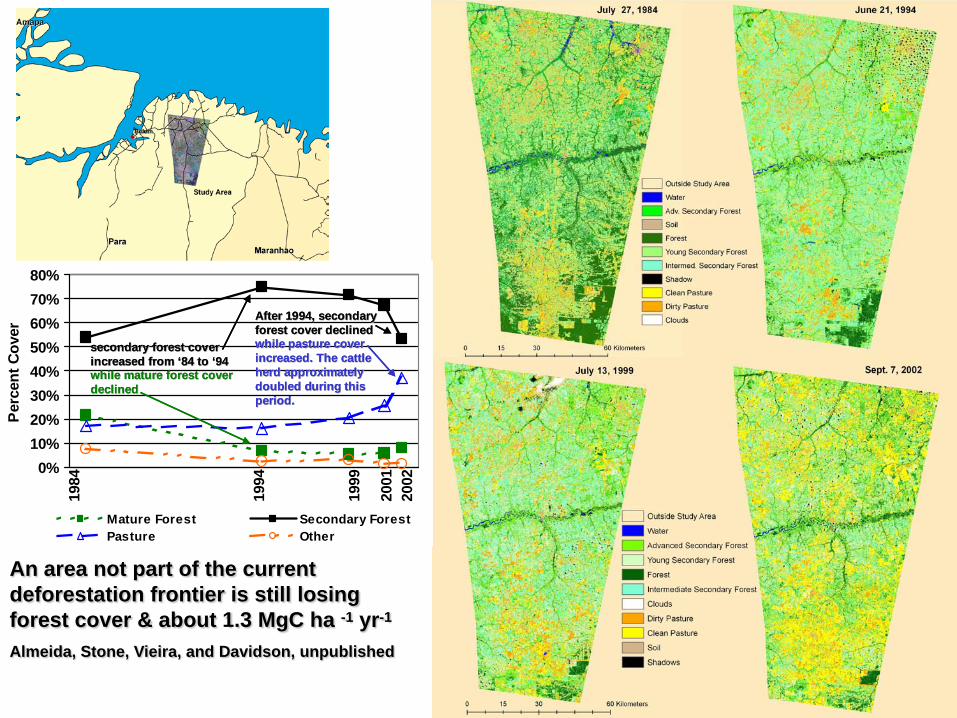
0%10%20%30%40%50%60%70%80%
Perc
ent C
over
Mature Forest Secondary ForestPasture Other
1984
2001
1999
1994
2002
secondary forest cover secondary forest cover increased from ‘84 to ‘94 increased from ‘84 to ‘94 while mature forest cover while mature forest cover declined declined
After 1994, secondary After 1994, secondary forest cover declined forest cover declined while pasture cover while pasture cover increased. The cattle increased. The cattle herd approximately herd approximately doubled during this doubled during this period.period.
0%10%20%30%40%50%60%70%80%
Perc
ent C
over
Mature Forest Secondary ForestPasture Other
1984
2001
1999
1994
2002
secondary forest cover secondary forest cover increased from ‘84 to ‘94 increased from ‘84 to ‘94 while mature forest cover while mature forest cover declined declined
secondary forest cover secondary forest cover increased from ‘84 to ‘94 increased from ‘84 to ‘94 while mature forest cover while mature forest cover declined declined
After 1994, secondary After 1994, secondary forest cover declined forest cover declined while pasture cover while pasture cover increased. The cattle increased. The cattle herd approximately herd approximately doubled during this doubled during this period.period.
After 1994, secondary After 1994, secondary forest cover declined forest cover declined while pasture cover while pasture cover increased. The cattle increased. The cattle herd approximately herd approximately doubled during this doubled during this period.period.
An area not part of the current deforestation frontier is still losing forest cover & about 1.3 MgC ha -1 yr-1
Almeida, Stone, Vieira, and Davidson, unpublished
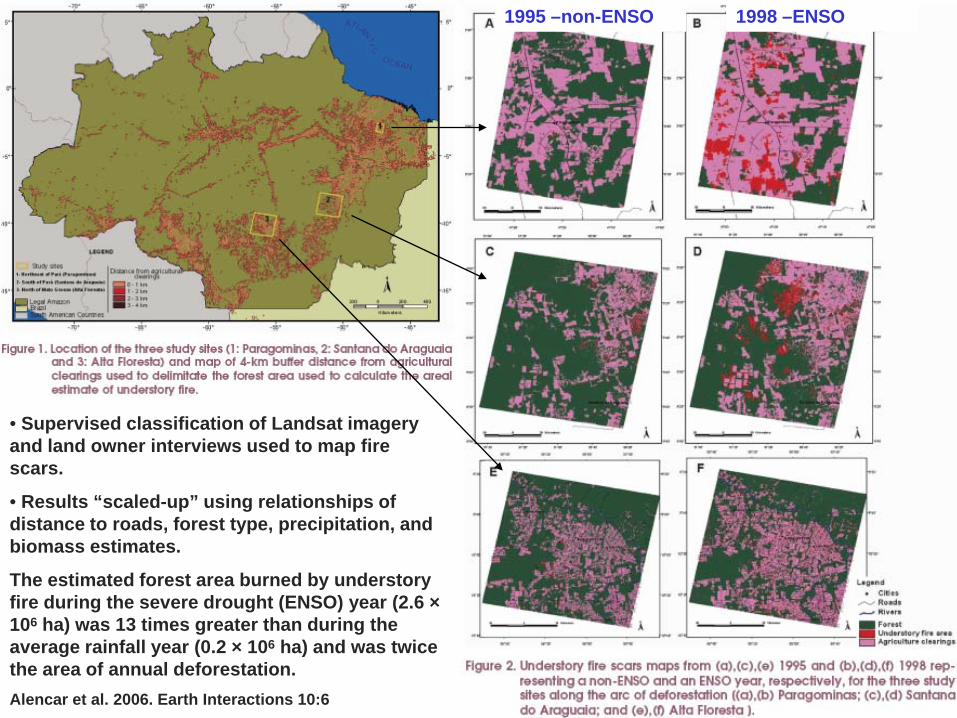
1995 –non-ENSO 1998 –ENSO
• Supervised classification of Landsat imagery and land owner interviews used to map fire scars.
• Results “scaled-up” using relationships of distance to roads, forest type, precipitation, and biomass estimates.
The estimated forest area burned by understory fire during the severe drought (ENSO) year (2.6 ×10⁶ ha) was 13 times greater than during the average rainfall year (0.2 × 10⁶ ha) and was twice the area of annual deforestation.Alencar et al. 2006. Earth Interactions 10:6
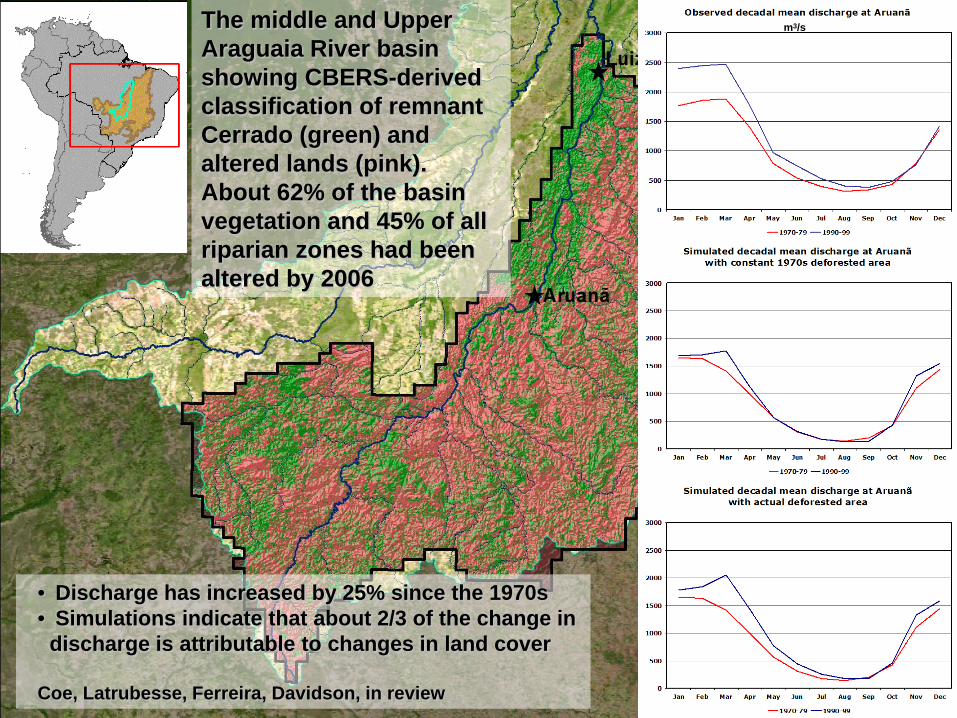
The middle and Upper Araguaia River basin showing CBERS-derived classification of remnant Cerrado (green) and altered lands (pink). About 62% of the basin vegetation and 45% of all riparian zones had been altered by 2006
• Discharge has increased by 25% since the 1970s• Simulations indicate that about 2/3 of the change in
discharge is attributable to changes in land cover
Coe, Latrubesse, Ferreira, Davidson, in review
m3/s
Topics covered here:
Wetland cover
Forest cover
Logging
Fire
Conversion to cropland
Conversion to pasture
Hydrologic consequences
Topics not covered include the consequences of the LCLUC on:
Local, regional, and global climate
Carbon and nutrient cycles
Biodiversity
Economic activity and human dimensions