Embed Size (px)
DESCRIPTION
los simulation
Citation preview
Document Title Security Level:
LOS simulation using 3D Digital Maps—
Techniques and Risks
Syed Masroor Hassan 00725060
Abstract : Line-of-Sight (LOS) survey is an integral part of Microwave Link
designing. Different techniques are used for evaluating LOS for Microwave link design.
LOS can be checked by physical methods as well as by the help of simulation. This
document is focused on the LOS simulation. Detail of physical survey is beyond the
scope of this document. This document provides basic overview to the reader about
different simulation techniques and also covers various risks which need to be
considered before hardware implementation when using these simulation methods for
LOS evaluation.
Keywords: LOS simulation, Line of sight survey, 3D digital maps
Background
Purpose of this document is to provide basic overview of different LoS simulation
techniques and make people aware of potential risks which must be analyzed before
hardware implementation.
In 2010 Huawei have purchased 3D digital map for the LOS evaluation. Initially, these
maps were purchased for only one major city K in country P for trial purposes. Main
objective of purchasing these digital maps is to eliminate the requirement of physical
LOS surveys on which Huawei spends considerable amount and time every year.
There are some facts and figures about these digital maps which I think are worth
mentioning here:
The error of LOS simulation is 3 meter.
3D satellite images have 1m or 2.5m resolution.
2023-04-28 HUAWEI Confidential Page1, Total7

Document Title Security Level:
The price of 2.5m resolution satellite image is XX USD / sq.km.
The price of 1m resolution satellite image is 20 times more than 2.5m
resolution maps..
LOS or line of sight surveys are the most important part of MW link design. Without
proper LOS evaluation point-to-point microwave link installation is not possible.
Normally LOS is conducted in the series of steps in-order to establish the link between
two locations. There are two types of LOS evaluation:
1- Physical LOS
2- LOS using simulation tools
Details of physical LoS is beyond the scope of this document. However, LOS simulation
methods will be discussed in the later parts.
Problem : LOS Simulation in Fast growing Cities
These digital maps are expensive and if we want to update these maps then we have to
purchase the maps again. Therefore frequent updates of these maps are note viable. In
City X a microwave SDH link was planned in Dec 2010. Transmission design engineer
have sent the Link details to Huawei HQ for the LoS simulation. He had also check the
obstacle by using conventional satellite images. As per LoS simulation results and
satellite images line of sight was clear but there was an building which was under-
construction however as the area around that building consists of houses which are
rarely have floors more than 3 stories therefore no one have idea that this under-
construction building may obstruct the line of sight by looking at the simulation results
unless a team physically visit the construction site and ask the construction team. Later-
on implementation team went for the installation and reported the LOS issue.
Precautionary measures in-order to avoid such situations needs to be considered which
have been analyzed in later sections in detail.
Analysis, Strategies and Actions
Microwave link designers use different tools in-order to simulate line of site between two
2023-04-28 HUAWEI Confidential Page2, Total7

Document Title Security Level:
ends, such as:
1- Terrain database tools (Pathloss, Global Mapper etc,)
2- Satellite images (e.g., Google earth)
3- 3D Digital Maps
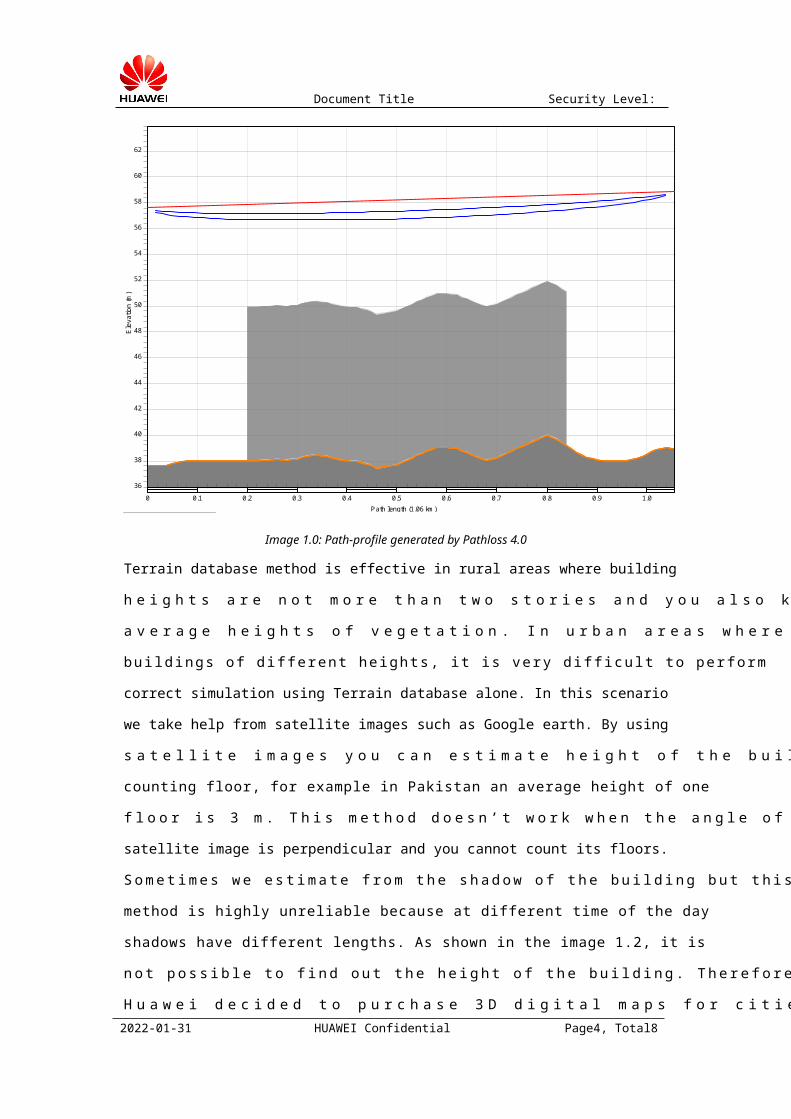
Different tools such as Pathloss or global Mappers utilize terrain databases in order to
show the line of sight clearance. Image 1.0 shows the example of Path profile
generated by Pathloss 4.0. This profile shows the terrain information between two sites
only and we need to insert objects above terrain such as building and trees manually.
For example: in the snapshot below an average building height have been inserted
manually. In this example minimum heights worked out to be 15m at both ends but we
have set the transmission height of 20m for safe side.
May 11 11
9014Latitude 24 56 06.54 NLongitude 067 05 59.50 EAzimuth 207.04°Elevation 38 m ASLAntenna CL 20.0 m AGL
Rim Jhim HallLatitude 24 55 36.00 NLongitude 067 05 42.40 EAzimuth 27.04°Elevation 39 m ASLAntenna CL 20.0 m AGL
Frequency (MHz) = 38000.0K = 1.33, 0.67
%F1 = 100.00, 60.00
Path length (1.06 km)0 0.1 0.2 0.3 0.4 0.5 0.6 0.7 0.8 0.9 1.0
Ele
vatio
n (m
)
36
38
40
42
44
46
48
50
52
54
56
58
60
62
Image 1.0: Path-profile generated by Pathloss 4.0
Terrain database method is effective in rural areas where building heights are not more
than two stories and you also know the average heights of vegetation. In urban areas
where you have buildings of different heights, it is very difficult to perform correct
simulation using Terrain database alone. In this scenario we take help from satellite
2023-04-28 HUAWEI Confidential Page3, Total7
Document Title Security Level:
images such as Google earth. By using satellite images you can estimate height of the
buildings by counting floor, for example in Pakistan an average height of one floor is 3
m. This method doesn’t work when the angle of the satellite image is perpendicular and
you cannot count its floors. Sometimes we estimate from the shadow of the building but
this method is highly unreliable because at different time of the day shadows have
different lengths. As shown in the image 1.2, it is not possible to find out the height of
the building. Therefore Huawei decided to purchase 3D digital maps for cities. These
digital maps are amazing and very useful for rapid deployment of the microwave
network, where physical LOS requires too much time and old simulation methods are
difficult to manipulate or in other words not so accurate. These digital maps were placed
at the centralized locations due to high system requirements. Expert resources were
dedicated in-order to facilitate queries for LOS simulation from around various parts of
the world.
Image 1.2: Example Image taken from Google earth
These 3 dimensional digital maps contain thorough information of Buildings and
2023-04-28 HUAWEI Confidential Page4, Total7

Document Title Security Level:
vegetations height above terrain (HAT). That means you don’t have to insert obstacle
heights manually.
Path-profile shown in the image below have been generated for Pathloss by using
digital maps and it is showing heights of the obstacles which are present between two
sites.
May 11 11
1017ALatitude 24 55 36.00 NLongitude 067 05 42.40 EAzimuth 27.04°Elevation 57 m ASLAntenna CL 5.0 m AGL
9014ALatitude 24 56 06.54 NLongitude 067 05 59.50 EAzimuth 207.04°Elevation 36 m ASLAntenna CL 15.0 m AGL
Frequency (MHz) = 18000.0K = 1.33
%F1 = 100.00
Path length (1.06 km)0 0.1 0.2 0.3 0.4 0.5 0.6 0.7 0.8 0.9 1.0
Ele
vatio
n (m
)
32
34
36
38
40
42
44
46
48
50
52
54
56
58
60
62
64
66
Image1.3: Path-profile generated using digital maps data
Although this method is more reliable than its predecessor but we have to be care-full
for few things, such as tower height which we usually use is measured above ground
level but if the tower is a rooftop tower than in this method we have to use the actual
structure height instead because it also include the building height in the profile where
the tower is installed.
Strengths and weakness of LOS simulation using digital maps:
Strengths:
1- Fast evaluation
2- Useful for high level topology planning
2023-04-28 HUAWEI Confidential Page5, Total7

Document Title Security Level:
3- Less amount of changes required at the time of low level network plan
4- Economical
5- Less time consuming
Weaknesses:
1- These Maps are static just like Google earth
2- We have to purchase Maps again in-case re-evaluation is required
3- Cannot be used in the area where construction of buildings is expected
4- Does not include advertising board installed on top of the building
Result
In city X, construction period of building is very short, usual time of construction of grey
structure of 8 floor building is approximately one month. This is the big problem where
we want large deployment of transmission network. Therefore we have to be extra
careful while planning a microwave point to point link because these digital maps are
static and periodic update costs a lot of dollars.
In the subjected case when team went for the installation it found that there is a building
just across the road which is under-construction and in the middle of the line of sight
reaching height of 8 stories as shown in the LOS picture shown in the image 1.4.
Image 1.4: LOS picture taken
2023-04-28 HUAWEI Confidential Page6, Total7

Document Title Security Level:
In this Case LOS issue was captured before the installation started therefore
dismantling therefore re-installation was not required. We only arranged the physical
LOS survey with the different far-end and completed the installation.
In such case where LOS issue would have been reported after the hardware installation
we have to go with the dismantling and re-installation and this will result in the loss of
time and capital.
Suggestion or Review
Do not rely entirely on simulation results especially for important links such as links
belong to SDH rings. Simulation results can be used for the rapid high level
transmission network planning but when preparing the actual installation it is strongly
recommended to check the path physically. In some cases where link installation is
extremely urgent and you have no time to arrange physical Line of Sight surveys you
have to be extra careful and if there is any empty plot or under-construction building is
falling in the path you should arrange physical visit.
2023-04-28 HUAWEI Confidential Page7, Total7