Embed Size (px)
Citation preview

Towards Generating 3D Hiking Route Maps
Wesley Willett
Abstract— We describe the initial efforts towards developing a system for automatically generating oblique 3D overviews of hiking trails. Given a GPS path, the system is intended to automatically return a printable map with an appropriately chosen viewpoint and vertical distortion. We discuss general design implications for 3D maps and map-related representations, address specific applications to this task, and provide an overview of our initial prototype. Future work, including thoughts on potential methods of evaluating our system in particular and the efficacy of 3D oblique maps for general navigation in mountainous terrain.
Index Terms—Cartography, Navigation, Viewpoint Selection, Optimization.
1 INTRODUCTION When navigating using a map, hikers in mountainous terrain
must make judgments about relative direction, cardinal direction, grade, distance, elevation, roughness, and terrain type in order to help correlate locations in the real world (including their own) with locations on the map.
Plan-view topographic maps (Figure 2) provide this information, but even advanced users can have a hard time visualizing the 3D geometry of the depicted terrain based on them. 3D obliques (most are not technically maps, but rather “map-related representations”[5] although we use the term “3D maps” here as shorthand) provide a more immediate link between the real world and the map and can facilitate easier perception of relative grade, elevation and terrain roughness. However these maps generally introduce occlusions and sacrifice accurate distance and angular measurements.
In general, resolving issues like occlusion and inconsistent distance measurements in printed 3D maps is difficult. However, given a constraint - a specific route or set of routes, for example - we propose to generate maps (like the shown in Figure 1) that preserve relevant information, prevent occlusions, and provide hikers with easier access to important information about elevation, grade, and the shape of the local terrain.
In doing this, we’ve been inspired by the hand-drawn route maps (Figure 2) and traced photos (Figure 2) that often accompany trail guides as well as by more elaborate illustrations of mountainous terrain such as the panorama maps of H.C. Berann. Anecdotally, we have observed that illustrated obliques, when used on the trail or before an excursion, prompt a much quicker recognition of the relationship between the route and the surrounding terrain than a traditional topo. These maps often strip away much of the extraneous detail which a topographic map might provide, offering a quick impression of the topography. Berann’s highly-distorted and stylized representations of mountainous terrain, on the other hand, actually tend to add information not found in conventional maps. Images like the map of Mt. Everest seen at right (Figure 3) include lavish detail on the mountainsides themselves and also (more controversially) exaggerate, reposition, and even rotate portions of the terrain to create more engaging, clear, recognizable views. [17]
While these kinds of maps have all traditionally been created manually, this no longer needs to be the case. Route data for hiking, biking, and mountaineering trails across the globe is now readily available via online services such as MotionBased [15], as is the elevation data, satellite imagery, and other geospatial data needed to compose these maps. Given a manually generated or GPS-produced route file, we intend to automatically generate printable 3D overview maps for hikers, bikers, and other outdoor enthusiasts.
Figure 1. Mockup of a printed map created using our system.
Figure 2. Sketched oblique abstracted route map from a guide.[?]
Figure 1. Heinrich Berann's hand-painted view of Everest.[?]
• Wesley Willett is with UC Berkeley, E-Mail: [email protected].
2 RELATED WORK In order for 3D maps to be useful as a navigation or overview
tool, we must be reasonably certain that users are actually able to distill relevant information from them. Perception of 3D maps has been quantitatively assessed to some degree, and a considerable amount of work indicates that viewers are capable of making reasonable judgments based on them. In a large-scale study, Knowles [10] found that viewers consistently made accurate assessments of relative elevation and distance on 3D statistical surfaces across a variety of viewing angles and fields of view. Kraak, in a study of 3D thematic maps found participants similarly able to make reasonable relative judgements [11]. Our work leverages these results as well as other related perceptual findings (covered in Design Considerations).
In considering the design of our specific class of 3D mountain maps, we draw on work that describes and documents techniques for viewing and rendering. Häberling supplies design considerations for 3D mountain maps, drawn from a detailed survey of professional cartographers. [6] Similarly, Patterson details practical techniques, for layout, view selection, and manual terrain distortion utilized by the US National Park Service when creating 3D guide maps [18].
Existing software tools exist for taking GPS data and mapping it. Most GPS manufacturers ship a product with their devices capable of downloading data from the unit and plotting it on a map. Web-based tools such as GPS Visualizer[4] are capable of automatically generating 2D maps of an area based on a single GPS track. Most of these tools, however, are targeted users plotting their own data and few provide for the generation of printable maps for trail use.
Additionally, 3D digital globe applications such as Google Earth[] allow GPS tracks to be visualized in a 3D environment. The popularity of Google Earth and it’s XML-based file format for plotting tracks and points means that most GPS track repositories and mapping sites now allow users to view their tracks using the application. However, Google Earth (and other similar applications such as NASA World Wind) are designed for interactive exploration of geographic data in their 3D environment and aren’t well suited for producing paper maps for use in the wild. 3D Geospatial Information Systems (GIS) products like ArcView 3D analyst [2] are better suited for producing these sorts of 3D maps, but are not accessible to non-professionals. Current tools do not generally support the automatic selection of viewpoints or complex terrain distortion and manipulation.
Systems for applying targeted distortions to maps have also been developed. Takahasi et al, have developed a system for manually
applying distortions to terrain to reduce occlusions and ambiguities when constructing guide maps [23] as well as an automated system [24] that dynamically warps terrain to reduce path occlusions for automobile navigation systems. We include this sort of targeted terrain distortion such in our design considerations and our future work anticipates applying a similar technique to the problem at hand.
3 DESIGN CONSIDERATIONS When considering the automated design of oblique mountain
maps, we must consider the pros and cons of this representing routes and terrains in this fashion. We also examine a number of specific design considerations that must be taken into account in the design of our system.
3.1 Usefulness of 3D obliques The primary benefit of using 3D obliques, particularly as a
novice, stems from the fact that they represent 3D terrain in a way that much more closely mirrors our view of those same features in the real world, and that allows us to use cues like occlusion, shading, and silhouettes to help discern 3D objects. While reading a plan view topographic map involves converting the 2D view from an uncommon viewpoint into a 3D mental representation, interpreting the geometry of a 3D oblique requires much less extrapolation. According to Petrovic, “[3D Maps] offer users direct recognition of contents”.[19]
Moreover, while 3D perspective projections, by their nature, introduce distortions that render them less valuable for precise measurements than plan view maps, perceptual research [10,11] seems to indicate that users are still able to make good relative judgements from them.
Anecdotally, we observe that 3D oblique views are widely used in hiking guides, mountaineering manuals, and tourist maps, an indication that users of these documents find 3D representations appealing. Ski area maps – another frequently seen mountain representation – are almost exclusively drawn or rendered as oblique perspective views.
3.2 Issues introduced Oblique views are problematic, however, because rotating the
view to an orientation that is not parallel to the image plane and introducing perspective sacrifices the ability to measure distances or heights consistently (unless the measurement is made along a line parallel to the image plane). Doing so also prevents a viewer from
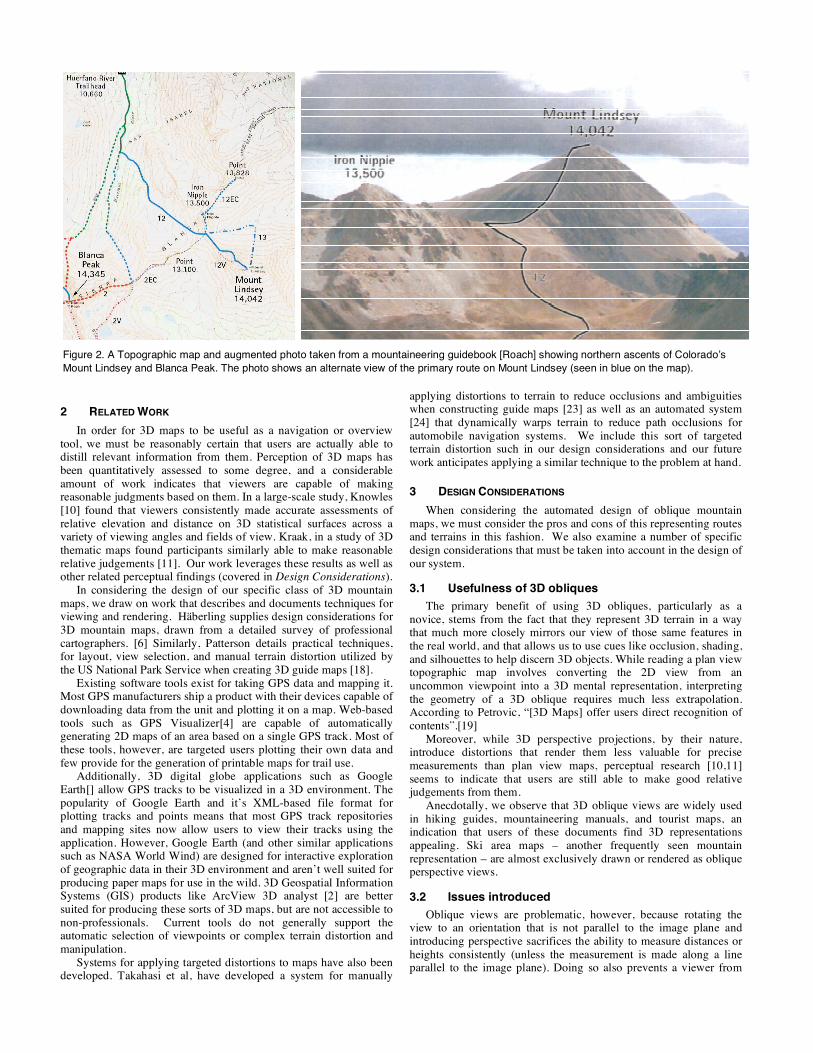
Figure 2. A Topographic map and augmented photo taken from a mountaineering guidebook [Roach] showing northern ascents of Colorado’s Mount Lindsey and Blanca Peak. The photo shows an alternate view of the primary route on Mount Lindsey (seen in blue on the map).

observing the entire extent of the map with equal fidelity and may introduce occlusions that obscure parts of it. As a result, an oblique projection may actually provide less information than its plan-view counterpart.
Other issues stem from the 2D-3D Effect in which users subjectively rotate vectors in depth more parallel to viewing plane [13]. This results in three separate perceptual biases: Slant underestimation, in which observers tend to perceive slanted objects as parallel to the viewing plane than they really are. Compression, in which estimated distances in the compressed dimensions appear shorter than they should. And, line-of-sight ambiguity in which the absolute and relative about the position of objects becomes less clear. [1]
3.3 Considerations for View Generation
3.3.1 Projection When rendering an oblique view, several projections are
possible, some of which still preserve distance measurability. These include isometric projections, as well as parallel projection variants like plan oblique projection [9] which still permit relative height judgements, introduce depth cues from occlusion in steep or vertically exaggerated areas, and provide more information about the shape of the terrain than traditional shaded relief.
Perspective projections, however, introduce not only depth from occlusion but also depth from convergence cues. [26] While they forfeit measurability, they appear more natural than parallel projections since they look more like a view of the same seen that might be seen by the human eye (given the right vantage point).
3.3.2 Terrain Distortion Because the amount of vertical elevation change on the Earth’s
surface is generally very small over a given horizontal area, terrain in mountain maps is often vertically distorted by a consistent factor across an entire map in order to increase the discernability of features. How much exaggeration is appropriate depends on the characteristics of the specific scene. Based on responses from professional cartographers and preceding work by Imhof, Häberling recommends exaggerating by between 100% and 250%. [6]
More varied distortion and repositioning of specific landmarks is also sometimes used to help improve map readability. In his hand-drawn panorama maps, for example, Berann sometimes vertically exaggerated key areas by as much as 400% and enlarged key landmarks well beyond their actual size. [17] Berann also tended to re-flow terrain in order to help maintain their visibility, widening valleys to provide unobstructed view and moving peaks to prevent them form obscuring their neighbors.
Takahashi et al provide a system for partitioning topographical surfaces into relevant groupings that can be distorted to prevent occlusions and provide emphasis. [23] This distortion philosophy has since been extended to an automated system that warps terrain geometries to prevent the occlusion of routes in automobile navigation systems. [24] Their preliminary studies indicated that, even in an animated system, users were usually unable to detect the introduced distortions.
3.3.3 Viewing Angle By definition, a change of viewing angle is all that differentiates a
top-down plan view of an area from its oblique counterparts. It is this change in angle that introduces occlusion, compression, and other perceptual discontinuities to the display. However, depth cues introduced by this reorientation can also aid the recognition of terrain in oblique views if the orientation is well chosen for the scene. Therefore, selecting an appropriate viewing angle is very important.
While Rowles showed that users can make relative measurements effectively between 15-75° from horizontal, a more tightly constrained range of viewing angles provides the best mix of depth cues and visibility. [10] Jenks and Crawford recommended a viewing
angle between 30° and 40° from horizontal, and, more recently, Häberling [6] has advocated inclinations of 30-45°. The appropriate angle, however, generally depends on the specific terrain being viewed, and some combinations of view angle, heading, and camera position are probably untenable in any given view.
In general, we suspect that a natural viewing angle can be calculated for a given route simply by choosing a view that minimizes occlusions. However, considering the complexity and structure of the underlying 3D model may be able to help us select better views. View selection techniques based on view entropy [25] and mesh saliency [12], for example, might also be applied to maps to help identify views that capture more of the structural detail of the terrain.
3.3.4 Azimuth/Heading Selecting the heading, or orientation in a plane parallel to the
ground, is very closely related to viewing angle, albeit somewhat less constrained. When selecting a viewing direction for a statistical surface, Monmonier [1978] suggests choosing an azimuth in the direction of the steepest ascent on a linear trend surface. This direction tends to approximate the direction of maximum visibility for the surface. In our case, however, path visibility will determine
Figure 5. Projection - from left to right: shaded relief, plan-oblique (parallel) projection, and perspective projection. From Jenny and Patterson[?]
Figure 6. Vertical exaggeration - views of an island at 100%, 200%, and 400% exaggeration
Figure 7. Viewing angle - views of a mountain scene from 30°, 45°, and 55°.
Figure 8. Lighting angle - from left to right: lighting from front, angled from front, from back. From Häberling.[?]
the azimuth, since a partially obscured path is always undesirable regardless of how unobstructed the view of the underlying terrain is.
Considering the direction of travel along a route can be important here insofar as we want to orient the map to provide sensible start and finish locations. For ascents and mountain climbs this generally suggests headings that place the start (and lowlands in general) near the bottom or side of the view. Other cases – a descent into a canyon for example – are better suited to a heading that places the trailhead near the top of the view. In both cases, the best headings tend to be ones that place lowlands in the foreground – an assumption supported by the fact that placing lowlands in the foreground is more likely to prevent them from being occluded by the higher areas of the map or viewed at grazing angles.
3.3.5 Illumination/Surface Layers/Imagery The illumination and shading of terrain contributes greatly to our
perception of it and a 3D structure. An appropriate choice of lighting, however, is not always clear. The sun lights terrain in the real world from a consistent set of directions that cycles daily and yearly. As such, lighting from an unrealistic direction (light from low in the northern sky on a region in the northern hemisphere, for example) may be confusing for users seeking to orient themselves with respect to the real sun-lit terrain. One approach, then, is to light the scene to simulate the lighting at an appropriate time of day at that location. Another alternative is to shade the scene using unrealistic lighting designed to best convey the detail of the underlying geometry. Häberling[6] advocates angular light from the front(figure 7, center), since this produces a good distribution of lit, unlit, and partially lit regions and, as a result, contains more depth information. Although this may produce lighting directions that cannot occur in the real world, doing so is not entirely unprecedented as it jives with the upper-left light orientation common in 2D shaded relief. [7]
The imagery or terrain information draped on the surface itself can potentially take a number of forms. In many cases satellite imagery, existing topographic maps, color based on vegetation and terrain type, or existing GIS parcel data can be overlaid. Brush–based, more natural looking rendering is also possible. [20] In many cases multiple layers of imagery can be overlaid and decisions about the type of imagery to apply can be made based on current seasonal conditions. [19] A map of a mountainous region that receives significant snowfall during the winter might, for example, be rendered using satellite imagery snowing snow cover if it is intended for use on a winter mountaineering trip, but using summer imagery at other times.
4 DESIGN PRINCIPLES Our system is ultimately intended to create printable 3D oblique
maps of hiking, biking, and other outdoor routes automatically based on GPS tracks. To create a map, a user inputs a track or set of tracks describing a route into to the system. The route is then overlaid on 3D elevation model of the scene and an appropriate view of the scene can be chosen, taking into account the variables discussed in the previous section.
Because we seek to optimize the oblique view based on the visibility of a particular path in it, our current strategy tries to center the view on the path and maximize the amount of the view utilized to show it. We also seek to minimize the number of times the path is occluded or moves outside of the range of the view. If location data is available for important landmarks, labeled points, or perceptually salient areas visible from or adjacent to the trail, our view should attempt to encompass them. If a canonical view of the area or peak is known (some peaks, for example are almost exclusively accessed from a single side), adhering to that view seems advisable.
If doing so enhances the visibility of the route and the perceptibility of the terrain, we also propose rescaling elevations across the entire model (vertical exaggeration) or by manipulating the geometry of the terrain and paths on a more local scale.
5 IMPLEMENTATION In the current, working version of the system we have
implemented viewpoint selection along with scalar vertical exaggeration. Viewpoint selection is treated as an optimization problem over on a subset of the principles listed in the previous section. Our algorithm attempts to: (1) Maximize the area of the path(s’) bounding box on the image plane – with acceptable margins at the edges of the display. (2) Minimize occlusions of the path by surrounding geometry. (3) Prevent portions of paths from being clipped at the display’s edges. (4) Maintain an appropriate viewing angle – between 30° and 45° as advocated by Häberling[6].
We use simulated annealing to perform this viewpoint optimization, penalizing and rewarding candidate views based on measures of these four qualities. Vertical exaggeration of the entire scene by a scalar value is currently supported as a manual operation, but is not currently included in the optimization. Figure 9 shows a simulated version of out our final print output, to which labels, distances, and border have been added by hand.
We use the open-source NASA World Wind Java SDK both as a source of elevation data for these computations and as an output renderer. World Wind provides a combination of Shuttle Radar Topography Mission (SRTM) and National Elevation Dataset (NED) terrain data for the underlying elevation model, giving a resolution of 30m or better for most of the United States. Publicly available Landsat imagery is draped over the models for most of the US (15m) but higher–resolution USGS Urban Area Imagery (.25m) is used when rendering routes in the populated areas for which it is available.
While shading support is currently built into the .Net-based consumer release of the World Wind package, core support is not yet available in the Java SDK. As a result, the present implementation lacks any shading cues other than those present in the satellite imagery for the target site.
World Wind Java does not expose functionality for determining the visibility or occlusion of specific points in the display. Moreover, while the package includes a number of functions for detecting the intersections of vectors, lines, and planes in 3D space with its model globe, these methods only check against the constant-radius sphere that underlies the actual terrain geometry. This means that detecting the occlusion of points on a plotted path by the surrounding terrain geometry is not entirely trivial. As a result, we were forced to manually implement a crude intersection test in which we subsample points along lines between the camera and each point in the GPS track. We then compare the relative elevations from the terrain model at that point’s latitude and longitude with the elevation of the line at that point. If the line elevation is less that that of the terrain, we register an occlusion. While this implementation generally functions properly given enough samples, it is particularly inefficient and tends to slow the optimization process significantly. Subsequent iterations of the design will need to handle these detections more intelligently, a concern which may necessitate a move away from the World Wind SDK or the rewriting of some of its source.
6 THOUGHTS ON EVALUATION While we’ve carried out no concerted evaluation of the current
product thus far, assessment of our map generation technique, and of the usefulness of 3D mapping techniques in general is certainly necessary. While a considerable amount of work has indicated that users are able to make reasonable [11, 10] but sometimes problematic [14] judgements based on oblique 3D views, there seems to have been little quantitative or qualitative assessment of them as tools for navigation. As a result we are interested in exploring navigation and terrain perception both at large and small scales and comparing the relative effectiveness of plan- and oblique-view maps, both in a controlled lab environment, and in the wild.

We hypothesize that providing an appropriately rendered 3D oblique view of the scene makes it easier for uses (particularly novices) to identify landmarks tied to the geometry and make relative judgments about the overall geometry of the terrain including relative of height, grade, roughness, and navigability. As such, it would be interesting to compare the usefulness of these representations against that of their plan-view counterparts, as well as the effectiveness of pairing the two. (It seems plausible that simply priming a user with an oblique representation before asking them to make judgements based on a plan-view map of the same region might be effective, since the knowledge of the oblique might allow users to better extrapolate 3D geometry from the plan view.)
We can imagine an experiment in which users are presented either with a plan view map of a region, an oblique view of the same area, or both and then asked to perform identification and judgement tasks. If we are to believe that oblique views give more immediate insight into relative elevations and grades, we might test this by asking users to identify the highest and lowest points on a map or locate the steepest slopes. Ability to quickly assess the terrain geometry might be examined by requiring users to count or identify distinct topographic features such as peaks or saddles. Relative judgements about between multiple points in a region should also be examined. (For example, whether one feature is higher/lower, steeper/flatter, closer/further, or bigger/smaller than another.) Ability to diagnose route direction, length and curvature are also important metrics, since they impact the usefulness of the map for navigation. Speed, accuracy, and preference metrics would be assessed for all of these cases.
Variations of all of these tests could also be imagined in an outdoor environment. Here subjects might be asked to locate visible points on the map in the real world, make judgements about relative elevations and route directions outside of their immediate field of view. Participants could also be asked to navigate along short routes using a map and then interviewed in order qualitatively gauge user comfort with each map type.
7 FUTURE WORK While we’ve discussed a number of interesting aspects of the
automatic design of 3D mountain maps, many unaddressed points remain.
7.1 Terrain Manipulation As mentioned before, the current system is capable of
exaggerating all vertical heights by a constant value but do not support rescaling and repositioning individual terrain elements. In future versions of the software, we hope to be able to automatically isolate and modify terrain features in order to clarify complex maps.
7.2 Shading Also noted previously, the underlying 3D elevation model is
draped with satellite imagery, but does is not shaded. Shading the final models using appropriate lighting [6] should help alleviate some of the difficulty in distinguishing depths. Unfortunately, shading is not supported in the current World Wind Java core renderer, and the timeline for inclusion is ambiguous. As such, shading support may necessitate a move to a different platform as work progresses.
7.3 Path Segmentation Given the constraints we place on the viewing angle, it is clear
that there are a many route and terrain combinations for which no occlusion-free view exists. A trail which climbs one side of a steep ridge and then descends the opposite side, for example cannot be seen in its entirety without looking at it from a viewing angle close to 90° from the ground plane. As a result, paths for which no immediate oblique solution exists need to be segmented to generate multiple views. This subdivision might take place before optimization, given a suitable heuristic for segmenting the route, or during the optimization itself. In the former case, the view optimization can be performed as in the current implementation, while in the latter the optimization can be extended to include two or more views, penalizing only when points are occluded in or absent from all of them. In addition, the algorithm might penalize views for being too similar to one another in order to avoid redundancy.
Including multiple views of the path raises questions about how to light the scene. If the renderer shades all of the views with
Figure 3. Simulation of a printed route map (enlarged).
angular lighting from the front (as discussed previously) it will introduce inconsistencies in the appearance of the terrain across views, making it difficult to unify them. We suspect that selecting the lighting direction for the most prominent view and then maintaining that same lighting direction (in the 3D world) across other views will produce the most consistent result.
7.4 Decoration Distances, elevations, start/finish markers, and landmark labels
like those seen in Figure 3 will be rendered atop the final map images in future iterations. A compass rose should also be included to help establish cardinal directions. Additional encodings such as color codings to indicate route and terrain grade or technical difficulty may also be included. We also plan to render additional information about the route on the printed map sheet (as at the bottom of Figure 3) including information about the data source, elevation and distance totals, and average grade.
7.5 Pairing with Related Representations We suspect that plan-view topographic maps and three-
dimensional maps of the same terrain are, in many cases, complementary. Plan view maps offer measurability and can afford equal emphasis to all corners of the map, while 3D obliques offer an easy-to-comprehend view of the terrain. Thus it seems natural to pair the two. This might be done by generating a top-down view of a scene in tandem with its oblique, such that the visible area, orientation, lighting, and map markings are coordinated so that the two could be cross-referenced to one another.
Other representations might also be useful. An elevation profile of a plotted path could, for example, be generated and inlaid at the bottom of the map, with links or markers coordinating points on the elevation profile with their position in the oblique.
7.6 Including Other Geotagged Data A wide range of other geospatial data that may be of interest to
hikers in mountainous terrain is also publicly available and might be valuable or interesting to particular map users. Geotagged photos from along a route, for example, could be included on or next to the map to help provide a better sense of the experience of the route beforehand. Geotagged annotations from hiking recommendation sites or from public geospatial repositories like WikiMapia[26] are also promising candidates, as is data on terrain classification, public and private land boundaries, and seasonal closures provided by government agencies.
8 CONCLUSION Here we have described the initial efforts towards developing a
system for automatically generating oblique 3D overviews of hiking trails. Given a GPS path, the system is intended to automatically return a printable map with an appropriately chosen viewpoint and vertical distortion. While only a simple working prototype has been completed thus far, we propose future work, including thoughts on potential methods of evaluating our system in particular and investigating the efficacy of 3D oblique maps for general navigation in mountainous terrain.
REFERENCES [1] Alexander, A., Wickens, C. 2003. The effects of spatial awareness
biases on maneuver choice in a cockpit. International Symposium on Aviation Psychology, Dayton, OH.
[2] ArcView 3D Analyst. 2007. http://www.esri.com/software/arcview/extensions/3danalyst/
[3] Google Earth. 2007.http://earth.google.com/ [4] GPS Visualizer. 2007. http://www.gpsvisualizer.com/ [5] Häberling, C. 2002. 3D Map Presentation – a systematic Evaluation of
important graphic aspects. Online-Paper of the ICA Mountain Cartography Workshop 2002. Mount Hood, OR, USA.
[6] Häberling, C. 2004. Highly Focused Design and Graphic Variables for 3D Mountain Maps. Proceedings 4th ICA Mountain Cartography Workshop. Institut Cartogràfic de Catalunya. Barcelona, Spain. Technical Monograph, No. 8: 109–117.
[7] Imhof, Eduard, and Harry Steward. 1982. Cartographic relief presentation. Berlin: De Gruyter.
[8] Jenks, G. F., & Caspall, F. C. 1967. Vertical exaggeration in three dimensional mapping. Lawrence, Kansas: Dept. of Geography, University of Kansas.
[9] Jenny, B. and Patterson, T. 2007. Introducing Plan Oblique Relief. Cartographic Perspectives, 57, p. 21-40 and 88-90.
[10] Knowles, R.A. 1978. Perception of Perspective Block Diagrams. The American Cartographer, Vol. 5, No. 1. pp. 31-44.
[11] Kraak, M. J. 1988. Computer-assisted cartographical three-dimensional imaging techniques. Delft: Delft University Press.
[12] Lee, C. H., Varshney, A., and Jacobs, D. W. 2005. Mesh saliency. In ACM SIGGRAPH 2005 Papers (Los Angeles, California, July 31 - August 04, 2005). J. Marks, Ed. SIGGRAPH '05. ACM, New York, NY, 659-666.
[13] McGreevy, M. W. and Ellis, S. R. 1986. The effect of perspective geometry on judged direction in spatial information instruments. Hum. Factors 28, 4 (Aug. 1986), 439-456.
[14] McCleary, G. F., Jenks, G. F., and Ellis, S. R. 1993. Cartography and map displays. In Pictorial Communication in Virtual and Real Environments (2nd Ed.), S. R. Ellis, M. K. Kaiser, and A. J. Grunwald, Eds. Taylor & Francis, Bristol, PA, 76-96.
[15] Motion Based. 2007. http://www.motionbased.com [16] Monmonier, M.S. 1978. Annals of the Association of American
Geographers, Vol. 68, No. 2. (Jun., 1978), pp. 180-195. [17] Patterson, Tom. 2000. A View from on High: Heinrich Berann’s
Panoramas and Landscape Visualization Techniques for the U.S. National Park Service. Cartographic Perspectives. No. 36, Spring 2000: 38–65.
[18] Patterson, T. 2001. DEM Manipulation and 3-D Visualization: Techniques Used by the U.S. National Park Service. Cartographica. Vol. 38, Nos. 1 & 2, Spring/Summer 2001: 89–101.
[19] Petrovic, D. 2001. Three-Dimensional Mountain Map. In: Proceedings of the 20th International Cartographic Conference, Beijing, Volume 5, 3392-3399.
[20] Premoze, S., Thompson, W., and Shirley, P. 1999. Geospecific Rendering Of Alpine Terrain. In EurographicsRendering Workshop. European Association for Computer Graphics, June 1999.
[21] Rowles, R.A. 1978. Perception of perspective block diagrams, The American Cartographer, 5, (1), 31-44
[22] Spring & Manning, 2003. 100 Hikes in Washington’s Glacier Peak Region. Mountaineers Books.
[23] Takahashi, S., Ohta, N., Nakamura, H., Takeshima, Y., and Fujishiro, I. 2002. Modeling surperspective projection of landscapes for geographical guide-map generation. Computer Graphics Forum 21, 3, 259--268.
[24] Takahashi, S., Yoshida, K., Shimada, S., Nishita, T. 2006. Occlusion-Free Animation of Driving Routes for Car Navigation Systems. IEEE Transactions on Visualization and Computer Graphics 12, 5 (Sep. 2006), 1141-1148
[25] Vázquez, P., Feixas, M., Sbert, M., and Heidrich, W. 2001. Viewpoint Selection using Viewpoint Entropy. In Proceedings of the Vision Modeling and Visualization Conference 2001 (November 21 - 23, 2001). T. Ertl, B. Girod, H. Niemann, and H. Seidel, Eds. Aka GmbH, 273-280.
[26] Vlahos, P. 1965. The Three-Dimensional Display: Its Cues and Techniques, Journal of the Society for Information Display, Vol. 2, Number 6, Nov/Dec, 1965.
[27] WikiMapia. 2007. http://www.wikimapia.org.