Embed Size (px)
Citation preview
U.S. Department of Housing and Urban Development | Office of Policy Development and Research
HUD PD&R Housing Market Profiles
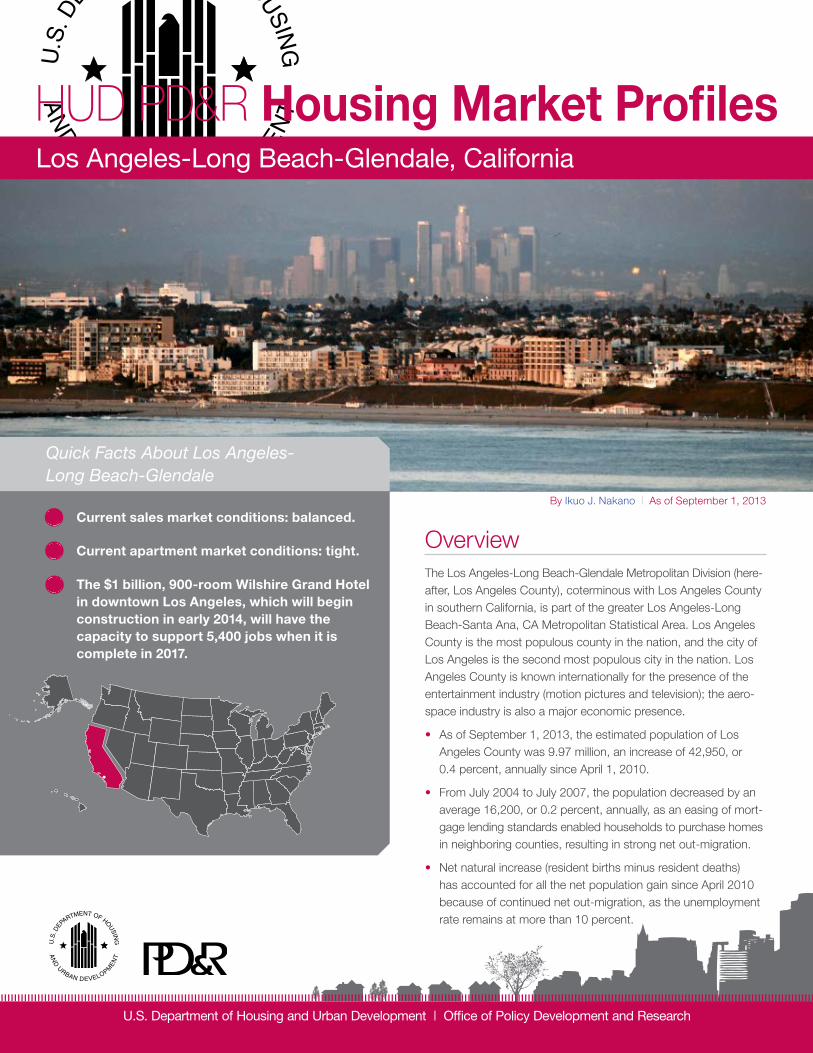
Quick Facts About Los Angeles- Long Beach-Glendale
Los Angeles-Long Beach-Glendale, California
OverviewThe Los Angeles-Long Beach-Glendale Metropolitan Division (here - after, Los Angeles County), coterminous with Los Angeles County in southern California, is part of the greater Los Angeles-Long Beach-Santa Ana, CA Metropolitan Statistical Area. Los Angeles County is the most populous county in the nation, and the city of Los Angeles is the second most populous city in the nation. Los Angeles County is known internationally for the presence of the entertainment industry (motion pictures and television); the aero-space industry is also a major economic presence.
• As of September 1, 2013, the estimated population of Los Angeles County was 9.97 million, an increase of 42,950, or 0.4 percent, annually since April 1, 2010.
• From July 2004 to July 2007, the population decreased by an average 16,200, or 0.2 percent, annually, as an easing of mort - gage lending standards enabled households to purchase homes in neighboring counties, resulting in strong net out-migration.
• Net natural increase (resident births minus resident deaths) has accounted for all the net population gain since April 2010 because of continued net out-migration, as the unemployment rate remains at more than 10 percent.
Current sales market conditions: balanced.
Current apartment market conditions: tight.
The $1 billion, 900-room Wilshire Grand Hotel in downtown Los Angeles, which will begin construction in early 2014, will have the capacity to support 5,400 jobs when it is complete in 2017.
By Ikuo J. Nakano | As of September 1, 2013
Los Angeles-Long Beach-Glendale, CAHUD PD&R Housing Market Profiles 2
U.S. Department of Housing and Urban Development | Office of Policy Development and Research
As of September 1, 2013
Economic ConditionsEconomic conditions have strengthened in Los Angeles County since 2011, as reflected in job growth in most nonfarm payroll sectors.
During the 3 months ending August 2013—
• Nonfarm payrolls averaged 3.9 million jobs, an increase of 52,500 jobs, or 1.4 percent, compared with the number of jobs recorded during the same 3-month period in 2012, largely because of growth in the tourism, entertainment, healthcare, and technology industries.
• The most significant gains were in the leisure and hospitality, professional and business services, and education and health services sectors, which increased by 20,700, 18,200, and 16,600 jobs, or 4.9, 3.2, and 3.1 percent, respectively, from the 3 months ending August 2012.
• The greatest job losses occurred in the government sector, which decreased by 7,500 jobs, or 1.4 percent, from the 3 months end - ing August 2012, as layoffs continued in the local government subsector.
• The average unemployment rate decreased to 10.4 percent com - pared with the rate of 11.4 percent recorded during the 3-month period ending August 2012.
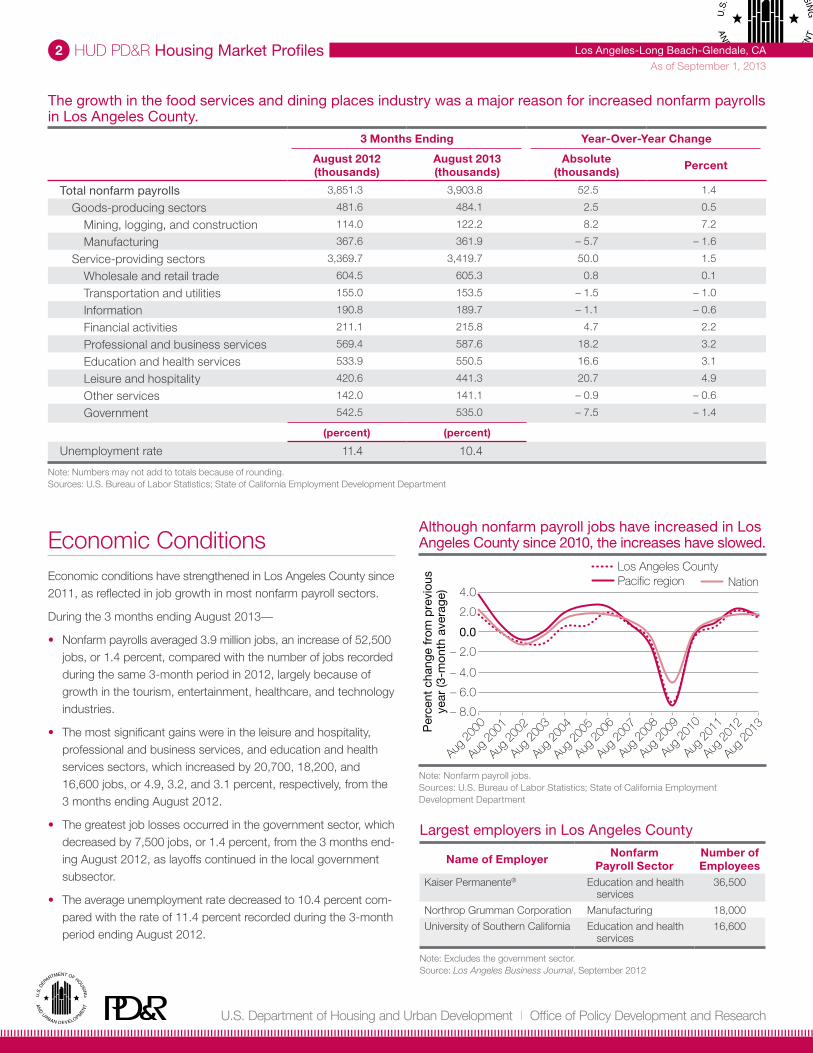
The growth in the food services and dining places industry was a major reason for increased nonfarm payrolls in Los Angeles County.
3 Months Ending Year-Over-Year Change
August 2012 (thousands)
August 2013(thousands)
Absolute(thousands) Percent
Total nonfarm payrolls 3,851.3 3,903.8 52.5 1.4
Goods-producing sectors 481.6 484.1 2.5 0.5
Mining, logging, and construction 114.0 122.2 8.2 7.2
Manufacturing 367.6 361.9 – 5.7 – 1.6
Service-providing sectors 3,369.7 3,419.7 50.0 1.5
Wholesale and retail trade 604.5 605.3 0.8 0.1
Transportation and utilities 155.0 153.5 – 1.5 – 1.0
Information 190.8 189.7 – 1.1 – 0.6
Financial activities 211.1 215.8 4.7 2.2
Professional and business services 569.4 587.6 18.2 3.2
Education and health services 533.9 550.5 16.6 3.1
Leisure and hospitality 420.6 441.3 20.7 4.9
Other services 142.0 141.1 – 0.9 – 0.6
Government 542.5 535.0 – 7.5 – 1.4
(percent) (percent)
Unemployment rate 11.4 10.4
Note: Numbers may not add to totals because of rounding.Sources: U.S. Bureau of Labor Statistics; State of California Employment Development Department
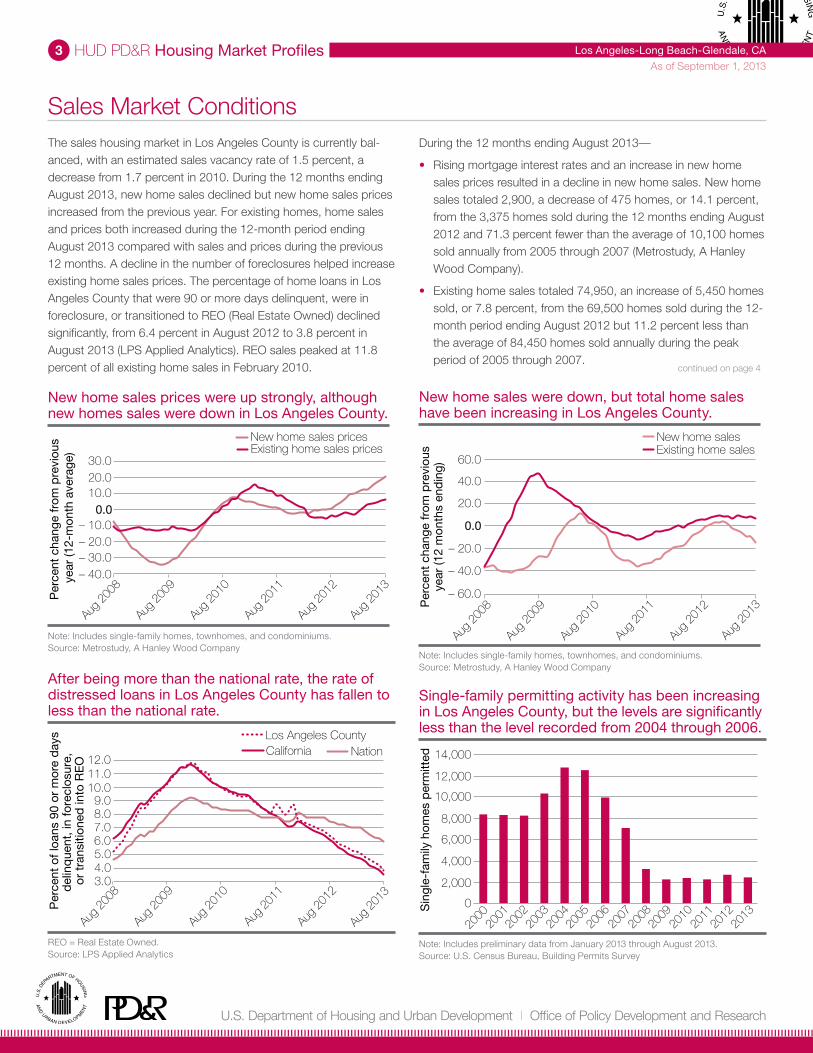
Although nonfarm payroll jobs have increased in Los Angeles County since 2010, the increases have slowed.
Note: Nonfarm payroll jobs.Sources: U.S. Bureau of Labor Statistics; State of California Employment Development Department
4.0
2.0
0.0
– 2.0
– 6.0
– 8.0
– 4.0
Per
cent
cha
nge
from
pre
viou
sye
ar (3
-mon
th a
vera
ge)
Los Angeles CountyPacific region Nation
Aug
2000
Aug
2001
Aug
2002
Aug
2003
Aug
2004
Aug
2005
Aug
2006
Aug
2007
Aug
2008
Aug
2009
Aug
2010
Aug
2011
Aug
2012
Aug
2013
Name of Employer Nonfarm Payroll Sector
Number of Employees
Kaiser Permanente® Education and health services
36,500
Northrop Grumman Corporation Manufacturing 18,000
University of Southern California Education and health services
16,600
Note: Excludes the government sector. Source: Los Angeles Business Journal, September 2012
Largest employers in Los Angeles County
Los Angeles-Long Beach-Glendale, CAHUD PD&R Housing Market Profiles 3
U.S. Department of Housing and Urban Development | Office of Policy Development and Research
As of September 1, 2013
During the 12 months ending August 2013—
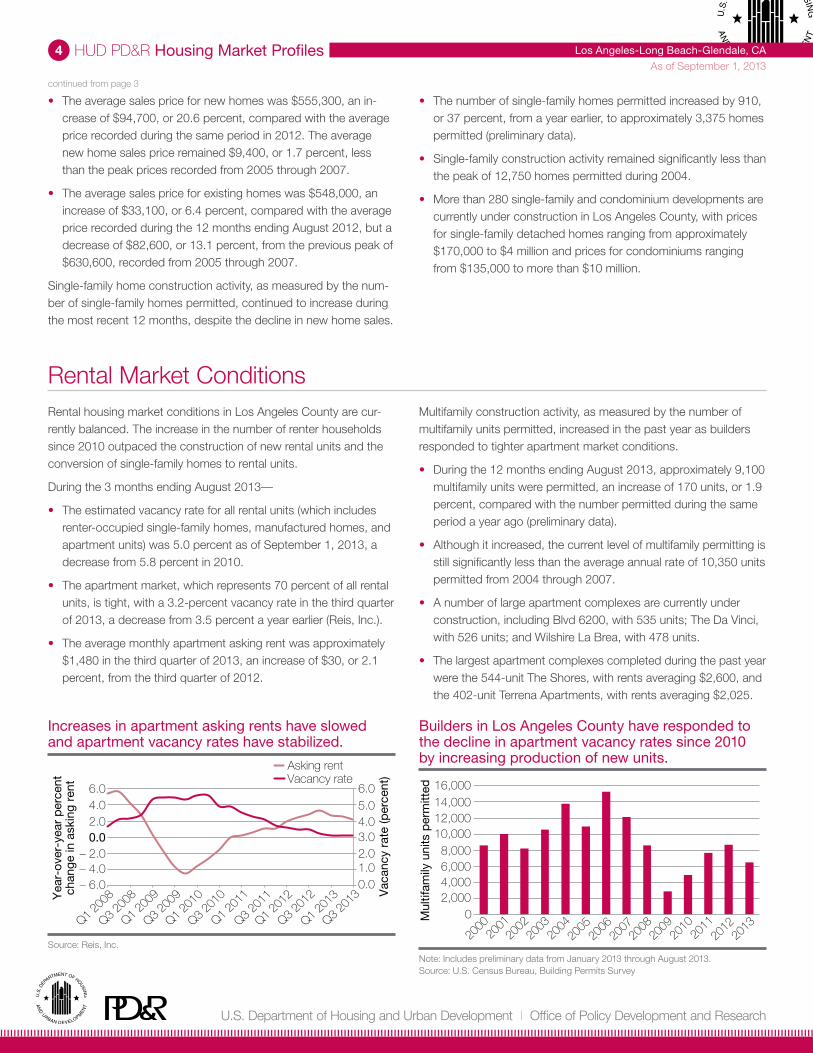
• Rising mortgage interest rates and an increase in new home sales prices resulted in a decline in new home sales. New home sales totaled 2,900, a decrease of 475 homes, or 14.1 percent, from the 3,375 homes sold during the 12 months ending August 2012 and 71.3 percent fewer than the average of 10,100 homes sold annually from 2005 through 2007 (Metrostudy, A Hanley Wood Company).
• Existing home sales totaled 74,950, an increase of 5,450 homes sold, or 7.8 percent, from the 69,500 homes sold during the 12- month period ending August 2012 but 11.2 percent less than the average of 84,450 homes sold annually during the peak period of 2005 through 2007.
Sales Market ConditionsThe sales housing market in Los Angeles County is currently bal-anced, with an estimated sales vacancy rate of 1.5 percent, a decrease from 1.7 percent in 2010. During the 12 months ending August 2013, new home sales declined but new home sales prices increased from the previous year. For existing homes, home sales and prices both increased during the 12-month period ending August 2013 compared with sales and prices during the previous 12 months. A decline in the number of foreclosures helped increase existing home sales prices. The percentage of home loans in Los Angeles County that were 90 or more days delinquent, were in foreclosure, or transitioned to REO (Real Estate Owned) declined significantly, from 6.4 percent in August 2012 to 3.8 percent in August 2013 (LPS Applied Analytics). REO sales peaked at 11.8 percent of all existing home sales in February 2010.
0.0
30.0
10.020.0
– 40.0– 30.0– 20.0– 10.0
Per
cent
cha
nge
from
pre
viou
s ye
ar (1
2-m
onth
ave
rage
)
New home sales prices
Aug 2
008
Aug 2
009
Aug 2
010
Aug 2
011
Aug 2
012
Aug 2
013
Existing home sales prices
New home sales prices were up strongly, although new homes sales were down in Los Angeles County.
Note: Includes single-family homes, townhomes, and condominiums.Source: Metrostudy, A Hanley Wood Company
– 40.0
– 60.0
0.0
20.0
40.0
60.0
– 20.0
Per
cent
cha
nge
from
pre
viou
sye
ar (1
2 m
onth
s en
din
g)New home salesExisting home sales
Aug
2008
Aug
2009
Aug
2010
Aug
2011
Aug
2012
Aug
2013
New home sales were down, but total home sales have been increasing in Los Angeles County.
Note: Includes single-family homes, townhomes, and condominiums.Source: Metrostudy, A Hanley Wood Company
3.04.05.0
12.0
10.011.0
9.08.0
6.07.0
Per
cent
of l
oans
90
or m
ore
day
sd
elin
que
nt, i
n fo
recl
osur
e,
or t
rans
ition
ed in
to R
EO
Los Angeles CountyCalifornia Nation
Aug
2008
Aug
2009
Aug
2010
Aug
2011
Aug
2012
Aug
2013
After being more than the national rate, the rate of distressed loans in Los Angeles County has fallen to less than the national rate.
REO = Real Estate Owned.Source: LPS Applied Analytics
Single-family permitting activity has been increasing in Los Angeles County, but the levels are significantly less than the level recorded from 2004 through 2006.
Note: Includes preliminary data from January 2013 through August 2013.Source: U.S. Census Bureau, Building Permits Survey
0
4,000
2,000
2000
2001
2002
2003
2004
2005
2006
2007
2008
2009
2010
2011
2012
2013
6,000
Sin
gle-
fam
ily h
omes
per
mitt
ed
8,000
10,000
14,000
12,000
continued on page 4
Los Angeles-Long Beach-Glendale, CAHUD PD&R Housing Market Profiles 4
U.S. Department of Housing and Urban Development | Office of Policy Development and Research
As of September 1, 2013
Rental Market ConditionsRental housing market conditions in Los Angeles County are cur-rently balanced. The increase in the number of renter households since 2010 outpaced the construction of new rental units and the conversion of single-family homes to rental units.
During the 3 months ending August 2013—
• The estimated vacancy rate for all rental units (which includes renter-occupied single-family homes, manufactured homes, and apartment units) was 5.0 percent as of September 1, 2013, a decrease from 5.8 percent in 2010.
• The apartment market, which represents 70 percent of all rental units, is tight, with a 3.2-percent vacancy rate in the third quarter of 2013, a decrease from 3.5 percent a year earlier (Reis, Inc.).
• The average monthly apartment asking rent was approximately $1,480 in the third quarter of 2013, an increase of $30, or 2.1 percent, from the third quarter of 2012.
Multifamily construction activity, as measured by the number of multifamily units permitted, increased in the past year as builders responded to tighter apartment market conditions.
• During the 12 months ending August 2013, approximately 9,100 multifamily units were permitted, an increase of 170 units, or 1.9 percent, compared with the number permitted during the same period a year ago (preliminary data).
• Although it increased, the current level of multifamily permitting is still significantly less than the average annual rate of 10,350 units permitted from 2004 through 2007.
• A number of large apartment complexes are currently under construction, including Blvd 6200, with 535 units; The Da Vinci, with 526 units; and Wilshire La Brea, with 478 units.
• The largest apartment complexes completed during the past year were the 544-unit The Shores, with rents averaging $2,600, and the 402-unit Terrena Apartments, with rents averaging $2,025.
• The average sales price for new homes was $555,300, an in-crease of $94,700, or 20.6 percent, compared with the average price recorded during the same period in 2012. The average new home sales price remained $9,400, or 1.7 percent, less than the peak prices recorded from 2005 through 2007.
• The average sales price for existing homes was $548,000, an increase of $33,100, or 6.4 percent, compared with the average price recorded during the 12 months ending August 2012, but a decrease of $82,600, or 13.1 percent, from the previous peak of $630,600, recorded from 2005 through 2007.
Single-family home construction activity, as measured by the num-ber of single-family homes permitted, continued to increase during the most recent 12 months, despite the decline in new home sales.
• The number of single-family homes permitted increased by 910, or 37 percent, from a year earlier, to approximately 3,375 homes permitted (preliminary data).
• Single-family construction activity remained significantly less than the peak of 12,750 homes permitted during 2004.
• More than 280 single-family and condominium developments are currently under construction in Los Angeles County, with prices for single-family detached homes ranging from approximately $170,000 to $4 million and prices for condominiums ranging from $135,000 to more than $10 million.
8,000
2,000 4,000 6,000
10,000 12,000 14,000
16,000
0Mul
tifam
ily u
nits
per
mitt
ed
2000
2001
2002
2003
2004
2005
2006
2007
2008
2009
2010
2011
2012
2013
Builders in Los Angeles County have responded to the decline in apartment vacancy rates since 2010 by increasing production of new units.
Note: Includes preliminary data from January 2013 through August 2013.Source: U.S. Census Bureau, Building Permits Survey
– 6.0– 4.0– 2.0
0.02.04.06.0
2.01.00.0
3.04.05.0
6.0
Q3 20
10
Q1 20
10
Q1 20
11
Q3 20
11
Q3 20
08
Q1 20
08
Q1 20
09
Q3 20
09
Q1 20
12
Q3 20
12
Q3 20
13
Q1 20
13
Vac
ancy
rat
e (p
erce
nt)
Yea
r-ov
er-y
ear
per
cent
chan
ge in
ask
ing
rent
Asking rent Vacancy rate
Increases in apartment asking rents have slowed and apartment vacancy rates have stabilized.
Source: Reis, Inc.
continued from page 3