Embed Size (px)
DESCRIPTION
Los Angeles | Boston | London | Frankfurt | paris. The Great Restructuring: Get Involved or Get Out of the Way. May 2013. “The root of our problems is not that we’re in a Great Recession, or a Great Stagnation, but rather we are in the early throes of a Great Restructuring .” - PowerPoint PPT Presentation
Citation preview
LOS ANGELES | BOSTON | LONDON | FRANKFURT | PARIS
May 2013
The Great Restructuring: Get Involved or Get Out of the Way
“The root of our problems is not that we’re in a Great Recession, or a Great Stagnation, but rather we are in the early throes of a Great Restructuring.”
– Erik Brynjolfsson and Andrew Mcafee
Contents
World Economy: Get Involved
US Economy: Move Out of the Way
I
II
I World Economy: Get Involved
© 2013 Payden & Rygel All rights reservedConfidential & ProprietaryThe Great Restructuring: Get Involved or Get Out of the Way 4
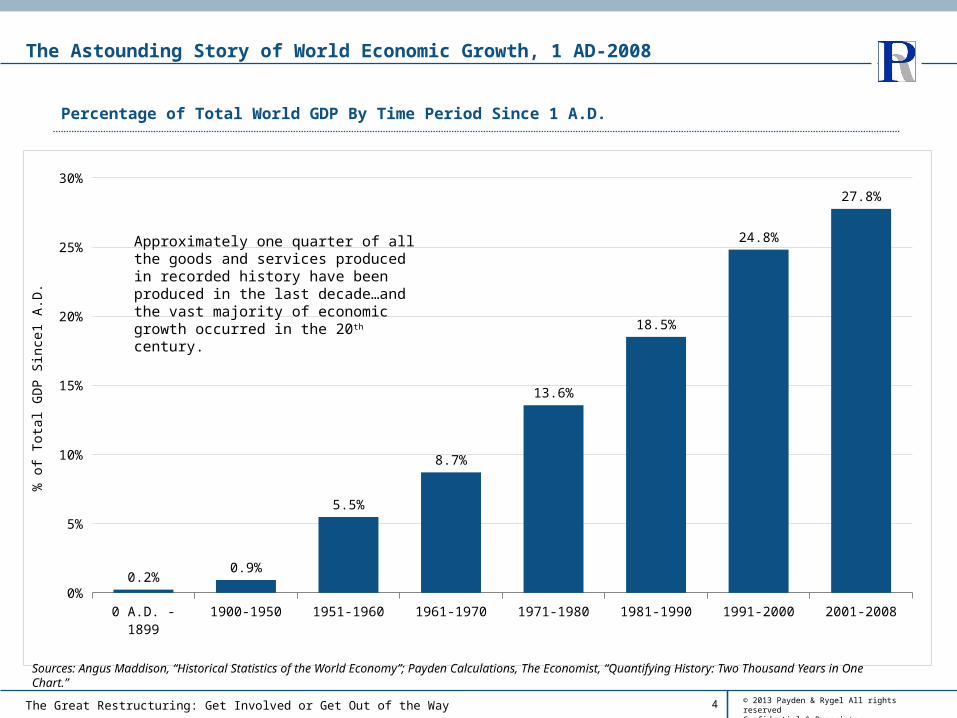
The Astounding Story of World Economic Growth, 1 AD-2008
Percentage of Total World GDP By Time Period Since 1 A.D.
0 A.D. - 1899 1900-1950 1951-1960 1961-1970 1971-1980 1981-1990 1991-2000 2001-20080%
5%
10%
15%
20%
25%
30%
0.2%0.9%
5.5%
8.7%
13.6%
18.5%
24.8%
27.8%
% o
f Tot
al G
DP
Sin
ce1
A.D
.
Sources: Angus Maddison, “Historical Statistics of the World Economy”; Payden Calculations, The Economist, “Quantifying History: Two Thousand Years in One Chart.”
Approximately one quarter of all the goods and services produced in recorded history have been produced in the last decade…and the vast majority of economic growth occurred in the 20th century.
© 2013 Payden & Rygel All rights reservedConfidential & ProprietaryThe Great Restructuring: Get Involved or Get Out of the Way 5
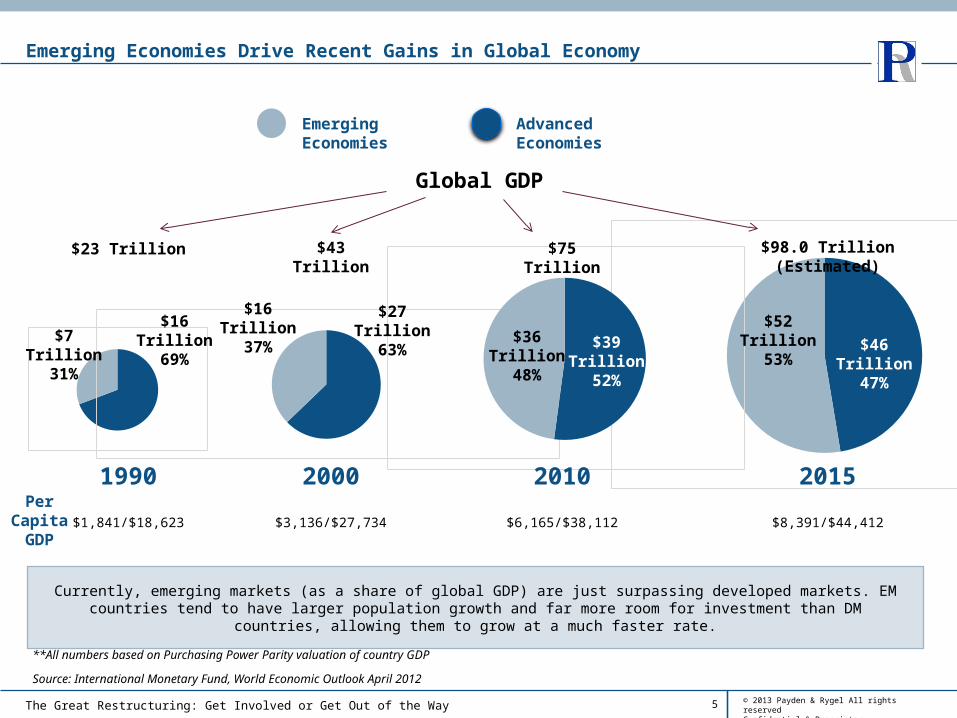
Emerging Economies Drive Recent Gains in Global Economy
1990 2000 2010 2015
Emerging Economies Advanced Economies
$23 Trillion $43 Trillion $75 Trillion $98.0 Trillion (Estimated)
Source: International Monetary Fund, World Economic Outlook April 2012
Currently, emerging markets (as a share of global GDP) are just surpassing developed markets. EM countries tend to have larger population growth and far more room for investment than DM countries, allowing them to grow at a much faster rate.
**All numbers based on Purchasing Power Parity valuation of country GDP
$46 Trillion
47%
$52 Trillion
53%$39
Trillion52%
$36 Trillion
48%
$27 Trillion
63%
$16 Trillion
37%$16
Trillion69%
$7 Trillion31%
Global GDP
Per Capita GDP $1,841/$18,623 $3,136/$27,734 $6,165/$38,112 $8,391/$44,412
© 2013 Payden & Rygel All rights reservedConfidential & ProprietaryThe Great Restructuring: Get Involved or Get Out of the Way 6
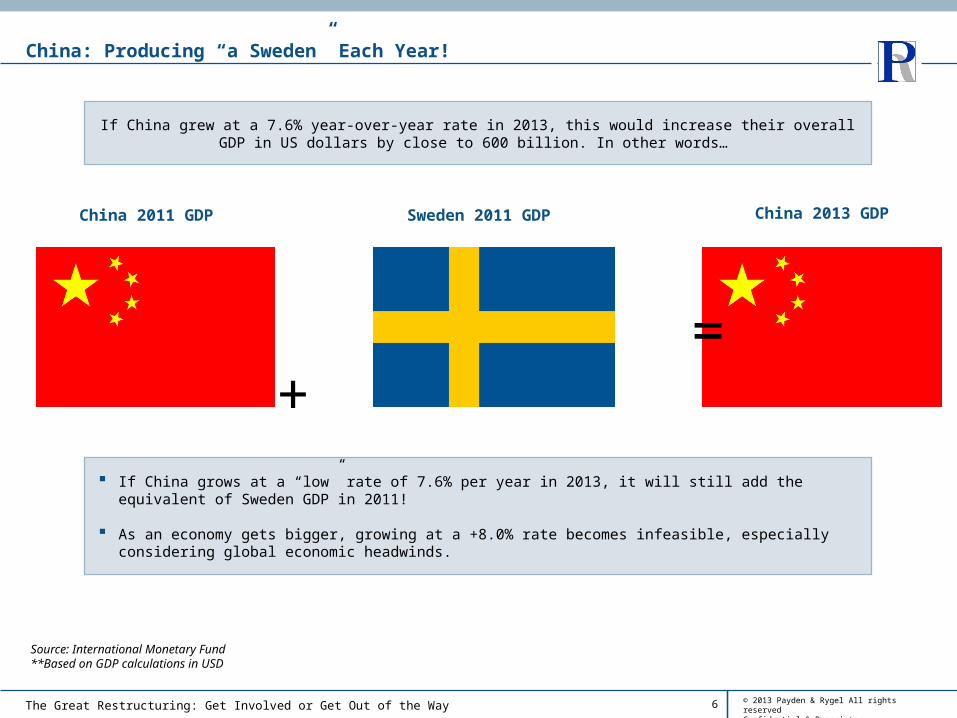
China: Producing “a Sweden” Each Year!
If China grew at a 7.6% year-over-year rate in 2013, this would increase their overall GDP in US dollars by close to 600 billion. In other words…
=
China 2013 GDPChina 2011 GDP
+
Sweden 2011 GDP
Source: International Monetary Fund**Based on GDP calculations in USD
If China grows at a “low” rate of 7.6% per year in 2013, it will still add the equivalent of Sweden GDP in 2011!
As an economy gets bigger, growing at a +8.0% rate becomes infeasible, especially considering global economic headwinds.
© 2013 Payden & Rygel All rights reservedConfidential & ProprietaryThe Great Restructuring: Get Involved or Get Out of the Way 7
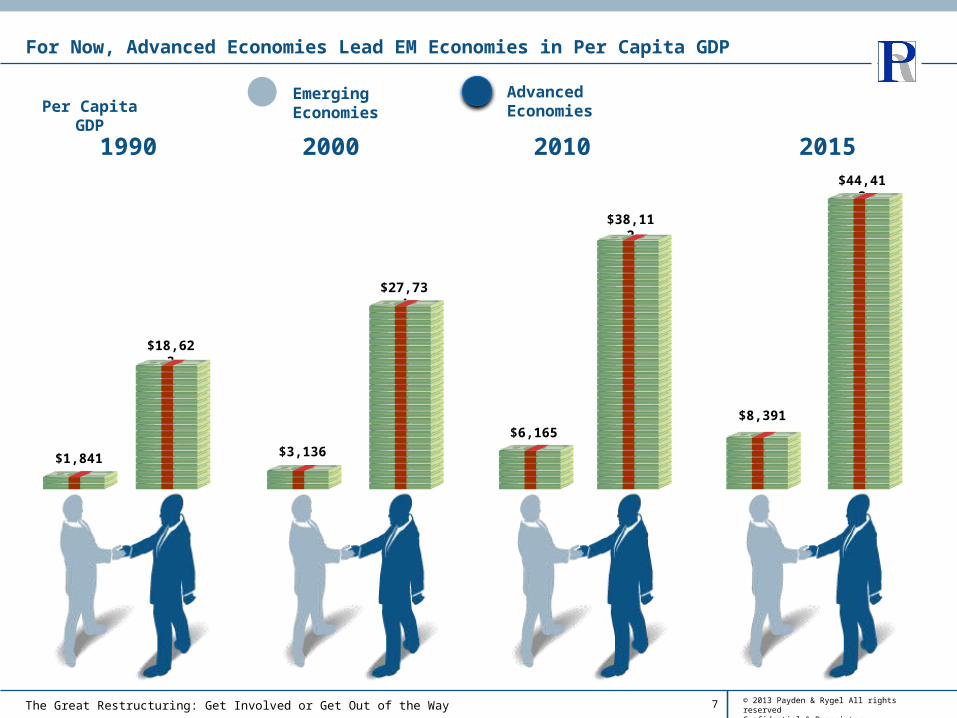
For Now, Advanced Economies Lead EM Economies in Per Capita GDP
1990 2000 2010 2015
Emerging Economies Advanced EconomiesPer Capita GDP
$1,841
$18,623
$3,136
$27,734
$6,165
$38,112
$8,391
$44,412
© 2013 Payden & Rygel All rights reservedConfidential & ProprietaryThe Great Restructuring: Get Involved or Get Out of the Way 8
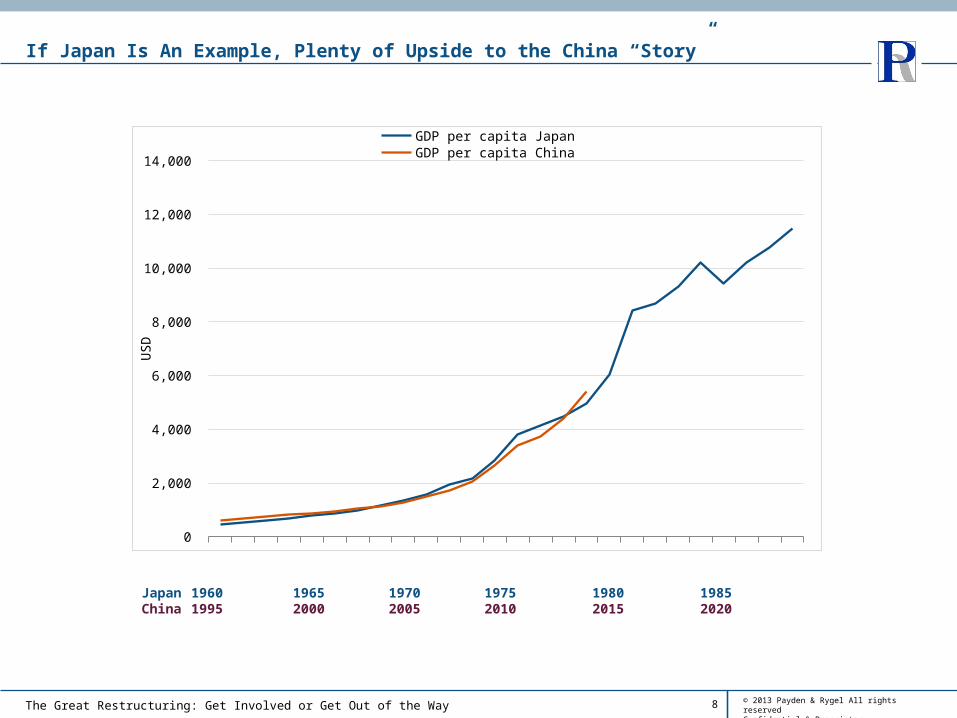
If Japan Is An Example, Plenty of Upside to the China “Story”
0
2,000
4,000
6,000
8,000
10,000
12,000
14,000 GDP per capita Japan GDP per capita China
US
D
Japan 1960 1965 1970 1975 1980 1985China 1995 2000 2005 2010 2015 2020
© 2013 Payden & Rygel All rights reservedConfidential & ProprietaryThe Great Restructuring: Get Involved or Get Out of the Way 9
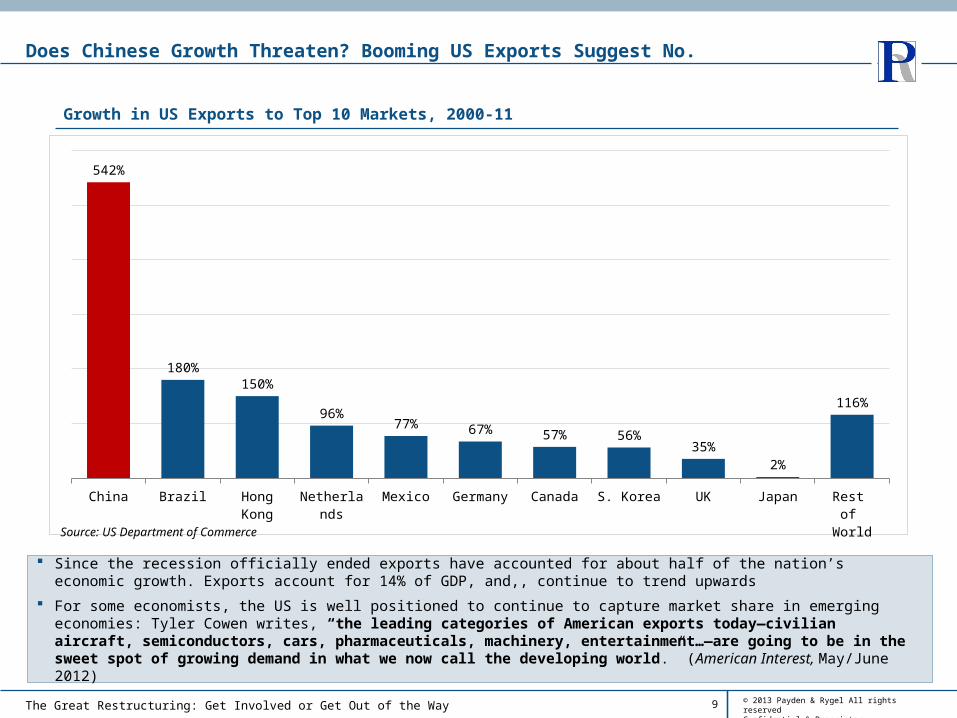
Does Chinese Growth Threaten? Booming US Exports Suggest No.
Growth in US Exports to Top 10 Markets, 2000-11
China Brazil Hong Kong Netherlands Mexico Germany Canada S. Korea UK Japan Rest of
World
542%
180%150%
96%77% 67% 57% 56%
35%2%
116%
Source: US Department of Commerce
Since the recession officially ended exports have accounted for about half of the nation’s economic growth. Exports account for 14% of GDP, and,, continue to trend upwards
For some economists, the US is well positioned to continue to capture market share in emerging economies: Tyler Cowen writes, “the leading categories of American exports today—civilian aircraft, semiconductors, cars, pharmaceuticals, machinery, entertainment…—are going to be in the sweet spot of growing demand in what we now call the developing world.” (American Interest, May/June 2012)
© 2013 Payden & Rygel All rights reservedConfidential & ProprietaryThe Great Restructuring: Get Involved or Get Out of the Way
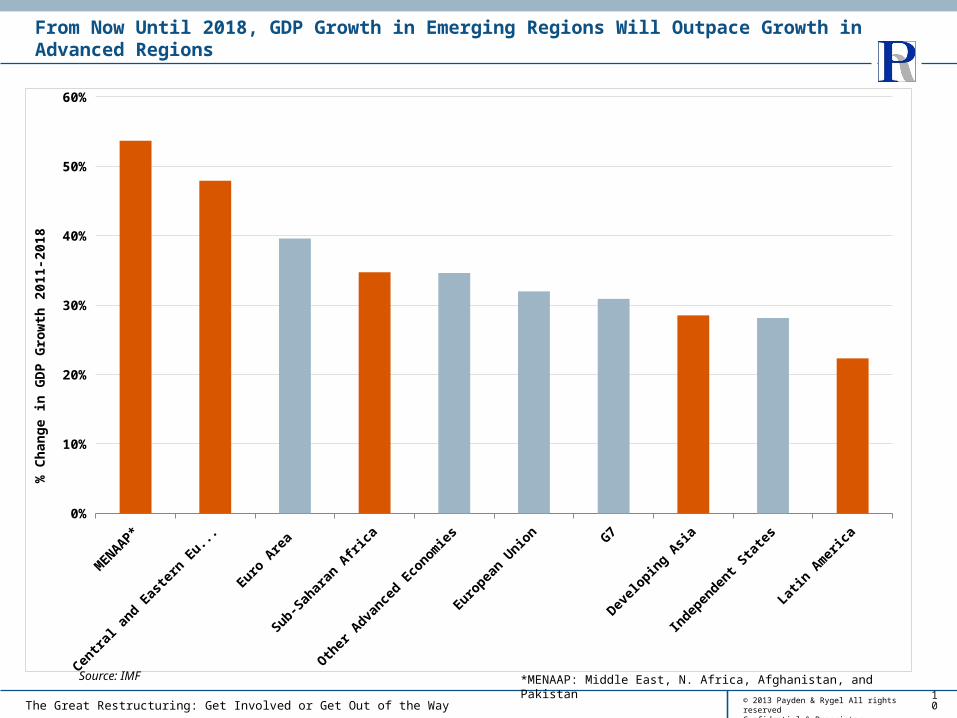
From Now Until 2018, GDP Growth in Emerging Regions Will Outpace Growth in Advanced Regions
10
MENAAP*
Centra
l and Eas
tern Europe
Euro Area
Sub-Sahara
n Africa
Other Adv
ance
d Economies
European Union G7
Develo
ping Asia
Indepen
dent S
tates
Latin Ameri
ca0%
10%
20%
30%
40%
50%
60%
% C
hang
e in
GDP
Gro
wth
201
1-20
18
Source: IMF *MENAAP: Middle East, N. Africa, Afghanistan, and Pakistan

II US Economy: Move Out of the Way
© 2013 Payden & Rygel All rights reservedConfidential & ProprietaryThe Great Restructuring: Get Involved or Get Out of the Way 12
1948 1951 1954 1957 1960 1963 1966 1969 1972 1975 1978 1981 1984 1987 1990 1993 1996 1999 2002 2005 2008 20110%
5%
10%
15%
20%
25%
30%
35%
40%
45%
50%
©FactSet Research SystemsSource: Department of Labor
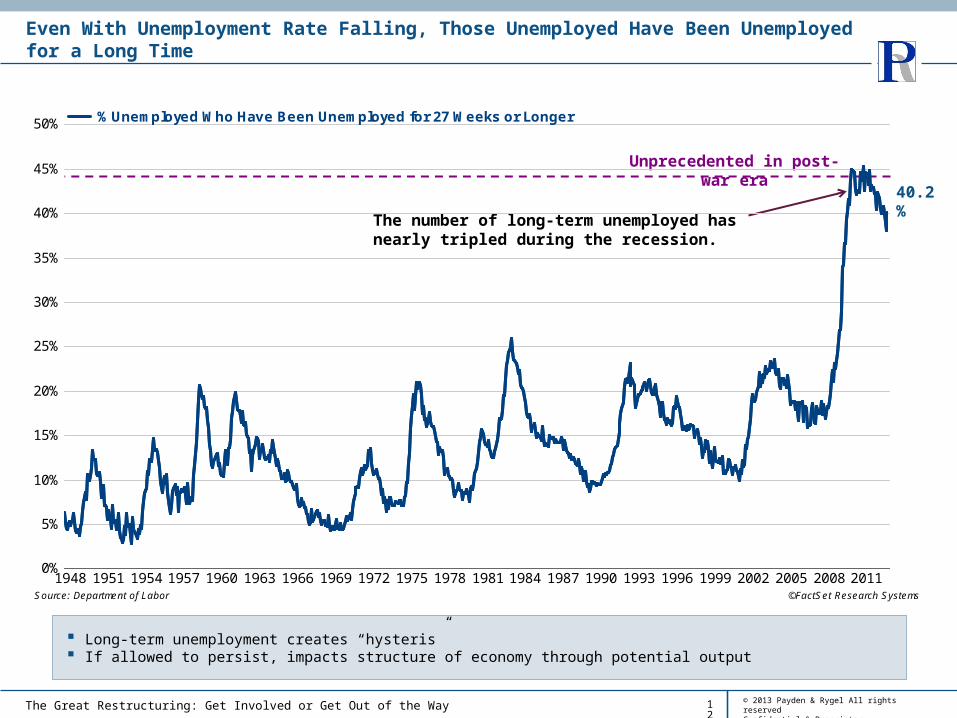
% Unemployed Who Have Been Unemployed for 27 Weeks or Longer
Even With Unemployment Rate Falling, Those Unemployed Have Been Unemployed for a Long Time
The number of long-term unemployed has nearly tripled during the recession.
Unprecedented in post-war era
40.2%
Long-term unemployment creates “hysteris” If allowed to persist, impacts structure of economy through potential output

© 2013 Payden & Rygel All rights reservedConfidential & ProprietaryThe Great Restructuring: Get Involved or Get Out of the Way 13
1993 1994 1995 1996 1997 1998 1999 2000 2001 2002 2003 2004 2005 2006 2007 2008 2009 2010 2011 2012
3,000
4,000
5,000
6,000
7,000
8,000
9,000
Thou
sand
s of
Wor
kers
Source: Bureau of Labor Statistics
Persons At work Part time for Economic Reasons
And Lots of Workers Still At Work Part-Time for “Economic Reasons”
© 2013 Payden & Rygel All rights reservedConfidential & ProprietaryThe Great Restructuring: Get Involved or Get Out of the Way 14
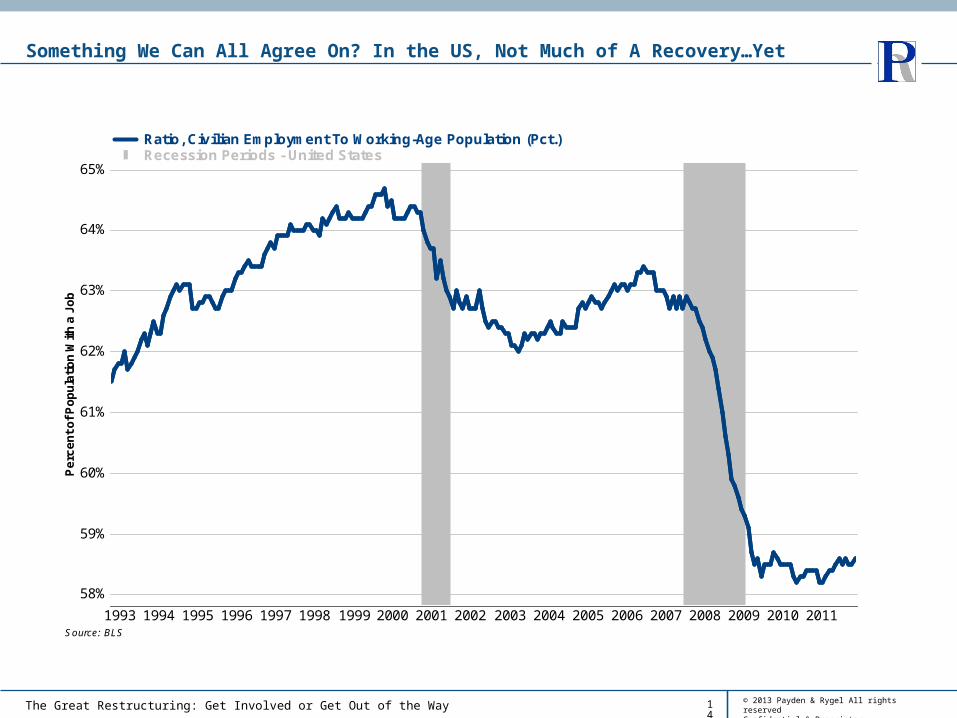
Something We Can All Agree On? In the US, Not Much of A Recovery…Yet
1993 1994 1995 1996 1997 1998 1999 2000 2001 2002 2003 2004 2005 2006 2007 2008 2009 2010 201158%
59%
60%
61%
62%
63%
64%
65%
Perc
ent o
f Pop
ulat
ion
With
a J
ob
Source: BLS
Ratio, Civilian Employment To Working-Age Population (Pct.) Recession Periods - United States
© 2013 Payden & Rygel All rights reservedConfidential & ProprietaryThe Great Restructuring: Get Involved or Get Out of the Way 15
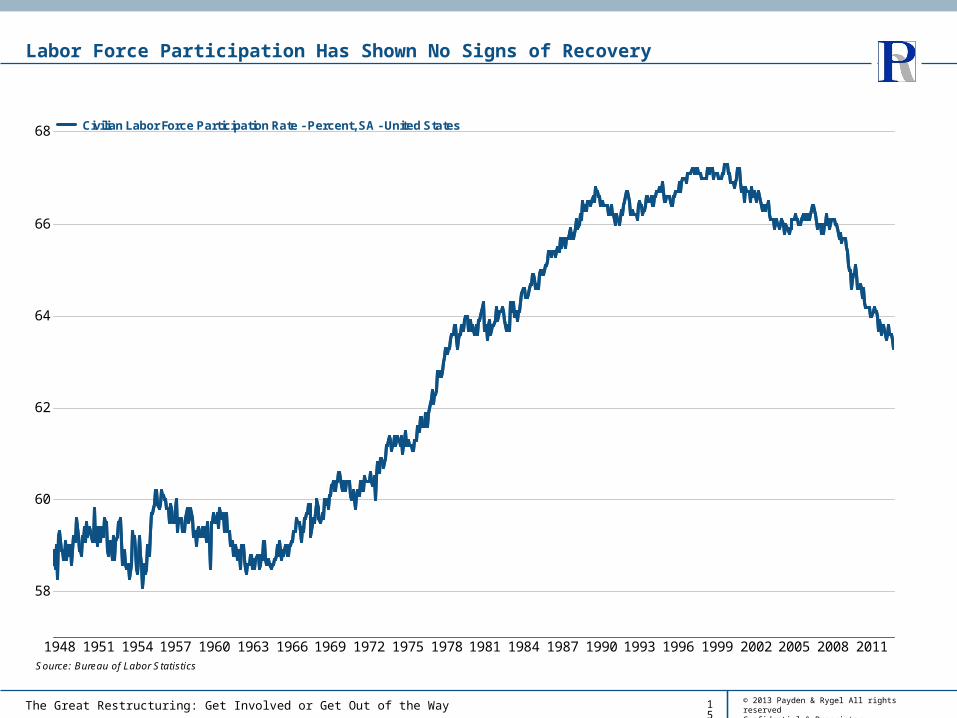
Labor Force Participation Has Shown No Signs of Recovery
1948 1951 1954 1957 1960 1963 1966 1969 1972 1975 1978 1981 1984 1987 1990 1993 1996 1999 2002 2005 2008 2011
58
60
62
64
66
68
Source: Bureau of Labor Statistics
Civilian Labor Force Participation Rate - Percent, SA - United States
© 2013 Payden & Rygel All rights reservedConfidential & ProprietaryThe Great Restructuring: Get Involved or Get Out of the Way 16
1993 1994 1995 1996 1997 1998 1999 2000 2001 2002 2003 2004 2005 2006 2007 2008 2009 2010 2011 20125,500
6,000
6,500
7,000
7,500
8,000
8,500
9,000
Thou
sand
s of
Em
ploy
ees
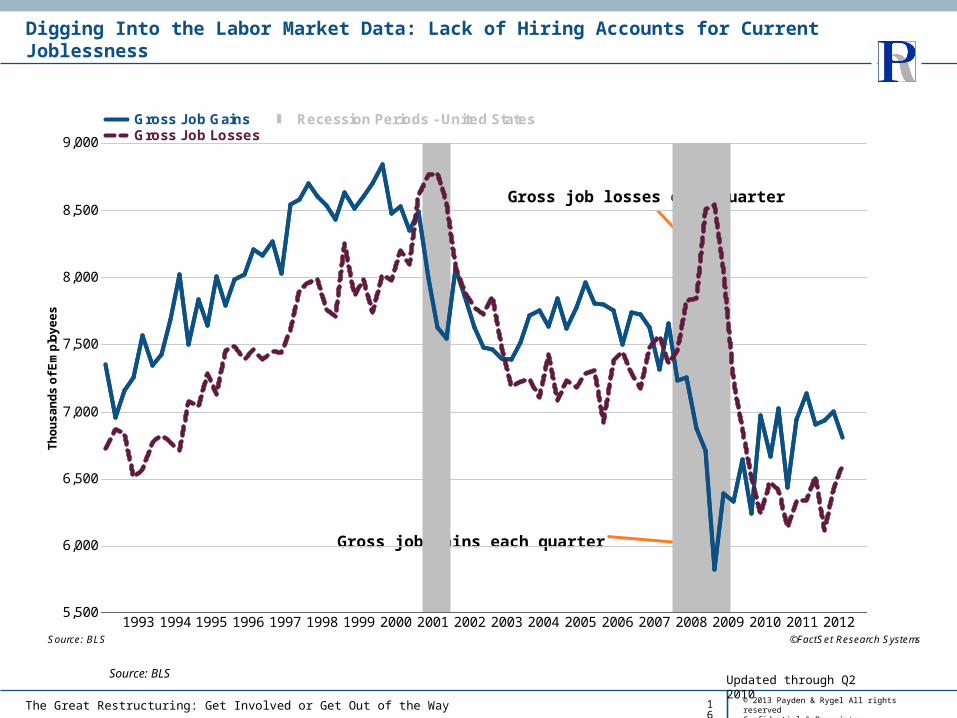
©FactSet Research SystemsSource: BLS
Gross Job GainsGross Job Losses
Recession Periods - United States
Gross job losses each quarter
Gross job gains each quarter
Updated through Q2 2010Source: BLS
Digging Into the Labor Market Data: Lack of Hiring Accounts for Current Joblessness
© 2013 Payden & Rygel All rights reservedConfidential & ProprietaryThe Great Restructuring: Get Involved or Get Out of the Way 17
2001 2002 2003 2004 2005 2006 2007 2008 2009 2010 2011 20121,400
1,600
1,800
2,000
2,200
2,400
2,600
2,800
3,000
3,200
3,400
Mon
thly
Lev
els,
Tho
usan
ds
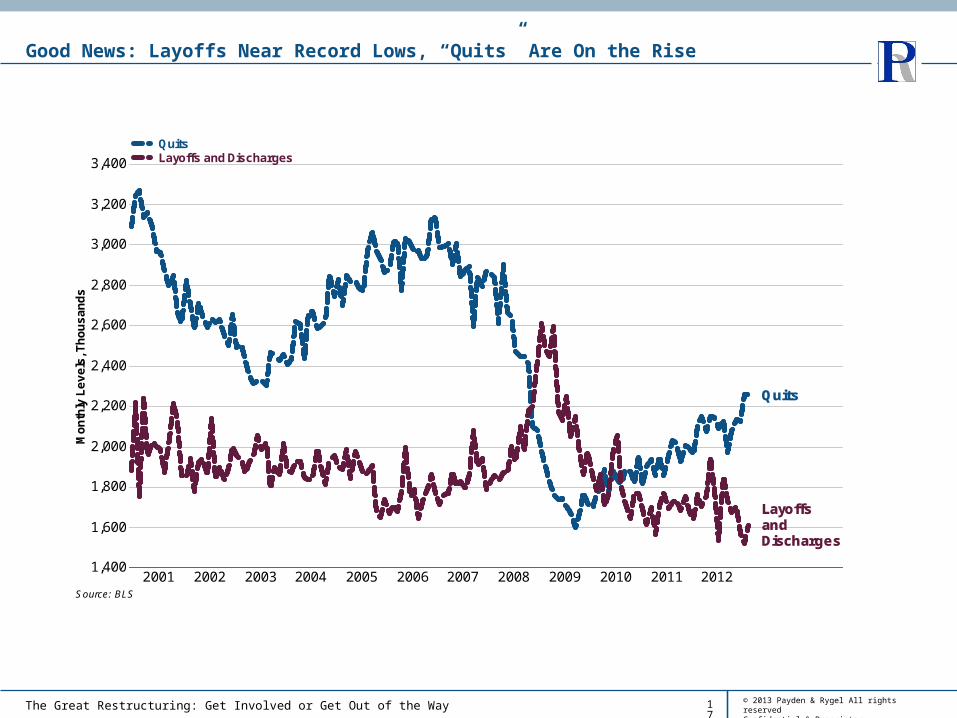
Layoffs and Discharges
Quits
Source: BLS
QuitsLayoffs and Discharges
Good News: Layoffs Near Record Lows, “Quits” Are On the Rise
© 2013 Payden & Rygel All rights reservedConfidential & ProprietaryThe Great Restructuring: Get Involved or Get Out of the Way 18
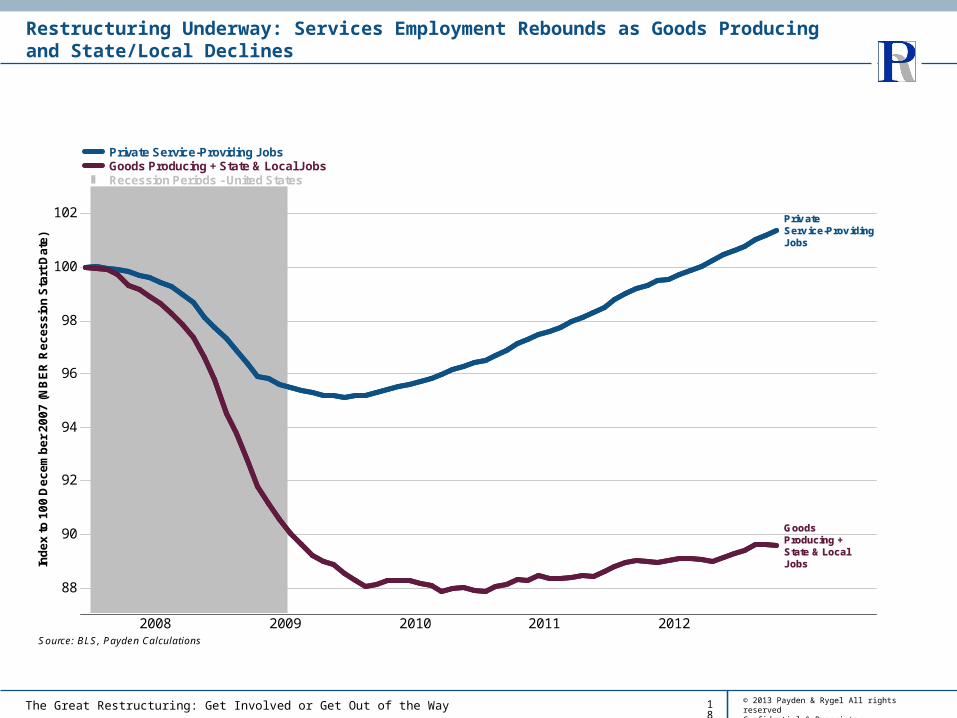
Restructuring Underway: Services Employment Rebounds as Goods Producing and State/Local Declines
2008 2009 2010 2011 2012
88
90
92
94
96
98
100
102
Inde
x to
100
Dec
embe
r 200
7 (N
BER
Rec
essi
on S
tart
Dat
e)
Goods Producing + State & Local Jobs
Priv ate Serv ice-Prov idingJobs
Source: BLS, Payden Calculations
Private Service-Providing JobsGoods Producing + State & Local JobsRecession Periods - United States
© 2013 Payden & Rygel All rights reservedConfidential & ProprietaryThe Great Restructuring: Get Involved or Get Out of the Way 19
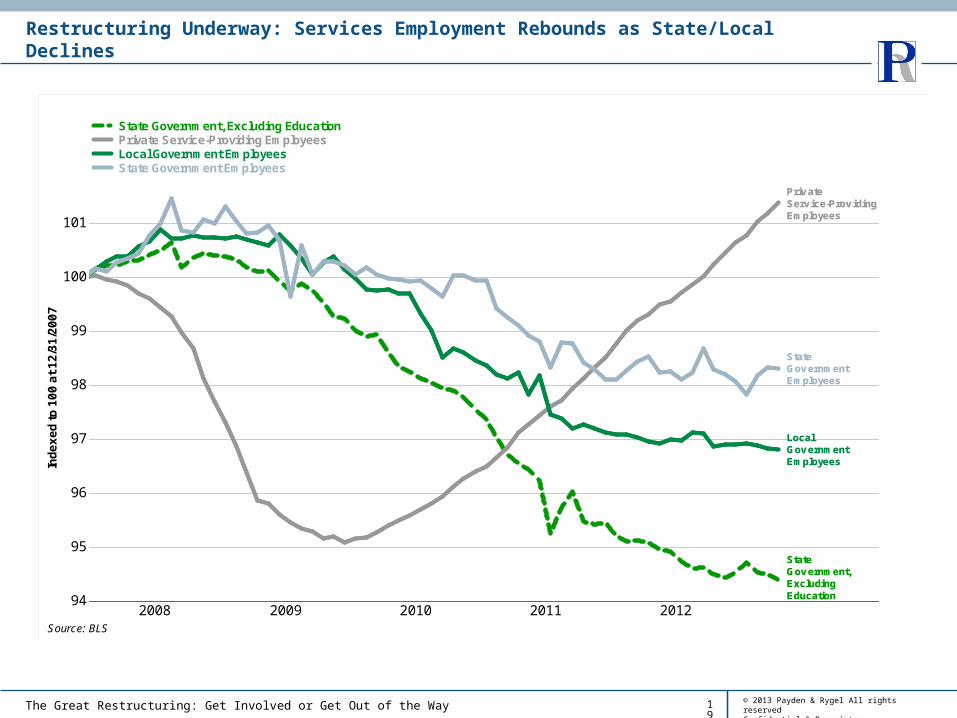
Restructuring Underway: Services Employment Rebounds as State/Local Declines
2008 2009 2010 2011 201294
95
96
97
98
99
100
101
Inde
xed
to 1
00 a
t 12/
31/2
007
State Gov ernment, Excluding Education
Local Gov ernment Employees
State Gov ernment Employees
Priv ate Serv ice-Prov idingEmployees
Source: BLS
State Government, Excluding EducationPrivate Service-Providing EmployeesLocal Government EmployeesState Government Employees
© 2013 Payden & Rygel All rights reservedConfidential & ProprietaryThe Great Restructuring: Get Involved or Get Out of the Way 20
$0.0
$500,000,000,000.0
$1,000,000,000,000.0
$1,500,000,000,000.0
$2,000,000,000,000.0
$2,500,000,000,000.0
China, People's Republic of Germany JapanUnited Kingdom United States
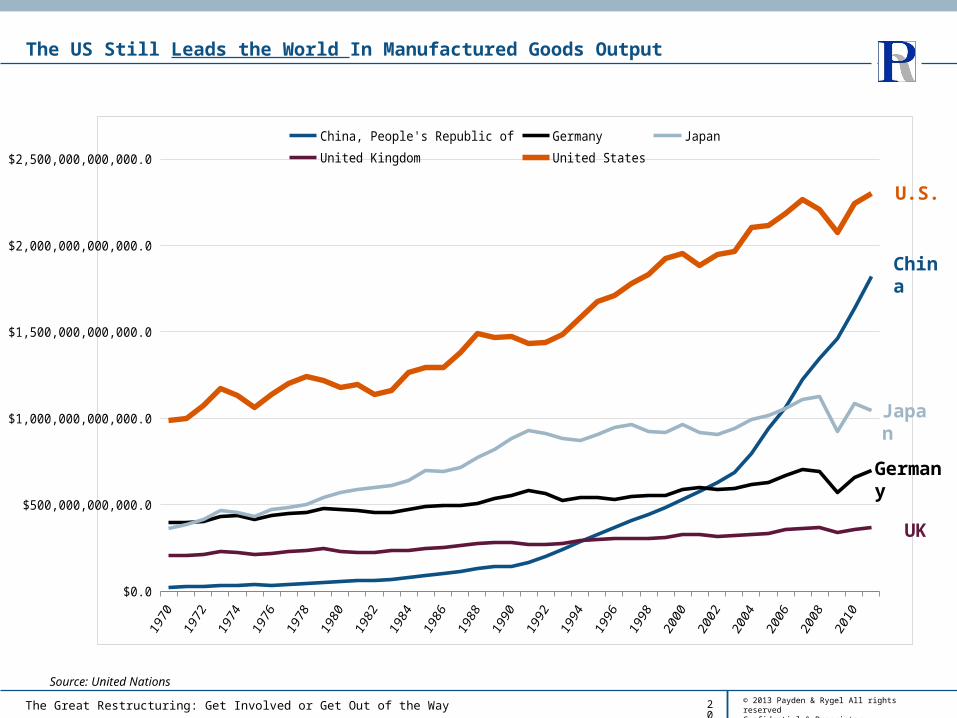
The US Still Leads the World In Manufactured Goods Output
China
U.S.
Japan
Germany
UK
Source: United Nations
© 2013 Payden & Rygel All rights reservedConfidential & ProprietaryThe Great Restructuring: Get Involved or Get Out of the Way 21
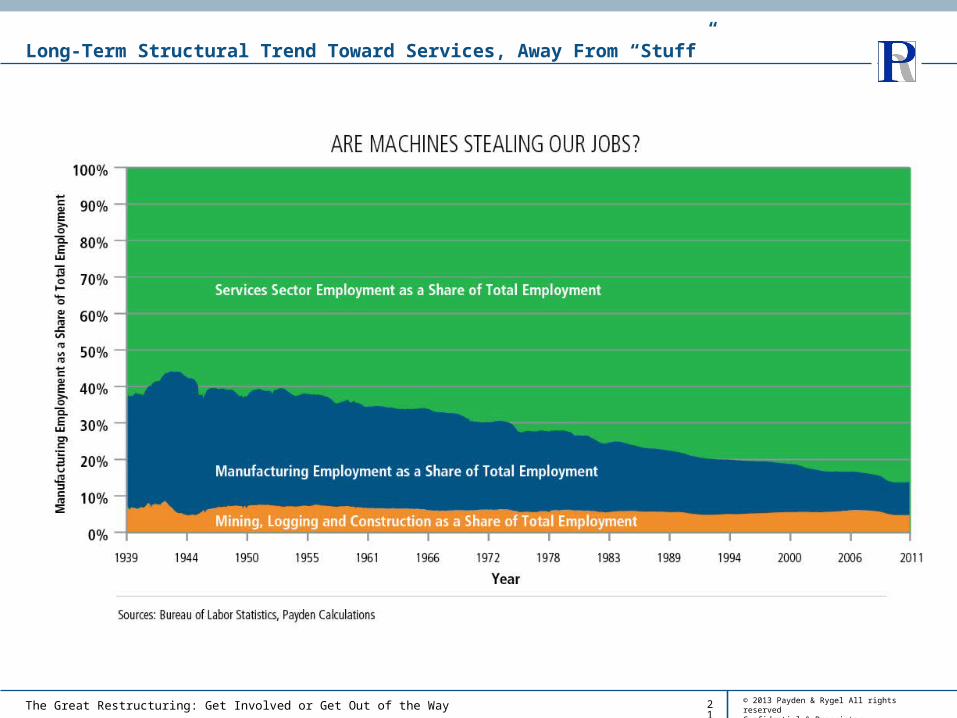
Long-Term Structural Trend Toward Services, Away From “Stuff”

© 2013 Payden & Rygel All rights reservedConfidential & ProprietaryThe Great Restructuring: Get Involved or Get Out of the Way 22
The “Roomba Effect”
Who needs a human when you have me?
© 2013 Payden & Rygel All rights reservedConfidential & ProprietaryThe Great Restructuring: Get Involved or Get Out of the Way 23
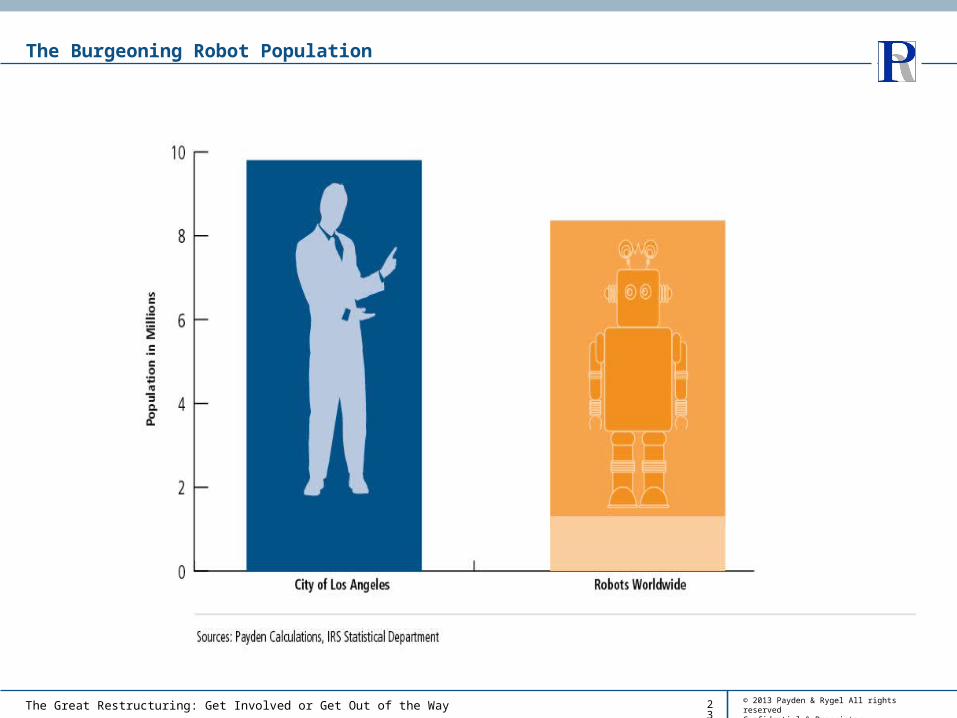
The Burgeoning Robot Population
© 2013 Payden & Rygel All rights reservedConfidential & ProprietaryThe Great Restructuring: Get Involved or Get Out of the Way 24
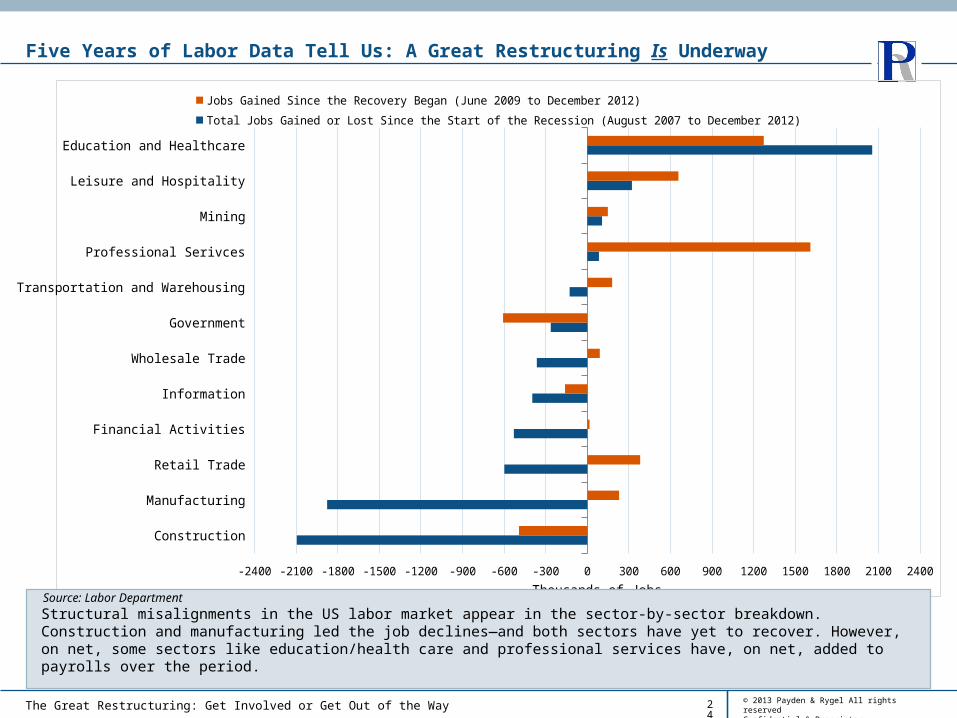
Five Years of Labor Data Tell Us: A Great Restructuring Is Underway
Construction
Manufacturing
Retail Trade
Financial Activities
Information
Wholesale Trade
Government
Transportation and Warehousing
Professional Serivces
Mining
Leisure and Hospitality
Education and Healthcare
-2400 -2100 -1800 -1500 -1200 -900 -600 -300 0 300 600 900 1200 1500 1800 2100 2400
Jobs Gained Since the Recovery Began (June 2009 to December 2012) Total Jobs Gained or Lost Since the Start of the Recession (August 2007 to December 2012)
Thousands of Jobs
Structural misalignments in the US labor market appear in the sector-by-sector breakdown. Construction and manufacturing led the job declines—and both sectors have yet to recover. However, on net, some sectors like education/health care and professional services have, on net, added to payrolls over the period.
Source: Labor Department
© 2013 Payden & Rygel All rights reservedConfidential & ProprietaryThe Great Restructuring: Get Involved or Get Out of the Way 25
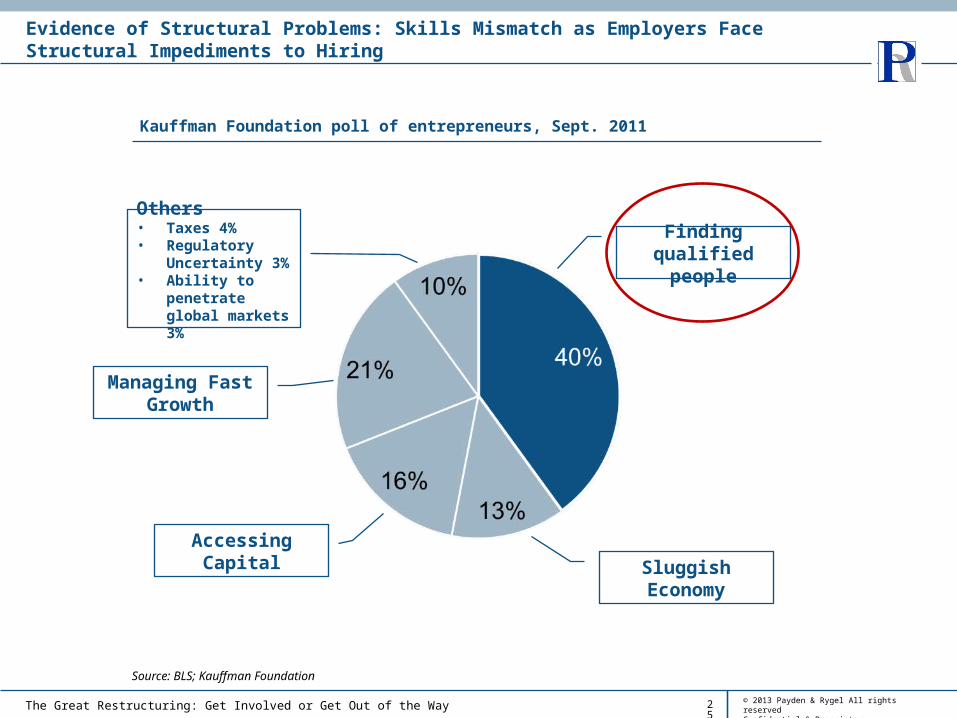
Evidence of Structural Problems: Skills Mismatch as Employers Face Structural Impediments to Hiring
Kauffman Foundation poll of entrepreneurs, Sept. 2011
Source: BLS; Kauffman Foundation
Finding qualified people
Sluggish EconomyAccessing Capital
Managing Fast Growth
Others• Taxes 4%• Regulatory
Uncertainty 3%• Ability to penetrate
global markets 3%
© 2013 Payden & Rygel All rights reservedConfidential & ProprietaryThe Great Restructuring: Get Involved or Get Out of the Way 26
-200,000
0
200,000
400,000
600,000
800,000
1,000,000
1,200,000
Net Jobs Created
Age of FirmSize of Firm
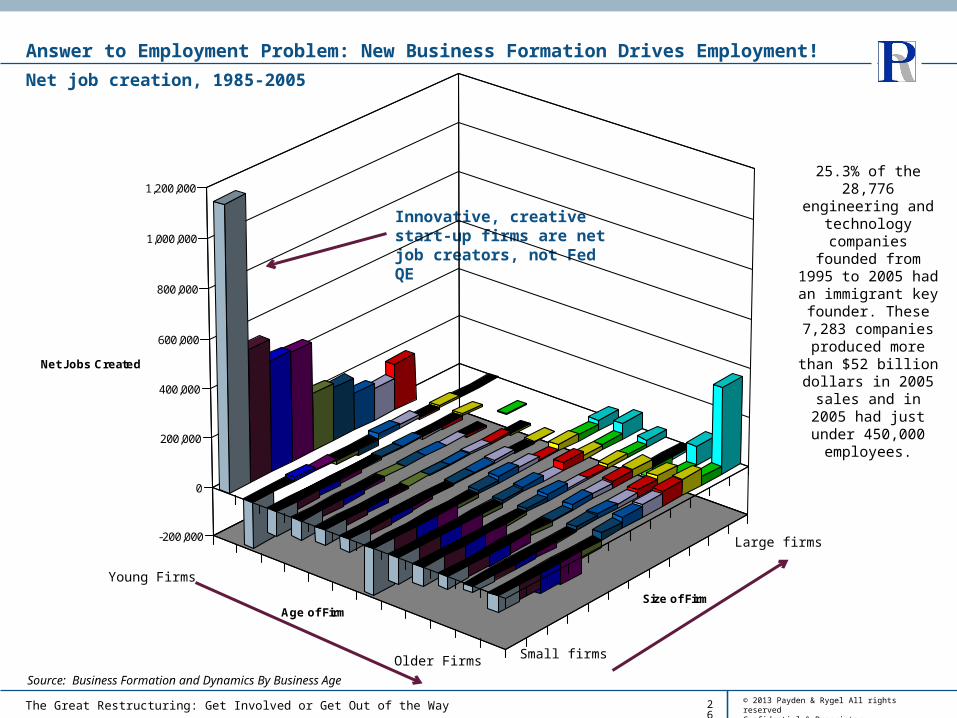
Answer to Employment Problem: New Business Formation Drives Employment!
Source: Business Formation and Dynamics By Business Age
Innovative, creative start-up firms are net job creators, not Fed QE
Young Firms
Older Firms
Large firms
Small firms
25.3% of the 28,776 engineering and
technology companies founded from 1995 to
2005 had an immigrant key founder. These 7,283 companies
produced more than $52 billion dollars in
2005 sales and in 2005 had just under 450,000
employees.
Net job creation, 1985-2005
© 2013 Payden & Rygel All rights reservedConfidential & ProprietaryThe Great Restructuring: Get Involved or Get Out of the Way 27
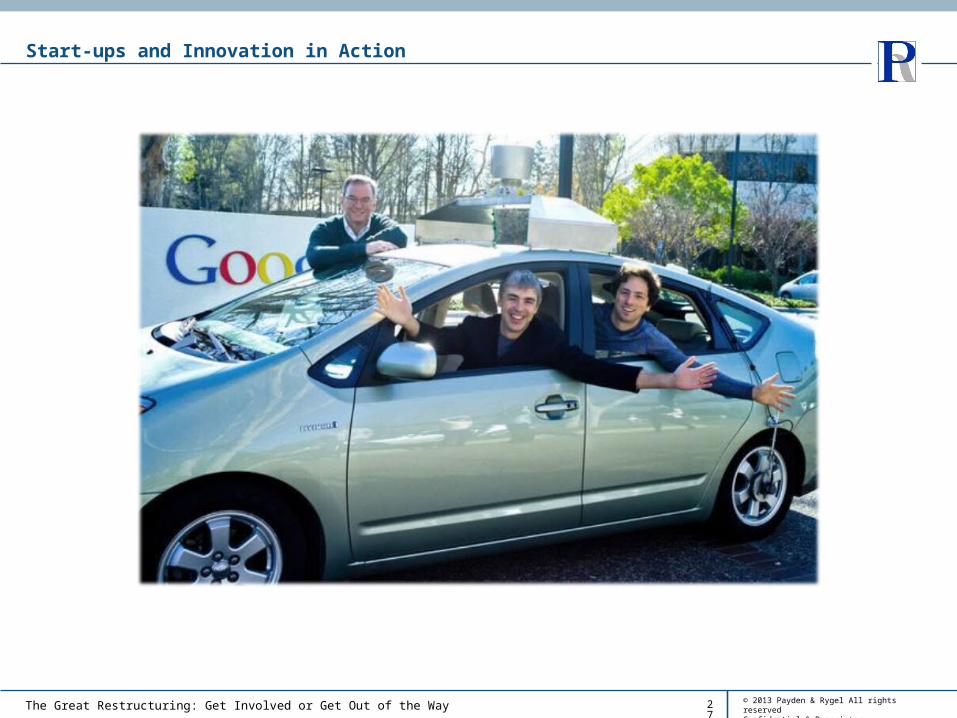
Start-ups and Innovation in Action
© 2013 Payden & Rygel All rights reservedConfidential & ProprietaryThe Great Restructuring: Get Involved or Get Out of the Way 28
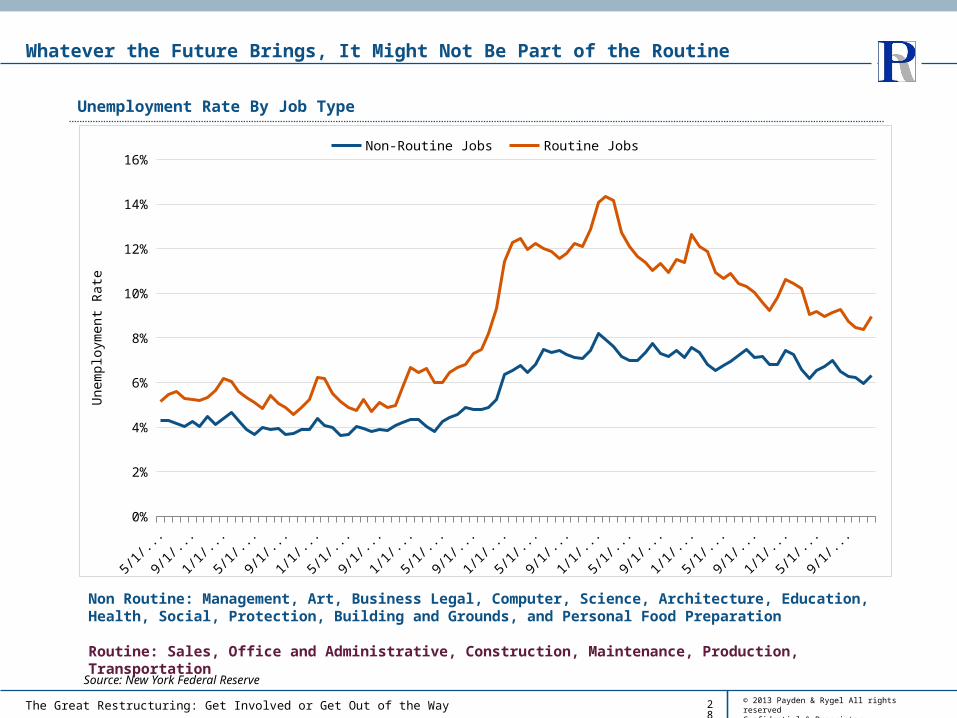
Whatever the Future Brings, It Might Not Be Part of the Routine
Unemployment Rate By Job Type
5/2005 11/2005 5/2006 11/2006 5/2007 11/2007 5/2008 11/2008 5/2009 11/2009 5/2010 11/2010 5/2011 11/2011 5/2012 11/20120%
2%
4%
6%
8%
10%
12%
14%
16%Non-Routine Jobs Routine Jobs
Une
mpl
oym
ent R
ate
Source: New York Federal Reserve
Non Routine: Management, Art, Business Legal, Computer, Science, Architecture, Education, Health, Social, Protection, Building and Grounds, and Personal Food Preparation
Routine: Sales, Office and Administrative, Construction, Maintenance, Production, Transportation
© 2013 Payden & Rygel All rights reservedConfidential & ProprietaryThe Great Restructuring: Get Involved or Get Out of the Way
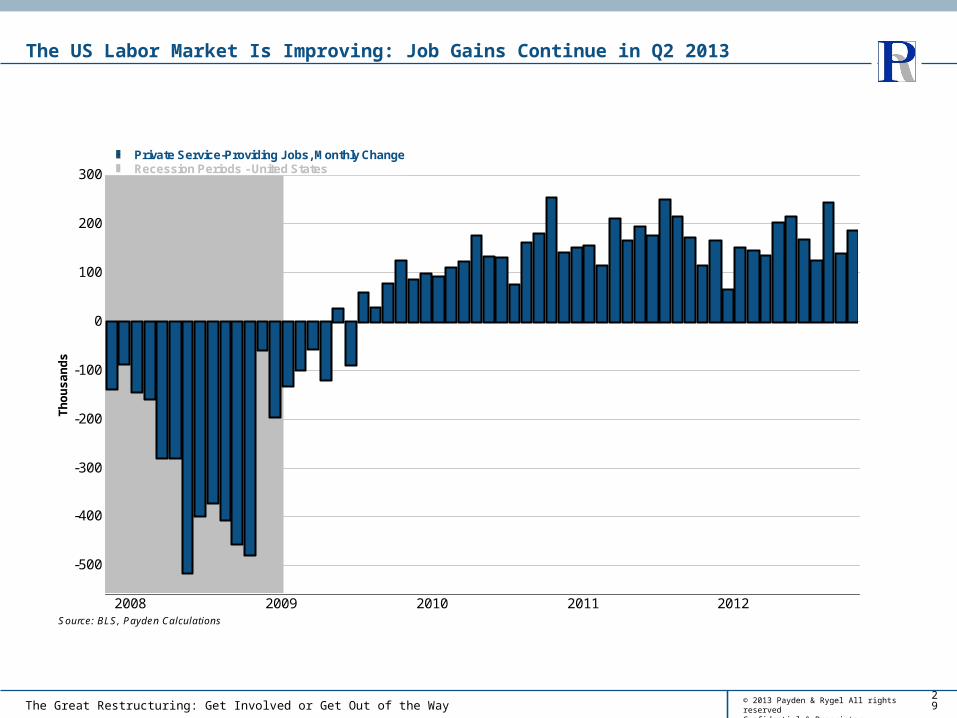
The US Labor Market Is Improving: Job Gains Continue in Q2 2013
29
2008 2009 2010 2011 2012
-500
-400
-300
-200
-100
0
100
200
300
Thou
sand
s
Source: BLS, Payden Calculations
Private Service-Providing Jobs, Monthly ChangeRecession Periods - United States
© 2013 Payden & Rygel All rights reservedConfidential & ProprietaryThe Great Restructuring: Get Involved or Get Out of the Way
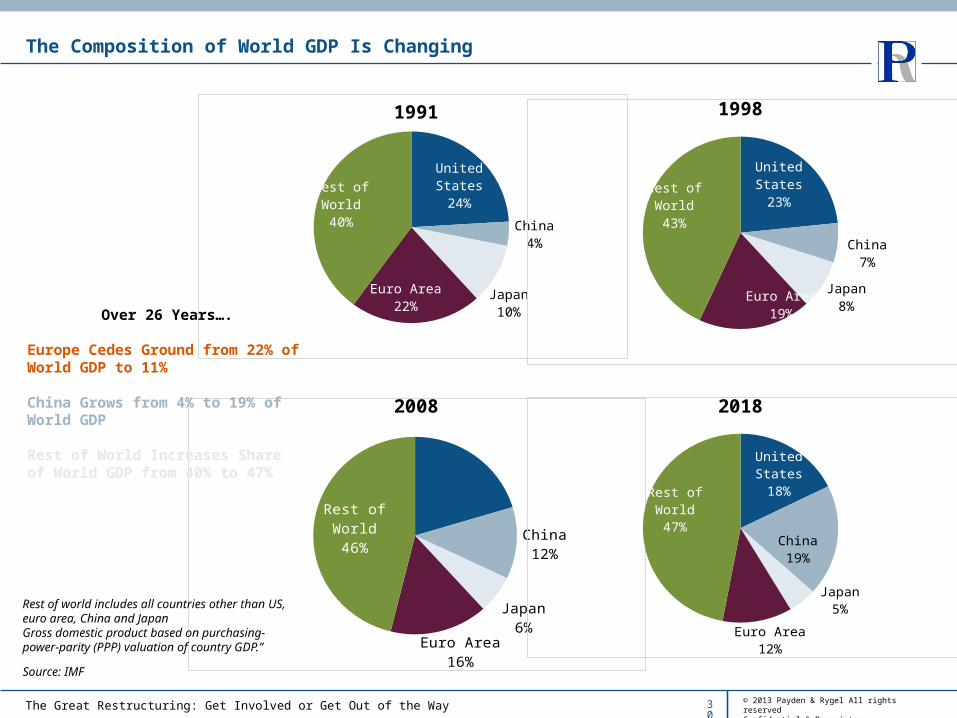
The Composition of World GDP Is Changing
30
United States24%
China4%
Japan10%
Euro Area22%
Rest of World40%
Source: IMF
United States23%
China7%
Japan8%Euro Area
19%
Rest of World43%
United States20%
China12%
Japan6%
Euro Area16%
Rest of World46%
1991 1998
2008
Over 26 Years….
Europe Cedes Ground from 22% of World GDP to 11%
China Grows from 4% to 19% of World GDP
Rest of World Increases Share of World GDP from 40% to 47% United States
18%
China19%
Japan5%
Euro Area12%
Rest of World47%
2018
Rest of world includes all countries other than US, euro area, China and JapanGross domestic product based on purchasing-power-parity (PPP) valuation of country GDP.”