Embed Size (px)
Citation preview
FLORIDA’S TURNPIKE ENTERPRISE TSM&O SUMMARY
TSM&O Workshop
June 11, 2012
FLORIDA’S TURNPIKE ENTERPRISE (FTE)
• FTE has actively pursued a number of projects & initiatives across departments that work to achieve TSM&O Goals and Objectives
• Improving Safety, Reducing Congestion and Increasing Mobility for Turnpike customers
ALL ELECTRONIC TOLLING (AET)
• All Electronic Tolling (AET) transition
– Successfully transitioned 47 miles of the Turnpike in Miami-Dade County in February 2011
– FTE is proceeding to design and contract for the funded Phases 4A, 4B, 5A, 5B, 6B, 6C and 8 of AET, including portions of Turnpike mainline, the Sawgrass Expressway, and SR 589 (Veterans Expressway and Suncoast Parkway)
– AET assists FTE towards achieving its goals of improved mobility and safety
ALL ELECTRONIC TOLLING (AET)
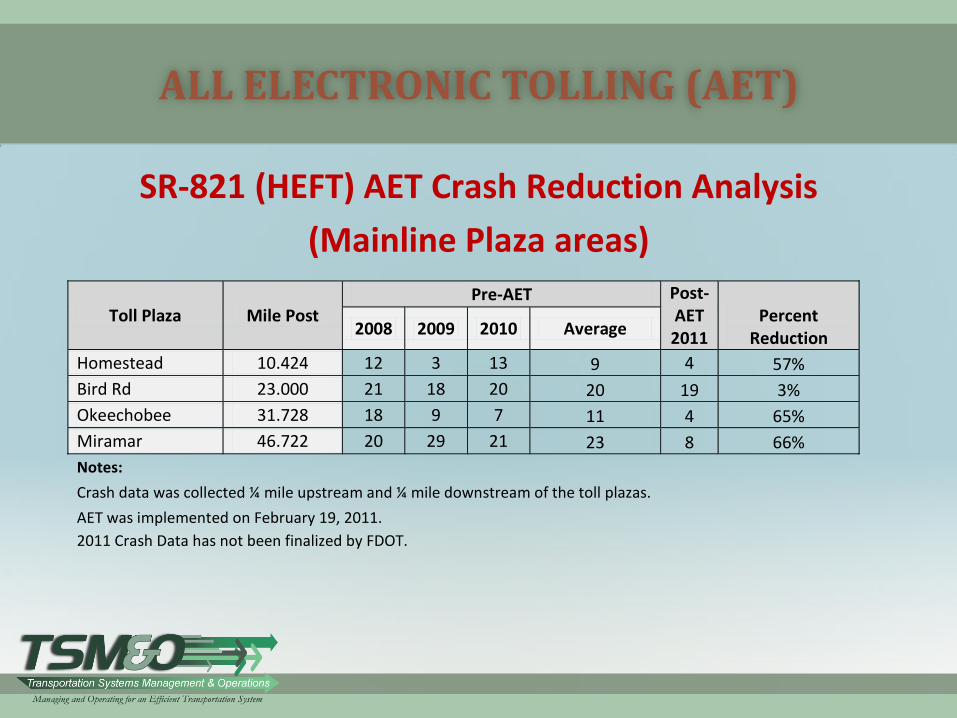
SR-821 (HEFT) AET Crash Reduction Analysis
(Mainline Plaza areas)
Toll Plaza Mile Post
Pre-AET Post-AET 2011
Percent Reduction
2008 2009 2010 Average
Homestead 10.424 12 3 13 9 4 57%
Bird Rd 23.000 21 18 20 20 19 3%
Okeechobee 31.728 18 9 7 11 4 65%
Miramar 46.722 20 29 21 23 8 66%
Notes:
Crash data was collected ¼ mile upstream and ¼ mile downstream of the toll plazas.
AET was implemented on February 19, 2011.
2011 Crash Data has not been finalized by FDOT.
ALL ELECTRONIC TOLLING (AET)
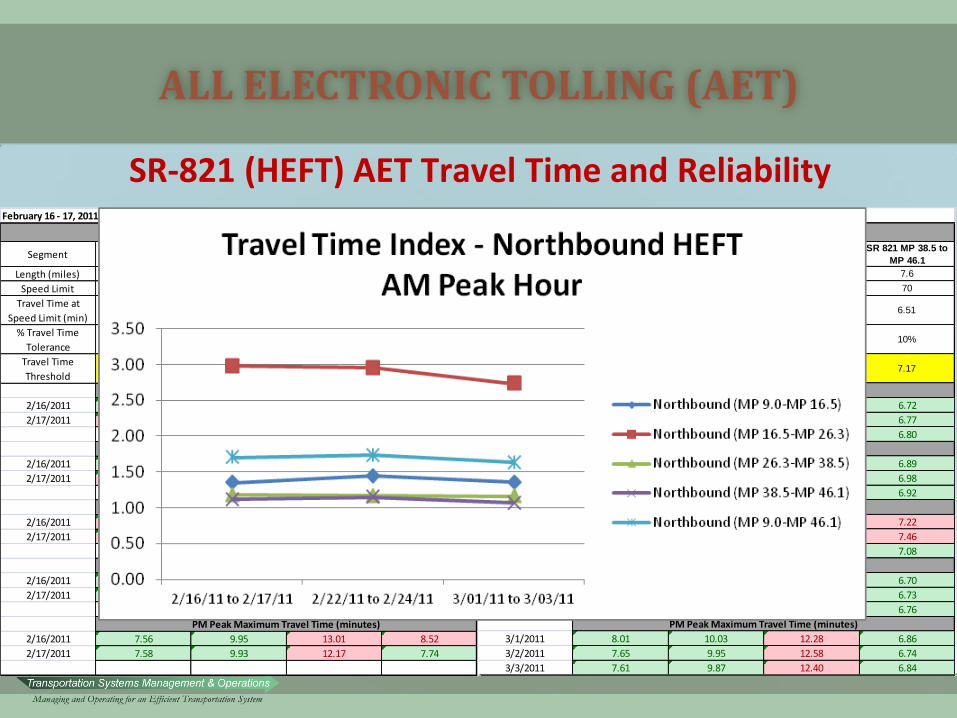
March 1 - 3, 2011 (Tuesday - Thursday)
SegmentSR 821 MP 9.0 to
MP 16.5
SR 821 MP 16.5 to
MP 26.3
SR 821 MP 26.3 to
MP 38.5
SR 821 MP 38.5 to
MP 46.1
Length (miles) 7.5 9.8 12.2 7.6
Speed Limit 60 60 70 70
Travel Time at
Speed Limit (min)7.50 9.80 10.46 6.51
% Travel Time
Tolerance10% 10% 10% 10%
Travel Time
Threshold8.25 10.78 11.50 7.17
3/1/2011 7.80 12.44 12.17 6.72
3/2/2011 7.92 12.22 12.21 6.77
3/3/2011 8.24 12.88 12.33 6.80
3/1/2011 9.15 26.09 12.05 6.89
3/2/2011 9.42 25.44 12.09 6.98
3/3/2011 12.06 28.86 12.28 6.92
3/1/2011 11.14 37.85 12.09 7.22
3/2/2011 11.54 35.22 12.16 7.46
3/3/2011 14.66 39.88 12.64 7.08
3/1/2011 7.72 9.92 12.16 6.70
3/2/2011 7.61 9.91 12.29 6.73
3/3/2011 7.59 9.85 12.31 6.76
3/1/2011 8.01 10.03 12.28 6.86
3/2/2011 7.65 9.95 12.58 6.74
3/3/2011 7.61 9.87 12.40 6.84
Northbound
Daily Average Travel Time (minutes)
AM Peak Average Travel Time (minutes)
AM Peak Maximum Travel Time (minutes)
PM Peak Average Travel Time (minutes)
PM Peak Maximum Travel Time (minutes)
February 16 - 17, 2011 (Wednesday - Thursday)
SegmentSR 821 MP 9.0 to
MP 16.5
SR 821 MP 16.5 to
MP 26.3
SR 821 MP 26.3 to
MP 38.5
SR 821 MP 38.5 to
MP 47.1
Length (miles) 7.5 9.8 12.2 8.6
Speed Limit 60 60 70 70
Travel Time at
Speed Limit (min)7.50 9.80 10.46 7.37
% Travel Time
Tolerance10% 10% 10% 10%
Travel Time
Threshold8.25 10.78 11.50 8.11
2/16/2011 7.97 11.97 12.25 7.61
2/17/2011 8.37 14.50 12.21 7.70
2/16/2011 8.20 23.27 12.47 7.90
2/17/2011 12.08 35.05 12.15 8.55
2/16/2011 9.35 32.66 13.16 8.39
2/17/2011 14.83 60.17 12.29 9.64
2/16/2011 7.55 9.90 12.45 7.83
2/17/2011 7.57 9.89 12.14 7.62
2/16/2011 7.56 9.95 13.01 8.52
2/17/2011 7.58 9.93 12.17 7.74
PM Peak Maximum Travel Time (minutes)
Northbound
Daily Average Travel Time (minutes)
AM Peak Average Travel Time (minutes)
AM Peak Maximum Travel Time (minutes)
PM Peak Average Travel Time (minutes)
SR-821 (HEFT) AET Travel Time and Reliability
INTELLIGENT TRANSPORTATION SYSTEMS/ INCIDENT MANAGEMENT
• Customer safety is goal number one
• Highway Operations initiatives have contributed to 68% less fatalities, 20% less crashes, 18% reduced incident duration
• Interagency Outreach - TIM
– Communicating, Coordinating, Cooperating - Responder Agencies
• Key Incident Management programs
– ITS system-wide full deployment
– Traffic Management Center (TMC) Operations
– Road Rangers/Safety Patrol
– Rapid Incident Scene Clearance (RISC)
– Specialty Towing and Roadside Repair (STARR)
INTELLIGENT TRANSPORTATION SYSTEMS/ INCIDENT MANAGEMENT
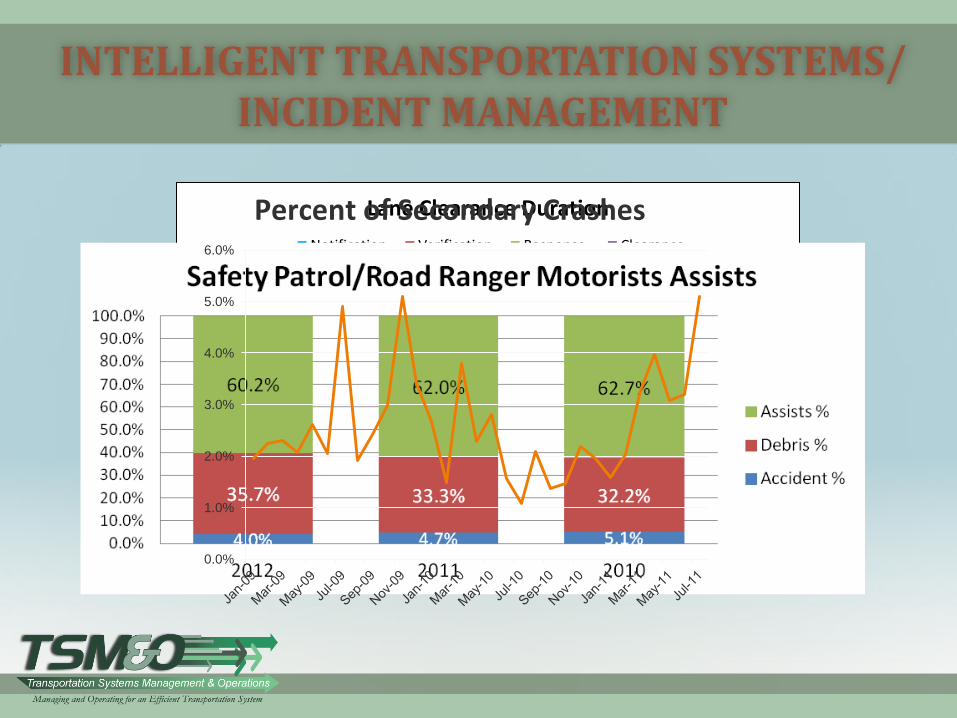
2.0
2.1
2.1
4.6
4.6
4.4
41.0
40.0
41.3
2010
2011
2012
Lane Clearance Duration
Notification Verification Response Clearance
47.1 Min
48.1 Min
48.2 Min
0.4
0.5
0.5
0.0%
1.0%
2.0%
3.0%
4.0%
5.0%
6.0%
Percent of Secondary Crashes
EFFICIENCY/HIGH CRASH LOCATION PROJECTS
• FTE identified projects that can be expedited to improve localized, isolated congestion and/or safety conditions
• Projects are fast-tracked: – Through Planning or Traffic Operations analysis
– Work Program budgeting
– Design/Production concepts, review and plans
– Operations lettings through Construction or Maintenance
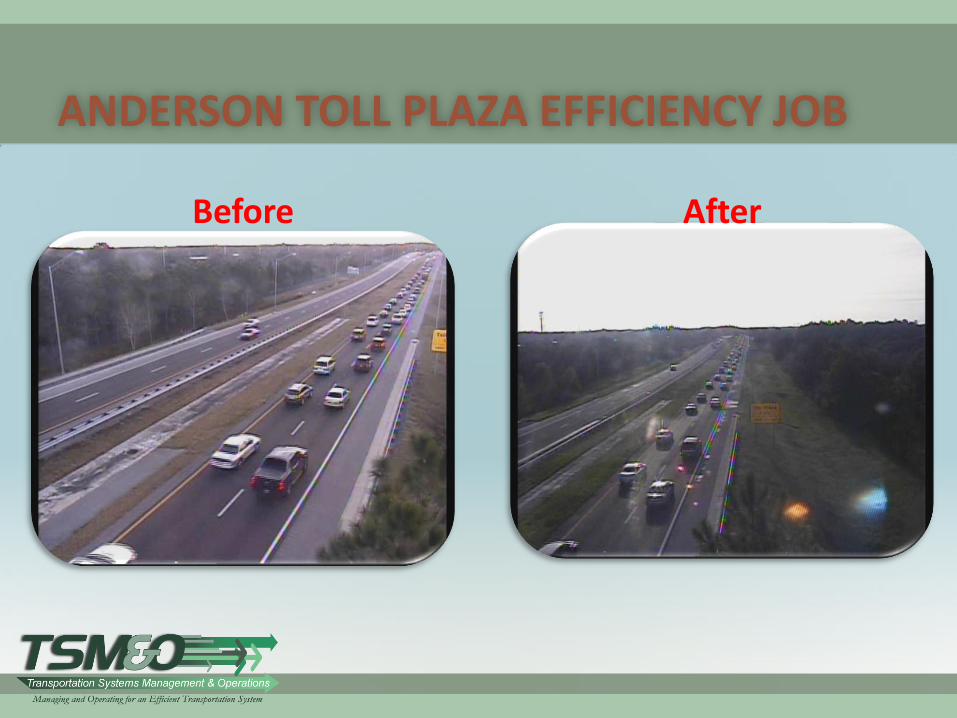
ANDERSON TOLL PLAZA EFFICIENCY JOB
Before After
AUXILIARY LANES – BIRD ROAD TO SW 8 STREET
• AET Conversion set baseline of improvement – NB and SB directions
– NB Average Peak Hour Travel Time reduction from 29.2 to 24.9 minutes (SW 152 Street to SR 836)
• Opening of Aux Lanes in Feb ’12: – NB Average Peak Hour Travel Time reduction from
24.9 to 13.7 minutes (SW 152 Street to SR 836)
– 11.2 minutes of additional average delay reduced for Mainline HEFT customers from 7:15 to 8:15 AM
– 75% overall reduction of average AM recurring delays
INNOVATIVE AND PERFORMANCE-BASED CONTRACTING
• Safety and Mobility Goals
• Active Payment/Innovative Contracting mechanism to use performance incentives in a Turnpike widening improvement project
• Collect average travel time information pre-construction
• Use travel reliability, incident management and safety measures to assess the impact upon customers
• Create a vested interest for Roadway Contractor:
– Response to incidents in active way
– Minimize construction zone impacts to traffic/mobility
– Review traffic control plan measures
INTEGRATED CONGESTION PRICING PLAN (ICPP)
• Study by Planning and involving input from Design/ Production, Toll Operations, Communications/PIO & Traffic Operations – Study began in February 2011; A comprehensive
evaluation of potential for congestion pricing concepts along the Turnpike System
– Phase 1 completed in Dec. 2011 and Phase 2 underway
– Goal is to determine where, when, and how Congestion Pricing can be used on the Turnpike to improve mobility
– Urban facilities in Southeast Florida, Tampa, and Orlando
– Among first in the nation to consider a large-scale program of value pricing on an existing toll system
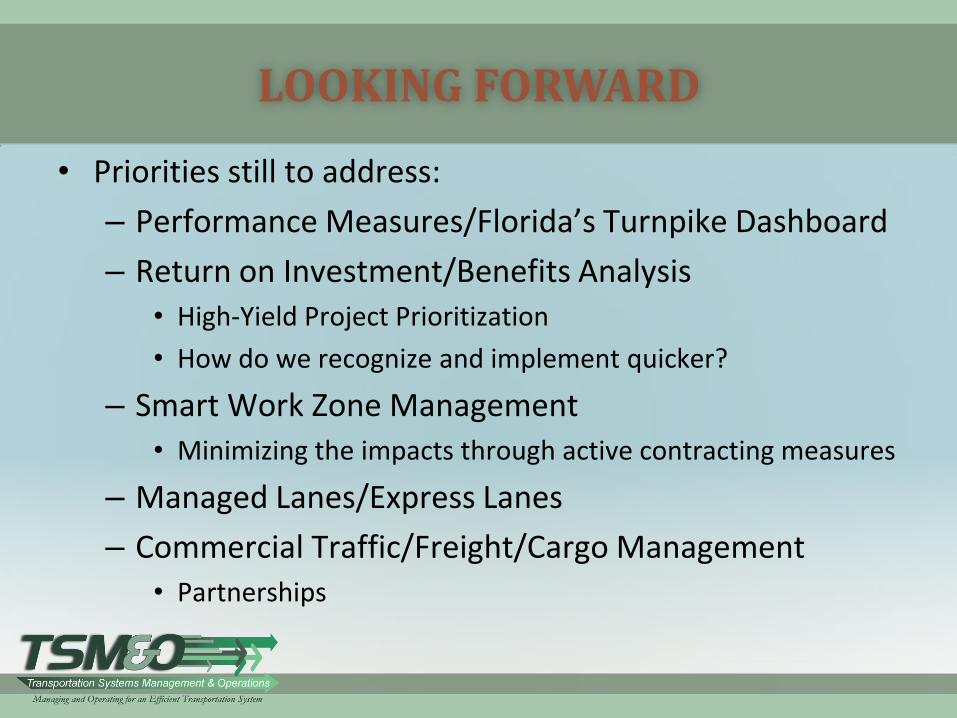
LOOKING FORWARD
• Priorities still to address:
– Performance Measures/Florida’s Turnpike Dashboard
– Return on Investment/Benefits Analysis
• High-Yield Project Prioritization
• How do we recognize and implement quicker?
– Smart Work Zone Management
• Minimizing the impacts through active contracting measures
– Managed Lanes/Express Lanes
– Commercial Traffic/Freight/Cargo Management
• Partnerships
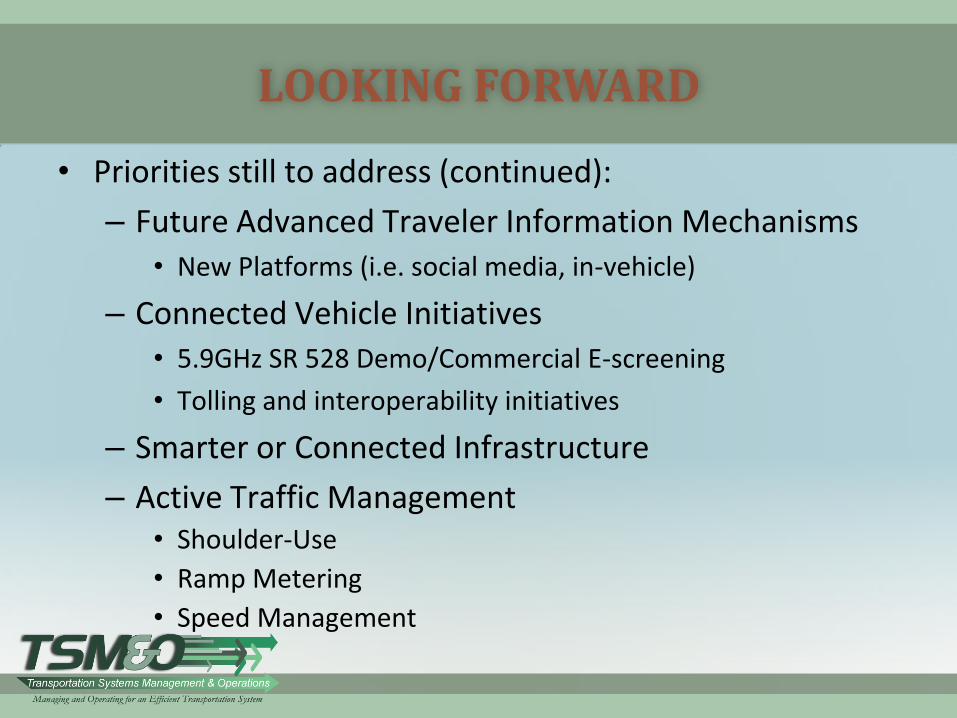
LOOKING FORWARD
• Priorities still to address (continued):
– Future Advanced Traveler Information Mechanisms
• New Platforms (i.e. social media, in-vehicle)
– Connected Vehicle Initiatives
• 5.9GHz SR 528 Demo/Commercial E-screening
• Tolling and interoperability initiatives
– Smarter or Connected Infrastructure
– Active Traffic Management • Shoulder-Use
• Ramp Metering
• Speed Management
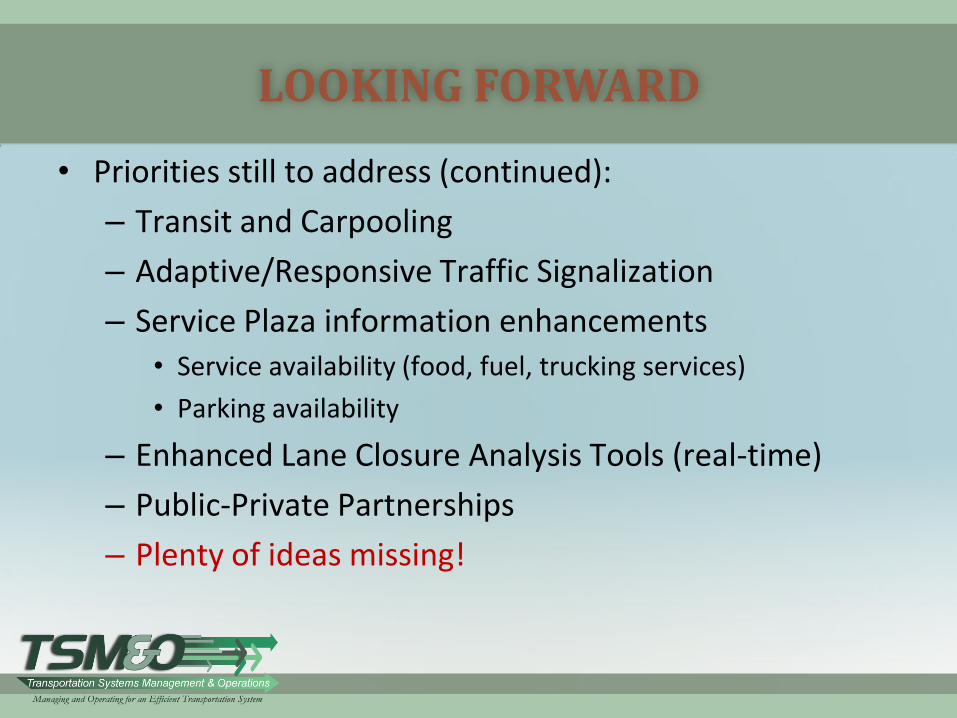
LOOKING FORWARD
• Priorities still to address (continued):
– Transit and Carpooling
– Adaptive/Responsive Traffic Signalization
– Service Plaza information enhancements
• Service availability (food, fuel, trucking services)
• Parking availability
– Enhanced Lane Closure Analysis Tools (real-time)
– Public-Private Partnerships
– Plenty of ideas missing!
QUESTIONS ?
16