Embed Size (px)
Citation preview
FINAL MARCH 2014
LOOP 9 SOUTHEAST
CORRIDOR/FEASIBILITY STUDY
Volume I: Text and Exhibits
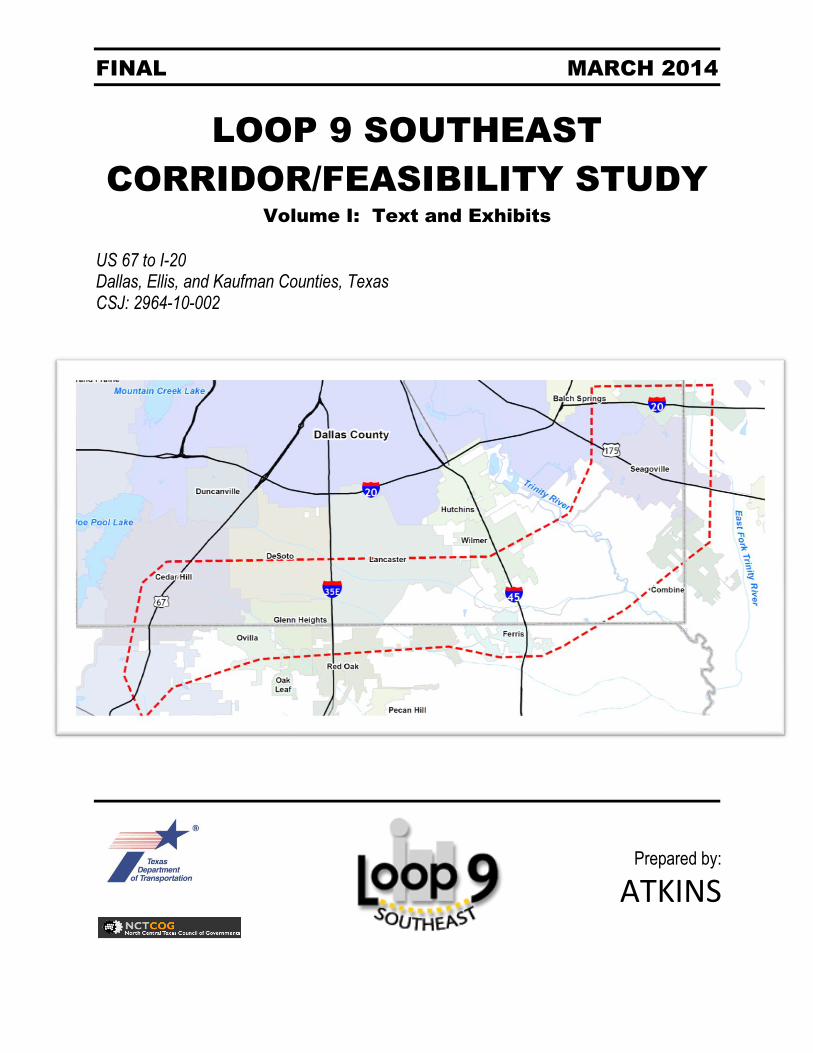
US 67 to I-20 Dallas, Ellis, and Kaufman Counties, Texas CSJ: 2964-10-002
Prepared by:
ATKINS
CORRIDOR/FEASIBILITY STUDY
Loop 9 Southeast
From US 67 to I-20 Dallas, Ellis, and Kaufman Counties, Texas
CSJ: 2964-10-002
Prepared by:
ATKINS
March 14, 2014

Loop 9 Southeast Corridor/Feasibility Study
i
TABLE OF CONTENTS
EXECUTIVE SUMMARY .............................................................................................................................. ES-1 A. Introduction ................................................................................................................................ ES-1 B. Study Approach ........................................................................................................................... ES-3 C. Overview of the Study Area ......................................................................................................... ES-3 D. Need and Purpose ....................................................................................................................... ES-4 E. Regional Planning Context ........................................................................................................... ES-5 F. Affected Environment ................................................................................................................. ES-5 G. Agency and Public Involvement .................................................................................................. ES-5 H. Corridor Development and Evaluation ........................................................................................ ES-5 I. Traffic Analysis ............................................................................................................................. ES-6 J. Costs ............................................................................................................................................ ES-7 K. Recommended Program of Projects ........................................................................................... ES-7 L. Construction Phasing ................................................................................................................... ES-9 M. Program of Projects ................................................................................................................... ES-10 N. Funding...................................................................................................................................... ES-10 O. Future Engineering and Environmental Studies ........................................................................ ES-10 N. Conclusion ................................................................................................................................. ES-12
1. INTRODUCTION ....................................................................................................................................... 1 A. Project History .................................................................................................................................. 1
2. STUDY APPROACH ................................................................................................................................... 4 A. Overview of the Study Area .............................................................................................................. 4 B. Planning and Environment Linkages (PEL) Approach ....................................................................... 5
1) Program Overview ..................................................................................................................... 5 2) Regulations and Guidance ......................................................................................................... 6
C. Goals of the Corridor/Feasibility Study ............................................................................................. 7 3. NEED AND PURPOSE ................................................................................................................................ 8
A. Need for Loop 9 Southeast ............................................................................................................... 8 1) Growth ....................................................................................................................................... 8 2) Transportation Demand ........................................................................................................... 11 3) Linkages ................................................................................................................................... 12 4) Economic Development Opportunities .................................................................................... 13
IIPOD ...................................................................................................................................... 13 B. Purpose of Loop 9 Southeast ......................................................................................................... 14
4. STUDY AREA CHARACTERISTICS ............................................................................................................. 16 A. Regional Planning Context .............................................................................................................. 16 B. Planned Economic Development/Projected Growth ..................................................................... 19
1) Balch Springs ............................................................................................................................ 19 2) Cedar Hill ................................................................................................................................. 19 3) Combine................................................................................................................................... 19 4) DeSoto ..................................................................................................................................... 20 5) Ferris ........................................................................................................................................ 20 6) Glenn Heights .......................................................................................................................... 20 7) Lancaster ................................................................................................................................. 20 8) Mesquite .................................................................................................................................. 21 9) Midlothian ............................................................................................................................... 21
Loop 9 Southeast Corridor/Feasibility Study
ii
10) Oak Leaf ................................................................................................................................... 22 11) Ovilla ........................................................................................................................................ 22 12) Red Oak .................................................................................................................................... 22 13) Seagoville ................................................................................................................................. 23 14) Wilmer ..................................................................................................................................... 23
C. Transportation System ................................................................................................................... 23 1) Existing and Planned Transportation System ........................................................................... 23 2) Interstate Highway System ...................................................................................................... 27 3) Principal Highways ................................................................................................................... 27 4) Regional Arterial System .......................................................................................................... 27 5) Transit ...................................................................................................................................... 28 6) Non-Motorized Transportation Modes .................................................................................... 30 7) Freight Railroad and Truck Facilities ........................................................................................ 30 8) Airports .................................................................................................................................... 30
5. AFFECTED ENVIRONMENT ..................................................................................................................... 31 A. Data Sources .................................................................................................................................. 31
1) Historical Information .............................................................................................................. 31 2) 2012 and 2013 Updated Data .................................................................................................. 31
Desktop Analysis ...................................................................................................................... 31 Windshield Survey ................................................................................................................... 31
B. Social Conditions ............................................................................................................................ 31 1) Land Use .................................................................................................................................. 31
US 67 to I-35E .......................................................................................................................... 32 I-35E to I-45 ............................................................................................................................. 32 I-45 to I-20 ............................................................................................................................... 32
2) Community Resources ............................................................................................................. 33 3) Cultural Resources ................................................................................................................... 33
Non-Archeological Historic-Age Resources .............................................................................. 33 Archeology ............................................................................................................................... 34
4) Parklands and Recreational Areas ............................................................................................ 34 5) Visual Quality and Aesthetics ................................................................................................... 35 6) Utilities ..................................................................................................................................... 35
C. Economic Conditions ...................................................................................................................... 35 1) Employment ............................................................................................................................ 35
D. Air Quality ....................................................................................................................................... 38 E. Water Resources ............................................................................................................................ 38 F. Biological Resources ....................................................................................................................... 39
1) Vegetation ............................................................................................................................... 39 2) Habitat ..................................................................................................................................... 39
Bottomland Hardwood Forest ................................................................................................. 40 Wooded Riparian Corridor ....................................................................................................... 40 Wooded Fence Line ................................................................................................................. 40 Rangeland ................................................................................................................................ 40 Juniper Savannah ..................................................................................................................... 41 Wooded Upland ....................................................................................................................... 41 Cropland .................................................................................................................................. 41 Scrub/Shrub ............................................................................................................................. 41 Mixed Hardwood Juniper Woodland ....................................................................................... 41

Loop 9 Southeast Corridor/Feasibility Study
iii
Disturbed Floodplain ................................................................................................................ 41 Developed ................................................................................................................................ 42 Water ...................................................................................................................................... 42
3) Threatened and Endangered Species ...................................................................................... 42 G. Regulated Materials ....................................................................................................................... 45 H. Floodplains and Drainage Patterns ................................................................................................. 45
6. AGENCY AND PUBLIC INVOLVEMENT .................................................................................................... 46 A. List of Meetings .............................................................................................................................. 46 B. State and Federal Agency Coordination ......................................................................................... 47
1) Resource Agency Webinar ....................................................................................................... 47 C. Local Government Coordination .................................................................................................... 48
1) November and December 2012 Local Interviews .................................................................... 48 D. Regional Task Force Meetings ........................................................................................................ 48
1) October 2012 Introductory Meeting ....................................................................................... 49 2) February and April 2013 Regional Task Force Meetings .......................................................... 49 3) August 2013 Regional Task Force Meetings ............................................................................ 49
E. Major Stakeholder Coordination .................................................................................................... 50 F. Public Meetings .............................................................................................................................. 50
1) May 2013 ................................................................................................................................. 50 2) September 2013 ...................................................................................................................... 50
G. Presentations ................................................................................................................................. 51 H. Loop 9 Southeast Website ............................................................................................................. 51 I. Database/Mailing List ..................................................................................................................... 52 J. Summary of Comments .................................................................................................................. 52
7. CORRIDOR DEVELOPMENT AND EVALUATION ....................................................................................... 54 A. Development of Corridors .............................................................................................................. 55
1) Proposed Design Criteria ......................................................................................................... 55 2) Corridor Width and Typical Section ......................................................................................... 55 3) Revisions and Adjustments to Previous Corridor Locations ..................................................... 56
Lake Ridge Parkway and US 67 ................................................................................................ 56 Connect DEIS Alternative 1 to Lake Ridge Parkway ................................................................. 59 Glenn Heights Shift .................................................................................................................. 60 Reindeer Road Shift South ....................................................................................................... 61 Reindeer Road Shift North ....................................................................................................... 62 Eliminating DEIS Alternative 2 from I-35E to Nokomis Road ................................................... 62 Skyline Landfill Shift ................................................................................................................. 64 Ballard Road Shift ..................................................................................................................... 66 Combine Road to Malloy Bridge Road Shift ............................................................................. 67
B. Refined Loop 9 Corridor ................................................................................................................. 68 C. Potential Social and Natural Environmental Impacts ..................................................................... 68
1) Design Considerations and Environmental Constraints ........................................................... 70 D. Traffic Analysis ................................................................................................................................ 71
1) Interchanges ............................................................................................................................ 74 E. Costs ............................................................................................................................................... 76 F. Evaluation of Corridors ................................................................................................................... 76
8. RECOMMENDED PROGRAM OF PROJECTS ............................................................................................ 79 A. Major Corridors and Logical Termini .............................................................................................. 79 B. Construction Phasing ...................................................................................................................... 81
Loop 9 Southeast Corridor/Feasibility Study
iv
C. Program of Projects ........................................................................................................................ 84 9. NEXT STEPS ........................................................................................................................................... 85
A. Funding........................................................................................................................................... 85 B. ROW Preservation and Acquisition................................................................................................. 85 C. Future Engineering and Environmental Studies ............................................................................. 86 D. Potential Minimization of Effects and Mitigation Strategies .......................................................... 87
10. CONCLUSION ......................................................................................................................................... 88 11. REFERENCES .......................................................................................................................................... 90
Figures Figure ES-1: Loop 9 Southeast Planning History Timeline ....................................................................... ES-2 Figure ES-2: Study Area Map ................................................................................................................... ES-4 Figure ES-3: Major Corridors and Logical Termini ................................................................................... ES-8 Figure ES-4: Construction Phasing Options ............................................................................................. ES-9 Figure ES-6: Project Schedule ................................................................................................................ ES-11 Figure 1-1: Loop 9 Southeast Planning History Timeline .............................................................................. 3 Figure 2-1: Study Area Map .......................................................................................................................... 4 Figure 2-2: Corridor/Feasibility Study Approach .......................................................................................... 5 Figure 3-1: IIPOD ........................................................................................................................................ 14 Figure 4-1: Major Facilities Within The Study Area .................................................................................... 24 Figure 4-2: Mobility 2035 – 2013 Update Funded Roadway Recommendations ....................................... 25 Figure 4-3: Mobility 2035 – 2013 Update Funded Passenger Rail Improvements ...................................... 26 Figure 4-4: DART Rail System Map ............................................................................................................. 29 Figure 7-1: Loop 9 Southeast DEIS Alternatives .......................................................................................... 54 Figure 7-2: DEIS Typical Section .................................................................................................................. 55 Figure 7-3: Corridor/Feasibility Study Typical Section ................................................................................ 56 Figure 7-4: Lake Ridge Parkway and US 67 ................................................................................................. 58 Figure 7-5: Connect DEIS Alternative 1 to Lake Ridge Parkway .................................................................. 59 Figure 7-6: Glenn Heights Shift ................................................................................................................... 60 Figure 7-7: Reindeer Road Shift South ........................................................................................................ 61 Figure 7-8: Reindeer Road Shift North........................................................................................................ 62 Figure 7-9: Eliminating DEIS Alternative 2 from I-35E to SH 342 ................................................................ 63 Figure 7-10: Eliminating DEIS Alternative 2 from SH 342 to Nokomis Road ............................................... 63 Figure 7-11: Skyline Landfill Shift (East of Skyline Landfill) ......................................................................... 65 Figure 7-12: Skyline Landfill Shift (West of Skyline Landfill)........................................................................ 65 Figure 7-13: Ballard Road Shift ................................................................................................................... 66 Figure 7-14: Combine Road to Malloy Bridge Road Shift ............................................................................ 67 Figure 7-15: Loop 9 Corridor ...................................................................................................................... 68 Figure 7-16: Construction Phasing Options ................................................................................................ 73 Figure 7-16: Baseline Forecast Project Phasing .......................................................................................... 74 Figure 7-17: Higher Growth Forecast Project Phasing ................................................................................ 74 Figure 7-18: Typical Interchange Layouts ................................................................................................... 75 Figure 7-19: Potential Interchanges along Loop 9 ...................................................................................... 76 Figure 8-1: Major Corridors and Logical Termini ........................................................................................ 80 Figure 8-2: Phase I: Two-Way Frontage Road ............................................................................................ 82 Figure 8-3: Phase 2: One-Way Frontage Roads ......................................................................................... 83 Figure 8-4: Phases 2 and 4: Continuous Toll Road ..................................................................................... 84
Loop 9 Southeast Corridor/Feasibility Study
v
Figure 9-1: Project Schedule ....................................................................................................................... 87 Tables Table ES-1: Major Corridor Evaluation .................................................................................................... ES-8 Table 3-1: North Central Texas Regional Demographics .............................................................................. 9 Table 3-2: County and Municipal Population Growth ................................................................................ 10 Table 3-3: 2010 and 2035 Employment ..................................................................................................... 10 Table 3-4: Study Area Transportation Performance Measures .................................................................. 12 Table 4-1: Inclusion of Loop 9 Southeast in Regional MPO Mobility Plans ................................................. 17 Table 4-2: Major Roadway Facilities within the Loop 9 Study Area ............................................................ 27 Table 5-1: Major Employers ....................................................................................................................... 36 Table 5-2: Employment and Unemployment ............................................................................................. 38 Table 5-3: Potential Habitats of Federal/State-Listed Species of Dallas, Kaufman, and Ellis
Counties .................................................................................................................................... 43 Table 6-1: List of Loop 9 Southeast Agency and Public Meetings ............................................................... 46 Table 6-2: List of Loop 9 Southeast Presentations ...................................................................................... 51 Table 6-3: Summary of Public Comments .................................................................................................. 52 Table 7-1: Corridor Segment Description ................................................................................................... 72 Table 7-2: Criteria for Determination of Project Phasing –
Traffic Volume Thresholds (Passenger Cars) ............................................................................. 73 Table 7-3: Project Costs of Each Corridor Ultimate Configuration ............................................................. 76 Table 7-4: Evaluation of Corridors .............................................................................................................. 78 Table 8-1: Major Corridors and Logical Termini ......................................................................................... 79 Table 8-2: Major Corridor Evaluation Matrix .............................................................................................. 80 Table 8-3: Anticipated Growth ................................................................................................................... 81 Exhibits Exhibit 1: Environmental Constraints Map Appendices Appendix A: FHWA PEL Questionnaire Appendix B: State and Federal Resource Agency Webinar Summary Appendix C: Local Government Interviews and Meeting Summaries Appendix D: Regional Task Force Meeting Summaries Appendix E: Major Stakeholder Meeting Summaries Appendix F: Public Meeting Summaries Appendix G: Record of Comments Received and Responses Appendix H: Traffic Analysis Memorandum
Loop 9 Southeast Corridor/Feasibility Study
vi
List of Acronyms Acronym Definition AASHTO American Association of State Highway and Transportation Officials APE Area of Potential Effects BNSF Burlington Northern Santa Fe CAA Clean Air Act CAAA Clean Air Act Amendments of 1990 CMP Congestion Management Process CWA Clean Water Act DART Dallas Area Rapid Transit DEIS Draft Environmental Impact Statement DFW Dallas-Fort Worth DFWRTM Dallas-Fort Worth Regional Transportation Model DOT Department of Transportation EIS Environmental Impact Statement EJ Environmental Justice ENV TxDOT Environmental Affairs Division EPA Environmental Protection Agency ESA Endangered Species Act of 1973 FAA Federal Aviation Administration FEMA Federal Emergency Management Agency FHWA Federal Highway Administration FIRM Flood Insurance Rate Map FTA Federal Transit Administration FY Fiscal Year GIS Geographic Information System HOV High Occupancy Vehicle I- Interstate Highway IIPOD International Inland Port of Dallas IP Individual Permit ISD Independent School District ISTEA Intermodal Surface Transportation Act of 1991 ITS Intelligent Transportation Systems LOS Level-of-Service mph miles per hour MPO Metropolitan Planning Organization MTP Metropolitan Transportation Plan

Loop 9 Southeast Corridor/Feasibility Study
vii
NCTCOG North Central Texas Council of Governments NEPA National Environmental Policy Act of 1969 NFIP National Flood Insurance Program NRHP National Register of Historic Places NWI National Wetlands Inventory PEL Planning and Environment Linkages PGBT President George Bush Turnpike ROD Record of Decision ROW Right-of-Way RTC Regional Transportation Council RTP Regional Transportation Plan SAFETEA-LU Safe, Accountable, Flexible, Efficient Transportation Equity Act: A Legacy for Users SEATA SouthEast Area Transportation Alliance SIP State Implementation Plan SOV Single Occupant Vehicles STP Statewide Transportation Plan TCEQ Texas Commission on Environmental Quality TEA-21 Transportation Equity Act for the 21st Century THC Texas Historical Commission TIP Transportation Improvement Program TPWD Texas Parks and Wildlife Department TRA Trinity River Authority of Texas TRZ Transportation Reinvestment Zone TTC Trans-Texas Corridor TxDOT Texas Department of Transportation TXNDD Texas Natural Diversity Database U.S. United States US U.S. Highway USACE United States Army Corps of Engineers USC United States Code USCB United States Census Bureau USFWS United States Fish and Wildlife Service UPRR Union Pacific Rail Road VMT Vehicle Miles of Travel VPD Vehicles Per Day % Percent
Loop 9 Southeast Corridor/Feasibility Study
ES-1
EXECUTIVE SUMMARY
A. Introduction
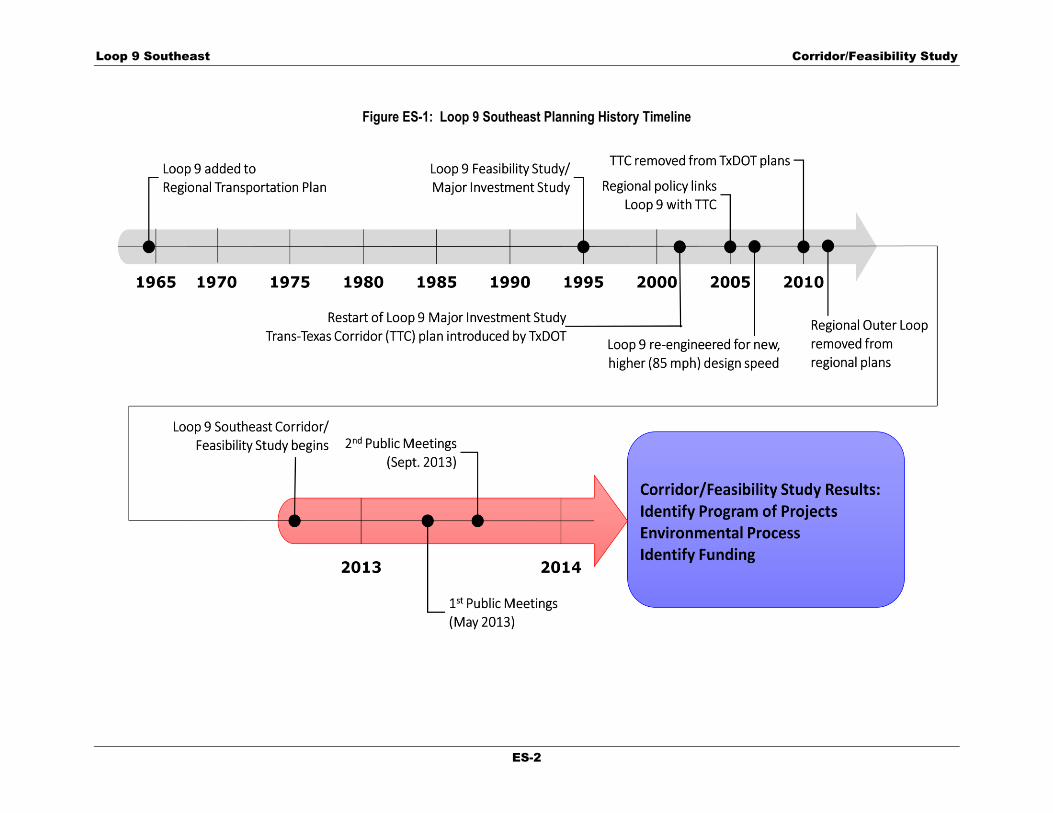
Loop 9 has been identified in transportation plans for a number of years. Changes in demographics, forecasted traffic growth, and potential to connect to other major facilities have driven the need to re-evaluate the overall concept of the facility. In September 2012, TxDOT began the Loop 9 Southeast Corridor/Feasibility Study for the revised Loop 9 Southeast project concept from U.S. Highway 67 (US 67) to I-20 within Dallas, Ellis, and Kaufman Counties. The purpose of this Corridor/Feasibility Study is to assist in guiding future infrastructure investments to advance the proposed Loop 9 Southeast project. This Corridor/Feasibility Study also follows the Planning and Environment Linkages (PEL) approach to help evaluate environmental issues early in the planning process. The Loop 9 Southeast Corridor/Feasibility Study incorporates more flexible design standards, a reduced right-of-way (ROW), a shorter project length, and minimizes the overall impacts when compared to past studies. These changes would alter the project to be more closely aligned with the transportation and development needs of the southeast Dallas region. The ultimate goal of the Corridor/Feasibility Study was to develop a program of independent projects to advance into the National Environmental Policy Act (NEPA) process based on mobility needs, engineering and environmental data, and coordination with the North Central Texas Council of Governments (NCTCOG), local officials, the public, and resource agencies. Figure ES-1 shows a timeline of the Loop 9 Southeast planning process.
Loop 9 Southeast Corridor/Feasibility Study
ES-2
Figure ES-1: Loop 9 Southeast Planning History Timeline
Loop 9 Southeast Corridor/Feasibility Study
ES-3
B. Study Approach
The primary purpose of the study was to develop a corridor vision and a program of projects for development as transportation funding allows. TxDOT utilized the Federal Highway Administration (FHWA) Planning and Environment Linkages (PEL) approach for the Loop 9 Southeast Corridor/Feasibility Study. The purpose of a PEL study is to perform preliminary analysis and make decisions not completed as a part of traditional regional level planning so NEPA level evaluation and decision-making is more transparent to resource agencies and the public. Specifically, the goals of the Loop 9 Southeast Corridor/Feasibility Study were to:
Gather input from local and community leaders on specific transportation facility needs
Collect public input and feedback to better understand public needs and values
Document the transportation problems within the study area
Identify a corridor where transportation projects could be developed to address area problems
Identify specific transportation projects to advance in the corridor while considering the potential for impacts on the natural, socio-economic, and cultural environments
Recommend a program of transportation projects to advance within the corridor over the next several years as funding becomes available
The Corridor/Feasibility Study gathered new information, but also incorporated data from the past studies to identify environmental constraints. Additionally, the results of the past public, agency, and local official involvement efforts guided the development of the revised Loop 9 Southeast project concept and were utilized to identify alignments that best suit the community.
C. Overview of the Study Area
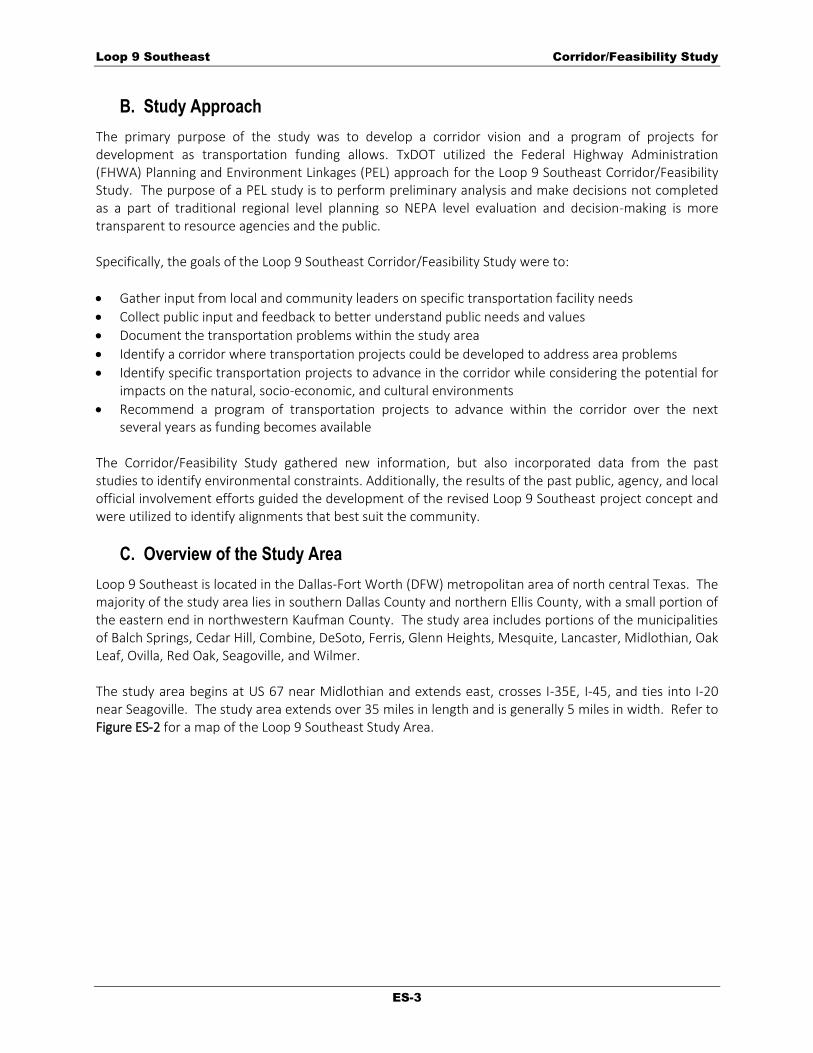
Loop 9 Southeast is located in the Dallas-Fort Worth (DFW) metropolitan area of north central Texas. The majority of the study area lies in southern Dallas County and northern Ellis County, with a small portion of the eastern end in northwestern Kaufman County. The study area includes portions of the municipalities of Balch Springs, Cedar Hill, Combine, DeSoto, Ferris, Glenn Heights, Mesquite, Lancaster, Midlothian, Oak Leaf, Ovilla, Red Oak, Seagoville, and Wilmer. The study area begins at US 67 near Midlothian and extends east, crosses I-35E, I-45, and ties into I-20 near Seagoville. The study area extends over 35 miles in length and is generally 5 miles in width. Refer to Figure ES-2 for a map of the Loop 9 Southeast Study Area.

Loop 9 Southeast Corridor/Feasibility Study
ES-4
Figure ES-2: Study Area Map
D. Need and Purpose
The need for the Loop 9 Southeast project is to address population growth, transportation demand, system linkages, and connectivity among the existing roadway facilities. Loop 9 Southeast would provide a direct link from US 67 to I-20 and would serve the residents in the area. The need for these improvements is based on:
Within the communities in the study area, the population is forecasted to increase nearly 45 percent (%) and employment nearly 43% from 2000 to 2035. The existing transportation infrastructure serving these communities is insufficient to effectively meet the access and mobility needs associated with this growth.
The current transportation infrastructure does not adequately provide connectivity between the communities in the study area thereby, inhibiting emergency response, access to services, employers, major freight and trucking yards, transit services, and other community facilities.
Within the study area, the existing roadway system provides sufficient north-south radial access but lacks continuous east-west transportation facilities to serve these growing communities.
Loop 9 Southeast Corridor/Feasibility Study
ES-5
Loop 9 Southeast is an element of the regional long-range transportation plan that would aid in addressing the transportation needs identified in the region. The draft purpose of the Loop 9 Southeast facility would be to:
Provide an east-west transportation facility to serve the communities in the area.
Reduce local area congestion and travel time.
Provide support for economic development within the region.
E. Regional Planning Context
Transportation plans such as Mobility 2035 – 2013 Update, according to SAFETEA-LU metropolitan planning regulations, must be “fiscally constrained,” that is, based on reasonable assumptions about future transportation funding levels. Mobility 2035 – 2013 Update currently identifies the Loop 9 Southeast project cost at $5.76 billion for the year of expenditure with a projected opening date from 2029-2035. As the project phases develop, the MTP and Transportation Improvement Program (TIP) would need to be updated accordingly. Because some counties in the DFW area are designated as moderate non-attainment areas for the 8-hour ozone standard, the CAAA require the transportation plan to be in conformity with the State Implementation Plan (SIP) for air quality to demonstrate that projects in the MTP meet air quality goals.
F. Affected Environment
While much of the resource data used for this Corridor/Feasibility Study was obtained from the Loop 9 Southeast Preliminary DEIS efforts, some resource information was updated for this study. These resources include floodplain data, potential displacements, land use, community resources, parkland and recreational areas, threatened and endangered species, utilities, and sites identified during local government interviews and windshield surveys. All resource information was identified on the Environmental Constraints Maps (Exhibit 1). Detailed surveys for historic and archeological sites, wetland delineations, and biological surveys would be conducted during the project development phase of each individual project.
G. Agency and Public Involvement
Extensive efforts were made as part of this Corridor/Feasibility Study to inform the public, local officials, agencies and major stakeholders (within the Loop 9 Southeast corridor study area) of the ongoing Loop 9 Southeast project as well as provide the opportunity for comments on the project. Seventeen local interviews, fourteen local official meetings, seven Task Force Meetings, seven major stakeholder meetings, a resource agency webinar, and four public meetings occurred during 2012 and 2013. Summaries of these meetings can be found in Appendices B-E. All comments received during the public involvement effort were documented in a comment matrix with consideration given to each comment.
H. Corridor Development and Evaluation
Public comments, proposed design criteria, typical section and corridor width, development of additional corridors, design considerations and constraints, traffic analysis, interchange considerations and cost
Loop 9 Southeast Corridor/Feasibility Study
ES-6
were all used to identify the reasonable alternatives. This evaluation process resulted in particular corridor option shifts that are different from the alternatives evaluated in the DEIS. There were nine locations where shifts occurred. These include:
Lake Ridge Parkway and US 67
Connect DEIS Alternative 1 to Lake Ridge Parkway
Glenn Heights Shift
Reindeer Road Shift South
Reindeer Road Shift North
Eliminating DEIS Alternative 2 from I-35E to Nokomis Rd
Skyline Landfill Shift
Ballard Road Shift
Combine Road to Malloy Bridge Road Shift
These shifts are discussed in detail in Section 7.A.3. The 2013 total estimated proposed cost including (ROW acquisition and construction) for the ultimate configuration of the Loop 9 Southeast project from US 67 to I-20 is estimated at $2.8 billion.
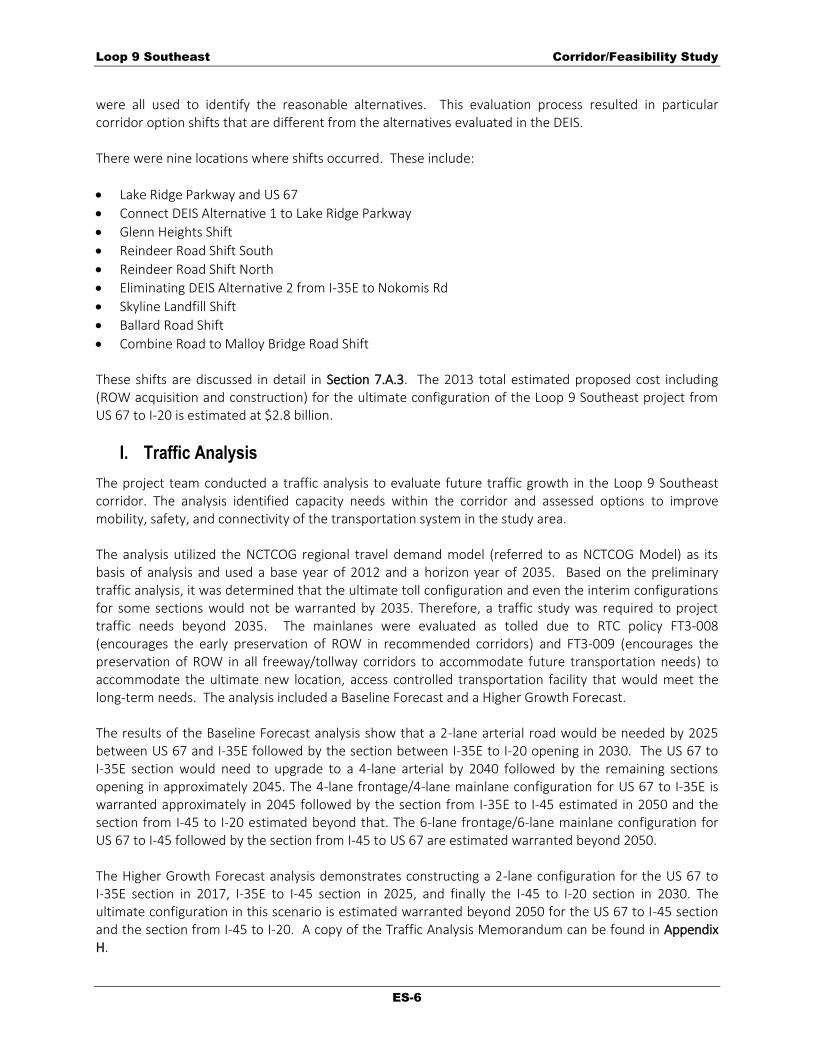
I. Traffic Analysis
The project team conducted a traffic analysis to evaluate future traffic growth in the Loop 9 Southeast corridor. The analysis identified capacity needs within the corridor and assessed options to improve mobility, safety, and connectivity of the transportation system in the study area. The analysis utilized the NCTCOG regional travel demand model (referred to as NCTCOG Model) as its basis of analysis and used a base year of 2012 and a horizon year of 2035. Based on the preliminary traffic analysis, it was determined that the ultimate toll configuration and even the interim configurations for some sections would not be warranted by 2035. Therefore, a traffic study was required to project traffic needs beyond 2035. The mainlanes were evaluated as tolled due to RTC policy FT3-008 (encourages the early preservation of ROW in recommended corridors) and FT3-009 (encourages the preservation of ROW in all freeway/tollway corridors to accommodate future transportation needs) to accommodate the ultimate new location, access controlled transportation facility that would meet the long-term needs. The analysis included a Baseline Forecast and a Higher Growth Forecast. The results of the Baseline Forecast analysis show that a 2-lane arterial road would be needed by 2025 between US 67 and I-35E followed by the section between I-35E to I-20 opening in 2030. The US 67 to I-35E section would need to upgrade to a 4-lane arterial by 2040 followed by the remaining sections opening in approximately 2045. The 4-lane frontage/4-lane mainlane configuration for US 67 to I-35E is warranted approximately in 2045 followed by the section from I-35E to I-45 estimated in 2050 and the section from I-45 to I-20 estimated beyond that. The 6-lane frontage/6-lane mainlane configuration for US 67 to I-45 followed by the section from I-45 to US 67 are estimated warranted beyond 2050. The Higher Growth Forecast analysis demonstrates constructing a 2-lane configuration for the US 67 to I-35E section in 2017, I-35E to I-45 section in 2025, and finally the I-45 to I-20 section in 2030. The ultimate configuration in this scenario is estimated warranted beyond 2050 for the US 67 to I-45 section and the section from I-45 to I-20. A copy of the Traffic Analysis Memorandum can be found in Appendix H.

Loop 9 Southeast Corridor/Feasibility Study
ES-7
J. Costs
The 2013 total estimated proposed cost, including ROW acquisition and construction, for the ultimate configuration of the Loop 9 Southeast project from US 67 to I-20 is estimated at $2.8 billion in 2013 dollars.
K. Recommended Program of Projects
The Loop 9 Southeast corridor is over 35 miles long. The primary purpose of this study is to develop a corridor vision and a program of projects for development as transportation funding allows. To accomplish this, TxDOT followed a collaborative and integrated (PEL) approach to transportation decision-making that considered environmental, community, and economic goals early in the transportation planning process. The Loop 9 Southeast Corridor/Feasibility Study identified a program of projects to:
Evaluate projected traffic, project needs and other elements of the proposed project and determine independent projects for possible phased development and the associated logical termini, if appropriate (e.g., Sections of Independent Utility).
Establish a cohesive program of individual projects that can be developed through the proposed planning horizon (2035) and beyond to meet the project needs and accomplish the goal of advancing the sequenced development of a new location transportation facility that serves the south Dallas, north Ellis and west Kaufman County area.
Prioritize the sequence of individual projects based on urgency of the needs to be addressed, availability of funding, and the expectations of the local communities.
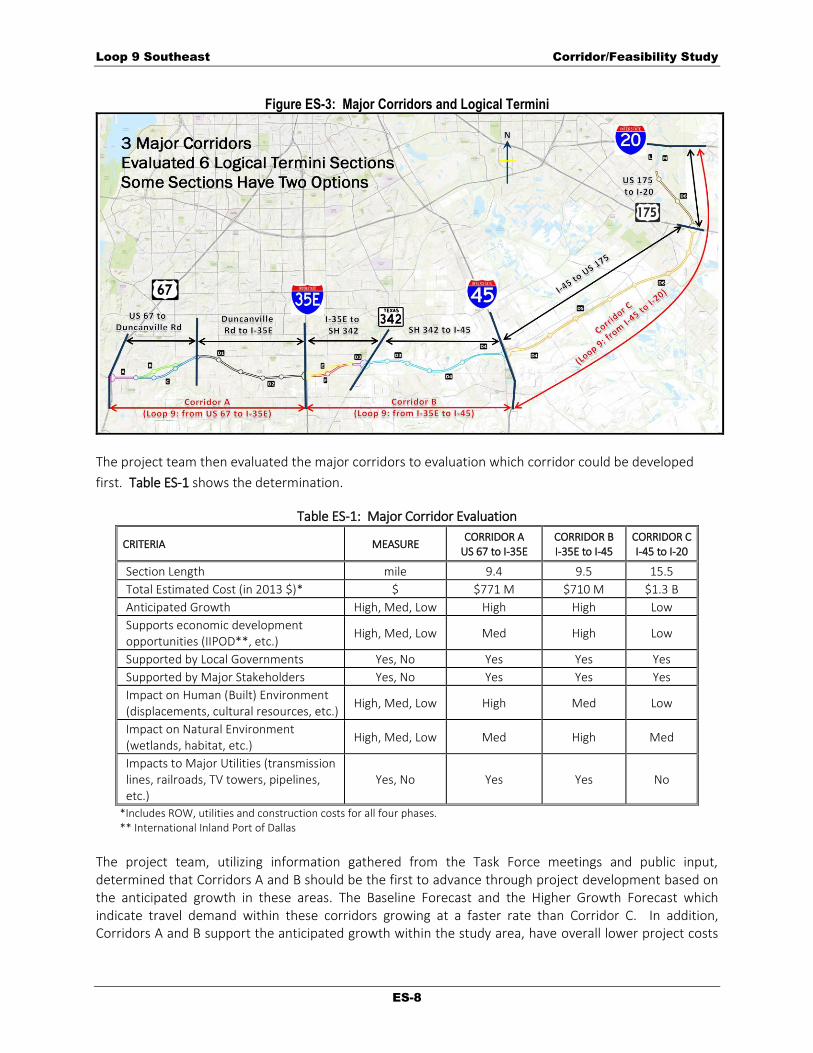
Based on discussions with local governments and major stakeholders within the study area along with consideration of logical termini (project endpoints such as major thoroughfares), and independent utility (the ability of a transportation project to function without recurring additional transportation improvements), the project area was divided into three major corridors for development. The major corridors are separated by I-35E and I-45. Each major corridor was further subdivided into six independent projects with logical termini (Figure ES-3).
Loop 9 Southeast Corridor/Feasibility Study
ES-8
Figure ES-3: Major Corridors and Logical Termini
The project team then evaluated the major corridors to evaluation which corridor could be developed
first. Table ES-1 shows the determination.
Table ES-1: Major Corridor Evaluation
CRITERIA MEASURE CORRIDOR A
US 67 to I-35E CORRIDOR B I-35E to I-45
CORRIDOR C I-45 to I-20
Section Length mile 9.4 9.5 15.5
Total Estimated Cost (in 2013 $)* $ $771 M $710 M $1.3 B
Anticipated Growth High, Med, Low High High Low
Supports economic development opportunities (IIPOD**, etc.)
High, Med, Low Med High Low
Supported by Local Governments Yes, No Yes Yes Yes
Supported by Major Stakeholders Yes, No Yes Yes Yes
Impact on Human (Built) Environment (displacements, cultural resources, etc.)
High, Med, Low High Med Low
Impact on Natural Environment (wetlands, habitat, etc.)
High, Med, Low Med High Med
Impacts to Major Utilities (transmission lines, railroads, TV towers, pipelines, etc.)
Yes, No Yes Yes No
*Includes ROW, utilities and construction costs for all four phases. ** International Inland Port of Dallas
The project team, utilizing information gathered from the Task Force meetings and public input, determined that Corridors A and B should be the first to advance through project development based on the anticipated growth in these areas. The Baseline Forecast and the Higher Growth Forecast which indicate travel demand within these corridors growing at a faster rate than Corridor C. In addition, Corridors A and B support the anticipated growth within the study area, have overall lower project costs

Loop 9 Southeast Corridor/Feasibility Study
ES-9
and shorter lengths, and are supported by local governments and stakeholders. The first project to be evaluated through the environmental and design phases is the Phase 1 project between I-35E and I-45 (Corridor B). Corridor B would provide an east-west transportation facility that would connect two prominent transportation corridors within the DFW region (I-35E and I-45) and it is centrally located within the Loop 9 corridor. It would also best serve projected growth at the IIPOD, a regional intermodal development. Projects in the Corridor A would likely be next, followed by projects in Corridor C.
L. Construction Phasing
Potential construction phasing options were also evaluated. Figure ES-4 shows this phasing based on projected traffic volumes to determine when additional improvements in the corridor would be needed.
Phase 1 would consist of one two-way frontage road. The ROW for all phases would be purchased during Phase 1. The decision regarding which side would be built first would be made in the next study. The total estimated cost for Phase 1 is $859 million (in 2013 $).
Phase 2 would construct the other side of the paired frontage road. Each side of the frontage road would be converted to one-way operation. The median would be left open for the future Phases 3 and 4. The total estimated cost for Phase 2 is $281 million (in 2013 $).
Phase 3 would build isolated grade separations at specific high-volume intersections.
Phase 4 would implement continuous tolled mainlanes in both directions. The total estimated cost for Phases 3 and 4 is $1.641 billion (in 2013 $).
Figure ES-4: Construction Phasing Options
ADT = average daily traffic
Loop 9 Southeast Corridor/Feasibility Study
ES-10
M. Program of Projects
Based on Higher Growth Scenario projected traffic data, Phase 1 would be warranted by 2025 for the section from US 67 to I-45. The section from I-45 to I-20 would be warranted by 2030. All other improvements are warranted beyond 2035, including construction of the ultimate toll facility, and are considered long-term projects to be reevaluated again as the corridor matures. Construction of each individual project would be dependent on available funding.
N. Funding
Currently, there is $100 million available to advance individual transportation projects in the Loop 9 Southeast corridor. This funding is derived from state and local sources. The first project to be evaluated through the environmental and design phases would be the Phase 1 project between I-35E and I-45 (Corridor B). Corridor B would provide an east-west transportation facility that would connect two prominent transportation corridors within the DFW region (I-35E and I-45) and it is centrally located within the Loop 9 corridor. It would also best serve projected growth at the IIPOD, a regional intermodal development. Sufficient design would be conducted during this phase of project development to determine the ROW requirements for the full Phase 4 roadway facility. This would allow TxDOT to purchase the necessary ROW for the entire future facility during the Phase 1 project for each corridor. It should be noted that policies provided by the RTC encourages preservation of ROW in key transportation corridors and RTC Policy FT3-002 requires TxDOT to evaluate all new limited access capacity for priced facility potential. As stated in Section 7.E, the total cost to build Loop 9 Southeast is $2.8 billion (2013 $). Therefore, as additional funding is identified, the remaining Phase 1 projects would be advanced and ROW for the Phase 4 roadway facility would be acquired. Projects in Corridor A would likely be next, followed by projects in Corridor C. As future funding is secured for the projects and the projects are advanced into the environmental and design phases, the MTP and TIP would need to be updated to reflect the appropriate project scope and design configuration. TxDOT would work to develop a long term strategy to identify funding for advancing additional projects in the Loop 9 Southeast corridor. This may include federal, state and local resources as well as innovative financing tools such as tolls, establishment of a Transportation Reinvestment Zone (TRZ), local participation in ROW costs and ROW donations from local land owners.
O. Future Engineering and Environmental Studies
TxDOT in coordination with the NCTCOG and local officials propose to advance the highest priority projects through the environmental process. The intent of the Corridor/Feasibility Study was to have sufficient evaluation and documentation to identify the level of environmental document necessary for each priority project. The environmental process for independent projects would cover the initial near-term phased construction and would also document the need to preserve the necessary ROW to achieve the long-term need and goals. These projects would be incorporated into the MTP, TIP, and STIP, as appropriate. This action is consistent with the RTC policy FT3-008 and FT3-009, to accommodate the ultimate new location, access controlled transportation facility that would meet the long term needs. Figure ES-6 shows the anticipated project schedule for future individual projects.

Loop 9 Southeast Corridor/Feasibility Study
ES-11
As funding is identified for an individual project, the environmental process, public involvement activities, schematic design, and any necessary environmental permitting would begin. During the environmental process and schematic design, additional agency coordination would be conducted to ensure that the project being developed complies with all state and federal laws, guidance, rules, and regulations, as appropriated. Agency coordination may include but not be limited to: the FHWA, EPA, U.S. Fish and Wildlife Service (USFWS), U.S. Army Corps of Engineers (USACE), Federal Aviation Administration (FAA), Natural Resources Conservation Service (NRCS), TCEQ, Texas Parks and Wildlife Department (TPWD), and the Texas Historical Commission (THC). This first step could take approximately 12-18 months to complete. Once environmental clearance has been obtained, TxDOT would begin the ROW acquisition process, which is estimated to take approximately 24 months to complete. Following ROW acquisition, construction would begin and could take an additional 24 months to complete. Projects can begin at any time once funding for a specific project has been identified.
Figure ES-6: Project Schedule
Loop 9 Southeast Corridor/Feasibility Study
ES-12
N. Conclusion
The Loop 9 Southeast Corridor/Feasibility Study incorporates more flexible design standards, a reduced ROW, a shorter project length, and minimizes the overall impacts when compared to past studies. The ultimate goal of the Corridor/Feasibility Study was to develop a program of independent projects to advance into the NEPA process based on mobility needs, engineering and environmental data, and coordination with the NCTCOG, local officials, the public, and resource agencies. By utilizing the PEL process during this Corridor/Feasibility Study, the project team has developed inter-agency relationships and resolved issues to develop viable alignments options to move forward. The process has allowed the project team to gather input from local and community leaders and the public, document the transportation problems within the study area, and identify a corridor where transportation projects could be developed to address area problems. The refined Loop 9 corridor identified in this study minimizes impacts to the natural and social environment by reducing the proposed ROW from the original DEIS Alternatives, shifting alignments to avoid impacts to a TV tower, transmissions lines, the Skyline Landfill, and other natural resources. There are also three sections that have two viable options for further study during the NEPA evaluations. Once the Corridor/Feasibility Study is complete and the findings deemed acceptable, TxDOT in coordination with the NCTCOG and local officials propose to advance the highest priority projects into the NEPA process. The intent of the Corridor/Feasibility Study is to have sufficient evaluation and documentation by utilizing the PEL process to identify the class of NEPA action for each priority project. It is assumed that the independent projects would meet the 2035 planning horizon needs, be fiscally constrained, and would move through the appropriate NEPA process. The NEPA process for independent projects would cover the initial near‐term phased construction and would also document the need to preserve the necessary ROW to achieve the long‐term need and goals. These needs would be incorporated into the RTC MTP. This action is consistent with the RTC policy FT3‐008 and FT3‐009, to accommodate the ultimate new location, access controlled transportation facility that would meet the long term needs of the region. The results of the Loop 9 Southeast Corridor/Feasibility Study proposed developing the project in three major corridors for up to six separate and independent projects utilizing a phased construction approach. The proposed project would be developed in phases, with Phase I developing only the two-way frontage road while purchasing the entire proposed ROW for the future ultimate facility. Phase 2 would involve the construction of the paired frontage roads. Phase 3 is the construction of isolated grade separations at specific high-volume intersections. Phase 4 is the construction of continuous tolled mainlanes in both directions. Based on projected traffic data, Phase 1 (a two-lane frontage road) is warranted by 2025 for the section from US 67 to I-35E (Corridor A) and the section from I-35E to I-45 (Corridor B). The section from I-45 to I-20 (Corridor C) is warranted by 2030. All remaining sections are warranted beyond 2035, including construction of the ultimate toll facility, and are considered long-term projects to be reevaluated again at a later date as the need arises. TxDOT plans to initiate the first project for engineering and environmental studies during 2014. Utilizing the currently available funding ($100 million), TxDOT has chosen to advance the section of Loop 9 Southeast from I-35E to I-45 (Corridor B) first. This section is approximately 9.5 miles in length and is

Loop 9 Southeast Corridor/Feasibility Study
ES-13
anticipated to cost $710 million (the lowest of the three corridors). This section would allow TxDOT to plan ahead of the anticipated growth and projected traffic between I-35E and I-45 due to IIPOD and other developers in the area. Subsequent sections would be advanced based on local needs and available funding.
Loop 9 Southeast Corridor/Feasibility Study
1
1. INTRODUCTION
In September 2012, Texas Department of Transportation (TxDOT) began the Loop 9 Southeast Corridor/Feasibility Study for the revised Loop 9 Southeast project concept from U.S. Highway 67 (US 67) to Interstate Highway 20 (I-20) within Dallas, Ellis, and Kaufman Counties. The purpose of this Corridor/Feasibility Study is to assist in guiding future infrastructure investment to advance the proposed Loop 9 Southeast project. This Corridor/Feasibility Study also follows the Planning and Environment Linkages (PEL) approach to help evaluate environmental issues early in the planning process. Loop 9 has been identified in transportation plans for a number of years. Changes in demographics, forecasted traffic growth, and potential to connect to other major facilities have driven the need to re-evaluate the overall concept of the facility. The Loop 9 Southeast Corridor/Feasibility Study incorporates more flexible design standards, a reduced right-of-way (ROW), a shorter project length, and minimizes the overall impacts when compared to past studies. These changes would alter the project to be more closely aligned with the transportation and development needs of the southeast Dallas region. The ultimate goal of the Corridor/Feasibility Study was to develop a program of independent projects to advance into the National Environmental Policy Act (NEPA) process based on mobility needs, engineering and environmental data, and coordination with the North Central Texas Council of Governments (NCTCOG), local officials, the public, and resource agencies.
A. Project History
First conceived in the 1957 Thoroughfare Report, the concept of an "Outer Loop" freeway around the Dallas metropolitan area was expanded in 1964 by the Greater Dallas Planning Council Regional Transportation Highway Plan. In 1964, the Texas Highway Commission also authorized this outer loop around Dallas and designated it as a freeway facility to be known as Loop 9 pursuant to a Regional Transportation Highway Plan. The Loop 9 Feasibility Study/Major Investment Study (MIS) was authorized by Dallas County in 1995. In 1997, study efforts resulted in a "Technically Preferred Alignment" that was adopted by many of the cities and agencies involved in the study. However, study efforts were temporarily suspended before a "Locally Preferred Alignment" could be identified. In May 2002, the Loop 9 Feasibility Study was reinitiated to identify viable corridor alignments and modal alternatives for the study area. From 2002 to 2006, alignment and environmental constraints, coupled with the growth and desires of surrounding communities, resulted in further alignment revisions to avoid and minimize impacts. By 2006, a possible connection between the Loop 9 project and other statewide transportation improvements required Loop 9 stakeholders to consider substantial design modifications so that the project would conform to TxDOT highest-speed roadway design criteria. In 2006, TxDOT became the lead agency for advancing the Loop 9 Southeast project through the NEPA process. Between 2006 and 2011, TxDOT prepared the Loop 9 Southeast Preliminary Draft Environmental Impact Statement (DEIS) and associated concept designs. The proposed project would have advanced a 6-lane new location controlled access tollway with intermittent one-way access roads between I-20 and US 287, a distance of approximately 44 miles. The proposed ROW varied from 450 to 600 feet depending on the
Loop 9 Southeast Corridor/Feasibility Study
2
interchange configuration and location. The Loop 9 Southeast project was included in Mobility 2030 – 2009 Amendment as a toll road with a total project cost estimate of $5.76 billion. While the Loop 9 Southeast DEIS was under review in 2009, TxDOT published the Innovative Connectivity in Texas/Vision 2009 which defined a new vision for the TxDOT corridor development process and resulted in the retirement of the Trans-Texas Corridor (TTC) concept. However, in 2010 the Federal Highway Administration (FHWA) issued a Record of Decision (ROD) for the Tier One Environmental Impact Statement (EIS) for the TTC-35 project, which advanced No Action as the selected alternative. In late 2011, NCTCOG concluded the Regional Outer Loop Corridor Feasibility Study. This study determined that a continuous, circumferential outer loop was not warranted based on the forecasted year 2035 travel demand and the lack of statewide connections. The changes in TxDOT policy, the No Action on the TTC-35 EIS, funding constraints for transportation projects, and the current economic climate impacted the assumptions and development of the Regional Transportation Council (RTC) approved Mobility 2035: The Metropolitan Transportation Plan for North Central Texas (Mobility 2035). As a result of these changes, work on the Preliminary Loop 9 Southeast DEIS was suspended until a determination on how the project should proceed was made. The DEIS was put on hold in November 2011 and was officially concluded in January 2012. The Notice of Intent was rescinded in the Federal Register on March 20, 2013 and in the Texas Register on July 23, 2013. Several planning factors/considerations used in the development of Mobility 2035 influenced the change in direction for the Loop 9 Southeast project. These factors include:
Changes in the travel model and Metropolitan Planning Area boundary,
Changes to the transportation network (e.g., the deferral of over $45 billion in transportation projects due to limited transportation funding),
Revised regional demographics which forecasted more focused growth and development in Dallas and Tarrant Counties in comparison to previous forecasts,
No Action on the TTC-35 EIS, and
Removal of the Regional Outer Loop concept and its connectivity to Loop 9 Southeast. Additionally, traffic studies conducted by NCTCOG indicated that the portion of the Loop 9 Southeast project between US 287 and US 67 would not be warranted. As a result, the Loop 9 Southeast project western terminus was changed to US 67. These factors contributed to a substantial decrease the projected travel demand for the proposed project by 2035, the horizon year of the MTP. The lower traffic levels in the project corridor would not warrant full implementation of the Loop 9 Southeast project by 2035 as proposed in the DEIS. As a result, TxDOT, NCTCOG, and local leaders recommended a Corridor/Feasibility Study to determine a new direction for the project corridor. To the extent possible, the studies, data, and public/agency input gathered for the DEIS has been used as a basis for the new project. Figure 1-1 shows a timeline of the Loop 9 Southeast planning process.

Loop 9 Southeast Corridor/Feasibility Study
3
Figure 1-1: Loop 9 Southeast Planning History Timeline

Loop 9 Southeast Corridor/Feasibility Study
4
2. STUDY APPROACH
The primary purpose of the study is to develop a corridor vision and a program of projects for development as transportation funding allows. TxDOT utilizes the FHWA Planning and Environment Linkages (PEL) approach for the Loop 9 Southeast Corridor/Feasibility Study.
A. Overview of the Study Area
Proposed Loop 9 Southeast is located in the Dallas-Fort Worth (DFW) metropolitan area of north central Texas. The majority of the study area lies in southern Dallas County and northern Ellis County, with a small portion of the eastern end in northwestern Kaufman County. The study area includes portions of the municipalities of Balch Springs, Cedar Hill, Combine, DeSoto, Ferris, Glenn Heights, Mesquite, Lancaster, Midlothian, Oak Leaf, Ovilla, Red Oak, Seagoville, and Wilmer. The study area begins at US 67 near Midlothian and extends east, crosses I-35E, I-45, and ties into I-20 near Seagoville. The study area boundary was modified from the one established in 1995 during the initial Loop 9 Feasibility Study/MIS and removed the portion from US 287 to US 67. The study area extends over 35 miles in length and is generally 5 miles in width. Refer to Figure 2-1 for a map of the Loop 9 Southeast Study Area used during this Corridor/Feasibility Study.
Figure 2-1: Study Area Map
Loop 9 Southeast Corridor/Feasibility Study
5
B. Planning and Environment Linkages (PEL) Approach
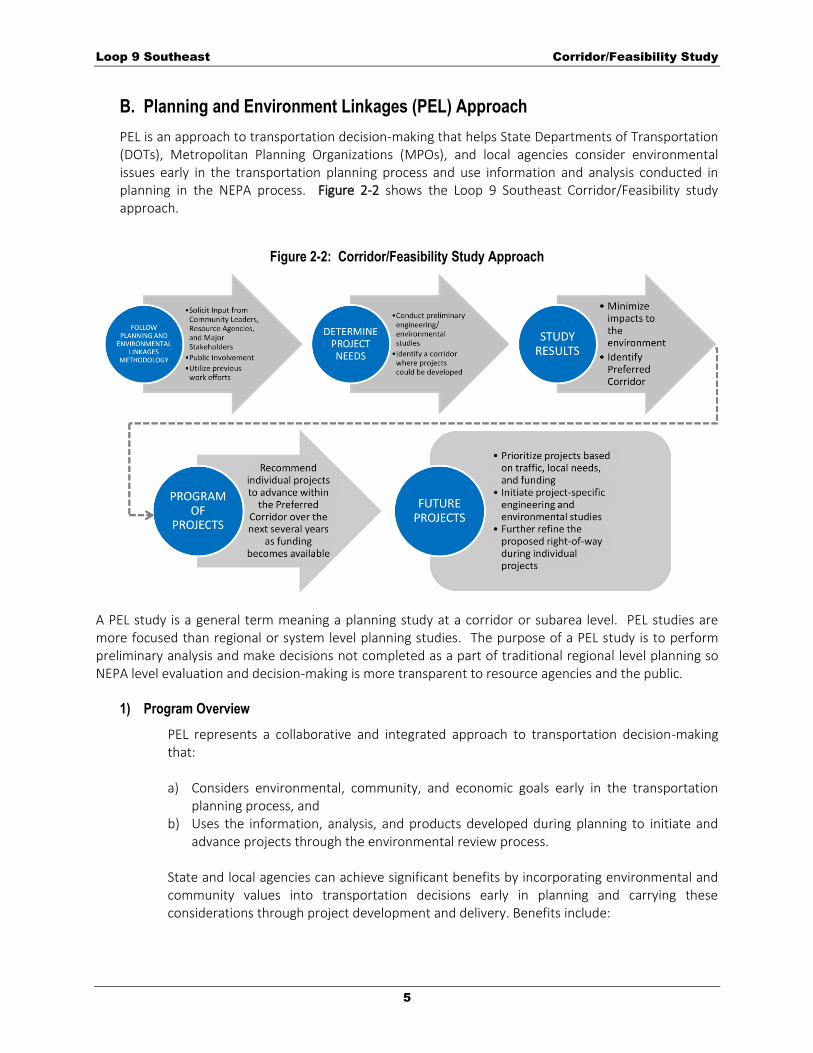
PEL is an approach to transportation decision-making that helps State Departments of Transportation (DOTs), Metropolitan Planning Organizations (MPOs), and local agencies consider environmental issues early in the transportation planning process and use information and analysis conducted in planning in the NEPA process. Figure 2-2 shows the Loop 9 Southeast Corridor/Feasibility study approach.
Figure 2-2: Corridor/Feasibility Study Approach
A PEL study is a general term meaning a planning study at a corridor or subarea level. PEL studies are more focused than regional or system level planning studies. The purpose of a PEL study is to perform preliminary analysis and make decisions not completed as a part of traditional regional level planning so NEPA level evaluation and decision-making is more transparent to resource agencies and the public.
1) Program Overview
PEL represents a collaborative and integrated approach to transportation decision-making that: a) Considers environmental, community, and economic goals early in the transportation
planning process, and b) Uses the information, analysis, and products developed during planning to initiate and
advance projects through the environmental review process. State and local agencies can achieve significant benefits by incorporating environmental and community values into transportation decisions early in planning and carrying these considerations through project development and delivery. Benefits include:

Loop 9 Southeast Corridor/Feasibility Study
6
Relationship-building: The PEL approach enables the public as well as resource and regulatory agencies to be more effective players in the transportation decision-making process through its focus on building interagency relationships. By encouraging resource and regulatory agencies to get involved in the early stages of planning, agencies have an opportunity to help shape transportation projects. Improved project delivery timeframes: The PEL approach improves process efficiencies by minimizing potential duplication of planning and NEPA processes, creating one cohesive flow of information. In addition, improvements to inter-agency relationships may help to resolve differences on key issues as transportation programs and projects move from planning to design, evaluation, and implementation. On-the-ground outcome benefits: When transportation agencies conduct planning activities equipped with information about resource considerations and in coordination with resource agencies and the public, they are better able to design transportation programs and projects that serve the transportation needs of the community more effectively. The PEL approach provides agencies with tools to design better projects while avoiding and minimizing impacts on natural resources (FHWA, 2013).
2) Regulations and Guidance
The following is a summary of the PEL regulations and guidance:
23 Code of Federal Regulations (CFR) 450.212, 450.318, and Appendix A -Transportation planning studies and project development
23 CFR 771.111 (a)(2) - Early coordination, public involvement, and project development
40 CFR 1501.2 - Apply NEPA early in the process
Environment and Planning Linkage Processes Legal Guidance
Congress recognized the need to streamline the transportation decision making process in the August 10, 2005 Safe, Accountable, Flexible, Efficient Transportation Equity Act: A Legacy for Users (SAFETEA-LU) transportation funding legislation, which emphasized the inclusion of environmental considerations in the planning process and improved linkages between planning and NEPA. Specifically, Section 6001 (Environmental Considerations in Planning) of SAFETEA-LU requires certain elements and activities to be included in the development of long-range transportation plans, including:
Consultations with resource agencies, such as those responsible for land-use management, natural resources, environmental protection, conservation, and historic preservation, which shall involve, as appropriate, comparisons of resource maps and inventories
Discussion of potential environmental mitigation activities
Participation plans that identify a process for stakeholder involvement
Visualization of proposed transportation strategies where practicable
Loop 9 Southeast Corridor/Feasibility Study
7
The statewide and metropolitan transportation planning regulations (23 CFR 450) explain how results or decisions of transportation planning studies may be used as part of the overall project development process consistent with NEPA (FHWA, 2001). Appendix A of 23 CFR 450 - Linking the Transportation Planning and NEPA Processes provides details on how information, analysis, and products from transportation planning can be incorporated into and relied upon in NEPA documents under existing laws. The statewide and metropolitan planning regulations regarding PEL are intended to be non-binding and voluntary. The need for a project to meet fiscal-constraint requirements before the NEPA process can begin is an opportunity for the PEL process to provide initial evaluation of a project without identified construction funding. PEL studies do not need to be in the fiscally-constrained Regional Transportation Plan (RTP) or Statewide Transportation Plan (STP) and can be initiated at any time.
C. Goals of the Corridor/Feasibility Study
Specifically, the goals of the Loop 9 Southeast Corridor/Feasibility Study were to:
Gather input from local and community leaders on specific transportation facility needs
Collect public input and feedback to better understand public needs and values
Document the transportation problems within the study area
Identify a corridor where transportation projects could be developed to address area problems
Identify specific transportation projects to advance in the corridor while considering the potential for impacts on the natural, socio-economic, and cultural environments
Recommend a program of transportation projects to advance within the corridor over the next several years as funding becomes available
The programmed projects would be advanced for environmental study, engineering design, ROW acquisition, and construction as appropriate funding is secured. Each of the projects would build upon one another with an end goal of constructing a comprehensive transportation facility that serves the transportation needs of the southeastern Dallas region.

Loop 9 Southeast Corridor/Feasibility Study
8
3. NEED AND PURPOSE
A. Need for Loop 9 Southeast
For people living and driving in southern Dallas County or northern Ellis County, traveling through the area can be a challenge. I-20, the closest east-west freeway, lies miles to the north. Arterial streets like Bear Creek Road and Belt Line Road have grown more congested as the area adds residential, commercial, and industrial development. More people living, shopping and working in the area over time has added more vehicles on the roads. Heavy truck traffic from the International Inland Port of Dallas (IIPOD) near I-45 coupled with ongoing regional, national, and international freight movement is likely to put more pressure on the local transportation system. The need for the Loop 9 Southeast project is to address population growth, transportation demand, system linkages, and connectivity among the existing roadway facilities. It would provide a direct link from US 67 to I-20 and would serve the residents and businesses in the area. The need for these improvements is based on:
Within the communities in the study area, the population is forecasted to increase nearly 45 percent (%) and employment nearly 43% from 2000 to 2035. The existing transportation infrastructure serving these communities is insufficient to effectively meet the access and mobility needs associated with this growth.
The current transportation infrastructure does not adequately provide connectivity between the communities in the study area thereby, inhibiting emergency response, access to services, employers, major freight and trucking yards, transit services, and other community facilities.
Within the study area, the existing roadway system provides sufficient north-south radial access but lacks continuous east-west transportation facilities to serve these growing communities.
The following sections provide supporting information for the above need statements.
1) Growth
Historically speaking, Texas has been one of the 10 fastest growing states in the nation. According to the U.S. Census Bureau (USCB), Texas grew by 4.3 million persons between 2000 and 2010, a 20.6% increase in population. The U.S. grew by 27.3 million persons between 2000 and 2010. For comparison purposes, the growth rate for the U.S. for the same 10-year period was 9.7%. Texas accounted for over 15% of the population growth in America between 2000 and 2010. As a result of these high growth rates, the demand for efficient transportation in the DFW metropolitan area has also increased dramatically. The DFW Metroplex has sustained a long period of economic growth because of three primary factors: a favorable business climate, attractive tax policies, and an abundance of available land. The recent economic downturn is expected to slow the rate of growth over the near term, but it is expected to return to previous levels of growth as the economy continues to recover. Historically, this has been the case with other economic downturns. NCTCOG is officially responsible for forecasting future growth rates in the region. The forecast provides long-range, small area population, household and employment projections
Loop 9 Southeast Corridor/Feasibility Study
9
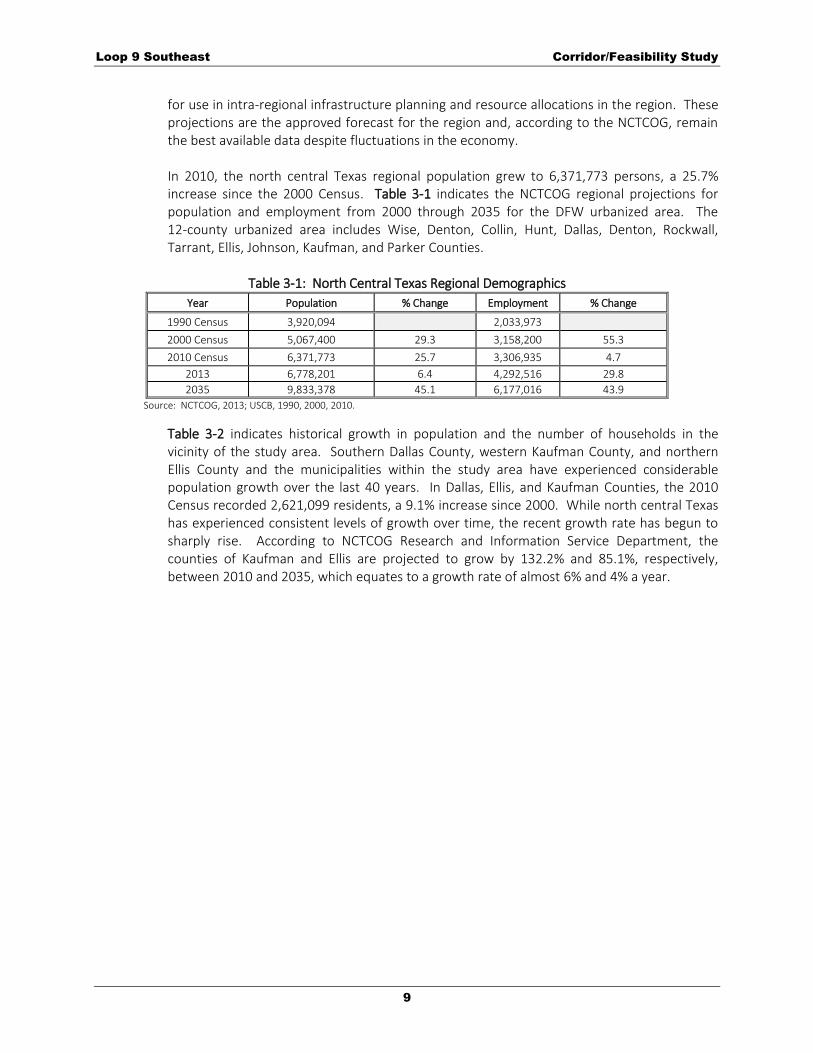
for use in intra-regional infrastructure planning and resource allocations in the region. These projections are the approved forecast for the region and, according to the NCTCOG, remain the best available data despite fluctuations in the economy. In 2010, the north central Texas regional population grew to 6,371,773 persons, a 25.7% increase since the 2000 Census. Table 3-1 indicates the NCTCOG regional projections for population and employment from 2000 through 2035 for the DFW urbanized area. The 12-county urbanized area includes Wise, Denton, Collin, Hunt, Dallas, Denton, Rockwall, Tarrant, Ellis, Johnson, Kaufman, and Parker Counties.
Table 3-1: North Central Texas Regional Demographics
Year Population % Change Employment % Change
1990 Census 3,920,094 2,033,973
2000 Census 5,067,400 29.3 3,158,200 55.3
2010 Census 6,371,773 25.7 3,306,935 4.7
2013 6,778,201 6.4 4,292,516 29.8
2035 9,833,378 45.1 6,177,016 43.9
Source: NCTCOG, 2013; USCB, 1990, 2000, 2010.
Table 3-2 indicates historical growth in population and the number of households in the vicinity of the study area. Southern Dallas County, western Kaufman County, and northern Ellis County and the municipalities within the study area have experienced considerable population growth over the last 40 years. In Dallas, Ellis, and Kaufman Counties, the 2010 Census recorded 2,621,099 residents, a 9.1% increase since 2000. While north central Texas has experienced consistent levels of growth over time, the recent growth rate has begun to sharply rise. According to NCTCOG Research and Information Service Department, the counties of Kaufman and Ellis are projected to grow by 132.2% and 85.1%, respectively, between 2010 and 2035, which equates to a growth rate of almost 6% and 4% a year.

Loop 9 Southeast Corridor/Feasibility Study
10
Table 3-2: County and Municipal Population Growth
Jurisdiction Population Projected 2035
Population
Households
1970 1980 1990 2000 2010 2000 2010
Dallas County 1,327,695 1,556,419 1,852,810 2,218,899 2,368,139 3,107,541 807,621 855,960
Kaufman County 32,392 39,038 52,220 71,313 103,350 239,940 24,367 34,964
Ellis County 46,638 59,743 85,167 111,360 149,610 276,931 37,020 50,503
Total of Counties 1,406,725 1,655,200 1,990,197 2,401,572 2,621,099 3,624,412 869,008 941,427
% Increase 17.7 20.2 20.7 9.1 38.3 8.3
Projected 2040 Population**
Balch Springs 10,464 13,746 17,406 19,375 23,728 31,606 6,175 7,286
Cedar Hill 2,610 6,849 19,976 32,093 45,028 77,038 10,748 15,506
Combine 277 688 1,329 1,788 1,942 3,939 590 674
Dallas 844,401 904,599 1,006,877 1,188,580 1,197,816 1,531,680 451,833 458,057
DeSoto 6,617 15,538 30,544 37,646 49,047 65,330 13,709 18,210
Duncanville 14,105 27,781 35,748 36,081 38,524 47,106 12,896 13,280
Ferris 2,180 2,228 2,212 2,175 2,436 4,174 688 785
Glenn Heights 257 1,033 4,564 7,224 11,278 29,590 2,356 3,544
Grand Prairie 50,904 71,462 99,616 127,427 175,396 283,493 43,791 58,171
Hutchins 1,755 2,837 2,719 2,805 5,338 17,941 927 1,025
Lancaster 10,522 14,807 22,117 25,894 36,361 69,717 9,182 12,520
Mesquite 55,131 67,053 101,484 124,523 139,824 186,335 43,926 48,390
Midlothian 2,322 3,219 5,141 7,480 18,037 31,011 2,650 6,138
Oak Leaf * * 984 1,209 1,298 1,750 401 459
Ovilla 339 1,067 2,027 3,405 3,492 7,249 1,129 1,252
Red Oak 767 1,822 3,124 4,301 10,769 19,000 1,570 3,659
Seagoville 4,390 8,969 8,936 10,823 14,835 26,892 3,308 4,192
Wilmer 1,922 2,367 2,479 3,393 3,682 7,500 958 1,116
Total for Cities 1,008,963 1,144,400 1,367,316 1,636,222 1,778,831 2,441,351 606,837 654,264
% Increase 13.4 19.5 19.7 8.7 37.2 7.8
Source: USCB, 1970, 1980, 1990, 2000, 2010; NCTCOG, 2013. * The City of Oak Leaf was unincorporated until 1983. ** Data from Texas Water Development Board, 2013.
As population increases, employment levels are expected to grow. Table 3-3 illustrates the forecasted employment for the counties within or adjacent to the study area from 2010 to 2035. Much of this growth is attributed to the region being a leader in the creation of new jobs, corporate relocations, and growth in the technology and service-based industries.
Table 3-3: 2010 and 2035 Employment
Area Employment % Employment Increase
2010–2035 20101 Forecasted 2035
2
Dallas County 1,114,379 2,854,287 156.1
Kaufman County 46,963 81,646 73.9
Ellis County 70,555 116,145 64.6
County Total 1,231,897 3,052,078 147.8
Source: 1 USCB 2007-2011 American Community Survey Five Year Estimates
2NCTCOG, “Mobility 2035 – 2013 Update, Social Considerations”, 2013
As the Metroplex continues to attract new industry and businesses, the associated increases in population and employment would create a strain on existing transportation systems. Resulting trends brought about by recent demographic growth include increased automobile
Loop 9 Southeast Corridor/Feasibility Study
11
ownership, more single-occupant travel, increased suburbanization, and increased vehicle miles of travel in the region. Given the availability of undeveloped land and a discontinuous east-west roadway network in the study area, mobility impacts are likely and the need for transportation improvement to these newly developed and developing areas of the county are likely necessary.
2) Transportation Demand
Mobility improvements for the metropolitan area have traditionally focused on improving travel time and reducing traffic congestion along the major roadway corridors. Historically, the majority of industrial and commercial developments have been located in urban centers within the major loop facilities such as I-635. Most of the peak hour travel demand originated from commuters in suburban communities traveling to and from their respective places of employment. Industrial and commercial developments have now expanded beyond the major loop freeways into the suburban communities, causing a dramatic change in travel patterns. Increasing development of industrial and commercial facilities has positively affected economic growth for these communities, which has in-turn, increased population growth.
Not only have population and travel increased, but the nature of travel has changed in ways that contribute to greater traffic congestion. The travel patterns of many people have altered with changes in land use. The changes in land use associated with suburbanization have an effect on the characteristics of travel, causing more widely scattered inter- and intra-suburban travel as opposed to the more suburb-to-central city commute of the past. NCTCOG developed baseline traffic volumes, projected traffic volumes, and other data based on Mobility 2035. Modeled projected traffic volumes for the study area were averaged across the roadway sections and a level-of-service (LOS) was determined. LOS is a rating system for roadways based on operating conditions, with “A” being best and “F” worst. The performance measure used to evaluate the existing (2012) and future (2035) mobility/level of congestion conditions within the study area was vehicle miles traveled (VMT)/LOS. The network used for this evaluation included all planned projects in Mobility 2035 except the Loop 9 Southeast project. Table 3-4 presents the results of this performance based analysis. Within the study area, congestion is projected to increase between 2012 and 2035, thereby inhibiting overall mobility. As shown in Table 3-4, between 2012 and 2035, there is a projected daily increase in vehicle miles of travel (77% increase) and vehicle hours of travel (89%) within the study area. The increased travel results in an increase in vehicle hours of congestion delay (125% increase). In addition, the percentage of lane miles operating at LOS D, E is forecasted to increase from 5.6% to 12.6% (126.4% increase), and the percentage operating at LOS F is forecasted to increase from 142% to 18.7% (349.5% increase). Based on this analysis, all functional roadway classifications in the study area would experience deterioration in LOS between 2012 and 2035.

Loop 9 Southeast Corridor/Feasibility Study
12
Table 3-4: Study Area Transportation Performance Measures
Performance Measure 2012 2035
Forecast* % Change from
Base Year
Vehicle Miles of Travel per Day 3,199,776 5,679,590 77%
Vehicle Hours of Travel per Day 70,335 132,843 89%
Vehicle Hours of Congestion Delay per Day 9,237 20,794 125%
Lane Miles in Study Area 921 1,076 17%
% Lane Miles at LOS D, E
Freeway/Toll Road 22.3% 29.6% 32.4%
Principal Arterial 1.9% 11.6% 505.6%
Minor Arterial 3.4% 7.8% 130.6%
Collectors 1.7% 10.3% 490.2%
Freeway Ramps 0.0% 6.1% NA
Frontage Roads 0.2% 9.5% 4771.9%
HOV - 0.0% NA
Total Study Area Roadway Network 5.6% 12.6% 126.4%
% Lane Miles at LOS F
Freeway/Toll Road 11.9% 59.0% 394.6%
Principal Arterial 4.1% 9.4% 130.9%
Minor Arterial 5.0% 11.3% 128.1%
Collectors 1.7% 11.4% 570.1%
Freeway Ramps 0.0% 5.8% NA
Frontage Roads 0.6% 13.2% 1977.7%
HOV - 0.0% NA
Total Study Area Roadway Network 4.2% 18.7% 349.5%
NA: % Change Calculation not Applicable. Note: Data derived from NCTCOG 2011 traffic data using 2012 validations. * The 2035 Forecast is the performance based on an evaluation of forecasted traffic, all planned project included in the Mobility 2035 except the Loop 9 Southeast project.
3) Linkages
An outer loop around the DFW Metroplex has been in various phases of development for 50 years. The section from the I-35E to SH 78 (known as the President George Bush Turnpike [PGBT]) was completed and opened to traffic in 2002. The Eastern Extension of PGBT (from SH 78 to I-30) opened to traffic in December 2011. A proposed roadway from I-30 to I-20 (known as SH 190) is currently under study and would provide access to adjacent and connecting roadways. The proposed Loop 9 Southeast project would link to this facility and contribute to the completion of an outer loop (circumferential) roadway system and help increase mobility and accessibility in Dallas, Ellis, and Kaufman Counties. Loop 9 Southeast has been a substantial and long-standing component of the regional long-range transportation plan. Loop 9 Southeast has been included in each of the 10 regional transportation plans developed since 1974. The inclusion of Loop 9 Southeast in Mobility 2035 – 2013 Update indicates continuing regional support.
Loop 9 Southeast Corridor/Feasibility Study
13
4) Economic Development Opportunities
The study area for the proposed Loop 9 Southeast facility is primarily rural and has historically been characterized as a relatively low-density, rural suburban area of Dallas, Kaufman, and Ellis Counties. A major development in the study area is the IIPOD, a regional intermodal development focused on logistics and freight distribution. The development covers 234,000 acres and encompasses ten municipalities. When built out, the project would serve as a significant inland port, much like similar public-private partnership developments in Kansas City (Edgerton) and Chicago (Clearpoint). The total project is estimated to take 30 plus years to complete.
IIPOD The IIPOD is a public-private partnership that serves as a third phase of regional intermodal development (building off successes at DFW Airport and Alliance Texas). It is a coordinated effort partnering communities and developers and a key driver in making Dallas the nation’s premier logistics and distribution center. IIPOD is a catalyst for investment, job growth and development of sustainable communities. The IIPOD encompasses more than 7,000 acres and six municipalities, including Dallas County. More than 12 million square feet of warehouse space has been built or is currently under construction. As of December 2013, approximately 10.5 million square feet of this space has been leased. The project is located at the confluence of I-35E, I-45, and I-20 and two Class I railroads (UPRR and BNSF). Sixteen national and regional developers are currently located in IIPOD, and more than twenty tenants call IIPOD home. The main IIPOD influence area is encompassed by Loop 12 to the north, the Dallas County/Ellis County line to the south, the Trinity River to the east, and I-35E to the west (Figure 3-1).
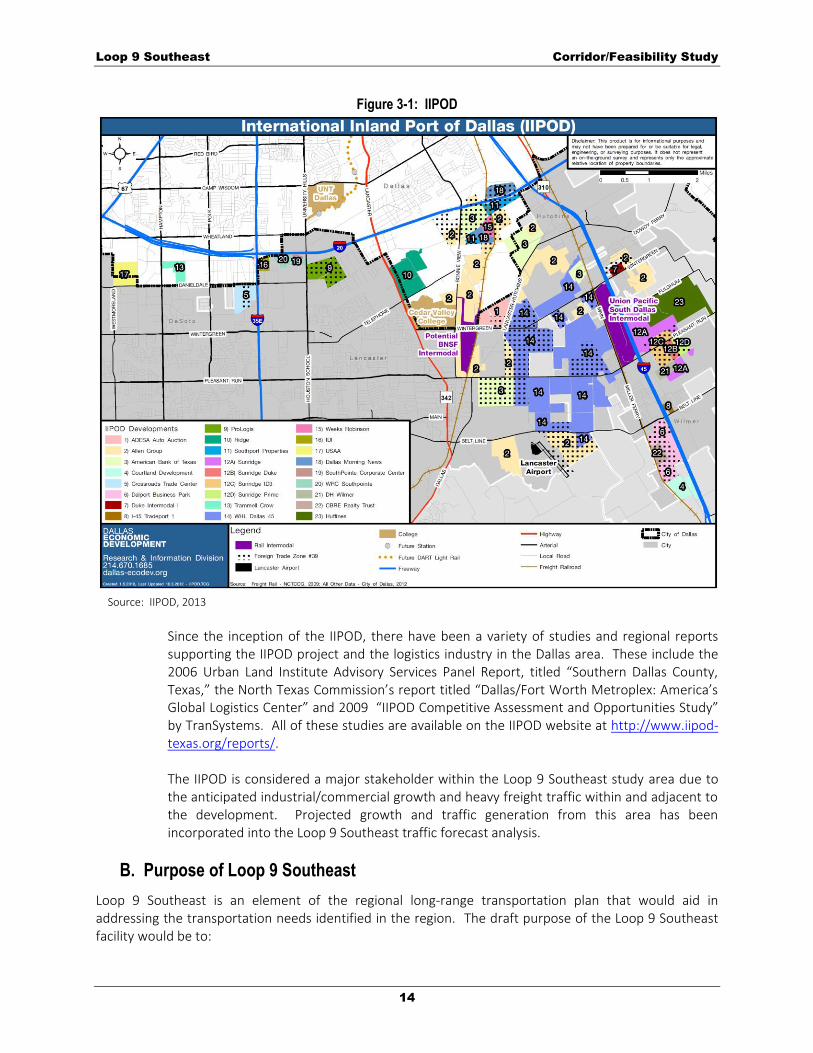
Loop 9 Southeast Corridor/Feasibility Study
14
Figure 3-1: IIPOD
Source: IIPOD, 2013
Since the inception of the IIPOD, there have been a variety of studies and regional reports supporting the IIPOD project and the logistics industry in the Dallas area. These include the 2006 Urban Land Institute Advisory Services Panel Report, titled “Southern Dallas County, Texas,” the North Texas Commission’s report titled “Dallas/Fort Worth Metroplex: America’s Global Logistics Center” and 2009 “IIPOD Competitive Assessment and Opportunities Study” by TranSystems. All of these studies are available on the IIPOD website at http://www.iipod-texas.org/reports/.
The IIPOD is considered a major stakeholder within the Loop 9 Southeast study area due to the anticipated industrial/commercial growth and heavy freight traffic within and adjacent to the development. Projected growth and traffic generation from this area has been incorporated into the Loop 9 Southeast traffic forecast analysis.
B. Purpose of Loop 9 Southeast
Loop 9 Southeast is an element of the regional long-range transportation plan that would aid in addressing the transportation needs identified in the region. The draft purpose of the Loop 9 Southeast facility would be to:

Loop 9 Southeast Corridor/Feasibility Study
15
Provide an east-west transportation facility to serve the communities in the area.
Reduce local area congestion and travel time.
Provide support for economic development within the region.
Loop 9 Southeast Corridor/Feasibility Study
16
4. STUDY AREA CHARACTERISTICS
A. Regional Planning Context
The NCTCOG is a voluntary association of, by and for local governments, and was established to assist local governments in planning for common needs, cooperating for mutual benefit, and coordinating for sound regional development. NCTCOG serves a 16-county region of North Central Texas, which is centered around the two urban centers of Dallas and Fort Worth. NCTCOG has over 230 member governments including 16 counties, numerous cities, school districts, and special districts. The NCTCOG serves as the MPO for regional transportation planning in the DFW area. The RTC is the independent transportation policy body of the MPO and is comprised of elected officials and appointed staff representing the counties, municipalities, and transportation providers in the region. Since the early 1970s, MPOs have had the responsibility of developing and maintaining a MTP. The MTP is a federally mandated document that serves to identify transportation needs and guides federal, state, and local transportation expenditures. The MTP includes over 70 policies set by the RTC to help guide the development, implementation, and operation of transportation projects. For example, RTC policy FT3-008 encourages the early preservation of ROW in recommended corridors, and FT3-009 encourages the preservation of ROW in all freeway/tollway corridors to accommodate future transportation needs, to accommodate the ultimate new location, access controlled transportation facility that would meet the long-term needs of the region. Loop 9 Southeast has been a substantial and long-standing component of the regional MTP. The inclusion of Loop 9 Southeast in Mobility 2035 – 2013 Update, the most recently adopted MTP, indicates continued regional support. There have been 11 regional transportation plans; Loop 9 Southeast has been included in each of these plans (Table 4-1). The recommendations of this Corridor/Feasibility Study would be incorporated into the MTP, as appropriate.
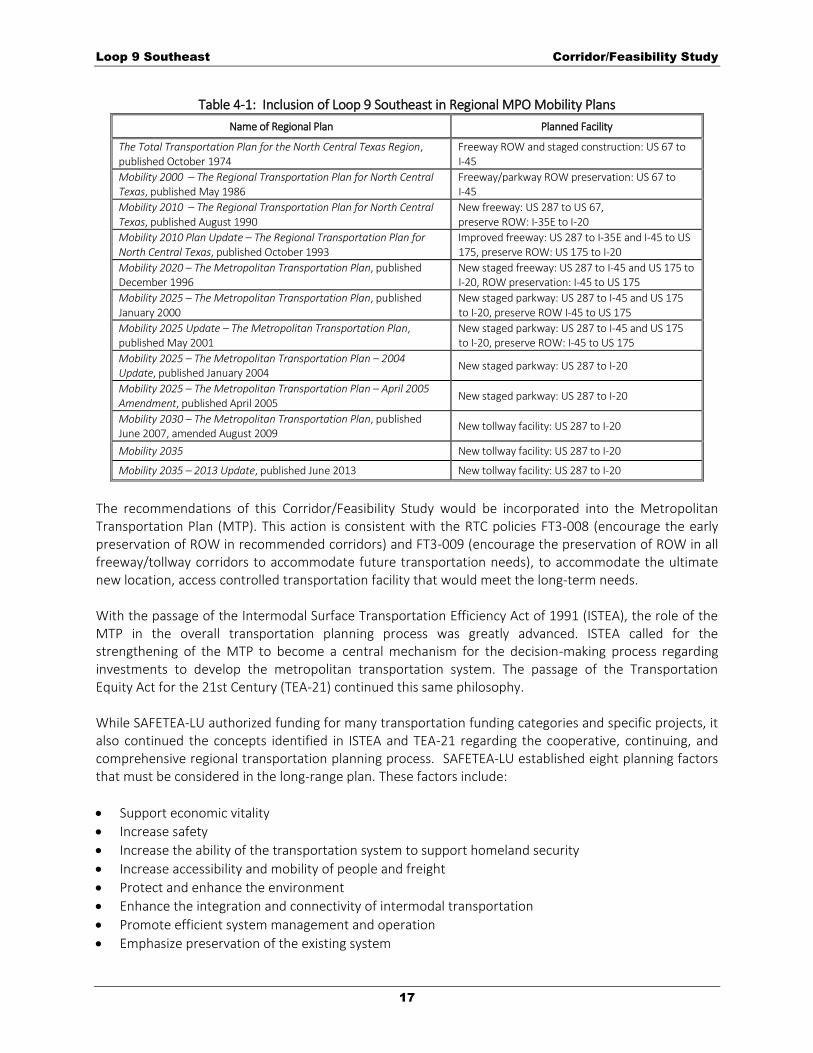
Loop 9 Southeast Corridor/Feasibility Study
17
Table 4-1: Inclusion of Loop 9 Southeast in Regional MPO Mobility Plans
Name of Regional Plan Planned Facility
The Total Transportation Plan for the North Central Texas Region, published October 1974
Freeway ROW and staged construction: US 67 to I-45
Mobility 2000 – The Regional Transportation Plan for North Central Texas, published May 1986
Freeway/parkway ROW preservation: US 67 to I-45
Mobility 2010 – The Regional Transportation Plan for North Central Texas, published August 1990
New freeway: US 287 to US 67, preserve ROW: I-35E to I-20
Mobility 2010 Plan Update – The Regional Transportation Plan for North Central Texas, published October 1993
Improved freeway: US 287 to I-35E and I-45 to US 175, preserve ROW: US 175 to I-20
Mobility 2020 – The Metropolitan Transportation Plan, published December 1996
New staged freeway: US 287 to I-45 and US 175 to I-20, ROW preservation: I-45 to US 175
Mobility 2025 – The Metropolitan Transportation Plan, published January 2000
New staged parkway: US 287 to I-45 and US 175 to I-20, preserve ROW I-45 to US 175
Mobility 2025 Update – The Metropolitan Transportation Plan, published May 2001
New staged parkway: US 287 to I-45 and US 175 to I-20, preserve ROW: I-45 to US 175
Mobility 2025 – The Metropolitan Transportation Plan – 2004 Update, published January 2004
New staged parkway: US 287 to I-20
Mobility 2025 – The Metropolitan Transportation Plan – April 2005 Amendment, published April 2005
New staged parkway: US 287 to I-20
Mobility 2030 – The Metropolitan Transportation Plan, published June 2007, amended August 2009
New tollway facility: US 287 to I-20
Mobility 2035 New tollway facility: US 287 to I-20
Mobility 2035 – 2013 Update, published June 2013 New tollway facility: US 287 to I-20
The recommendations of this Corridor/Feasibility Study would be incorporated into the Metropolitan Transportation Plan (MTP). This action is consistent with the RTC policies FT3-008 (encourage the early preservation of ROW in recommended corridors) and FT3-009 (encourage the preservation of ROW in all freeway/tollway corridors to accommodate future transportation needs), to accommodate the ultimate new location, access controlled transportation facility that would meet the long-term needs.
With the passage of the Intermodal Surface Transportation Efficiency Act of 1991 (ISTEA), the role of the MTP in the overall transportation planning process was greatly advanced. ISTEA called for the strengthening of the MTP to become a central mechanism for the decision-making process regarding investments to develop the metropolitan transportation system. The passage of the Transportation Equity Act for the 21st Century (TEA-21) continued this same philosophy. While SAFETEA-LU authorized funding for many transportation funding categories and specific projects, it also continued the concepts identified in ISTEA and TEA-21 regarding the cooperative, continuing, and comprehensive regional transportation planning process. SAFETEA-LU established eight planning factors that must be considered in the long-range plan. These factors include:
Support economic vitality
Increase safety
Increase the ability of the transportation system to support homeland security
Increase accessibility and mobility of people and freight
Protect and enhance the environment
Enhance the integration and connectivity of intermodal transportation
Promote efficient system management and operation
Emphasize preservation of the existing system

Loop 9 Southeast Corridor/Feasibility Study
18
While SAFETEA-LU officially expired in September 2009, continuing resolutions passed by the US Congress enable it to persist in providing the legislative backdrop for federal surface transportation activities. Mobility 2035 was developed to fully meet all SAFETEA-LU requirements. In the time since the original Mobility 2035 plan was adopted, a new surface transportation bill, Moving Ahead for Progress in the 21st Century, or MAP-21 (Public Law 112-141) was signed into law on July 6, 2012. MAP-21 is focused on streamlining the country’s surface transportation programs. During the development of the Mobility 2035 – 2013 Update, official rulemaking and guidance for MAP-21 was not available; therefore, this plan was developed to meet requirements established under SAFETEA-LU. Both SAFETEA-LU and the Clean Air Act Amendments of 1990 (CAAA) impose certain requirements on the long-range transportation plan in an urbanized area.
Transportation plans such as Mobility 2035 – 2013 Update, according to SAFETEA-LU metropolitan planning regulations, must be “fiscally constrained,” that is, based on reasonable assumptions about future transportation funding levels. Mobility 2035 – 2013 Update currently identifies the Loop 9 Southeast project cost at $5.76 billion for the year of expenditure with a projected opening date from 2029-2035. As the project phases develop, the MTP and Transportation Improvement Program (TIP) would need to be updated accordingly. Because some counties in the DFW area are designated as moderate non-attainment areas for the 8-hour ozone standard, the CAAA require the transportation plan to be in conformity with the State Implementation Plan (SIP) for air quality to demonstrate that projects in the MTP meet air quality goals. These recommendations would be incorporated into the MTP. This action is consistent with the RTC policies FT3-008 (encourage the early preservation of ROW in recommended corridors) and FT3-009 (encourage the preservation of ROW in all freeway/tollway corridors to accommodate future transportation needs) to accommodate the ultimate new location, access controlled transportation facility that would meet the long-term needs of the region. This project is located within Dallas County which part of the Dallas-Fort Worth area that has been designated by EPA as a moderate non-attainment area for the 8-hour standard for the pollutant ozone; therefore, the transportation conformity rule applies. Dallas County has been designated as part of a 10-county moderate non-attainment area for 8-hour ozone by the U.S. Environmental Protection Agency (EPA). In accordance with the metropolitan planning regulations, Mobility 2035 – 2013 Update must include a Congestion Mitigation Process (CMP) to systematically address congestion. The evaluation of additional transportation system improvements beyond the committed system began with a detailed assessment of transportation improvements that would not require building additional facilities for single occupant vehicles (SOV). Various improvements/modes including congestion management strategies, bicycle and pedestrian facilities, rail facilities, High Occupancy Vehicle (HOV) lanes, managed lanes, and toll road facilities were investigated prior to determining the need for additional capacity improvements. Transportation system performance information was developed as a product of the DFW Regional Transportation Model (DFWRTM) travel model throughout the MTP development process. This information guided development of the system alternatives and indicated the impact of various improvements. The improvements recommended in Mobility 2035 – 2013 Update include regional congestion management strategies, bicycle and pedestrian facilities, managed HOV lanes, light/commuter rail and bus transit improvements, intelligent transportation system (ITS) technology, freeway and tollway
Loop 9 Southeast Corridor/Feasibility Study
19
lanes, and improvements to the regional arterial and local thoroughfare system such as intersection improvements and signal timing.
B. Planned Economic Development/Projected Growth
A review of available planning and development information was collected for communities within the study area. This data was used to identify the economic climate and vision for development within the study area.
1) Balch Springs
The City of Balch Springs does not currently have a comprehensive plan available for review. However; the May 2011 Land Use Concept Plan shows the city anticipates growth and associated changes in the future. Interviews with local officials indicate that most of the proposed development and changes in land use are anticipated to occur outside of the Loop 9 Southeast study area.
2) Cedar Hill
The City of Cedar Hill adopted its comprehensive plan in 2008, asserting that the document is “a Comprehensive Plan will be a statement of policy, priority, and direction that will be used to guide the City, community organizations, and business as they develop plans to maintain and improve our premier community.” Essentially, it is the mechanism used for setting goals, recommendations, policies and implementation programs that guide the development of Cedar Hill. The transportation section of the comprehensive plan states that the thoroughfare system sets “…the framework for community growth and development and, along with the future land use plan, forms a long-range statement of public policy.” The plan provides community goals and objectives relative to the transportation system, land use, livability, community facilities, and housing and neighborhoods. Specifically, the city identifies a growth goal relative to the Loop 9 Southeast project calling for primarily non-residential, mixed-use land use development near the Loop 9 Southeast project area. The city indicated a preference for the southern DEIS alignment of the Loop 9 Southeast project through their planning documents. It also indicates that a business campus development or other high quality employment areas should be pursued along the Loop 9 Southeast project to maximize the regional location. During interviews, local officials indicated that the city center plan is currently underway and updates to the City Park Master Plan (2012) should be considered during development activities to address multimodal transportation options and streetscape alternatives within the Loop 9 Southeast Corridor. Loop 9 Southeast would incorporate these plans into future studies.
3) Combine
The City of Combine does not currently have a comprehensive plan or thoroughfare plan available for review. An interview survey was not returned for consideration in this report.
Loop 9 Southeast Corridor/Feasibility Study
20
4) DeSoto
According to its 2003 comprehensive plan, the vision for the City of DeSoto, is to, “Live, work and play in DeSoto, a progressive community with a small-town feeling, rich in diversity and the cultural arts.” The primary land use goal is to balance land uses that will provide and protect the desired quality of life, and recognize the topographic features that make DeSoto a distinctive place to live, work and visit. Loop 9 Southeast is discussed in the plan which suggests that the land uses in the corridor vicinity would be reevaluated upon implementation.
The transportation goal listed in the comprehensive plan is to provide for the safe and efficient movement of goods and people to, from and within DeSoto. This would allow the city to address the current and forecasted future transportation needs of residents and businesses in a way that benefits the economy and quality of life of DeSoto. The purpose of Loop 9 Southeast is consistent with that goal. During interviews, local officials indicated that the comprehensive plan is being updated and redevelopment plans are under investigation along Hampton Road from Pleasant Run to Belt Line Road.
5) Ferris
The City of Ferris does not currently have a comprehensive plan or thoroughfare plan available for review. During interviews, local officials indicated that a comprehensive plan to guide future development and growth patterns in the city is being prepared. City officials anticipate growth based on the availability of land and discussions with area developers.
6) Glenn Heights
Interviews with local officials indicated that they have a comprehensive plan completed in July 2011 which includes the Loop 9 Southeast project. Modifications to zoning and future land use plans are anticipated once Loop 9 Southeast is constructed. Overall, the city projects future growth and new development in the form of a Town Center at the Hampton Road/Loop 9 Southeast intersection, which will contain mixed use/commercial land uses.
7) Lancaster
The February 2002 comprehensive plan for the City of Lancaster incorporates a thoroughfare plan and future land use objectives for the growth and development of the city.
The thoroughfare plan for the City of Lancaster “…is intended to provide urban design criteria and pedestrian mobility concepts in addition to recommendations for improving existing multi-modal traffic needs and accommodating traffic that will result from future growth and development in the City.” The plan addresses the existing network, assesses its deficiencies, and offers recommendations for improvements. It defines policies for adherence to the vision and goals of the City of Lancaster. The City of Lancaster also identifies future land use within its comprehensive plan. Specifically, it outlines the types and intensity of land uses as well as the different
Loop 9 Southeast Corridor/Feasibility Study
21
thoroughfare facilities that would support these land use patterns. Loop 9 Southeast was included in their planning initiatives. During interviews, local officials indicated that the city is working to update the comprehensive plan. Zoning for recently annexed areas is currently designated as agricultural until future change is necessary to address development. This includes land adjacent to the Loop 9 Southeast corridor.
8) Mesquite
The vision for the City of Mesquite as stated in its 2013 comprehensive plan is, “A livable community with quality neighborhoods, convenient amenities, strong retail tax base, and opportunities for the future.” The city is positioned and supportive of growth and expansion that will incorporate these elements as well as any complementary features and infrastructure that encourage sustainability. The comprehensive plan, adopted in 2007, is one of a variety of tools in place to document the vision for the City of Mesquite. Also available are the extraterritorial jurisdiction comprehensive plan element that was prepared in 2008, its thoroughfare plan map that was prepared in 2008, as well as a zoning map, which was updated in 2009. All of these elements complement the vision for the City of Mesquite. The thoroughfare plan map identifies key corridors and sets roadway standards for ROW, geometric configuration, and classification. The 2007 comprehensive plan provides clear goals and includes items such as economic development, improved mobility, green community and quality neighborhoods. The zoning map provides the ultimate development guidance outlining the appropriate uses for the city. Loop 9 Southeast was incorporated in each of these planning initiatives.
9) Midlothian
For the City of Midlothian comprehensive plan, developed in 2007, community stakeholders were engaged in identifying a long-range statement of public policy. Five priorities were defined:
Respond to growth and development pressures by an approved method based on the values and desires of the community
Establish a balanced level of service based on community values and desires
Coordinate public and private investment
Minimize the impacts associated between residential and commercial uses
Provide a basis for rational and reasonable decision-making to take place regarding community development
The planning documents for the City of Midlothian include a 2025 comprehensive plan that was developed in 2007 and a thoroughfare map that was revised in 2009. The chapter in the plan that addresses transportation outlines goals and objectives in terms of efficiency, safety, complementary features between downtown and suburban areas, traffic management as well as multi-modal needs. The Loop 9 Southeast project is identified as a proposed regionally significant highway.
Loop 9 Southeast Corridor/Feasibility Study
22
The land use goals and objectives reflect a rural character and family-oriented quality of life of Midlothian. However, Midlothian also supports economic development, sustainable growth and enhanced schools for its residents. The city plans to link the locations of strong economic development emphasis with the rest of the community through pedestrian trails as well as roadway improvements. Loop 9 Southeast is identified as a corridor that can help accomplish this objective.
10) Oak Leaf
The City of Oak Leaf does not currently have a comprehensive plan or thoroughfare plan available for review. During interviews, local officials indicated that there are no conceptual or site plans for the developable areas in southern Oak Leaf.
11) Ovilla
The comprehensive plan for the City of Ovilla states that, “[t]he purpose of a Comprehensive Land Use Plan is to give direction to future development in order to avoid the creation of incompatible physical impacts.” The plan states that the city considers itself as rural and therefore, maintaining open space, natural vegetation and the quality of life are key elements for the community. The goals in support of the thoroughfare plan emphasize the need to establish a priority list and determine what the transportation needs are for the city. The plan does include a reference to the proposed Loop 9 Southeast project. During interviews, local officials indicated that industrial development would likely occur along Bear Creek Road at the Loop 9 Southeast alignment area, but there were no specific plans or developers identified to date.
12) Red Oak
The City of Red Oak updated its comprehensive plan in 2010. One of the key transportation objectives in the plan is to consider the Loop 9 Southeast project and provide connectivity with the existing infrastructure. Other objectives include the promotion of better circulation patterns to ease congestion and requiring a minimum number of connections between neighborhood developments during plat approval. These concepts establish an improved connection between land use and transportation planning, particularly in regards to accommodating growth. The future land use discussion focuses on balancing development with the vision and character of the city, incorporating diverse uses to promote economic stability, balancing residential options, and establishing a logical city boundary. The city supports growth as long as it is mindful of these principles. During interviews, local officials identified proposed zoning changes at Bear Creek Road and FM 342 from agricultural land to commercial land. Additionally, officials are working to increase commercial development in Red Oak near I-35 and the Loop 9 Southeast area.
Loop 9 Southeast Corridor/Feasibility Study
23
13) Seagoville
The thoroughfare plan for the City of Seagoville was last updated in 2006. It establishes roadway classifications and outlines the preferred construction and operating standards within the jurisdiction of the city. The 2009 zoning map clearly defines the types of uses that are permitted within the city boundaries and includes a substantial amount of land zoned for agriculture. Loop 9 Southeast project was considered during city planning initiatives. During interviews, local officials indicated that the city is currently preparing a comprehensive plan. The plan will focus on establishing quick/safe routes for residents to their places of employment. It will also focus on strategies to renovate the old downtown area to improve the economy of the city.
14) Wilmer
The comprehensive plan for the City of Wilmer addresses four focus areas: infrastructure, community identity, governance, and economic development. The plan includes strategies to improve the fundamentals of the four focus areas over a 20-year horizon. Wilmer officials continue to apply these strategies to guide development and prepare for the changes within their community. The plan considers both future land use and thoroughfare planning. The future land use discussion identifies goals, objectives and strategies that focus on preserving open space, community character, and the historic town center while maximizing economic development potential. The thoroughfare plan focuses on three goals with supporting objectives and strategies that include minimizing the impact of truck traffic on the local street network; improving the quality of the city street network; and increasing access to alternative modes of transportation for residents of Wilmer. During interviews, local officials indicated that the city is anticipating population increases which will expand residential communities. The areas of the community where population growth would be focused are south of Belt Line Road east of I-45. The development of Loop 9 Southeast is not expected to affect that desired outcome.
C. Transportation System
1) Existing and Planned Transportation System
Within the study area, there are numerous transportation facilities that provide access and circulation. These include interstate highways, principal highways, regional arterials, local road network, railroads, and passenger rail. Figure 4-1 shows the proposed Loop 9 facility in relation to other facilities within the study area. Figures 4-2 and Figure 4-3 respectively present roadway and passenger rail funded recommended projects from the Mobility 2035 – 2013 Update plan. Table 4-2 describes the existing and future lanes of major roadway facilities. The majority of sections of I-20, I-45 and
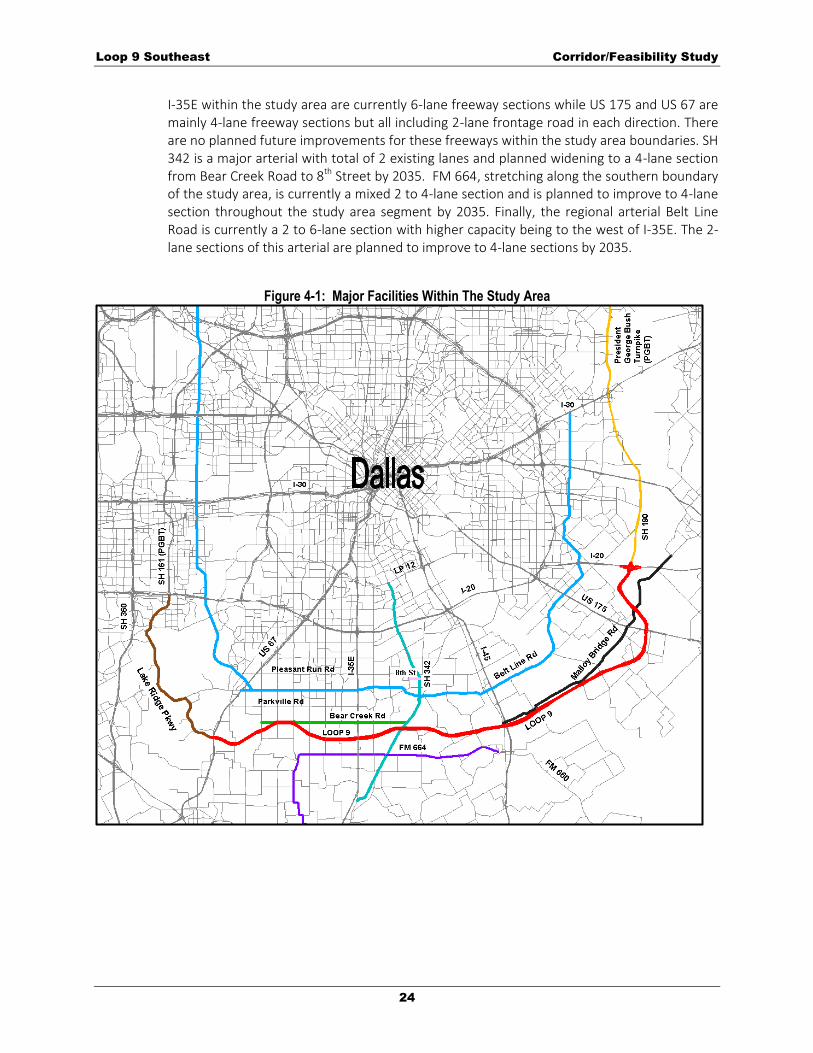
Loop 9 Southeast Corridor/Feasibility Study
24
I-35E within the study area are currently 6-lane freeway sections while US 175 and US 67 are mainly 4-lane freeway sections but all including 2-lane frontage road in each direction. There are no planned future improvements for these freeways within the study area boundaries. SH 342 is a major arterial with total of 2 existing lanes and planned widening to a 4-lane section from Bear Creek Road to 8th Street by 2035. FM 664, stretching along the southern boundary of the study area, is currently a mixed 2 to 4-lane section and is planned to improve to 4-lane section throughout the study area segment by 2035. Finally, the regional arterial Belt Line Road is currently a 2 to 6-lane section with higher capacity being to the west of I-35E. The 2-lane sections of this arterial are planned to improve to 4-lane sections by 2035.
Figure 4-1: Major Facilities Within The Study Area

Loop 9 Southeast Corridor/Feasibility Study
25
Figure 4-2: Mobility 2035 – 2013 Update Funded Roadway Recommendations
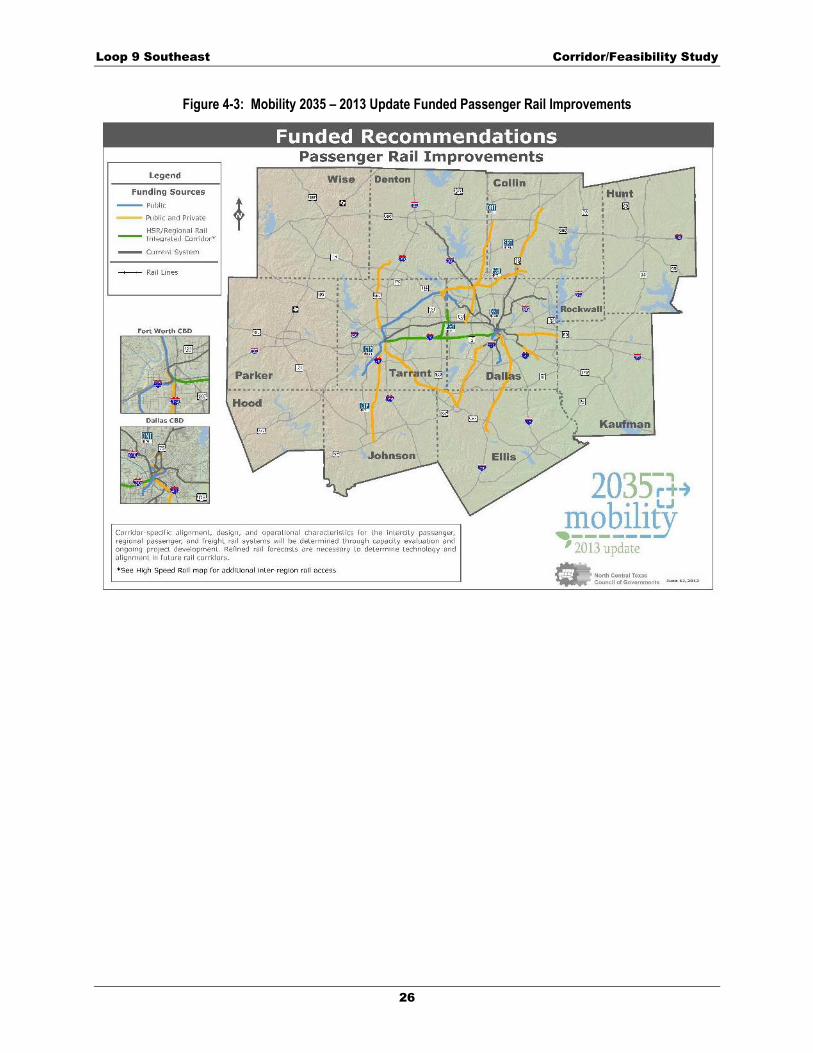
Loop 9 Southeast Corridor/Feasibility Study
26
Figure 4-3: Mobility 2035 – 2013 Update Funded Passenger Rail Improvements

Loop 9 Southeast Corridor/Feasibility Study
27
Table 4-2: Major Roadway Facilities within the Loop 9 Study Area
Facility Direction of
Facility Existing Facility Planned Facility*
I-20 East-West 6 mainlanes with
discontinuous 2 lane frontage roads
Same; no improvements planned
US 175 East-West 4 mainlanes with 2-lane
frontage roads Same; no
improvements planned
I-45 North-South 6 mainlanes with
discontinuous 2-lane frontage roads
Same; no improvements planned
SH 342 North-South 2 lanes Widen to 4 lanes from Bear Creek Rd to 8th St
I-35E North-South 6 - 8 mainlanes with
2-lane frontage roads
Same; no improvements planned
US 67 North-South 4 - 6 mainlanes with
2-lane frontage roads
Same; no improvements planned
FM 1382 (Belt Line Road)
East-West 2 to 6 lanes Widen to 4/6 lanes
FM 664 (Ovilla Road)
East-West 2 - 4 lanes Widen to 4 lanes
Sources: NCTCOG, 2011. * As identified in Mobility 2035 – 2013 Update
2) Interstate Highway System
Three interstate highways are within the study area: I-20, I-45, and I-35E. I-20 is a major east-west facility passes through the northeastern portion of the study area and serves as the southern portion of a partial loop around the Dallas Metroplex. I-20 extends from its connection at I-10, east of El Paso, to the east through the southeastern portion of the U.S. to its terminus in South Carolina at I-95. I-45 passes through the eastern portion of the study area and extends south from the Dallas Central Business District through Houston to the Gulf Coast. Truck lane restrictions currently exist along sections of I-45 in Dallas and Ellis Counties from I-30 in Dallas to FM 3413 in Ennis. I-35E is a major north-south corridor passes through the center of the study area and provides interstate access from Laredo, Texas, at the U.S.-Mexican border through Dallas to northeastern Minnesota.
3) Principal Highways
Two principal U.S. highways traverse the study area: US 175 and US 67. US 175 is a southeasterly highway passes through the eastern portion of the study area in Seagoville and extends from central Dallas to Jacksonville, Texas. US 67 is a northeasterly highway which passes through the western portion of the study area in Cedar Hill and Midlothian, and extends from Presidio, Texas at the U.S.-Mexican border north through Dallas to its terminus in southeastern Iowa.
4) Regional Arterial System
Several regional arterial roadways traverse the study area. These roadways include SH 342 (Dallas Avenue), FM 1382 (Belt Line Road), FM 664 (Ovilla Road), Hampton Road, Malloy
Loop 9 Southeast Corridor/Feasibility Study
28
Bridge Road, and FM 740. A system of local arterial streets supports the regional roadway network to provide for travel to and within the study area. Major east-west arterials include Parkerville Road and Bear Creek Road. North-south arterials include Cedar Hill Road, Clark Road, Joe Wilson Road, Duncanville Road, Cockrell Hill Road, Westmoreland Road, Hampton Road, Houston School Road, Seagoville/Kaufman Street, Combine Road, Lasater Road, and Lawson Road.
5) Transit
Within the study area, Dallas and Glenn Heights are members of Dallas Area Rapid Transit (DART). DART provides transit service to Glenn Heights through a park-and-ride on Bear Creek Road west of I-35E, with daily express bus service to downtown Dallas. In spring of 2012, DART inaugurated an express bus service between Hanby Stadium in Mesquite and Lawnview Station on the DART Green Line. The service is the result of an Interlocal Agreement between DART and the City of Mesquite and is the first between the agency and a non-member city. No transit centers are located within the study area, but the two closest are located near US 175 and Lake June Road in Balch Springs (Lake June Transit Center) and near US 67 and Hampton Road in Dallas (Red Bird Transit Center). Figure 4-4 shows existing rail routes within DART service area. As shown, there are no existing rail routes stretching through the study area. As shown in Figure 4-4, there are several extensions of passenger rail service included in Mobility 2035 - 2013 Update. These include:
Extending the DART Green Line from Buckner Boulevard to South Belt Line Road.
A new Mansfield regional rail line from the Fort Worth ITC to Midlothian.
A new Midlothian regional rail line from the DART Westmoreland Station to Midlothian Central.
A new Waxahachie regional rail line from Downtown Dallas to Waxahachie.
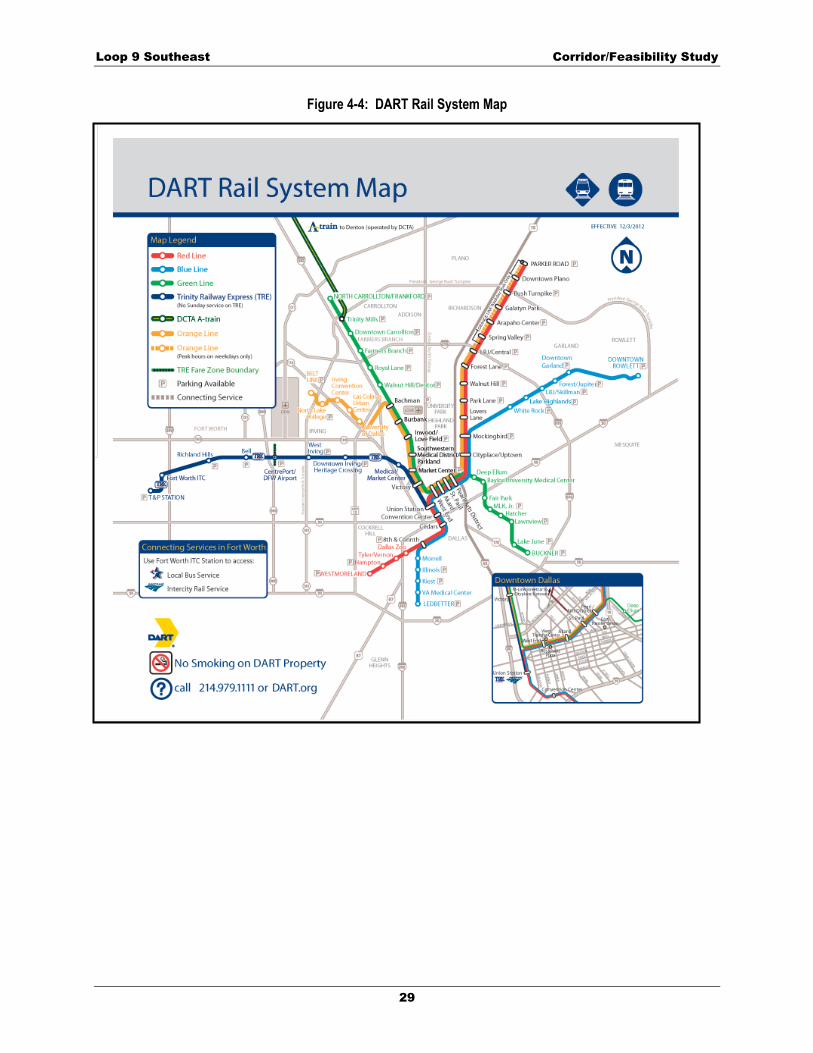
Loop 9 Southeast Corridor/Feasibility Study
29
Figure 4-4: DART Rail System Map
Loop 9 Southeast Corridor/Feasibility Study
30
DART also offers curb-to-curb paratransit services to disabled residents of Dallas and Glenn Heights that are unable to use fixed route DART bus or train service. Paratransit-eligible passengers with valid paratransit photo identification ride free on DART rail and buses and the Fort Worth Transportation Authority (The T) buses.
6) Non-Motorized Transportation Modes
There are various independent bicycle/pedestrian paths developed and planned as part of parks/open space initiatives in various cities in the study area. Regionally, Mobility 2035 – 2013 Update includes a regional system of bicycle paths called the Veloweb designed for faster moving, commuting cyclists along several major power transmission line easements in the cities of Glenn Heights and Lancaster. One trail in Glenn Heights is listed as a Veloweb “candidate” route; however, the route does not cross the Loop 9 Southeast project ROW.
7) Freight Railroad and Truck Facilities
Four rail lines provide freight service through the study area. A Union Pacific Rail Road (UPRR) line (formerly Southern Pacific Railroad) parallels US 175. A second UPRR line extends along I-45 through the Wilmer and Ferris area, and a third UPRR line extends along SH 342 through Lancaster and Red Oak. The Burlington Northern Santa Fe (BNSF) Railway has one line that generally parallels US 67 through Cedar Hill and Midlothian. Coordination with the railroads would be conducted during development of the engineering design. Loop 9 Southeast would be constructed to meet TxDOT highway design standards and would accommodate train crossings and any vehicle currently allowed to operate in Texas. Toll gantries and other vertical clearances would accommodate all legal heights for vehicles. Loop 9 Southeast would serve as a traffic reliever for congested highways crossing southern Dallas and northern Ellis Counties, including truck and freight traffic. Improved general mobility projects would also provide freight traffic with improved access across the region and to local destinations.
8) Airports
Lancaster Regional Airport, located approximately 1.4 miles north of proposed Loop 9 Southeast alignment, is a general aviation facility located south of Belt Line Road and between I-35E and I-45. The 306-acre airport is classified as a reliever airport. The airport includes a 5,000 feet long lighted runway and has plans to extend it another 1,500 feet to the southwest. There are also three private airports located within the study area. Seagoville Airport is located approximately 0.25 miles southeast of the proposed alignment, Carroll Air Park in Red Oak is located approximately 0.5 miles north of the alignment, and Mesquite Metro is located approximately 2.5 miles north of alignment. Based on a comment received during the September 2013 Public Meeting, the Seagoville Airport plans to extend the runway approximately 2,000 feet to the north. Mesquite Metro has plans to extend the runway to the south by 1,370 feet. Expansion plans for Carroll Air Park are currently unknown.

Loop 9 Southeast Corridor/Feasibility Study
31
5. AFFECTED ENVIRONMENT
The following discussions refer to the affected environment within the Corridor/Feasibility study area and the proposed 350-foot study corridor. This corridor is shown in detail on Exhibit 1: Environmental Constraints Map.
A. Data Sources
1) Historical Information
Between 2006 and 2011, TxDOT prepared a Preliminary DEIS for the proposed Loop 9 Southeast project. At that time the project was evaluated as a 6-lane, new location controlled access tollway, with intermittent access roads between US 287 and I-20. The corridor width ranged from 450-600 feet, sometimes wider to accommodate a major interchange. The Preliminary DEIS evaluated the potential natural, cultural, and socio-economic impacts for those limits. The information previously gathered during the preparation of the Preliminary DEIS was utilized for this Corridor/Feasibility Study.
2) 2012 and 2013 Updated Data
Desktop Analysis While much of the resource data used for this Corridor/Feasibility Study was obtained from the Loop 9 Southeast Preliminary DEIS efforts, some resource information was updated for this study. The floodplain data was updated using the most current Flood Insurance Rate Maps (FIRM) from the Federal Emergency Management Agency (FEMA). Public facilities data was updated using the most current data from StreetMap (a Geographic Information System [GIS] based mapping system).
Windshield Survey A windshield survey conducted in November and December 2012 was used to verify the Preliminary DEIS resource information as well as to identify additional resources that were not documented in the Preliminary DEIS. These newly identified sites and DEIS resources are shown on the Environmental Constraints Maps (Exhibit 1).
B. Social Conditions
1) Land Use
Land use in the study area was identified by interpretation of 2012 aerial photography. These preliminary assessments were verified and further refined through field investigations in 2013. This section describes the current land uses in the study area.
The land use in the study area can be characterized as a combination of suburban, rural development, and agricultural lands. In and near each of the study area communities, land uses consist of: low-to-mid density residential development; a mix of industrial, office, institutional (public/semi-public) development; and supporting commercial/retail land uses. In rural sections of the study area, land uses generally consist of a mix of low-density residential development, limited light industrial/retail land uses, agricultural lands, and large amounts of vacant land. The study area was divided into three major areas (US 67 to IH 35E, I-35E to I-45, and I-45 to I-20) for ease of discussion and evaluation.
Loop 9 Southeast Corridor/Feasibility Study
32
US 67 to I-35E Near the US 67 intersection, land uses are primarily commercial and residential. Pecan Trails Golf Course is located east of US 67 (Exhibit 1, Sheet 2). Two limestone quarries are also located in this corridor near US 67 and Lake Ridge Parkway. The Holcim Quarry is located east of US 67. Ash Grove Cement Company is located west of US 67 and south of Lake Ridge Parkway. The study corridor crosses the BNSF railroad just east of US 67, and six major cross streets (Joe Wilson Road, Duncanville Road, Cockrell Hill Road, Westmoreland Road, Hampton Road, and S. Uhl Road). This area passes through the communities of Midlothian, Cedar Hill, Ovilla, Glenn Heights, DeSoto, and Red Oak. Suburban developments are located around these communities. These areas are shown on Exhibit 1, Sheets 2-8. This study corridor also crosses North Prong Creek, Little Creek, and several other unnamed tributaries.
I-35E to I-45 Both suburban and rural residential developments are situated Near I-35E and throughout a majority of this area. Near I-45, there are several major industrial developments including the IIPOD, the Skyline Landfill operated by Waste Management, and the Lancaster Regional Airport. The Old Brickyard Golf Course is also just west of I-45.
The study corridor crosses the BNSF railroad just west of SH 342, the UPRR railroad just west of I-45, and five major cross streets (Houston School Road, SH 342, Reindeer Road, Nokomis Road, and Ferris Road). This area passes through the communities of Lancaster, Red Oak, Oak Leaf, Ferris, and Wilmer. Suburban developments are located around these communities. These areas are shown on Exhibit 1, Sheets 8-15. This study corridor also crosses Bear Creek, Ten Mile Creek, and several other unnamed tributaries. I-45 to I-20 Near the I-45 intersection, the land use consists of the 100-year floodplain of Ten Mile Creek and a few residential developments. The Carver Memorial Park cemetery (Exhibit 1, Sheet 15) is located just east of I-45 and north along Malloy Bridge Road. The study corridor passes just north of the Trinity River Authority Ten Mile Creek Regional Wastewater System plant. Between I-45 and I-20, the area is largely undeveloped, except for the Mesquite and Seagoville areas, and crosses the Trinity River and East Fork Trinity River floodplains. The Trinity River Greenbelt Preserve Riverbend Section is located adjacent to the Trinity River. The study corridor crosses US 175 between the Roselawn Cemetery and The Rock Church (Exhibit 1, Sheet 23). The Roselawn Cemetery is located approximately 1,700 feet from the proposed corridor. The Rock Church, located south of US 175 near FM 1389, is within a proposed interchange location along the study area. Also, industrial, single-family, and other residential land uses are located along Ballard Road and Combine Road. Three other cemeteries are situated within this area. Patrick Baptist Church and Pruitt Cemetery, located east of the Trinity River off Parkinson Road, is located approximately 0.6 miles north of the study corridor. Grange Hill Cemetery, in Combine, is located
Loop 9 Southeast Corridor/Feasibility Study
33
approximately 0.6 miles south of the study corridor. Gravel Slough Cemetery is located east of I-45 along Malloy Bridge Road near Nokes Road (Exhibit 1, Sheet 18). Small areas of single-family residential homes are located throughout this area and vacant land is abundant. The study corridor crosses eight major cross streets (Parkinson Road, Nokes Road, Bois D’Arc Road, Bilindsay Road, Combine Road, Kaufman Street, US 175, and Malloy Bridge Road). The study corridor passes through the communities of Ferris, Wilmer, Combine, Seagoville, Balch Springs, and Mesquite. Suburban developments are located around these communities. These areas are shown on Exhibit 1, Sheets 15-28. The study corridor also crosses Cottonwood Creek, Gravel Slough, the Trinity River, Parson Slough, the East Fork Trinity River, and several other unnamed tributaries.
2) Community Resources
The Loop 9 Southeast study area spans three counties (Dallas, Kaufman, and Ellis) and includes 14 cities of varying size. These cities include Balch Springs, Cedar Hill, Combine, DeSoto, Ferris, Glenn Heights, Lancaster, Mesquite, Midlothian, Oak Leaf, Ovilla, Red Oak, Seagoville, and Wilmer. The cities can be characterized as a collection of loosely knit communities/neighborhoods that lie outside the southern fringes of the Dallas Metropolitan area. The neighborhoods are predominantly composed of single-family residences with pockets of commercial properties concentrated along the local and/or regional arterials within each city. Community facilities are scattered throughout the study area. Public schools are administered by nine Independent School Districts (ISDs) within the study area. Mesquite ISD, Dallas ISD, Lancaster ISD, DeSoto ISD, and Cedar Hill ISD serve Dallas County. Crandall ISD serves Kaufman County. Red Oak ISD and Midlothian ISD serve Ellis County. Ferris ISD serves portions of both Dallas and Ellis Counties. One place of worship, The Rock Church, is a non-denominational church located along US 175 near FM 1389 in Seagoville (Exhibit 1, Sheet 23). The church was established in 1981 and serves as a gathering place for religious services, religious education, and social functions for members.
3) Cultural Resources
Non-Archeological Historic-Age Resources Information regarding the locations of non-archeological historic-age resources (as mapped on Exhibit 1) was obtained from the Preliminary DEIS phase. Historic-age resource surveys were conducted as part of the Preliminary DEIS effort for much of the area of potential effects (APE) for the DEIS Alternatives. The APE for historic structures was defined as extending 300 feet beyond the proposed ROW limits of each proposed alternative.
The Trinity River levees along both sides of the Trinity River were built by two local Dallas County levee improvement districts. The levees that cross the project area were originally constructed in the early twentieth century (ca. 1917 to 1928) and are among the earliest
Loop 9 Southeast Corridor/Feasibility Study
34
built in Dallas County and adjoining counties. The levees were built to prevent flood damage to homes and rich agricultural farmlands along both sides of the river. Preliminary research indicates that the Trinity River levees within the project corridor could potentially be eligible for listing on the National Register of Historic Places (NRHP).
Archeology A full archeological reconnaissance survey was conducted for the Preliminary DEIS Alternatives in 2007. The survey concluded that a walkover with judgmental shovel testing could be conducted in the low probability areas. The remaining areas would require archeological surveys with intensive shovel testing and/or backhoe trenching. Previous investigations in the East Fork and Trinity River floodplains and their tributaries have resulted in the identification of buried paleosols as well as archeological sites within those paleosols. The potential for buried site contexts within the floodplains of the East Fork and the main stem of the Trinity River is high. Coring and/or systematic backhoe trenching would be necessary to determine the potential for preserved site contexts where potential impacts are expected. Those sites identified within the floodplains of the smaller tributaries within the greater Trinity Basin that have yielded important and previously unknown information about the prehistory of this area would be the most important to survey.
4) Parklands and Recreational Areas
Two golf courses and a natural open space preserve exist in the study area. Their locations are shown on Exhibit 1, and each is briefly described in the following paragraphs. The Trinity River Greenbelt Riverbend Preserve is a natural open space preserve located in southeast Dallas County along the Trinity River near Malloy Bridge Road. The preserve is a 518-acre mixed hardwood forest situated primarily between the Trinity River levees. It has no formal parking or recreational amenities. The land was farmed and grazed through the 1930s, and old ranch roads provide surface trails for walking. Restrictions include no motor vehicles and no hunting or trapping. The Old Brickyard Golf Course is an 18-hole golf facility located between I-45 and North Central Street in the City of Ferris. The facility is open to the public (fees apply), is approximately 155 acres, and features 6,486 yards of golf and a clubhouse with pro shop. The property on which the golf course is located is jointly owned by the City of Ferris and Old Brickyard Group, LLC. Approximately 108 acres or 70% of the property is owned by the City of Ferris. The remaining 47 acres, or 30% of the facility, is under private ownership. The golf course is being operated and maintained by Old Brickyard Group, LLC under a 30-year lease agreement with the City of Ferris. The Pecan Trails Golf Course is an 18-hole golf facility located approximately 1.5 miles east of US 67 on Shiloh Road in the City of Midlothian. The facility is approximately 115 acres and features 4,838 yards of golf and a clubhouse with pro shop. Pecan Trails is privately owned and operated and is open to the public (fees apply).

Loop 9 Southeast Corridor/Feasibility Study
35
5) Visual Quality and Aesthetics
Visual resources, as defined by FHWA, are those physical features that make up the visual landscape, including land, water, vegetation, and man-made elements. These elements are the stimuli upon which one’s visual experience is based. Generally, the existing visual quality of the corridor ranges from moderate to high with visual and aesthetic resources including the Trinity River Greenbelt Riverbend Preserve, historic structures, parklands, open pastures, forested land, and residential housing.
6) Utilities
Utilities within the project corridor include water storage towers, microwave towers, communication towers, water lines, sewer lines, gas lines, telephone cables, and other subterranean and aerial utilities. UPRR and BNSF rail lines are also considered a major utility and were considered during the Corridor/Feasibility Study. These rail lines are shown on Exhibit 1, Sheets 10 and 15 and anticipated impacts are shown on Table 7-4.
C. Economic Conditions
1) Employment
Major employers were identified using the NCTCOG Major Employers inventory (Table 5-1). NCTCOG identifies major employers as employment establishments with a minimum of 250 full-time and part-time workers. This inventory is based on location rather than company-wide totals. An employment establishment may consist of a single building or a collection of adjacent buildings occupied by one employer, such as a college campus or business park. Major employers in the cities within the study area are listed in Table 5-1 by city and estimated full time equivalent jobs, as prepared by the NCTCOG. These represent trucking and transportation-related activities, freight consolidators, warehousing and distribution, construction and food manufacturing, higher education, hospitals and health care facilities, and several large retailers.

Loop 9 Southeast Corridor/Feasibility Study
36
Table 5-1: Major Employers
City Employer Employees Industry
Balch Springs Wal-Mart Supercenter 250-499 Retail
Mesquite City of Mesquite 1,000-2,499 Public Administration
Mesquite City of Mesquite 250-499 Public Administration
Mesquite Dallas Regional Medical Center
(formerly Medical Center of Mesquite ) 1,000-2,499 Health Care
Mesquite United Parcel Service Inc. 1,000-2,499 Transportation/Warehousing
Mesquite Wal-Mart Supercenter 250-499 Retail
Mesquite TxDOT – Dallas District 250-499 Transportation
Mesquite Christian Care Center 250-499 Health Care
Mesquite Eastfield College
(Dallas Co. Community College District) 1,000-2,499 Education
Mesquite Integra Color 250-499 Manufacturing
Mesquite Macy’s 250-499 Retail
Mesquite Dillards 250-499 Retail
Mesquite Trophy Nissan 250-499 Retail
Seagoville O'Reilly Auto Parts Distribution Center 250-499 Warehouse
Seagoville Bureau of Prisons 250-499 Public Administration
Hutchins FedEx Distribution Center 500-999 Warehouse
Hutchins Hutchins State Jail 250-499 Public Administration
Wilmer Crete Carrier Corporation 250-499 Transportation
Lancaster Swift Transportation 1,000-2,499 Transportation/Warehousing
Lancaster Brass Craft Western 250-499 Manufacturing
Lancaster Medical Center at Lancaster 250-499 Health Care
Lancaster Wal-Mart 250-499 Retail
Cedar Hill Quality Doors (Texwood) 500-999 Manufacturing
Cedar Hill Wal-Mart Supercenter 250-499 Retail
Cedar Hill JC Penny Distribution Center
(formerly Spectrum) 250-499 Warehouse
DeSoto McGraw-Hill Companies Inc. 250-499 Wholesale
DeSoto City of DeSoto 250-499 Public Administration
DeSoto Solar Turbines Inc. 250-499 Manufacturing
DeSoto Diab Inc. 250-499 Transportation/Warehousing
Duncanville Texwood Industries Inc. 1,000-2,499 Manufacturing
Duncanville Duncanville High School 250-499 Education
Grand Prairie Lockheed Martin 2,500-4,999 Manufacturing
Grand Prairie Lone Star Park 1,000-2,499 Arts/Entertainment
Grand Prairie Poly-America Inc. 1,000-2,499 Manufacturing
Grand Prairie Site Concrete Inc. 500-999 Construction
Grand Prairie Saia Motor Freight Line 500-999 Transportation
Grand Prairie Bancroft & Sons Transportation Inc. 250-499 Transportation/Warehousing
Grand Prairie Bell Helicopter Textron Plant 5 250-499 Transportation/Warehousing
Grand Prairie Pollock Paper 250-499 Wholesale
Grand Prairie Siemens Energy and Automation 500-999 Manufacturing
Grand Prairie Republican National Distributing 500-999 Transportation/Warehousing
Grand Prairie Republic National Distributing 500-999 Transportation/Warehouse
Grand Prairie Richard B Levitz Sons Inc. 250-499 Retail
Grand Prairie Grand Prairie Police Department 250-499 Public Administration
Grand Prairie Solvay Engineered Polymers 250-499 Manufacturing
Grand Prairie Dealers Auto Auction of Dallas 250-499 Wholesale
Grand Prairie Cardinal Health 200, Inc. 250-499 Wholesale
Grand Prairie Turbomeca 400 Manufacturing
Grand Prairie Eaton Electrical Inc. 250-499 Manufacturing
Grand Prairie Power Packaging Inc. 250-499 Manufacturing
Grand Prairie Printpack 250-499 Manufacturing
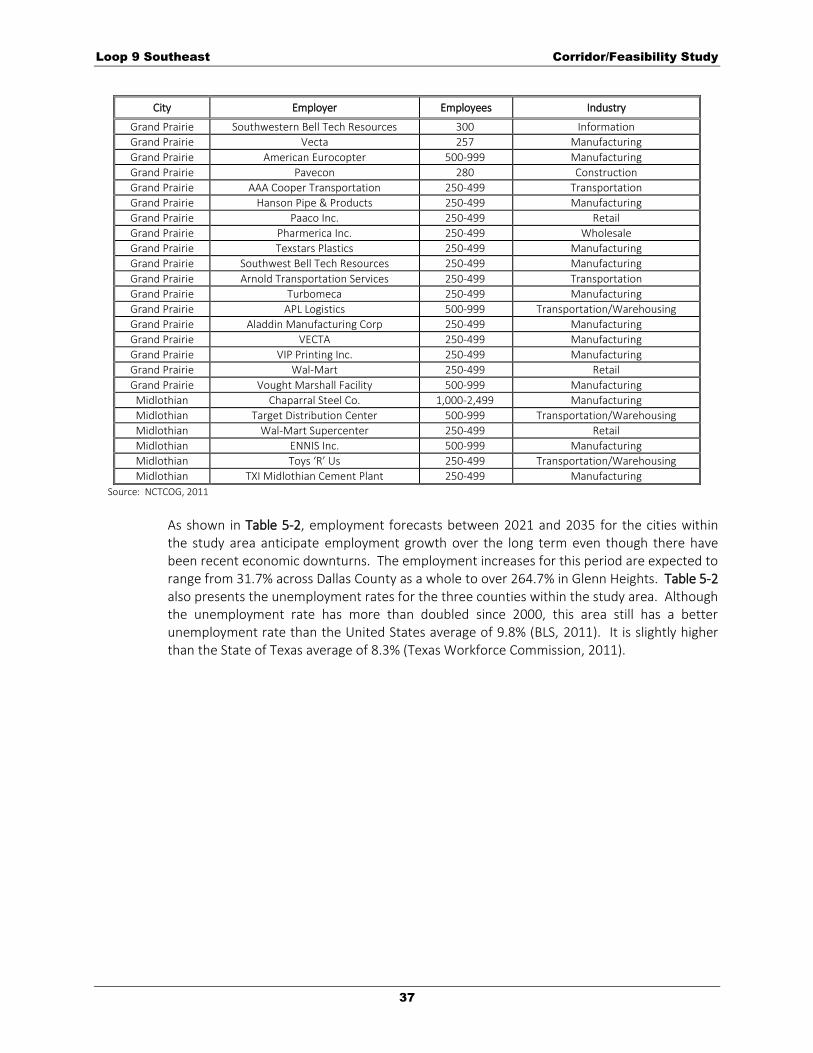
Loop 9 Southeast Corridor/Feasibility Study
37
City Employer Employees Industry
Grand Prairie Southwestern Bell Tech Resources 300 Information
Grand Prairie Vecta 257 Manufacturing
Grand Prairie American Eurocopter 500-999 Manufacturing
Grand Prairie Pavecon 280 Construction
Grand Prairie AAA Cooper Transportation 250-499 Transportation
Grand Prairie Hanson Pipe & Products 250-499 Manufacturing
Grand Prairie Paaco Inc. 250-499 Retail
Grand Prairie Pharmerica Inc. 250-499 Wholesale
Grand Prairie Texstars Plastics 250-499 Manufacturing
Grand Prairie Southwest Bell Tech Resources 250-499 Manufacturing
Grand Prairie Arnold Transportation Services 250-499 Transportation
Grand Prairie Turbomeca 250-499 Manufacturing
Grand Prairie APL Logistics 500-999 Transportation/Warehousing
Grand Prairie Aladdin Manufacturing Corp 250-499 Manufacturing
Grand Prairie VECTA 250-499 Manufacturing
Grand Prairie VIP Printing Inc. 250-499 Manufacturing
Grand Prairie Wal-Mart 250-499 Retail
Grand Prairie Vought Marshall Facility 500-999 Manufacturing
Midlothian Chaparral Steel Co. 1,000-2,499 Manufacturing
Midlothian Target Distribution Center 500-999 Transportation/Warehousing
Midlothian Wal-Mart Supercenter 250-499 Retail
Midlothian ENNIS Inc. 500-999 Manufacturing
Midlothian Toys ‘R’ Us 250-499 Transportation/Warehousing
Midlothian TXI Midlothian Cement Plant 250-499 Manufacturing
Source: NCTCOG, 2011
As shown in Table 5-2, employment forecasts between 2021 and 2035 for the cities within the study area anticipate employment growth over the long term even though there have been recent economic downturns. The employment increases for this period are expected to range from 31.7% across Dallas County as a whole to over 264.7% in Glenn Heights. Table 5-2 also presents the unemployment rates for the three counties within the study area. Although the unemployment rate has more than doubled since 2000, this area still has a better unemployment rate than the United States average of 9.8% (BLS, 2011). It is slightly higher than the State of Texas average of 8.3% (Texas Workforce Commission, 2011).
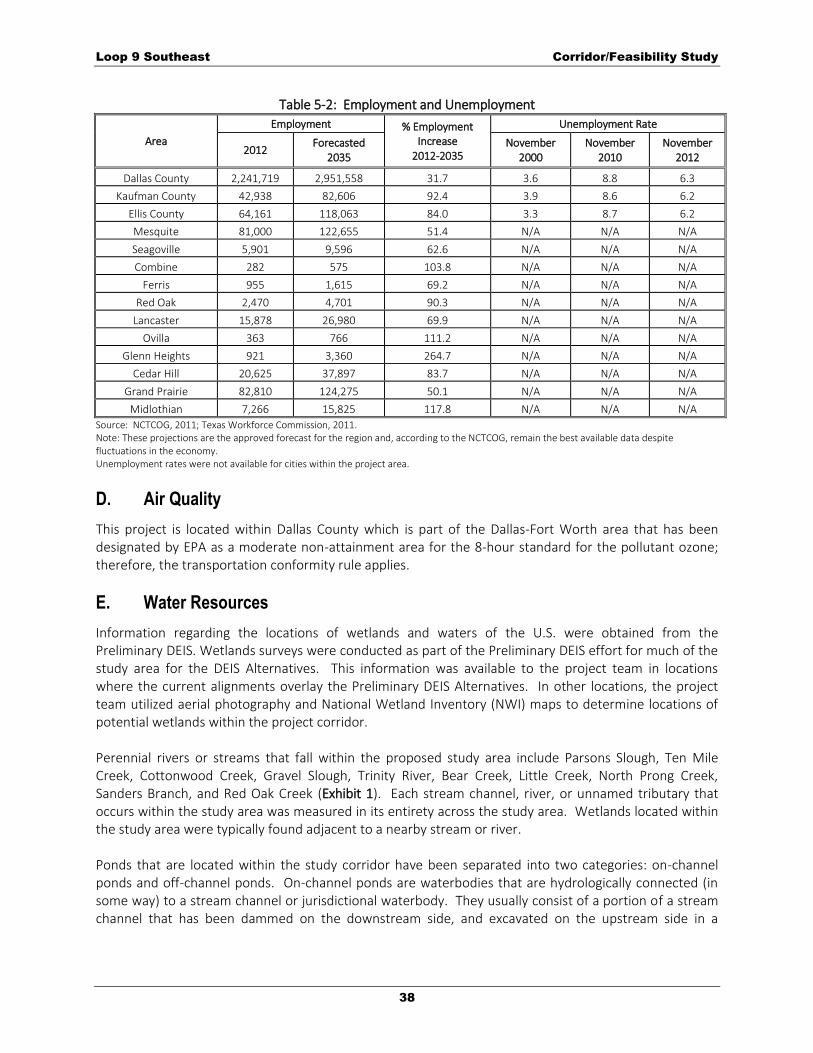
Loop 9 Southeast Corridor/Feasibility Study
38
Table 5-2: Employment and Unemployment
Area
Employment % Employment Increase
2012-2035
Unemployment Rate
2012 Forecasted
2035 November
2000 November
2010 November
2012
Dallas County 2,241,719 2,951,558 31.7 3.6 8.8 6.3
Kaufman County 42,938 82,606 92.4 3.9 8.6 6.2
Ellis County 64,161 118,063 84.0 3.3 8.7 6.2
Mesquite 81,000 122,655 51.4 N/A N/A N/A
Seagoville 5,901 9,596 62.6 N/A N/A N/A
Combine 282 575 103.8 N/A N/A N/A
Ferris 955 1,615 69.2 N/A N/A N/A
Red Oak 2,470 4,701 90.3 N/A N/A N/A
Lancaster 15,878 26,980 69.9 N/A N/A N/A
Ovilla 363 766 111.2 N/A N/A N/A
Glenn Heights 921 3,360 264.7 N/A N/A N/A
Cedar Hill 20,625 37,897 83.7 N/A N/A N/A
Grand Prairie 82,810 124,275 50.1 N/A N/A N/A
Midlothian 7,266 15,825 117.8 N/A N/A N/A
Source: NCTCOG, 2011; Texas Workforce Commission, 2011. Note: These projections are the approved forecast for the region and, according to the NCTCOG, remain the best available data despite fluctuations in the economy. Unemployment rates were not available for cities within the project area.
D. Air Quality
This project is located within Dallas County which is part of the Dallas-Fort Worth area that has been designated by EPA as a moderate non-attainment area for the 8-hour standard for the pollutant ozone; therefore, the transportation conformity rule applies.
E. Water Resources
Information regarding the locations of wetlands and waters of the U.S. were obtained from the Preliminary DEIS. Wetlands surveys were conducted as part of the Preliminary DEIS effort for much of the study area for the DEIS Alternatives. This information was available to the project team in locations where the current alignments overlay the Preliminary DEIS Alternatives. In other locations, the project team utilized aerial photography and National Wetland Inventory (NWI) maps to determine locations of potential wetlands within the project corridor. Perennial rivers or streams that fall within the proposed study area include Parsons Slough, Ten Mile Creek, Cottonwood Creek, Gravel Slough, Trinity River, Bear Creek, Little Creek, North Prong Creek, Sanders Branch, and Red Oak Creek (Exhibit 1). Each stream channel, river, or unnamed tributary that occurs within the study area was measured in its entirety across the study area. Wetlands located within the study area were typically found adjacent to a nearby stream or river. Ponds that are located within the study corridor have been separated into two categories: on-channel ponds and off-channel ponds. On-channel ponds are waterbodies that are hydrologically connected (in some way) to a stream channel or jurisdictional waterbody. They usually consist of a portion of a stream channel that has been dammed on the downstream side, and excavated on the upstream side in a

Loop 9 Southeast Corridor/Feasibility Study
39
manner substantial enough to collect and hold water for extended periods of time. Off-channel ponds are waterbodies that are not hydrologically connected to a stream channel or jurisdictional waterbody. The Trinity River is the only water crossing within the study corridor that is considered to be navigable by the USACE.
F. Biological Resources
1) Vegetation
According to The Vegetation Types of Texas, Including Croplands (McMahan,1984), the study corridor is located within vegetation type 44 (Crops), type 36 (Water Oak-Elm-Hackberry Forest), type 45 (Other Native or Introduced Grasses), and type 30b (Post Oak Woods, Forest and Grassland Mosaic). Crops vegetation consists of cover or row crops that provide food or fiber for man or domestic animals. Within Water Oak-Elm-Hackberry Forest vegetation, water oak may be dominant in low-lying flatwoods, drainages, and floodplains throughout the eastern Post Oak Belt (e.g., the Navasota watershed), with American elm, green ash, sugarberry, and other floodplain species. Dense growths of vines (grapes, poison ivy, rattan-vine) and a sparse groundcover of switchcane, sedges, Virginia wildrye and other grasses are typical. Southeastern species such as willow oak and coastal live oak may also be present. Grasslands associated with crop rotations are also represented in this cover type. Other native or introduced grass vegetation consists of mixed native or introduced grasses and forbs on grassland sites that resulted from the clearing of woody vegetation. Post Oak Woods, Forest and Grassland Mosaic vegetation types consist of Post Oak Savannas, open or closed woodlands on uplands, ridges, hills, and flatwoods (poorly drained uplands over impermeable clays) and are dominated by combinations of post oak, blackjack oak, and black hickory. These species may also be codominant on rapidly draining sandy ridges.
Vegetation communities identified within the study corridor include bottomland hardwood forest, wooded riparian corridor, wooded fence line, juniper savannah, rangeland, wooded upland, cropland, scrub/shrub, mixed hardwood juniper woodland, disturbed floodplain, and developed. Detailed field surveys for vegetation types and acreages would be conducted during the project development phase of each individual project.
2) Habitat
According to the World Wildlife Fund, over 500 species of wildlife inhabit the Texas Blackland Prairie Region. The Blackland Prairie habitats within the proposed study corridor are diverse. The diversity of vegetation communities along the study corridor yields a corresponding diversity of wildlife. Wildlife diversity can be linked to human disturbance in a vegetation community. Vegetation communities that have experienced a strong human disturbance exhibit less wildlife habitat diversity than those have experienced low human disturbance. Habitat fragmentation can result from the partitioning of existing habitats by land conversion from human activities, transportation/utility corridors, or geological processes to make the existing habitat discontinuous. Human induced habitat fragmentation was observed throughout the study corridor, identified with aerial photography and confirmed through

Loop 9 Southeast Corridor/Feasibility Study
40
field observations. Areas of relatively undisturbed habitat are sparse and broken up by numerous human land use activities tied to crops, pasturelands, and developed areas. The following describes the types of wildlife and wildlife habitat generally associated with the vegetation communities and with aquatic communities typical for the study corridor. Detailed habitat surveys would be conducted during the project development phase of each individual project.
Bottomland Hardwood Forest Bottomland hardwood forests contain ponds and meandering channels that not only provide various habitats utilized by a variety of fish and wildlife species, but also contain resources necessary for their survival. These forests are typically rich in plant and animal species diversity. Medium and small mammals such as coyote, gray foxes (Urocyon cinereoargenteus), bobcats (Lynx rufus), armadillo, squirrel, and beaver (Castor canadensis) utilize these areas. Larger mammals such as white-tail deer (Odocoileus virginianus) and feral hogs (Sus Scrofa) also frequently utilize these habitats for food and cover. Many species of birds nest, roost and feed in these habitats [e.g., woodpeckers, songbirds, even birds of prey such as Cooper’s hawk (Accipiter cooperii)]. Numerous reptiles and amphibians also inhabit these bottomland areas (e.g., red-eared slider, water moccasin, garter snakes, and various frogs). Wooded Riparian Corridor Riparian forests support diverse plant and animal communities. The diversity stems from the fact that these areas tend to have richer soils, more abundant moisture, and a more variable environment than surrounding areas. Wildlife uses these areas for cover, water, food, and travel corridors. The size (i.e., length and width) of a riparian habitat plays a large factor in their importance to wildlife communities, with larger areas providing more benefit. These areas also play an important role in stream ecology, providing food, nutrients, cover, shade, and water filtration to aquatic systems. Wildlife that inhabit wooded riparian corridors include the same type of species listed for bottomland hardwood above, with the exception that the larger mammals may not use them as frequently due to their more limited size (i.e., width). Additionally, the more wetland-dependent species found in bottomlands (e.g., water moccasin, red-eared slider, etc.) may not occur due to the more ephemeral, faster moving streams associated with these communities. Wooded Fence Line Although limited by their narrow width, wooded fence lines provide cover and food for wildlife species. They provide nesting/roosting/perching habitat and food for birds (e.g., northern mockingbird, northern cardinal, blue jay, mourning dove, red-tailed hawk). They also provide windbreaks for surrounding grasslands and can serve as a source of food and cover for mammals [e.g., squirrels, rats, opossum (Didelphis virginiana), raccoon (Procyon lotor)]. Rangeland Rangelands are important habitats. Although livestock grazing is their principal use and the key to their historical importance within the proposed ROW, rangeland habitats serve as the majority of the watersheds within north central Texas, playing an important role in
Loop 9 Southeast Corridor/Feasibility Study
41
water quality and water supply. They are also used by wildlife, particularly passerine birds (e.g., sparrows, mourning dove), birds of prey (e.g., red-tailed hawk and northern harrier) and small mammals (e.g., armadillo, rats and mice, rabbits) as sources of food and cover.
Juniper Savannah These areas essentially function as rangelands, with the woody component providing additional cover. However, the eastern red cedar is considered an invasive species and tends to dominate the grassland. The eastern red cedar is frequently removed through mechanical grubbing, bulldozing, and other methods on these habitats. Wildlife that inhabit these areas are similar to what is found on rangeland, the exception being that there are additional nesting opportunities for songbirds and the like with the added woody component. Wooded Upland Wooded uplands within the study corridor provide habitat to birds, reptiles, and small mammals. The trees within these areas provide nesting and roosting habitat for birds (e.g., woodpeckers, northern mockingbird, and many other common songbirds, hawks), and serve as a source of food (e.g., sugar hackberry). For small mammals and reptiles (e.g., squirrel, opossum, armadillo, rats, lizards, snakes), the wooded uplands provide feeding habitat and cover. Cropland Croplands (particularly grain fields) provide a source of food, primarily to birds and small mammals, when the crops begin to produce seed. Fallow croplands provide cover and food to birds (e.g., blackbirds, American crow, mourning dove, and various songbirds) and small mammals (e.g., rodents). Scrub/Shrub Somewhat similar to wooded uplands, scrub/shrub habitats within the study corridor provide nesting, roosting, and feeding habitat for birds (e.g., mourning dove and other songbirds, sparrows). These areas also serve as feeding habitat and cover for small mammals [e.g., primarily rats and mice, armadillos) and reptiles (e.g., lizards and snakes such as coachwhips (Masticophis sp.) and kingsnakes (Lampropeltis sp.)]. Mixed Hardwood Juniper Woodland Mixed hardwood juniper woodlands provide food and cover to a wide variety of wildlife species, from medium and small mammals (e.g., fox, coyote, bobcat, raccoon) to songbirds [e.g., northern cardinal, blue jay, American robin (Turdus migratorius), brown-headed cowbird (Molothrus ater)] and reptiles (e.g., variety of lizards, and snakes).
Disturbed Floodplain Although these habitats have been substantially disturbed in the past, they do provide habitat to wildlife, particularly as roosting and feeding areas for waterfowl [e.g., mallard, gadwall (Anas strepera), American widgeon (Anas americana), green-winged teal (Anas crecca), American coot (Fulica americana)], and wading birds during the fall and spring migrations. These areas also provide habitat to a variety of amphibians (e.g., many
Loop 9 Southeast Corridor/Feasibility Study
42
species of frogs), reptiles (e.g., turtles and snakes), and mammals [e.g., nutria (Myocastor coypus), beaver].
Developed The developed vegetation community, although greatly modified by man, does provide habitat to wildlife. Species that adapt well to man are often found in these habitats, including several species of birds (e.g., swifts, swallows, grackles, starlings, northern mockingbird, blue jay) and mammals such as rodents (e.g., squirrels, mice, rats), opossums, and raccoons.
Water Water communities are a variety of features that include rivers, lakes, and streams. They provide habitat for fully aquatic and semi-aquatic species such as fish, crustaceans, and amphibians, but also provide habitat and foraging areas for other wildlife. These animals likely include several species of reptiles (e.g., diamondback water snakes, water moccasin, red-eared slider), mammals (e.g., nutria and beaver) and several types of birds such as ducks, shorebirds, wading birds, and hawks.
3) Threatened and Endangered Species
Species listed by the federal and/or state government agencies in the three counties traversed by the study corridor are listed in Table 5-3.
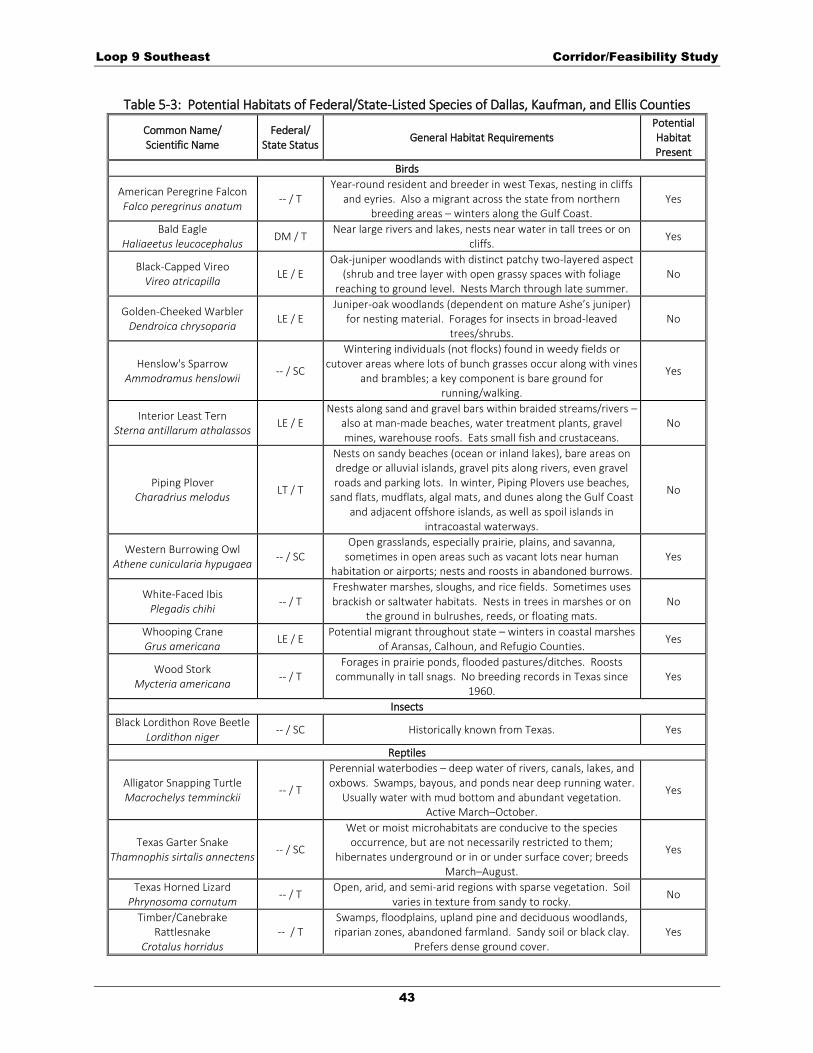
Loop 9 Southeast Corridor/Feasibility Study
43
Table 5-3: Potential Habitats of Federal/State-Listed Species of Dallas, Kaufman, and Ellis Counties
Common Name/ Scientific Name
Federal/ State Status
General Habitat Requirements Potential Habitat Present
Birds
American Peregrine Falcon Falco peregrinus anatum
-- / T Year-round resident and breeder in west Texas, nesting in cliffs
and eyries. Also a migrant across the state from northern breeding areas – winters along the Gulf Coast.
Yes
Bald Eagle Haliaeetus leucocephalus
DM / T Near large rivers and lakes, nests near water in tall trees or on
cliffs. Yes
Black-Capped Vireo Vireo atricapilla
LE / E Oak-juniper woodlands with distinct patchy two-layered aspect
(shrub and tree layer with open grassy spaces with foliage reaching to ground level. Nests March through late summer.
No
Golden-Cheeked Warbler Dendroica chrysoparia
LE / E Juniper-oak woodlands (dependent on mature Ashe’s juniper)
for nesting material. Forages for insects in broad-leaved trees/shrubs.
No
Henslow's Sparrow Ammodramus henslowii
-- / SC
Wintering individuals (not flocks) found in weedy fields or cutover areas where lots of bunch grasses occur along with vines
and brambles; a key component is bare ground for running/walking.
Yes
Interior Least Tern Sterna antillarum athalassos
LE / E Nests along sand and gravel bars within braided streams/rivers –
also at man-made beaches, water treatment plants, gravel mines, warehouse roofs. Eats small fish and crustaceans.
No
Piping Plover Charadrius melodus
LT / T
Nests on sandy beaches (ocean or inland lakes), bare areas on dredge or alluvial islands, gravel pits along rivers, even gravel roads and parking lots. In winter, Piping Plovers use beaches,
sand flats, mudflats, algal mats, and dunes along the Gulf Coast and adjacent offshore islands, as well as spoil islands in
intracoastal waterways.
No
Western Burrowing Owl Athene cunicularia hypugaea
-- / SC Open grasslands, especially prairie, plains, and savanna,
sometimes in open areas such as vacant lots near human habitation or airports; nests and roosts in abandoned burrows.
Yes
White-Faced Ibis Plegadis chihi
-- / T Freshwater marshes, sloughs, and rice fields. Sometimes uses brackish or saltwater habitats. Nests in trees in marshes or on
the ground in bulrushes, reeds, or floating mats. No
Whooping Crane Grus americana
LE / E Potential migrant throughout state – winters in coastal marshes
of Aransas, Calhoun, and Refugio Counties. Yes
Wood Stork Mycteria americana
-- / T Forages in prairie ponds, flooded pastures/ditches. Roosts
communally in tall snags. No breeding records in Texas since 1960.
Yes
Insects
Black Lordithon Rove Beetle Lordithon niger
-- / SC Historically known from Texas. Yes
Reptiles
Alligator Snapping Turtle Macrochelys temminckii
-- / T
Perennial waterbodies – deep water of rivers, canals, lakes, and oxbows. Swamps, bayous, and ponds near deep running water.
Usually water with mud bottom and abundant vegetation. Active March–October.
Yes
Texas Garter Snake Thamnophis sirtalis annectens
-- / SC
Wet or moist microhabitats are conducive to the species occurrence, but are not necessarily restricted to them;
hibernates underground or in or under surface cover; breeds March–August.
Yes
Texas Horned Lizard Phrynosoma cornutum
-- / T Open, arid, and semi-arid regions with sparse vegetation. Soil
varies in texture from sandy to rocky. No
Timber/Canebrake Rattlesnake
Crotalus horridus -- / T
Swamps, floodplains, upland pine and deciduous woodlands, riparian zones, abandoned farmland. Sandy soil or black clay.
Prefers dense ground cover. Yes
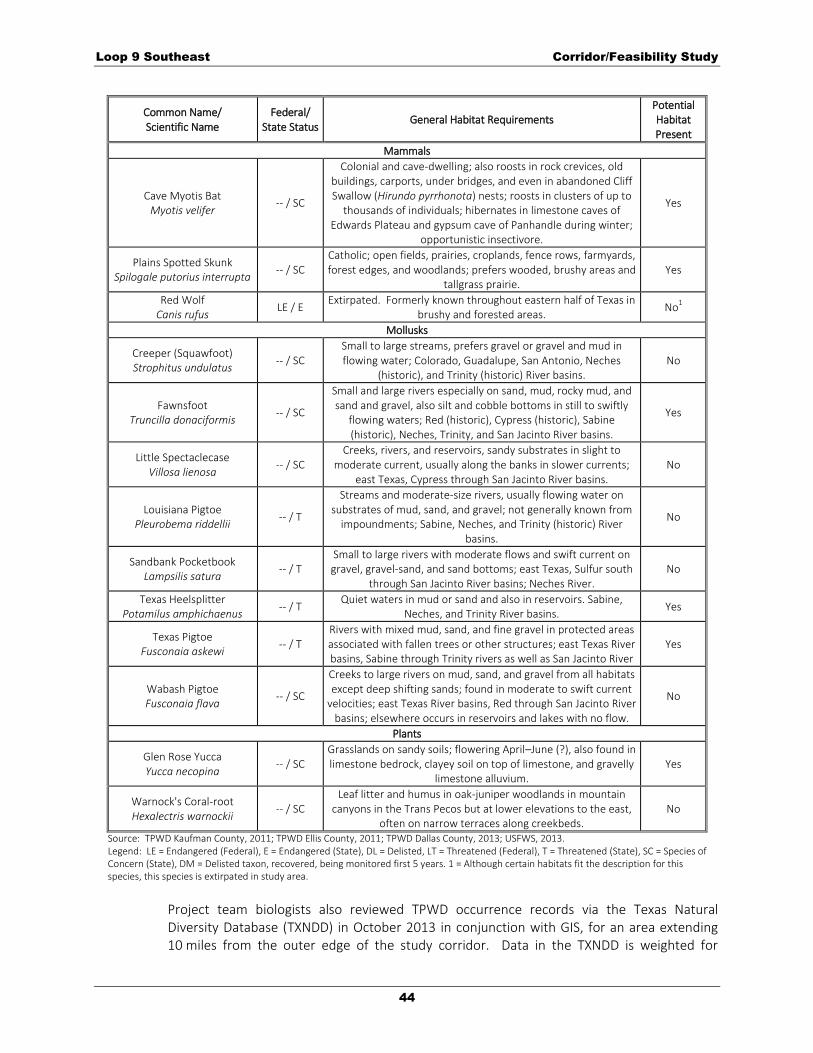
Loop 9 Southeast Corridor/Feasibility Study
44
Common Name/ Scientific Name
Federal/ State Status
General Habitat Requirements Potential Habitat Present
Mammals
Cave Myotis Bat Myotis velifer
-- / SC
Colonial and cave-dwelling; also roosts in rock crevices, old buildings, carports, under bridges, and even in abandoned Cliff Swallow (Hirundo pyrrhonota) nests; roosts in clusters of up to
thousands of individuals; hibernates in limestone caves of Edwards Plateau and gypsum cave of Panhandle during winter;
opportunistic insectivore.
Yes
Plains Spotted Skunk Spilogale putorius interrupta
-- / SC Catholic; open fields, prairies, croplands, fence rows, farmyards, forest edges, and woodlands; prefers wooded, brushy areas and
tallgrass prairie. Yes
Red Wolf Canis rufus
LE / E Extirpated. Formerly known throughout eastern half of Texas in
brushy and forested areas. No
1
Mollusks
Creeper (Squawfoot) Strophitus undulatus
-- / SC Small to large streams, prefers gravel or gravel and mud in flowing water; Colorado, Guadalupe, San Antonio, Neches
(historic), and Trinity (historic) River basins. No
Fawnsfoot Truncilla donaciformis
-- / SC
Small and large rivers especially on sand, mud, rocky mud, and sand and gravel, also silt and cobble bottoms in still to swiftly
flowing waters; Red (historic), Cypress (historic), Sabine (historic), Neches, Trinity, and San Jacinto River basins.
Yes
Little Spectaclecase Villosa lienosa
-- / SC Creeks, rivers, and reservoirs, sandy substrates in slight to
moderate current, usually along the banks in slower currents; east Texas, Cypress through San Jacinto River basins.
No
Louisiana Pigtoe Pleurobema riddellii
-- / T
Streams and moderate-size rivers, usually flowing water on substrates of mud, sand, and gravel; not generally known from
impoundments; Sabine, Neches, and Trinity (historic) River basins.
No
Sandbank Pocketbook Lampsilis satura
-- / T Small to large rivers with moderate flows and swift current on gravel, gravel-sand, and sand bottoms; east Texas, Sulfur south
through San Jacinto River basins; Neches River. No
Texas Heelsplitter Potamilus amphichaenus
-- / T Quiet waters in mud or sand and also in reservoirs. Sabine,
Neches, and Trinity River basins. Yes
Texas Pigtoe Fusconaia askewi
-- / T Rivers with mixed mud, sand, and fine gravel in protected areas associated with fallen trees or other structures; east Texas River basins, Sabine through Trinity rivers as well as San Jacinto River
Yes
Wabash Pigtoe Fusconaia flava
-- / SC
Creeks to large rivers on mud, sand, and gravel from all habitats except deep shifting sands; found in moderate to swift current
velocities; east Texas River basins, Red through San Jacinto River basins; elsewhere occurs in reservoirs and lakes with no flow.
No
Plants
Glen Rose Yucca Yucca necopina
-- / SC Grasslands on sandy soils; flowering April–June (?), also found in limestone bedrock, clayey soil on top of limestone, and gravelly
limestone alluvium. Yes
Warnock's Coral-root Hexalectris warnockii
-- / SC Leaf litter and humus in oak-juniper woodlands in mountain
canyons in the Trans Pecos but at lower elevations to the east, often on narrow terraces along creekbeds.
No
Source: TPWD Kaufman County, 2011; TPWD Ellis County, 2011; TPWD Dallas County, 2013; USFWS, 2013. Legend: LE = Endangered (Federal), E = Endangered (State), DL = Delisted, LT = Threatened (Federal), T = Threatened (State), SC = Species of Concern (State), DM = Delisted taxon, recovered, being monitored first 5 years. 1 = Although certain habitats fit the description for this species, this species is extirpated in study area.
Project team biologists also reviewed TPWD occurrence records via the Texas Natural Diversity Database (TXNDD) in October 2013 in conjunction with GIS, for an area extending 10 miles from the outer edge of the study corridor. Data in the TXNDD is weighted for

Loop 9 Southeast Corridor/Feasibility Study
45
accuracy. For instance, a given element in the TXNDD (e.g., a prairie remnant) may be presented within the data as a very precise point or as a large polygon, depending on the accuracy or distribution of the element in a given area. Likewise, some element observations in the TXNDD may be temporally specific. That is, for the day(s) in question, the element could be found within the boundaries of the representation (i.e., polygon in the TXNDD). Further, the boundaries of the element representations are not necessarily meant to indicate the total real extent of the elements. The representation is only meant to geographically represent the observation(s) in the best, most accurate way possible based on the available data. Conversely, the absence of information in the TXNDD system for a given area cannot be interpreted as an absence of rare, threatened, or endangered species in that location. TXNDD data cannot provide a definitive statement as to the presence, absence, or condition of special species, natural communities, or other substantial features in any area. Nor can the TXNDD data substitute for on-site evaluation by qualified biologists. No elements of occurrence were noted in the TXNDD search results for the study corridor.
G. Regulated Materials
Studies conducted during the DEIS phase identified four hazardous materials sites located within the study corridor. These sites include:
Landess Sand and Soil at 1450 Combine Road
Living Earth Technology Lancaster at 3150 S. Beckley Street
Road Runner 2857 at 100 N. Highway 67
TXI Operations LP at Malloy Bridge Road 4 miles east of I-45 Due to the size of the study corridor, a detailed hazardous materials database search was not conducted during the Corridor/Feasibility Study.
H. Floodplains and Drainage Patterns
March 2013 updated FIRMS were obtained for the project area. The floodplain data was added onto project mapping through direct import of digital FIRM data, or alternatively through digitization of geo-referenced FIRM images for areas where digital FIRM data was unavailable (Exhibit 1). The study area is within the Trinity River Basin, which has a drainage area of over 17,920 square miles. The headwaters of the Trinity River starts out as four forks, one each located in Archer, Montague, Parker, and Grayson Counties in north Texas. The Clear Fork enters the West Fork in the City of Fort Worth and the Elm Fork enters the West Fork in the City of Dallas. The East and West Forks then converge near the Kaufman/Ellis County line, south of the project area. The Trinity River Basin serves as a primary water supply to the DFW metropolitan area. The study corridor crosses eight major streams, as shown in Table 7-4 and depicted on Exhibit 1, Sheets 1, 3, 5, 9, 14, 15, 18-20. Although the project crosses the Trinity River, it is not within the Trinity River Corridor Development Certificate Regulatory Zone.

Loop 9 Southeast Corridor/Feasibility Study
46
6. AGENCY AND PUBLIC INVOLVEMENT
Extensive efforts were made as part of this Corridor/Feasibility Study to inform the public, local officials, agencies and major stakeholders of the ongoing Loop 9 Southeast project activities as well as provide the opportunity for comments on the project. All input received during this effort was documented in a comment matrix (Appendix G) and consideration was given to each comment. The project team solicited public opinion on the:
Study goals
Study schedule
Proposed 350-foot typical section including an ultimate toll facility
Development of corridors (including Preliminary DEIS Alternatives and proposed shift options resulting from local official, major stakeholder and resource agency input, environmental constraints, and design considerations)
Traffic modeling
Environmental impacts
Construction phasing options
Program of projects
Next steps The public involvement process was a continuous, fluid process throughout the development of the Loop 9 Southeast project. It engaged the public and sought to build local ownership in the project. The public involvement process has been developed to provide opportunities for the public to voice possible concerns and issues to the project team. Eliciting opportunities for effective and efficient transportation solutions to be reached.
A. List of Meetings
Table 6-1 includes a list of all the Loop 9 Southeast Agency and Public Involvement Meetings held during the Corridor/Feasibility Study. A summary of each meeting is presented in the following subsections.
Table 6-1: List of Loop 9 Southeast Agency and Public Meetings
Meeting Meeting Date With
Federal/State Agencies 3/27/2013 Federal/State Resource Agencies
Local Interviews
11/5/2012 Wilmer
11/6/2012 Seagoville
11/7/2012 Ferris
11/7/2012 Combine
11/7/2012 Cedar Hill
11/8/2012 Kaufman County
11/9/2012 Ovilla
11/9/2012 Dallas County
11/9/2012 Lancaster
11/13/2012 Glenn Heights
11/13/2012 Ellis County
11/20/2012 Balch Springs
11/20/2012 Red Oak
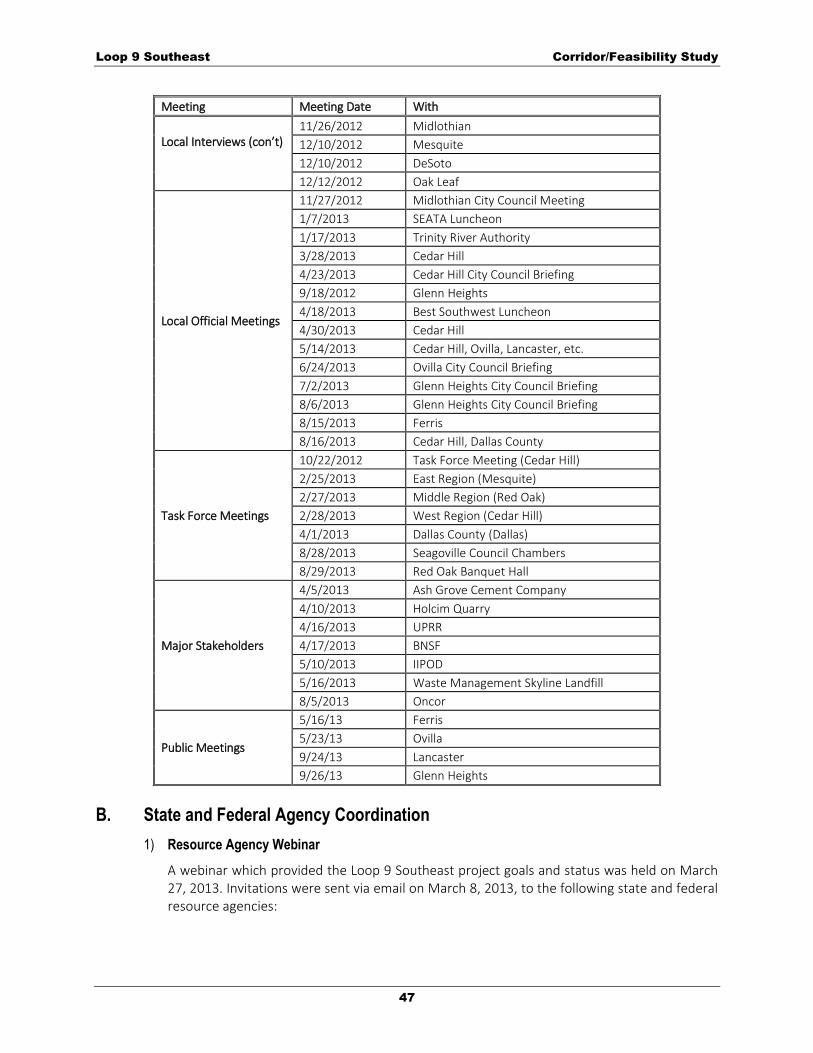
Loop 9 Southeast Corridor/Feasibility Study
47
Meeting Meeting Date With
Local Interviews (con’t)
11/26/2012 Midlothian
12/10/2012 Mesquite
12/10/2012 DeSoto
12/12/2012 Oak Leaf
Local Official Meetings
11/27/2012 Midlothian City Council Meeting
1/7/2013 SEATA Luncheon
1/17/2013 Trinity River Authority
3/28/2013 Cedar Hill
4/23/2013 Cedar Hill City Council Briefing
9/18/2012 Glenn Heights
4/18/2013 Best Southwest Luncheon
4/30/2013 Cedar Hill
5/14/2013 Cedar Hill, Ovilla, Lancaster, etc.
6/24/2013 Ovilla City Council Briefing
7/2/2013 Glenn Heights City Council Briefing
8/6/2013 Glenn Heights City Council Briefing
8/15/2013 Ferris
8/16/2013 Cedar Hill, Dallas County
Task Force Meetings
10/22/2012 Task Force Meeting (Cedar Hill)
2/25/2013 East Region (Mesquite)
2/27/2013 Middle Region (Red Oak)
2/28/2013 West Region (Cedar Hill)
4/1/2013 Dallas County (Dallas)
8/28/2013 Seagoville Council Chambers
8/29/2013 Red Oak Banquet Hall
Major Stakeholders
4/5/2013 Ash Grove Cement Company
4/10/2013 Holcim Quarry
4/16/2013 UPRR
4/17/2013 BNSF
5/10/2013 IIPOD
5/16/2013 Waste Management Skyline Landfill
8/5/2013 Oncor
Public Meetings
5/16/13 Ferris
5/23/13 Ovilla
9/24/13 Lancaster
9/26/13 Glenn Heights
B. State and Federal Agency Coordination
1) Resource Agency Webinar
A webinar which provided the Loop 9 Southeast project goals and status was held on March 27, 2013. Invitations were sent via email on March 8, 2013, to the following state and federal resource agencies:
Loop 9 Southeast Corridor/Feasibility Study
48
EPA
USACE
U.S. Fish and Wildlife Service (USFWS)
TCEQ
Texas Historical Commission (THC)
TPWD EPA, USFWS, THC, and TPWD attended the webinar held on March 27, 2013. The webinar presented the status of the Loop 9 Southeast project and the corridor options including the DEIS Alternatives with a 350-foot ROW and shift options resulting from comments received during the local official interviews, environmental constraints, and/or design considerations. A summary of the webinar was prepared including the discussions/comments recorded during and after the webinar (Appendix B).
C. Local Government Coordination
1) November and December 2012 Local Interviews
In November and December 2012, all cities and counties within the Loop 9 Southeast Corridor/Feasibility Study area were interviewed. The purpose of the interviews was to allow local government officials within the Loop 9 Southeast Corridor/Feasibility Study area to comment on the Preliminary DEIS Alternatives that were modified to an approximate 350-foot typical ROW width. The interviews helped to elicit suggestions about where shifts could be made to avoid certain resources. They also provided a means for participants to gain a better understanding of existing and future constraints in each city/county. Local officials who participated included mayors, city managers, county judges, county commissioners, and other municipal and county staff. The following local governments participated in one of the 17 separate interviews: Dallas County, Ellis County, Kaufman County, and the cities of Balch Springs, Cedar Hill, Combine, DeSoto, Ferris, Glenn Heights, Lancaster, Mesquite, Midlothian, Oak Leaf, Ovilla, Red Oak, Seagoville, and Wilmer.
A questionnaire was prepared to gain insight from the local government officials regarding the project as well as area constraints. The questionnaire was provided to each city/county prior to the interview in order to grant the cities/counties the opportunity to prepare responses in advance, if desired. During the interviews each question was presented and responses were provided by the local officials. Summaries of each interview (Appendix C) were prepared to include responses to all questionnaire items as discussed during the interview, responses provided either before or after the meeting, and any additional comments received during the interview. Information received during the local interviews (verified by aerial or field visit) was documented on the Environmental Constraints Map (Exhibit 1).
D. Regional Task Force Meetings
The Loop 9 Southeast Regional Task Force (Task Force) consists of staff members from TxDOT Dallas District, TxDOT Environmental Affairs Division (ENV), NCTCOG, and local officials of cities and counties within the Loop 9 Southeast study area. The following is a summary of the Task Force Meetings that occurred during the Corridor/Feasibility Study.

Loop 9 Southeast Corridor/Feasibility Study
49
1) October 2012 Introductory Meeting
A Loop 9 Southeast Task Force Meeting was conducted on October 22, 2012 where information regarding the corridor study area, the proposed study schedule, an introduction of the program of projects concept, and upcoming action items for the project was presented. A summary of the October 2012 Task Force Meeting can be found in Appendix D.
2) February and April 2013 Regional Task Force Meetings
The February and April 2013 Task Force Meetings were divided into four separate meetings to ensure the project team was available to respond to questions as needed from all Task Force members. These meetings were held:
East Region (Mesquite) – February 24, 2013
Middle Region (Red Oak) – February 27, 2013
West Region (Cedar Hill) – February 28, 2013
Dallas County (Dallas) – April 1, 2013
At these meetings, comments received during the local official interviews with regard to the corridor location were summarized and presented in a Powerpoint presentation handout. The materials included the Preliminary DEIS Alternatives, all proposed shift options, and environmental constraints and/or design considerations. Comments received from the first three meetings were accepted until March 15, 2013, unless notified via email that the comments would be provided at a later specific date. The only comments received after the meetings were from Cedar Hill and Dallas County. Summaries were prepared for the four meetings which include comments received during each meeting and those submitted (if any) after the meetings (Appendix D).
3) August 2013 Regional Task Force Meetings
The August 2013 Task Force Meetings were held in two separate locations to ensure the project team was available to respond to questions as needed from all task force members. These meetings were held:
Seagoville – August 28, 2013
Red Oak – August 29, 2013 At these meetings, comments received during the May 2013 Public Meetings, major stakeholder coordination, and local official coordination were presented and distributed in a Powerpoint presentation handout. Additionally, the draft program of projects, potential phasing options, final alignments, and potential environmental impacts were presented. Comments were accepted until September 13, 2013 unless notified via email that the comments would be provided at a later specific date. No written comments were received during or after the meetings. Verbal comments received during the meetings are included in the summaries in Appendix D.

Loop 9 Southeast Corridor/Feasibility Study
50
E. Major Stakeholder Coordination
Early in the Corridor/Feasibility Study, several major stakeholders were identified within the study area. These stakeholders included major utility companies or potential major traffic generators within the study area. To inform them of the proposed project and get feedback on any potential concerns, individual meetings were held in 2013 with the following major stakeholders:
Ash Grove Cement Company
Holcim Quarry
UPRR
BNSF
IIPOD
Waste Management Skyline Landfill
Oncor
All the major stakeholders expressed general support for the proposed project and provided comments regarding the proposed alignment and project schedule. Summaries of each meeting were prepared including the discussions/comments during the meeting and any additional comments received after the meetings (Appendix E).
F. Public Meetings
1) May 2013
The first round of public meetings was held on May 16, 2013 (Ferris High School) and May 23, 2013 (Ovilla Road Baptist Church) to present the Corridor/Feasibility Study process and status as well as introduce the program of projects concept. The project team solicited public opinion on:
The Loop 9 Southeast corridor options including the Preliminary DEIS Alternatives and proposed shift options resulting from local official, major stakeholder and resource agency input
Environmental constraints and design considerations
Typical section configuration A total of 460 people attended the meetings and 125 comments were received. A copy of the May 2013 Public Meeting Summary Report is included in Appendix F.
2) September 2013
The second round of public meetings was held on September 24, 2013 (Lancaster Elementary School) and September 26, 2013 (Red Oak Intermediate School) to present the study status and results of the analysis. The project team solicited public opinion on:
The comments received during the May 2013 Public Meetings
The draft program of projects
Potential phasing options
Refined corridor alignment
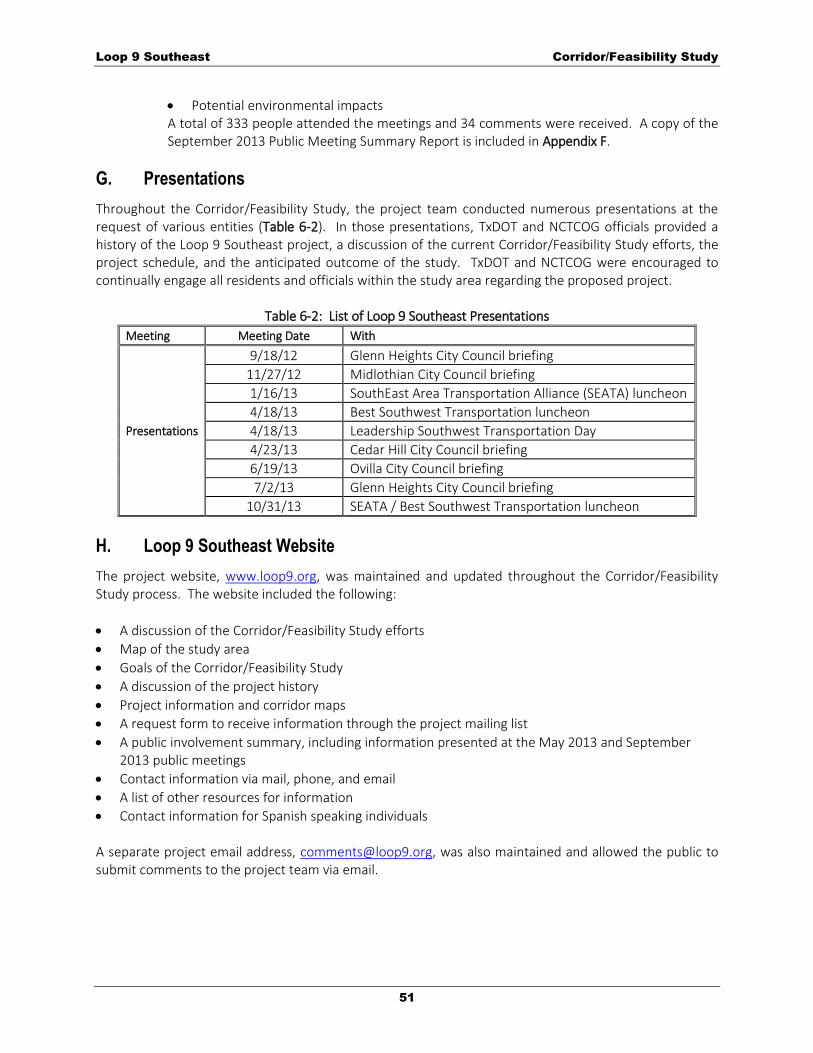
Loop 9 Southeast Corridor/Feasibility Study
51
Potential environmental impacts A total of 333 people attended the meetings and 34 comments were received. A copy of the September 2013 Public Meeting Summary Report is included in Appendix F.
G. Presentations
Throughout the Corridor/Feasibility Study, the project team conducted numerous presentations at the request of various entities (Table 6-2). In those presentations, TxDOT and NCTCOG officials provided a history of the Loop 9 Southeast project, a discussion of the current Corridor/Feasibility Study efforts, the project schedule, and the anticipated outcome of the study. TxDOT and NCTCOG were encouraged to continually engage all residents and officials within the study area regarding the proposed project.
Table 6-2: List of Loop 9 Southeast Presentations
Meeting Meeting Date With
Presentations
9/18/12 Glenn Heights City Council briefing
11/27/12 Midlothian City Council briefing
1/16/13 SouthEast Area Transportation Alliance (SEATA) luncheon
4/18/13 Best Southwest Transportation luncheon
4/18/13 Leadership Southwest Transportation Day
4/23/13 Cedar Hill City Council briefing
6/19/13 Ovilla City Council briefing
7/2/13 Glenn Heights City Council briefing
10/31/13 SEATA / Best Southwest Transportation luncheon
H. Loop 9 Southeast Website
The project website, www.loop9.org, was maintained and updated throughout the Corridor/Feasibility Study process. The website included the following:
A discussion of the Corridor/Feasibility Study efforts
Map of the study area
Goals of the Corridor/Feasibility Study
A discussion of the project history
Project information and corridor maps
A request form to receive information through the project mailing list
A public involvement summary, including information presented at the May 2013 and September 2013 public meetings
Contact information via mail, phone, and email
A list of other resources for information
Contact information for Spanish speaking individuals A separate project email address, [email protected], was also maintained and allowed the public to submit comments to the project team via email.

Loop 9 Southeast Corridor/Feasibility Study
52
I. Database/Mailing List
A database of property owners within the Preliminary DEIS Alternatives (450-600 foot ROW) as well as the Loop 9 Southeast shift option/options; Loop 9 Task Force members; major stakeholders; local officials; and state and federal resource agencies; businesses; and other residents and interested parties was developed and maintained. Maintenance included routine additions, deletions and corrections as needed. The database was also updated after each public meeting to document all attendees of the meetings and the general reasoning for their attendance (i.e., resident within corridor options, resident within DEIS Alternative, adjacent business owner, federal agency, Task Force member) if provided.
J. Summary of Comments
A total of 434 local government comments, 19 written task force meeting comments, and 183 public comments were received during the Corridor/Feasibility Study. All input received during this effort was documented in a comment matrix (Appendix G) with consideration given to each comment. Table 6-3 includes a general summary of the comments received and the TxDOT responses by topic.
Table 6-3: Summary of Public Comments
Topic TxDOT Response
Frustrated with Lack of Decision by TxDOT and Effect on Property
Due to the magnitude of the proposed project, the funding needs, and the numerous entities involved, moving the proposed project forward is a large endeavor to which TxDOT and NCTCOG are committed. TxDOT understands the frustrations of area residents and would strive to keep the public informed at each step of the process. The Program of Projects which would be identified at the end of this study would allow the project to move forward.
Potential Noise Impacts to Residents During the development of the environmental document for each section of Loop 9, a noise analysis would be conducted and if it is determined that a noise barrier is reasonable and feasible, a meeting would be held with adjacent property owners to discuss the barrier.
Supports Specific Alignment TxDOT appreciates your feedback related to the specific corridors and would analyze all comments provided before a determination on the final corridor is made. The final determination of the project alignment would be made during a future environmental study.
Loop 9 Funding Should Support Improvements to Other Roadways in the Area
Currently there is approximately $100 million in funding set aside specifically for the Loop 9 project. Other improvements in the area are ongoing and each have a separate set of funding available for those projects.
Access Concerns Existing local access would be maintained with the proposed project and access to cross streets would be determined based on TxDOT design guidelines.
Believes Project is Politically Motivated While local cities and counties have been involved in the planning stages of the proposed project, the need for the project stems from increasing populations, congested roadways, and the lack of sufficient east-west corridors in southern Dallas and northern Ellis Counties. The proposed Loop 9 project is included in Mobility 2035: The Metropolitan Transportation Plan for North Central Texas – 2013 Update.
Requests Shift to Proposed Alternatives TxDOT appreciates your feedback related to the proposed corridors and would analyze all comments provided before a determination on the final corridor is made.
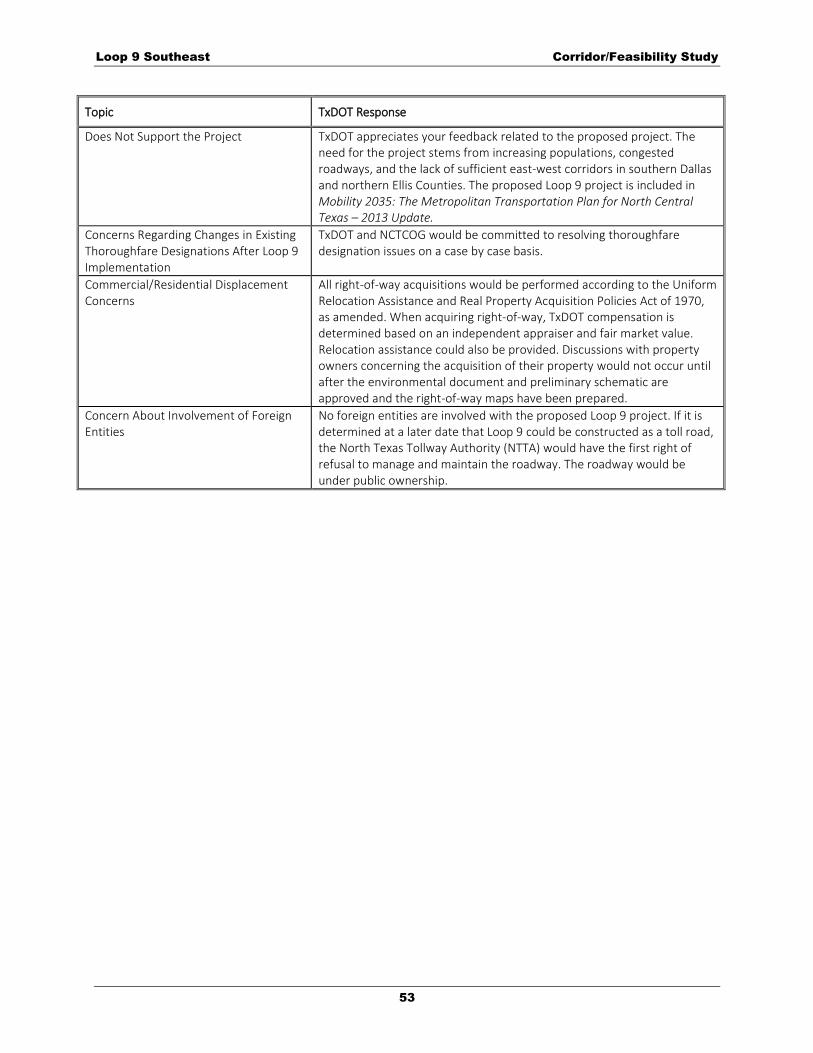
Loop 9 Southeast Corridor/Feasibility Study
53
Topic TxDOT Response
Does Not Support the Project TxDOT appreciates your feedback related to the proposed project. The need for the project stems from increasing populations, congested roadways, and the lack of sufficient east-west corridors in southern Dallas and northern Ellis Counties. The proposed Loop 9 project is included in Mobility 2035: The Metropolitan Transportation Plan for North Central Texas – 2013 Update.
Concerns Regarding Changes in Existing Thoroughfare Designations After Loop 9 Implementation
TxDOT and NCTCOG would be committed to resolving thoroughfare designation issues on a case by case basis.
Commercial/Residential Displacement Concerns
All right-of-way acquisitions would be performed according to the Uniform Relocation Assistance and Real Property Acquisition Policies Act of 1970, as amended. When acquiring right-of-way, TxDOT compensation is determined based on an independent appraiser and fair market value. Relocation assistance could also be provided. Discussions with property owners concerning the acquisition of their property would not occur until after the environmental document and preliminary schematic are approved and the right-of-way maps have been prepared.
Concern About Involvement of Foreign Entities
No foreign entities are involved with the proposed Loop 9 project. If it is determined at a later date that Loop 9 could be constructed as a toll road, the North Texas Tollway Authority (NTTA) would have the first right of refusal to manage and maintain the roadway. The roadway would be under public ownership.
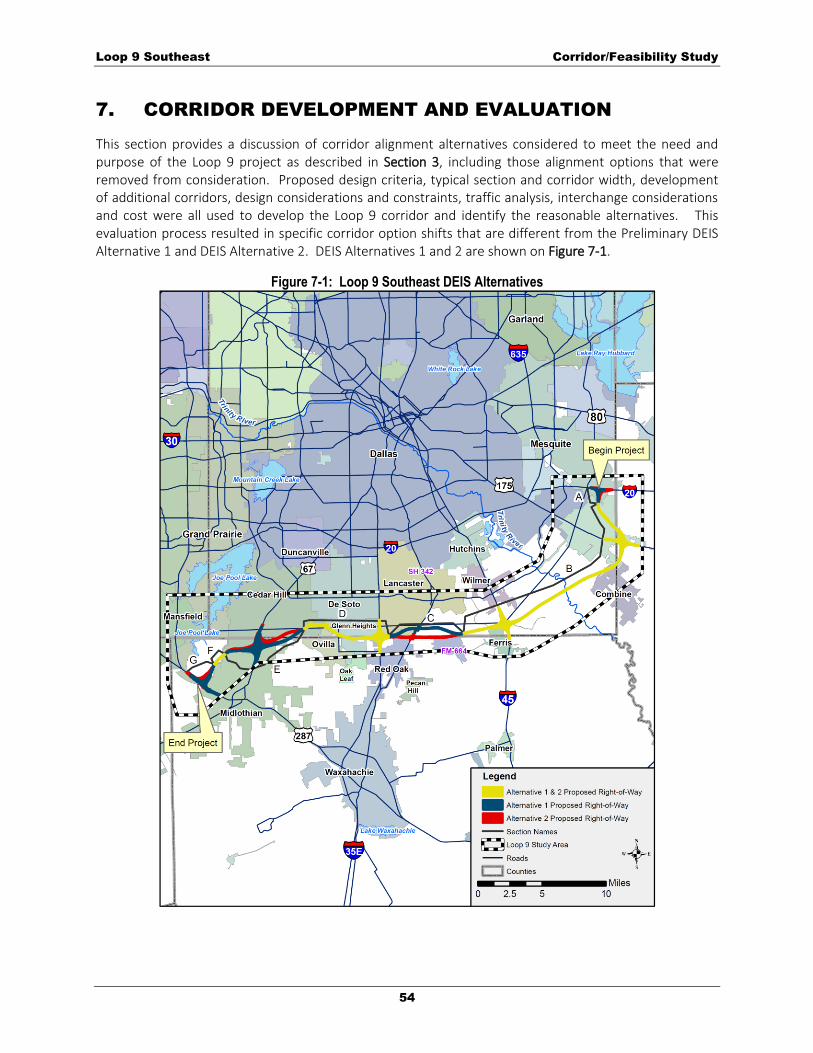
Loop 9 Southeast Corridor/Feasibility Study
54
7. CORRIDOR DEVELOPMENT AND EVALUATION
This section provides a discussion of corridor alignment alternatives considered to meet the need and purpose of the Loop 9 project as described in Section 3, including those alignment options that were removed from consideration. Proposed design criteria, typical section and corridor width, development of additional corridors, design considerations and constraints, traffic analysis, interchange considerations and cost were all used to develop the Loop 9 corridor and identify the reasonable alternatives. This evaluation process resulted in specific corridor option shifts that are different from the Preliminary DEIS Alternative 1 and DEIS Alternative 2. DEIS Alternatives 1 and 2 are shown on Figure 7-1.
Figure 7-1: Loop 9 Southeast DEIS Alternatives
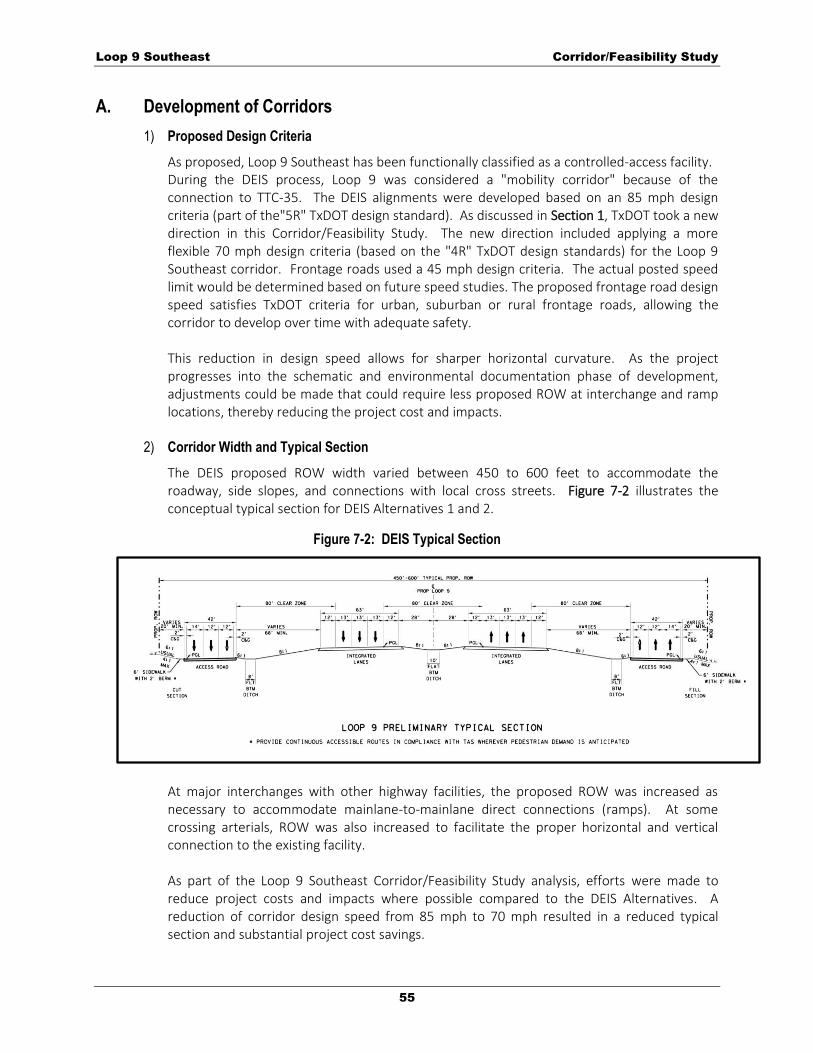
Loop 9 Southeast Corridor/Feasibility Study
55
A. Development of Corridors
1) Proposed Design Criteria
As proposed, Loop 9 Southeast has been functionally classified as a controlled-access facility. During the DEIS process, Loop 9 was considered a "mobility corridor" because of the connection to TTC-35. The DEIS alignments were developed based on an 85 mph design criteria (part of the"5R" TxDOT design standard). As discussed in Section 1, TxDOT took a new direction in this Corridor/Feasibility Study. The new direction included applying a more flexible 70 mph design criteria (based on the "4R" TxDOT design standards) for the Loop 9 Southeast corridor. Frontage roads used a 45 mph design criteria. The actual posted speed limit would be determined based on future speed studies. The proposed frontage road design speed satisfies TxDOT criteria for urban, suburban or rural frontage roads, allowing the corridor to develop over time with adequate safety. This reduction in design speed allows for sharper horizontal curvature. As the project progresses into the schematic and environmental documentation phase of development, adjustments could be made that could require less proposed ROW at interchange and ramp locations, thereby reducing the project cost and impacts.
2) Corridor Width and Typical Section
The DEIS proposed ROW width varied between 450 to 600 feet to accommodate the roadway, side slopes, and connections with local cross streets. Figure 7-2 illustrates the conceptual typical section for DEIS Alternatives 1 and 2.
Figure 7-2: DEIS Typical Section
At major interchanges with other highway facilities, the proposed ROW was increased as necessary to accommodate mainlane-to-mainlane direct connections (ramps). At some crossing arterials, ROW was also increased to facilitate the proper horizontal and vertical connection to the existing facility. As part of the Loop 9 Southeast Corridor/Feasibility Study analysis, efforts were made to reduce project costs and impacts where possible compared to the DEIS Alternatives. A reduction of corridor design speed from 85 mph to 70 mph resulted in a reduced typical section and substantial project cost savings.
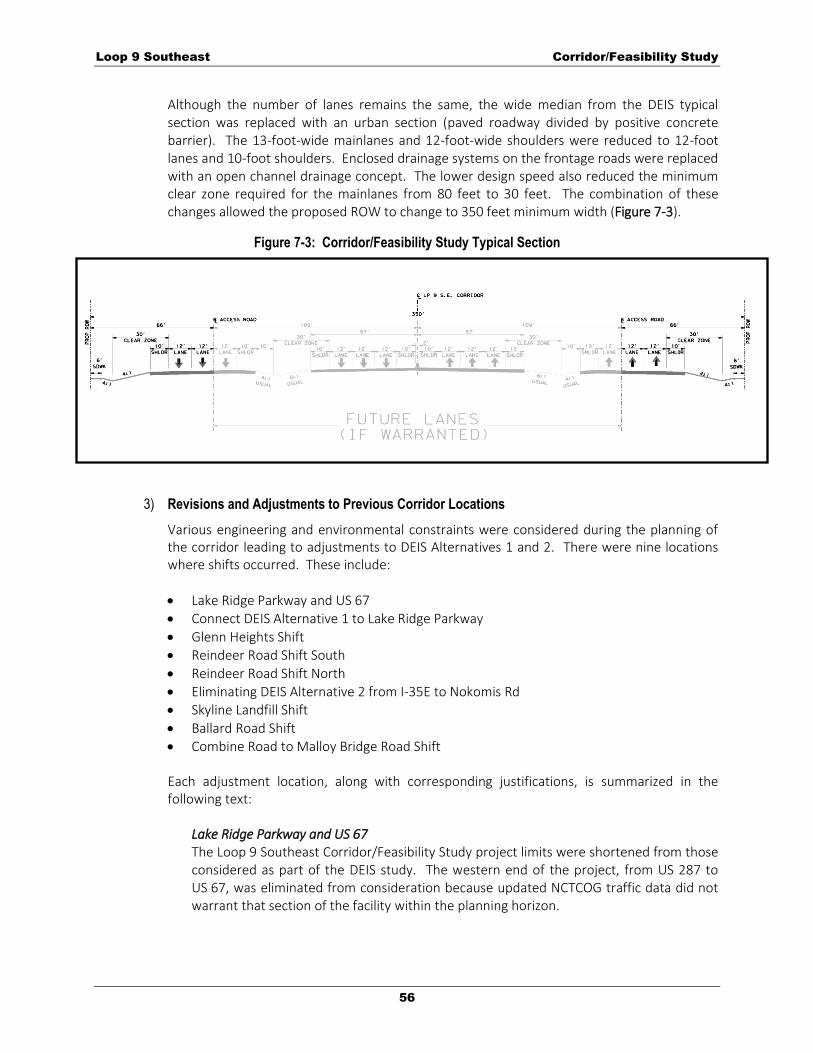
Loop 9 Southeast Corridor/Feasibility Study
56
Although the number of lanes remains the same, the wide median from the DEIS typical section was replaced with an urban section (paved roadway divided by positive concrete barrier). The 13-foot-wide mainlanes and 12-foot-wide shoulders were reduced to 12-foot lanes and 10-foot shoulders. Enclosed drainage systems on the frontage roads were replaced with an open channel drainage concept. The lower design speed also reduced the minimum clear zone required for the mainlanes from 80 feet to 30 feet. The combination of these changes allowed the proposed ROW to change to 350 feet minimum width (Figure 7-3).
Figure 7-3: Corridor/Feasibility Study Typical Section
3) Revisions and Adjustments to Previous Corridor Locations
Various engineering and environmental constraints were considered during the planning of the corridor leading to adjustments to DEIS Alternatives 1 and 2. There were nine locations where shifts occurred. These include:
Lake Ridge Parkway and US 67 Connect DEIS Alternative 1 to Lake Ridge Parkway Glenn Heights Shift Reindeer Road Shift South
Reindeer Road Shift North Eliminating DEIS Alternative 2 from I-35E to Nokomis Rd Skyline Landfill Shift Ballard Road Shift Combine Road to Malloy Bridge Road Shift Each adjustment location, along with corresponding justifications, is summarized in the following text:
Lake Ridge Parkway and US 67 The Loop 9 Southeast Corridor/Feasibility Study project limits were shortened from those considered as part of the DEIS study. The western end of the project, from US 287 to US 67, was eliminated from consideration because updated NCTCOG traffic data did not warrant that section of the facility within the planning horizon.

Loop 9 Southeast Corridor/Feasibility Study
57
There were two alignment options under consideration where the DEIS Alternatives crossed US 67. Both options ran adjacent to an existing TV tower just east of US 67. Due to the wide (600 foot) proposed ROW, both alignments would impact the anchorages of the TV tower guy wires (Figure 7-4). Reducing the proposed ROW width from 600 feet to 350 feet did not eliminate impacts to the guy wires, so an alignment adjustment was warranted. During the November/December 2012 local official interview with the City of Cedar Hill (Appendix C), a comment was received to consider tying Loop 9 Southeast to Lake Ridge Parkway at the western limits of the study area. Lake Ridge Parkway is an east-west local arterial that starts at US 67 and extends west. It consists of a four-lane roadway with a raised median. Connecting the western terminus of Loop 9 to Lake Ridge Parkway would improve local connectivity. This new alignment would also avoid impacting the anchorages of the TV tower guy wires. During the February 2013 West Region Task Force meeting (Appendix D), a council member and a city planner of Cedar Hill suggested the Lake Ridge tie-in option may upset residential property owners west of US 67 due to the increased traffic caused by Loop 9 Southeast. A follow-up meeting was held with the City of Cedar Hill on March 28, 2013. During the meeting, NCTCOG and TxDOT presented the traffic modeling results from Mobility 2035 – 2013 Update. The models results showed a negligible increase of traffic on Lake Ridge Parkway west of US 67 over the next 20 years, even with the Loop 9 Southeast connection. The meeting resulted in a consensus of support from the City of Cedar Hill for the Lake Ridge Parkway tie-in option. On April 3, 2013, the City of Cedar Hill submitted their official comments per the Regional Task Force Meeting (Appendix D) which included a corridor shift option tying into Lake Ridge Parkway. This shift was similar to what the project team presented at the February 2013 Task Force meetings. The suggested corridor shift would also impact the cities of Ovilla and Glenn Heights. The project team worked closely with Ovilla, Glenn Heights, and Cedar Hill to develop a tie-in option that was agreeable to all parties.
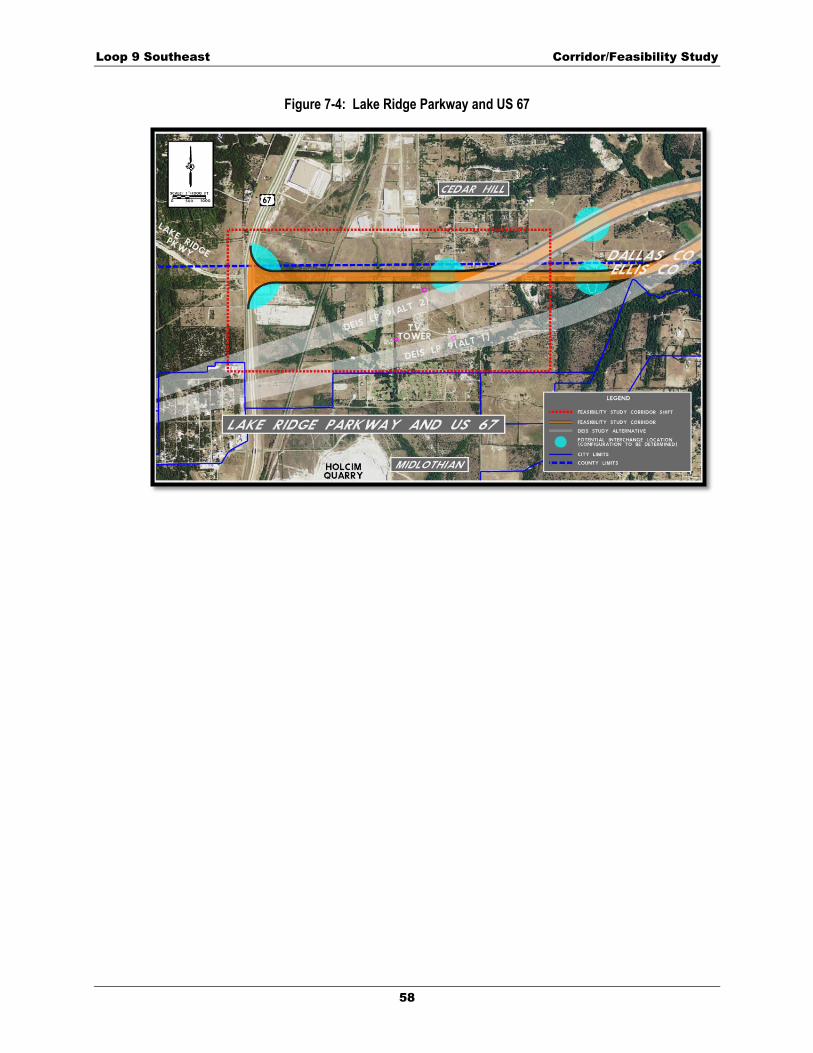
Loop 9 Southeast Corridor/Feasibility Study
58
Figure 7-4: Lake Ridge Parkway and US 67

Loop 9 Southeast Corridor/Feasibility Study
59
Connect DEIS Alternative 1 to Lake Ridge Parkway Similar to the Lake Ridge Parkway and US 67 option for DEIS Alternative 2, this alignment adjustment allows DEIS Alternative 1 to terminate at US 67 at the same location. During the DEIS, Cedar Hill publicly supported Alternative 1 over Alternative 2. At the request of the city, a new corridor alternative to tie Alternative 1 to Lake Ridge Parkway was developed. Figure 7-5 shows this new configuration.
Figure 7-5: Connect DEIS Alternative 1 to Lake Ridge Parkway
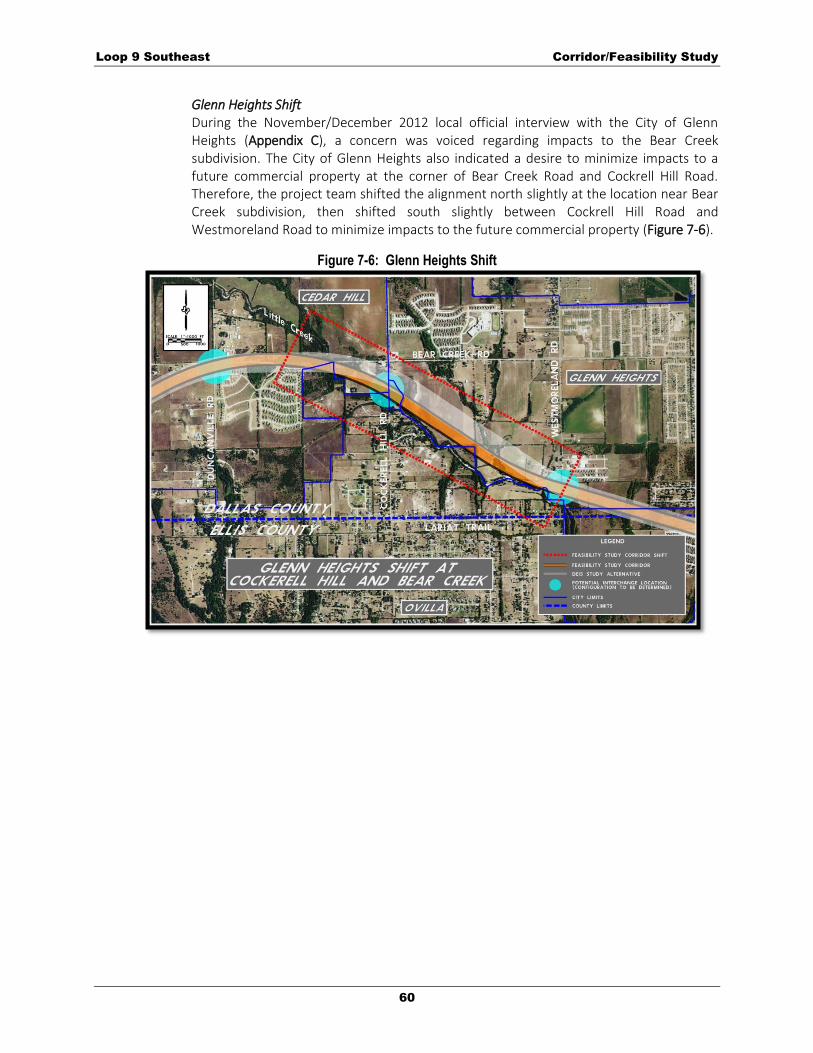
Loop 9 Southeast Corridor/Feasibility Study
60
Glenn Heights Shift During the November/December 2012 local official interview with the City of Glenn Heights (Appendix C), a concern was voiced regarding impacts to the Bear Creek subdivision. The City of Glenn Heights also indicated a desire to minimize impacts to a future commercial property at the corner of Bear Creek Road and Cockrell Hill Road. Therefore, the project team shifted the alignment north slightly at the location near Bear Creek subdivision, then shifted south slightly between Cockrell Hill Road and Westmoreland Road to minimize impacts to the future commercial property (Figure 7-6).
Figure 7-6: Glenn Heights Shift
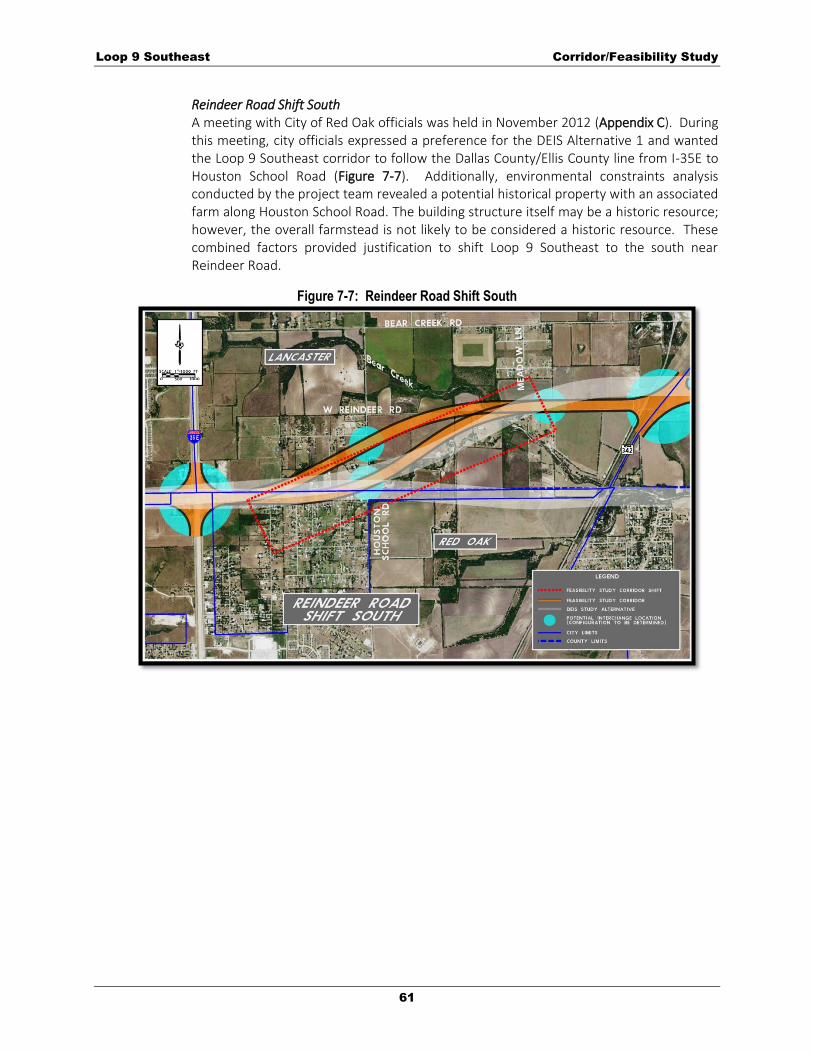
Loop 9 Southeast Corridor/Feasibility Study
61
Reindeer Road Shift South A meeting with City of Red Oak officials was held in November 2012 (Appendix C). During this meeting, city officials expressed a preference for the DEIS Alternative 1 and wanted the Loop 9 Southeast corridor to follow the Dallas County/Ellis County line from I-35E to Houston School Road (Figure 7-7). Additionally, environmental constraints analysis conducted by the project team revealed a potential historical property with an associated farm along Houston School Road. The building structure itself may be a historic resource; however, the overall farmstead is not likely to be considered a historic resource. These combined factors provided justification to shift Loop 9 Southeast to the south near Reindeer Road.
Figure 7-7: Reindeer Road Shift South
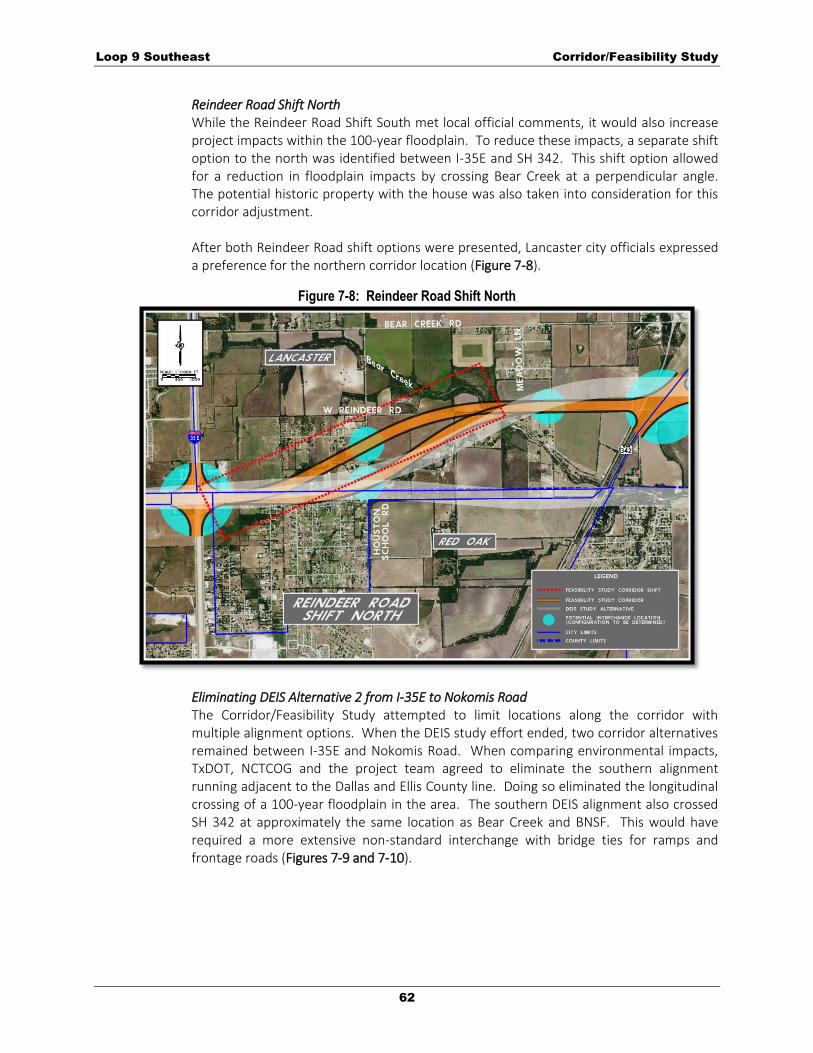
Loop 9 Southeast Corridor/Feasibility Study
62
Reindeer Road Shift North While the Reindeer Road Shift South met local official comments, it would also increase project impacts within the 100-year floodplain. To reduce these impacts, a separate shift option to the north was identified between I-35E and SH 342. This shift option allowed for a reduction in floodplain impacts by crossing Bear Creek at a perpendicular angle. The potential historic property with the house was also taken into consideration for this corridor adjustment. After both Reindeer Road shift options were presented, Lancaster city officials expressed a preference for the northern corridor location (Figure 7-8).
Figure 7-8: Reindeer Road Shift North
Eliminating DEIS Alternative 2 from I-35E to Nokomis Road The Corridor/Feasibility Study attempted to limit locations along the corridor with multiple alignment options. When the DEIS study effort ended, two corridor alternatives remained between I-35E and Nokomis Road. When comparing environmental impacts, TxDOT, NCTCOG and the project team agreed to eliminate the southern alignment running adjacent to the Dallas and Ellis County line. Doing so eliminated the longitudinal crossing of a 100-year floodplain in the area. The southern DEIS alignment also crossed SH 342 at approximately the same location as Bear Creek and BNSF. This would have required a more extensive non-standard interchange with bridge ties for ramps and frontage roads (Figures 7-9 and 7-10).
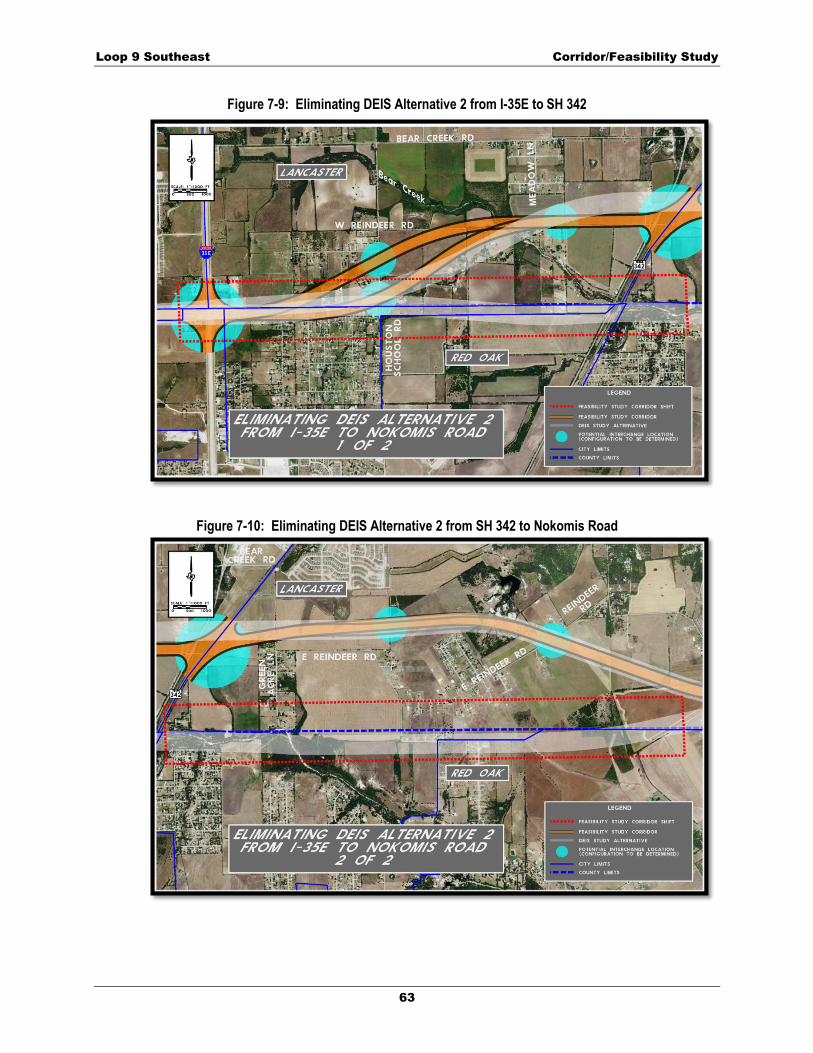
Loop 9 Southeast Corridor/Feasibility Study
63
Figure 7-9: Eliminating DEIS Alternative 2 from I-35E to SH 342
Figure 7-10: Eliminating DEIS Alternative 2 from SH 342 to Nokomis Road
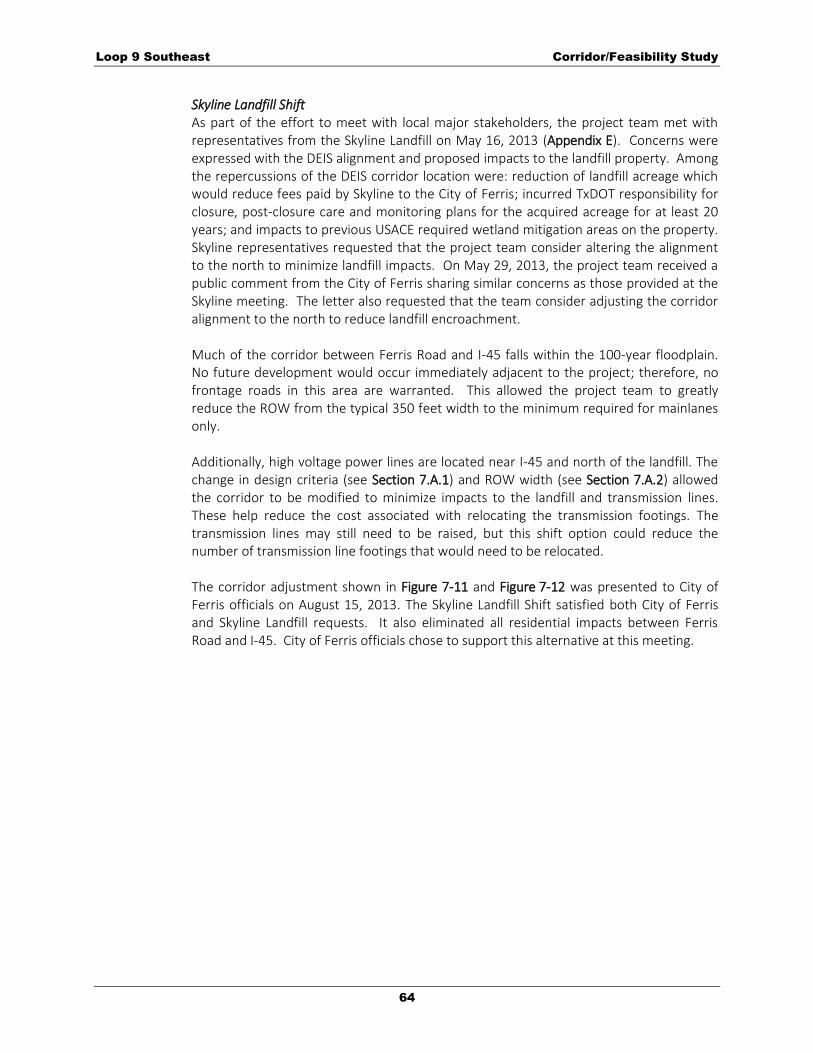
Loop 9 Southeast Corridor/Feasibility Study
64
Skyline Landfill Shift As part of the effort to meet with local major stakeholders, the project team met with representatives from the Skyline Landfill on May 16, 2013 (Appendix E). Concerns were expressed with the DEIS alignment and proposed impacts to the landfill property. Among the repercussions of the DEIS corridor location were: reduction of landfill acreage which would reduce fees paid by Skyline to the City of Ferris; incurred TxDOT responsibility for closure, post-closure care and monitoring plans for the acquired acreage for at least 20 years; and impacts to previous USACE required wetland mitigation areas on the property. Skyline representatives requested that the project team consider altering the alignment to the north to minimize landfill impacts. On May 29, 2013, the project team received a public comment from the City of Ferris sharing similar concerns as those provided at the Skyline meeting. The letter also requested that the team consider adjusting the corridor alignment to the north to reduce landfill encroachment. Much of the corridor between Ferris Road and I-45 falls within the 100-year floodplain. No future development would occur immediately adjacent to the project; therefore, no frontage roads in this area are warranted. This allowed the project team to greatly reduce the ROW from the typical 350 feet width to the minimum required for mainlanes only. Additionally, high voltage power lines are located near I-45 and north of the landfill. The change in design criteria (see Section 7.A.1) and ROW width (see Section 7.A.2) allowed the corridor to be modified to minimize impacts to the landfill and transmission lines. These help reduce the cost associated with relocating the transmission footings. The transmission lines may still need to be raised, but this shift option could reduce the number of transmission line footings that would need to be relocated. The corridor adjustment shown in Figure 7-11 and Figure 7-12 was presented to City of Ferris officials on August 15, 2013. The Skyline Landfill Shift satisfied both City of Ferris and Skyline Landfill requests. It also eliminated all residential impacts between Ferris Road and I-45. City of Ferris officials chose to support this alternative at this meeting.
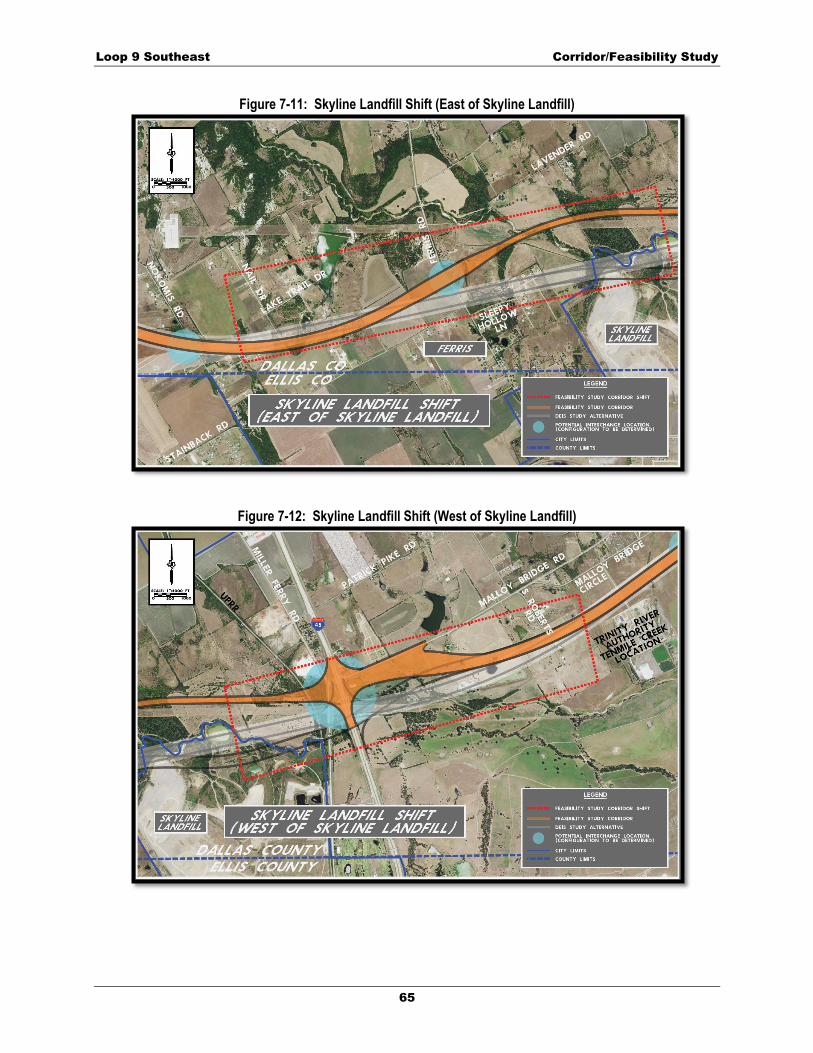
Loop 9 Southeast Corridor/Feasibility Study
65
Figure 7-11: Skyline Landfill Shift (East of Skyline Landfill)
Figure 7-12: Skyline Landfill Shift (West of Skyline Landfill)
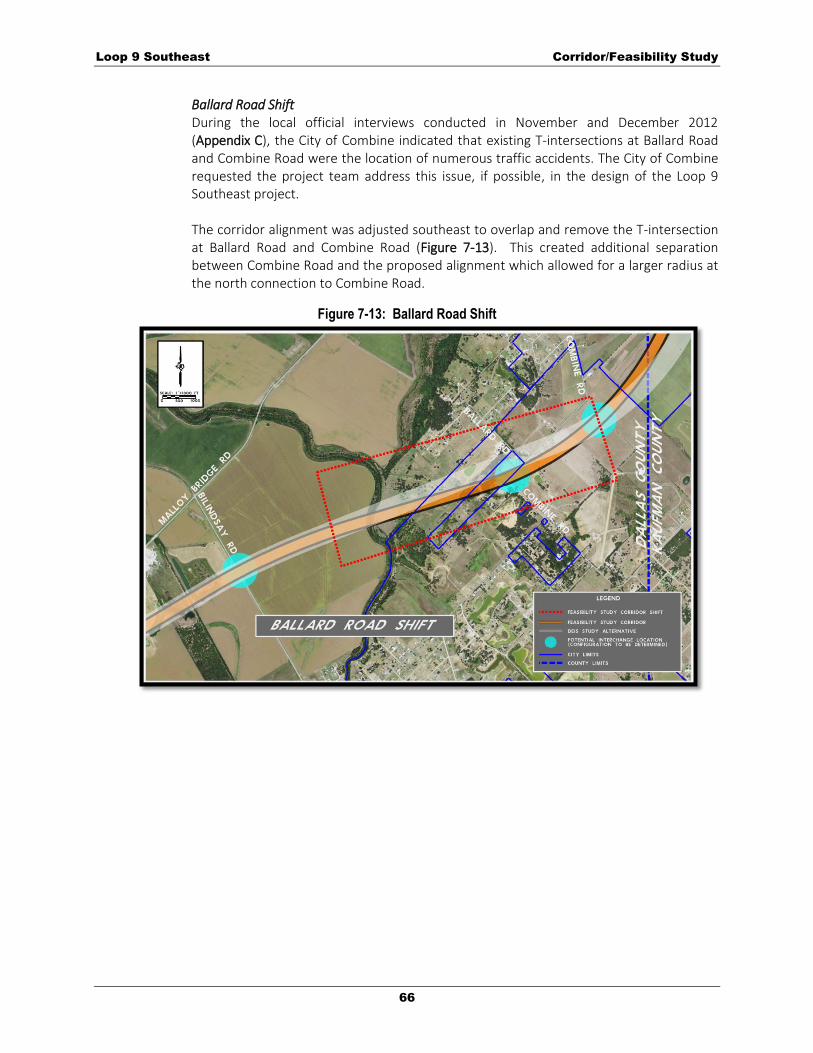
Loop 9 Southeast Corridor/Feasibility Study
66
Ballard Road Shift During the local official interviews conducted in November and December 2012 (Appendix C), the City of Combine indicated that existing T-intersections at Ballard Road and Combine Road were the location of numerous traffic accidents. The City of Combine requested the project team address this issue, if possible, in the design of the Loop 9 Southeast project. The corridor alignment was adjusted southeast to overlap and remove the T-intersection at Ballard Road and Combine Road (Figure 7-13). This created additional separation between Combine Road and the proposed alignment which allowed for a larger radius at the north connection to Combine Road.
Figure 7-13: Ballard Road Shift
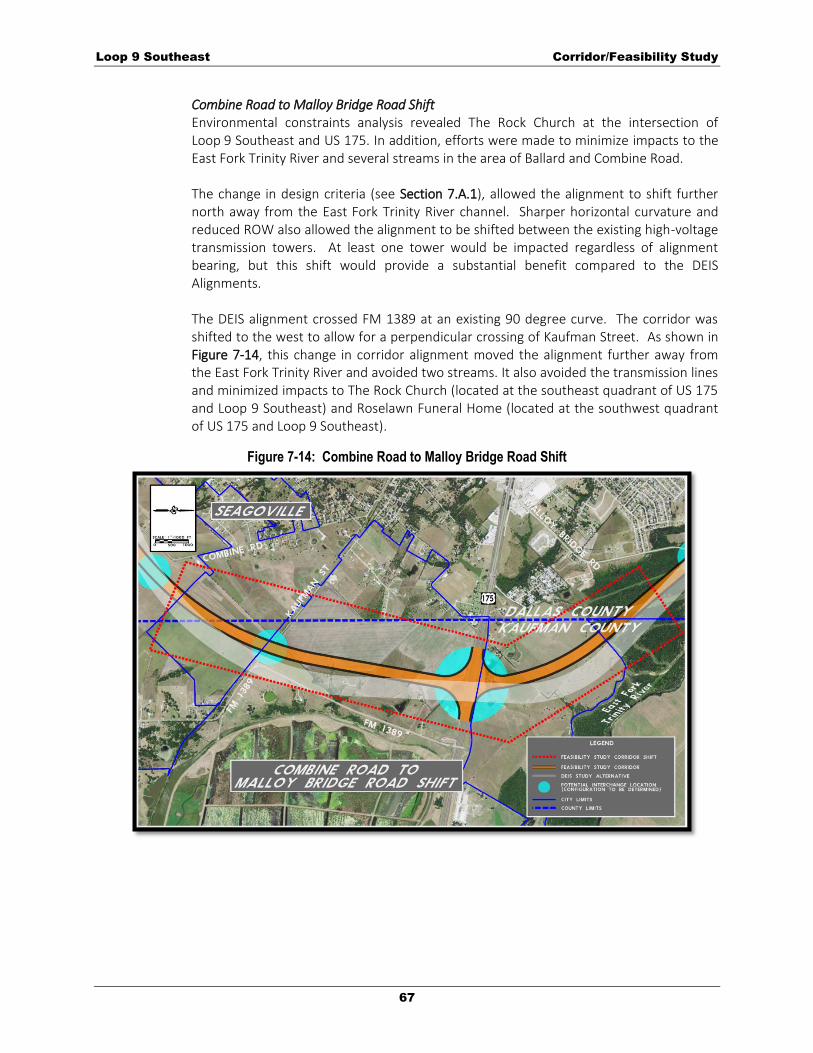
Loop 9 Southeast Corridor/Feasibility Study
67
Combine Road to Malloy Bridge Road Shift Environmental constraints analysis revealed The Rock Church at the intersection of Loop 9 Southeast and US 175. In addition, efforts were made to minimize impacts to the East Fork Trinity River and several streams in the area of Ballard and Combine Road. The change in design criteria (see Section 7.A.1), allowed the alignment to shift further north away from the East Fork Trinity River channel. Sharper horizontal curvature and reduced ROW also allowed the alignment to be shifted between the existing high-voltage transmission towers. At least one tower would be impacted regardless of alignment bearing, but this shift would provide a substantial benefit compared to the DEIS Alignments. The DEIS alignment crossed FM 1389 at an existing 90 degree curve. The corridor was shifted to the west to allow for a perpendicular crossing of Kaufman Street. As shown in Figure 7-14, this change in corridor alignment moved the alignment further away from the East Fork Trinity River and avoided two streams. It also avoided the transmission lines and minimized impacts to The Rock Church (located at the southeast quadrant of US 175 and Loop 9 Southeast) and Roselawn Funeral Home (located at the southwest quadrant of US 175 and Loop 9 Southeast).
Figure 7-14: Combine Road to Malloy Bridge Road Shift
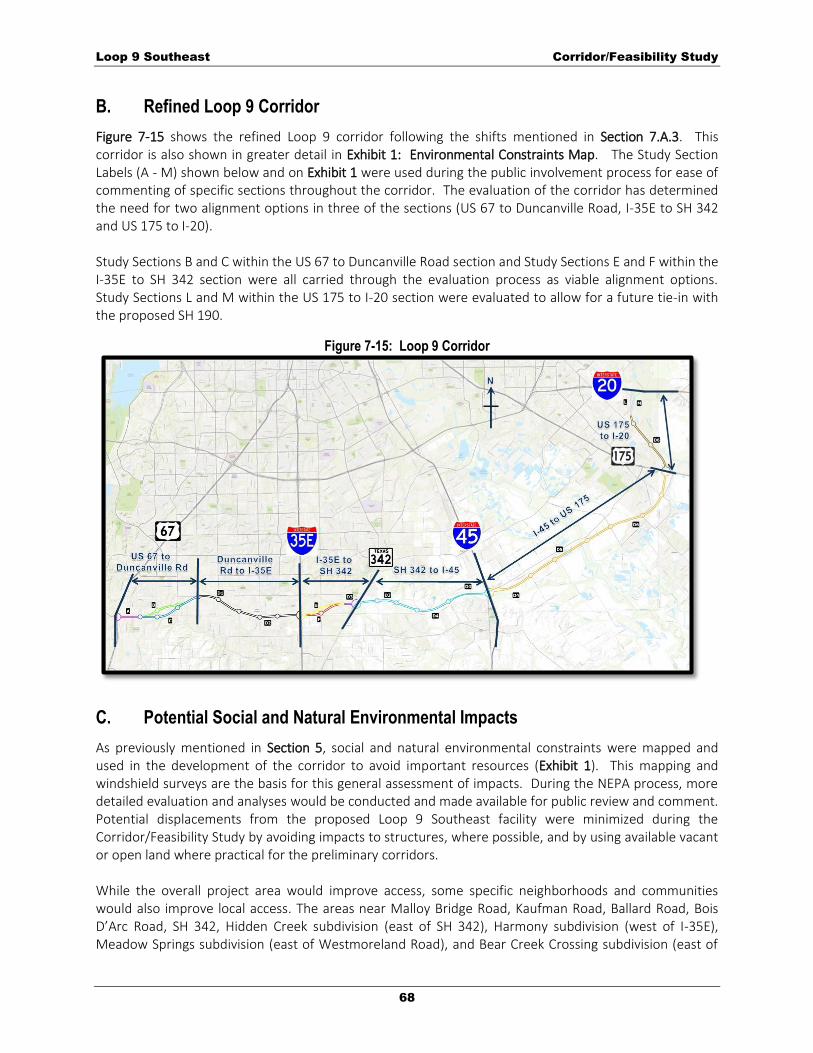
Loop 9 Southeast Corridor/Feasibility Study
68
B. Refined Loop 9 Corridor
Figure 7-15 shows the refined Loop 9 corridor following the shifts mentioned in Section 7.A.3. This corridor is also shown in greater detail in Exhibit 1: Environmental Constraints Map. The Study Section Labels (A - M) shown below and on Exhibit 1 were used during the public involvement process for ease of commenting of specific sections throughout the corridor. The evaluation of the corridor has determined the need for two alignment options in three of the sections (US 67 to Duncanville Road, I-35E to SH 342 and US 175 to I-20). Study Sections B and C within the US 67 to Duncanville Road section and Study Sections E and F within the I-35E to SH 342 section were all carried through the evaluation process as viable alignment options. Study Sections L and M within the US 175 to I-20 section were evaluated to allow for a future tie-in with the proposed SH 190.
Figure 7-15: Loop 9 Corridor
C. Potential Social and Natural Environmental Impacts
As previously mentioned in Section 5, social and natural environmental constraints were mapped and used in the development of the corridor to avoid important resources (Exhibit 1). This mapping and windshield surveys are the basis for this general assessment of impacts. During the NEPA process, more detailed evaluation and analyses would be conducted and made available for public review and comment. Potential displacements from the proposed Loop 9 Southeast facility were minimized during the Corridor/Feasibility Study by avoiding impacts to structures, where possible, and by using available vacant or open land where practical for the preliminary corridors. While the overall project area would improve access, some specific neighborhoods and communities would also improve local access. The areas near Malloy Bridge Road, Kaufman Road, Ballard Road, Bois D’Arc Road, SH 342, Hidden Creek subdivision (east of SH 342), Harmony subdivision (west of I-35E), Meadow Springs subdivision (east of Westmoreland Road), and Bear Creek Crossing subdivision (east of
Loop 9 Southeast Corridor/Feasibility Study
69
Duncanville Road) would have better access. In addition, the proposed project would increase capacity, mobility, and accessibility by creating a direct link from I-20 in southeastern Dallas County to US 67. It would serve a population that is currently without a limited-access roadway facility for east-west travel routes by providing access to the major highways of I-20, I-45, I-35E, US 67, and US 175. The long-term congestion from high population and employment growth, urban development, and overall growth from the DFW region would also be managed with the proposed project.
Overall, community cohesion in the study area may be strengthened in some ways by Loop 9 Southeast. East-west travel times would be reduced and the existing roadways would be less congested because some traffic would use the Loop 9 corridor, facilitating more interaction among communities in Kaufman County, south Dallas County, northern Ellis County, and beyond. Improved accessibility would make it more efficient to travel to desired locations and facilities. The Trinity River Authority (TRA) of Texas Ten Mile Creek Regional Wastewater System, the Trinity River Greenbelt Riverbend Preserve, the Old Brickyard Golf Course, and the Pecan Trails Golf Course are located within or adjacent to the proposed project. It appears that no ROW would be required from the Old Brickyard Golf Course or the TRA Ten Mile Creek Regional Wastewater System. The Trinity River Greenbelt Riverbend Preserve and the Pecan Trails Golf Course would be impacted by the recommended corridor. Considering that the Trinity River levee system extends for many miles upstream and downstream from the current project corridor, there is no feasible avoidance alternative. Consequently, it appears that some form of Section 4(f) Evaluation would be required in future NEPA documents.
If the Loop 9 Southeast alignment and bridge structures over the Trinity River can be designed to avoid any direct impact to the levee structures, then a Section 4(f) de minimis impact seems plausible. An impact to a park, recreation area, or wildlife and waterfowl refuge may be determined to be de minimis if the transportation use of the Section 4(f) resource, including consideration of impact avoidance, minimization, and mitigation or enhancement measures, does not adversely affect the activities, features, and attributes that qualify the resource for protection under Section 4(f). If the bridging structures must physically impact the levee structures, then a higher level evaluation under Section 4(f) would likely be required. As currently proposed, much of the floodplain portion of the study area would be bridged rather than filled above grade. It is recommended that coring and/or backhoe trenching be conducted to determine the potential for deeply buried sites in the overall Trinity floodplain area and along major tributaries (e.g., Ten Mile Creek, Bear Creek, and Red Oak Creek) where Holocene alluvium deposits are known to exist. Detailed surveys for archeological resources would be conducted during the project development phase of each individual project. The characteristics of the project that could have a visual/aesthetic impact on the resource include elevated structures/bridges, and other vertical elements such as signs, light standards, and toll gantries. Sensitive receptors/assets would be assessed further during the project development phase of each individual project. Schools in the Loop 9 Southeast study area would not be directly impacted by any of the proposed alternatives. No existing schools would be displaced as a result of the proposed project. Impacts to school districts are expected to be minimal, and ISD boundaries would not be impacted.

Loop 9 Southeast Corridor/Feasibility Study
70
The Rock Church in Seagoville is located within a proposed interchange location of Loop 9 and US 175. As the location and design of interchanges has not been finalized during the Corridor/Feasibility Study, impacts to this church are unknown at this time. Because ozone is a regional problem with complex modeling procedures, the effect on ozone from a specific project cannot be determined. However, through the regional transportation conformity process, the NCTCOG regularly updates models and emission budgets based on the long-range transportation plan for review and submission to the TCEQ for incorporation into the SIP. Field surveys for federal and state listed species would be conducted during the project development phase of each individual project. Based on information gathered during the DEIS phase, six bird species, including the now delisted Bald Eagle, should be further investigated during the environmental process. Coordination further confirmed that no critical habitat had been designated within the project corridor for any of the six species. Two bird species, Golden-Cheeked Warbler and Interior Least Tern had either potentially suitable habitat and/or occurrence records in the general region. Numerous wetlands, streams, and waterbodies are present throughout the study corridor. Detailed wetland delineations would be conducted during the project development phase of each individual project and coordinated with the USACE. Depending on the findings of the delineations and anticipated impact, USACE Section 404 permitting and mitigation may be required. Section 408 NEPA compliance may be required depending the proposed impacts to the Trinity River levees. Initial Hazardous Materials Site Assessments would be conducted during the project development phase of each individual project. Further studies, including Phase I Environmental Site Assessments (ESA) and Phase II ESAs, may be required. Although this information is dated, the project team utilized hazardous materials data available from the DEIS phase during the further refinement of project corridors. The team noted locations of gasoline service stations, industrial facilities, salvage yards, etc. to guide them during the shifting of alignment corridors and to avoid possible hazardous materials sites. The extent of the overall utility adjustments is not known at this time and would be determined during final design. Coordination of any utility adjustments would take place during the design phase or before construction begins. All utility adjustments would be made in accordance with TxDOT policies. To maintain compliance with the General Bridge Act of 1946, coordination and authorization for crossing the Trinity River would be required prior to construction.
1) Design Considerations and Environmental Constraints
Several design considerations and environmental constraints influenced the development of the Loop 9 Southeast corridor. Many of the following constraints and considerations are mentioned as part of the Development of Additional Corridors discussed in Section 7.A.3. For example, the existing terrain along the eastern portion of the study area includes several natural open spaces associated with expansive Trinity River and East Fork Trinity River floodplains. In the central and western portions of the corridor, level and rolling hills make way to rugged terrain associated with the White Rock (or Balcones) Escarpment that stretches through Cedar Hill toward the west. The study area also crosses eight major creeks (Red Oak Creek, North Prong Creek, Trinity River, Gravel Slough, Cottonwood Creek, Ten Mile Creek, Bear Creek, and Parsons Slough) as well as numerous streams and tributaries that
Loop 9 Southeast Corridor/Feasibility Study
71
generally drain to the southeast. While avoiding floodplains and stream crossings completely would be very difficult to do, the Loop 9 study corridor was modified, where appropriate, to minimize longitudinal impacts. The project design criteria are another example of a design consideration. The team ensured all horizontal geometry met the design constraints for a 70 mph roadway facility shown in the latest TxDOT Roadway Design Manual. This also impacted alternative considerations at potential interchange locations. Minimum vertical clearance and proposed interchange configurations were analyzed as these issues determined the necessity for additional ROW. Major utilities and land uses have also influenced the corridor (i.e., BNSF, UPRR, TV tower, two quarries, landfill, and major power lines). Natural, social, and cultural resources were considered in the evaluation. Places of worship, residences, cemeteries, and business, among others, along the corridor route were part of the corridor evaluations. The project team used the 70 mph design criteria to reduce/eliminate impacts to these resources. Numerous environmental constraints exist within the 35-mile long proposed corridor, including but not limited to: residential and commercial properties, floodplains, stream crossings, hazardous materials sites, vegetation, wildlife habitat, etc. The project team used all readily available data, along with windshield survey data, to avoid and minimize impacts to known resources within the study area. As each individual project progresses through future project development, on-the-ground field surveys would be conducted. Minor shifts to the proposed alignments could still occur to avoid or minimize impacts to newly identified resources within the proposed ROW.
D. Traffic Analysis
The project team conducted a traffic analysis to evaluate future traffic growth in the Loop 9 Southeast corridor. The analysis identified capacity needs within the corridor and assessed options to improve mobility, safety, and connectivity of the transportation system in the study area. The analysis utilized the NCTCOG regional travel demand model (referred to as NCTCOG Model) as its basis of analysis and used a base year of 2012 and a horizon year of 2035. Based on the preliminary traffic analysis, it was determined that the ultimate toll configuration and even the interim configurations for some sections would not be warranted by 2035. Therefore, a traffic study was required to project traffic needs beyond 2035. The mainlanes were evaluated as tolled due to RTC policy FT3-008 (encourages the early preservation of ROW in recommended corridors) and FT3-009 (encourages the preservation of ROW in all freeway/tollway corridors to accommodate future transportation needs) to accommodate the ultimate new location, access controlled transportation facility that would meet the long-term needs. Based on observations of substantial increases and decreases in the estimated traffic volumes at major crossing roads, the corridor was divided into six analysis segments as described in Table 7-1 and evaluated traffic growth potential under two scenarios: Baseline Forecast and Higher Growth Forecast. The Baseline Forecast utilizes historic traffic growth as well as the estimated population and employment growth between the base year (2012) and horizon year (2035) in the NCTCOG 2040 Demographic
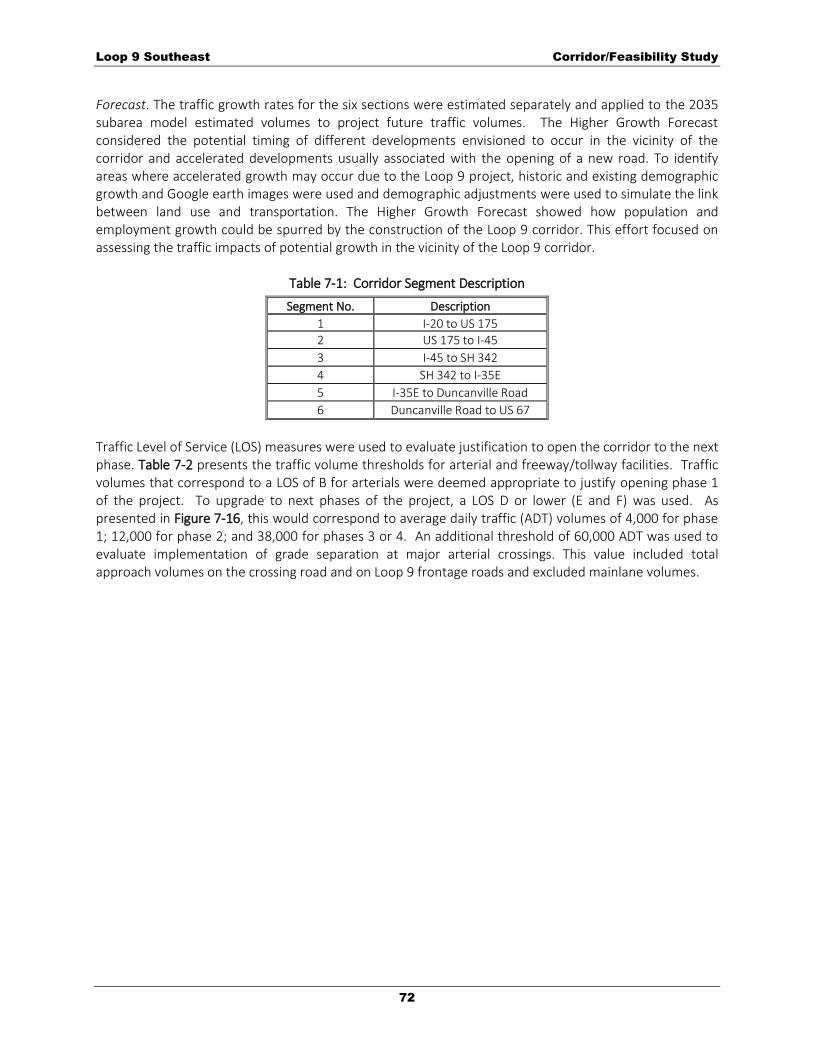
Loop 9 Southeast Corridor/Feasibility Study
72
Forecast. The traffic growth rates for the six sections were estimated separately and applied to the 2035 subarea model estimated volumes to project future traffic volumes. The Higher Growth Forecast considered the potential timing of different developments envisioned to occur in the vicinity of the corridor and accelerated developments usually associated with the opening of a new road. To identify areas where accelerated growth may occur due to the Loop 9 project, historic and existing demographic growth and Google earth images were used and demographic adjustments were used to simulate the link between land use and transportation. The Higher Growth Forecast showed how population and employment growth could be spurred by the construction of the Loop 9 corridor. This effort focused on assessing the traffic impacts of potential growth in the vicinity of the Loop 9 corridor.
Table 7-1: Corridor Segment Description
Segment No. Description
1 I-20 to US 175 2 US 175 to I-45 3 I-45 to SH 342 4 SH 342 to I-35E 5 I-35E to Duncanville Road 6 Duncanville Road to US 67
Traffic Level of Service (LOS) measures were used to evaluate justification to open the corridor to the next phase. Table 7-2 presents the traffic volume thresholds for arterial and freeway/tollway facilities. Traffic volumes that correspond to a LOS of B for arterials were deemed appropriate to justify opening phase 1 of the project. To upgrade to next phases of the project, a LOS D or lower (E and F) was used. As presented in Figure 7-16, this would correspond to average daily traffic (ADT) volumes of 4,000 for phase 1; 12,000 for phase 2; and 38,000 for phases 3 or 4. An additional threshold of 60,000 ADT was used to evaluate implementation of grade separation at major arterial crossings. This value included total approach volumes on the crossing road and on Loop 9 frontage roads and excluded mainlane volumes.
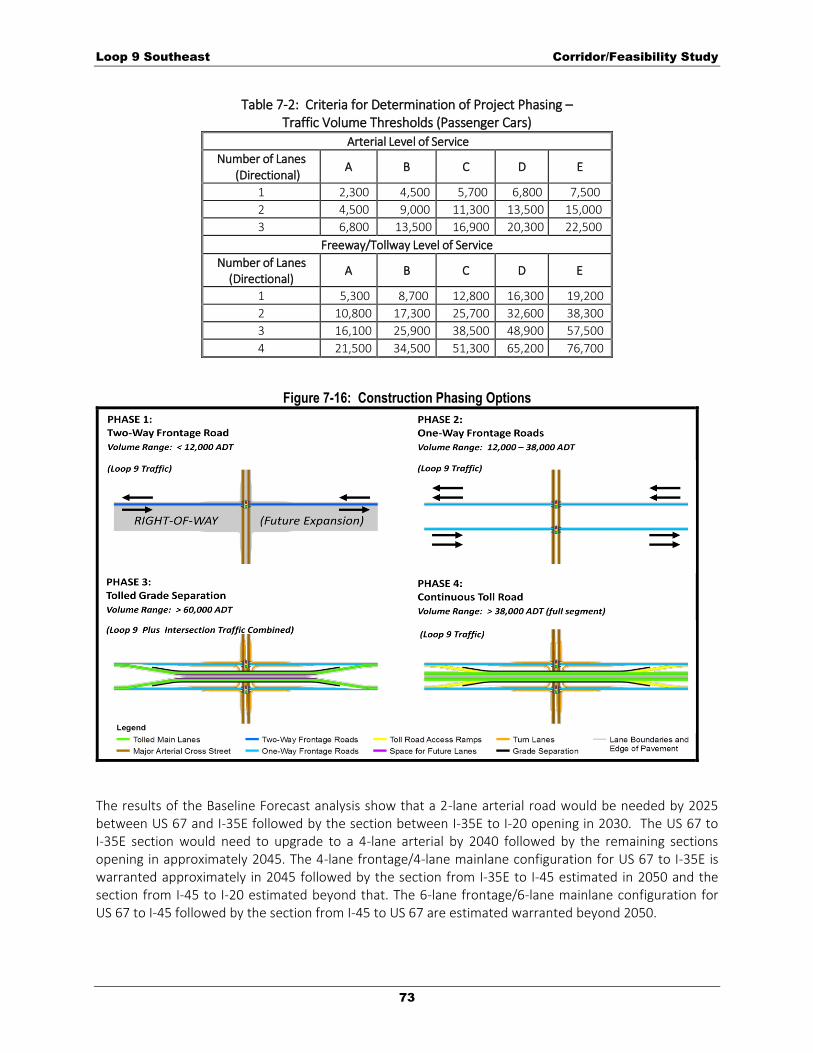
Loop 9 Southeast Corridor/Feasibility Study
73
Table 7-2: Criteria for Determination of Project Phasing – Traffic Volume Thresholds (Passenger Cars)
Arterial Level of Service
Number of Lanes (Directional)
A B C D E
1 2,300 4,500 5,700 6,800 7,500
2 4,500 9,000 11,300 13,500 15,000
3 6,800 13,500 16,900 20,300 22,500
Freeway/Tollway Level of Service
Number of Lanes (Directional)
A B C D E
1 5,300 8,700 12,800 16,300 19,200
2 10,800 17,300 25,700 32,600 38,300
3 16,100 25,900 38,500 48,900 57,500
4 21,500 34,500 51,300 65,200 76,700
Figure 7-16: Construction Phasing Options
The results of the Baseline Forecast analysis show that a 2-lane arterial road would be needed by 2025 between US 67 and I-35E followed by the section between I-35E to I-20 opening in 2030. The US 67 to I-35E section would need to upgrade to a 4-lane arterial by 2040 followed by the remaining sections opening in approximately 2045. The 4-lane frontage/4-lane mainlane configuration for US 67 to I-35E is warranted approximately in 2045 followed by the section from I-35E to I-45 estimated in 2050 and the section from I-45 to I-20 estimated beyond that. The 6-lane frontage/6-lane mainlane configuration for US 67 to I-45 followed by the section from I-45 to US 67 are estimated warranted beyond 2050.
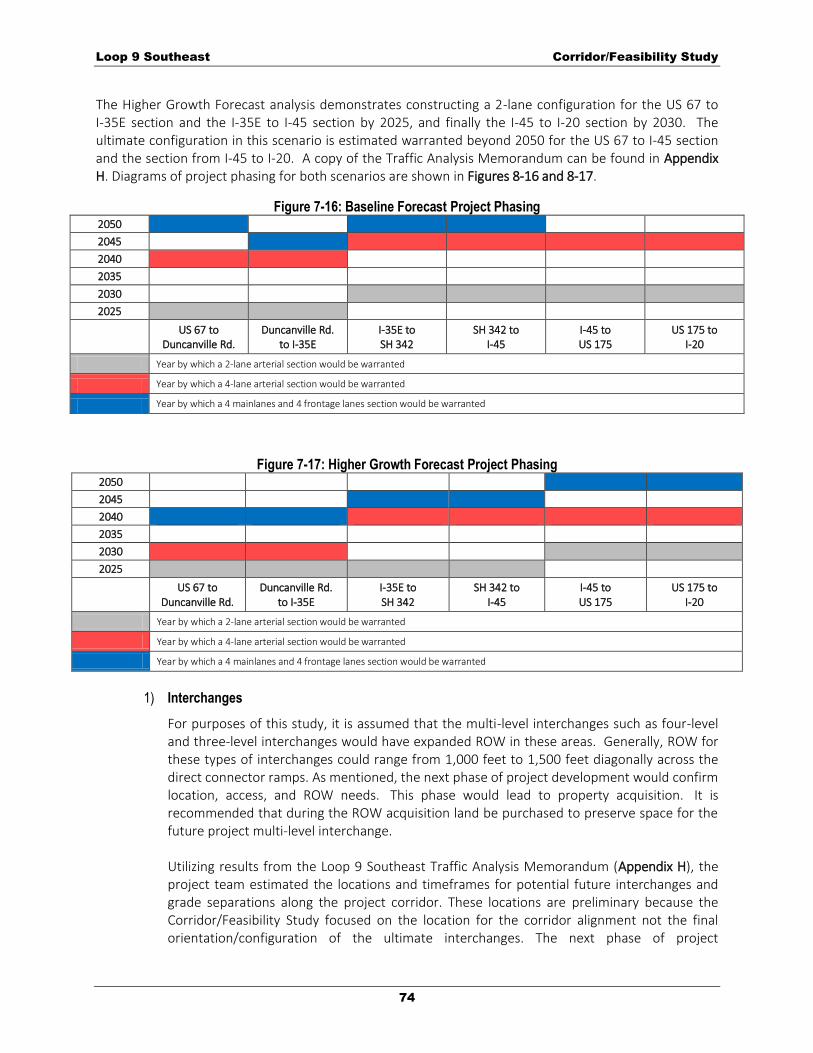
Loop 9 Southeast Corridor/Feasibility Study
74
The Higher Growth Forecast analysis demonstrates constructing a 2-lane configuration for the US 67 to I-35E section and the I-35E to I-45 section by 2025, and finally the I-45 to I-20 section by 2030. The ultimate configuration in this scenario is estimated warranted beyond 2050 for the US 67 to I-45 section and the section from I-45 to I-20. A copy of the Traffic Analysis Memorandum can be found in Appendix H. Diagrams of project phasing for both scenarios are shown in Figures 8-16 and 8-17.
Figure 7-16: Baseline Forecast Project Phasing 2050
2045
2040
2035
2030
2025
US 67 to Duncanville Rd.
Duncanville Rd. to I-35E
I-35E to SH 342
SH 342 to I-45
I-45 to US 175
US 175 to I-20
Year by which a 2-lane arterial section would be warranted
Year by which a 4-lane arterial section would be warranted
Year by which a 4 mainlanes and 4 frontage lanes section would be warranted
Figure 7-17: Higher Growth Forecast Project Phasing
2050
2045
2040
2035
2030
2025
US 67 to
Duncanville Rd. Duncanville Rd.
to I-35E I-35E to SH 342
SH 342 to I-45
I-45 to US 175
US 175 to I-20
Year by which a 2-lane arterial section would be warranted
Year by which a 4-lane arterial section would be warranted
Year by which a 4 mainlanes and 4 frontage lanes section would be warranted
1) Interchanges
For purposes of this study, it is assumed that the multi-level interchanges such as four-level and three-level interchanges would have expanded ROW in these areas. Generally, ROW for these types of interchanges could range from 1,000 feet to 1,500 feet diagonally across the direct connector ramps. As mentioned, the next phase of project development would confirm location, access, and ROW needs. This phase would lead to property acquisition. It is recommended that during the ROW acquisition land be purchased to preserve space for the future project multi-level interchange. Utilizing results from the Loop 9 Southeast Traffic Analysis Memorandum (Appendix H), the project team estimated the locations and timeframes for potential future interchanges and grade separations along the project corridor. These locations are preliminary because the Corridor/Feasibility Study focused on the location for the corridor alignment not the final orientation/configuration of the ultimate interchanges. The next phase of project
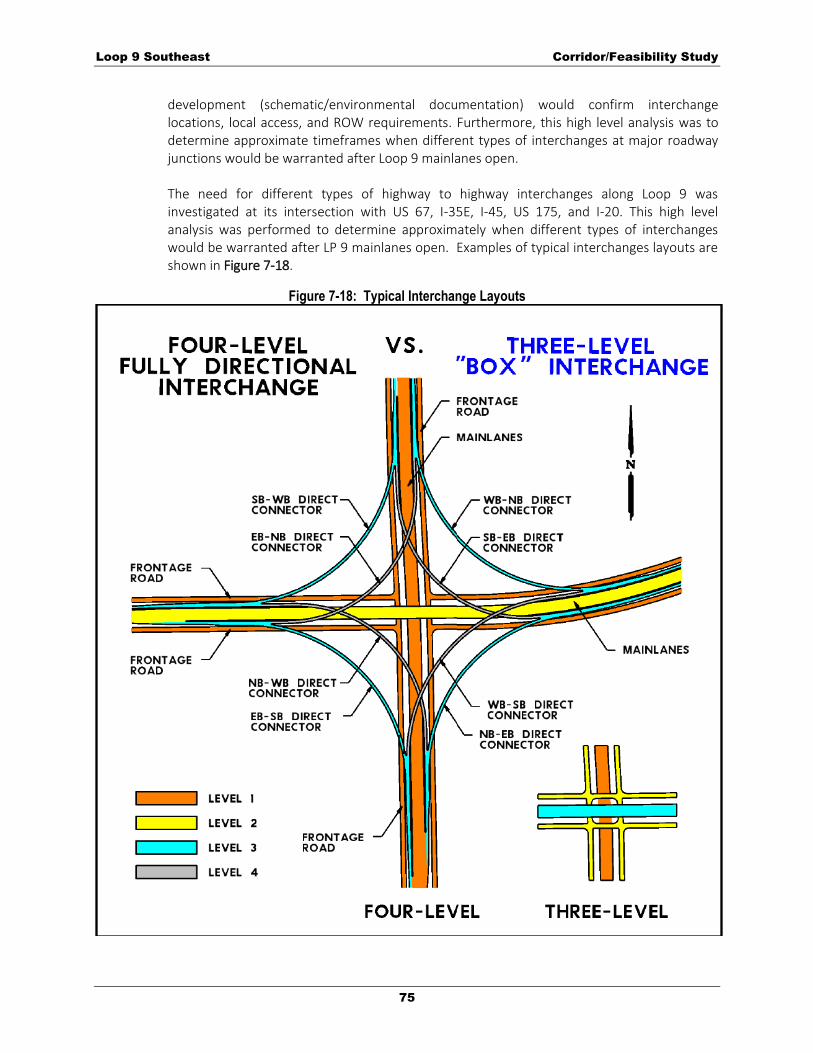
Loop 9 Southeast Corridor/Feasibility Study
75
development (schematic/environmental documentation) would confirm interchange locations, local access, and ROW requirements. Furthermore, this high level analysis was to determine approximate timeframes when different types of interchanges at major roadway junctions would be warranted after Loop 9 mainlanes open. The need for different types of highway to highway interchanges along Loop 9 was investigated at its intersection with US 67, I-35E, I-45, US 175, and I-20. This high level analysis was performed to determine approximately when different types of interchanges would be warranted after LP 9 mainlanes open. Examples of typical interchanges layouts are shown in Figure 7-18.
Figure 7-18: Typical Interchange Layouts

Loop 9 Southeast Corridor/Feasibility Study
76
Figure 7-19 presents the interchange locations, types, and when they would be warranted. As shown, by 2040, a full four-level interchange at US 67 and a three-level interchange at I-35E would be warranted. By 2045, a partial four-level interchange at I-45 and a three-level interchange at US 175 would be warranted. By 2050, the I-35E interchange is warranted to upgrade to a partial four-level interchange while a full four-level interchange at I-20 is warranted to complete a series of interchanges at major freeways along the Loop 9 corridor. Interchanges at I-45 and I-35E are warranted to upgrade to a full four-level interchange some time beyond 2050. US 175 remain a three-level interchange until beyond 2050 when it is estimated to upgrade to a partial four-level interchange and finally a full four-level interchange.
Figure 7-19: Potential Interchanges along Loop 9
2050
2045
2040
US 67 I-35E I-45 US 175 I-20
Years by which is a 3-level interchange type is warranted
Years by which is a partial 4-level interchange type is warranted
Years by which is a full 4-level interchange type is warranted
E. Costs
The 2013 total estimated proposed cost, including ROW acquisition and construction, for the ultimate configuration of the Loop 9 Southeast project from US 67 to I-20 is estimated at $2.8 billion in 2013 dollars. Table 7-3 shows project costs for each corridor.
Table 7-3: Project Costs of Each Corridor Ultimate Configuration
CRITERIA Corridor A
US 67 to I-35E Corridor B
I-35E to I-45 Corridor C I-45 to I-20
ROW/Utility Cost (2013$) $248M $230M $120M
Construction Cost (2013$) $523M $480M $1.18B
TOTAL $771M $710M $1.3B
F. Evaluation of Corridors
The alignment shifts discussed in Section 7.A.3 were evaluated for the alignments for a range of engineering and environmental criteria (Table 7-4). The data used for each criterion was based on the most readily available information to the project team, including aerial photography, digital data from various federal and state resources, and windshield surveys conducted throughout the study area. Engineering data included the section length, number of railroad crossings, and number and acreage of floodplain crossings. Environmental data included potential residential and commercial relocations, potential historic-age resource sites (available from studies conducting during the DEIS phase), number of stream crossings, number of pond crossings, and acreage of potential wetlands. Refer to Exhibit 1 (Environmental Constraints Map) for the location of these resources within the proposed alignments. In three locations along the corridor, two toll road options are available for further evaluation and

Loop 9 Southeast Corridor/Feasibility Study
77
development (Exhibit 1 and Figure 8-1). In each area, the new location toll road options would be carried forward through project development for that individual project.
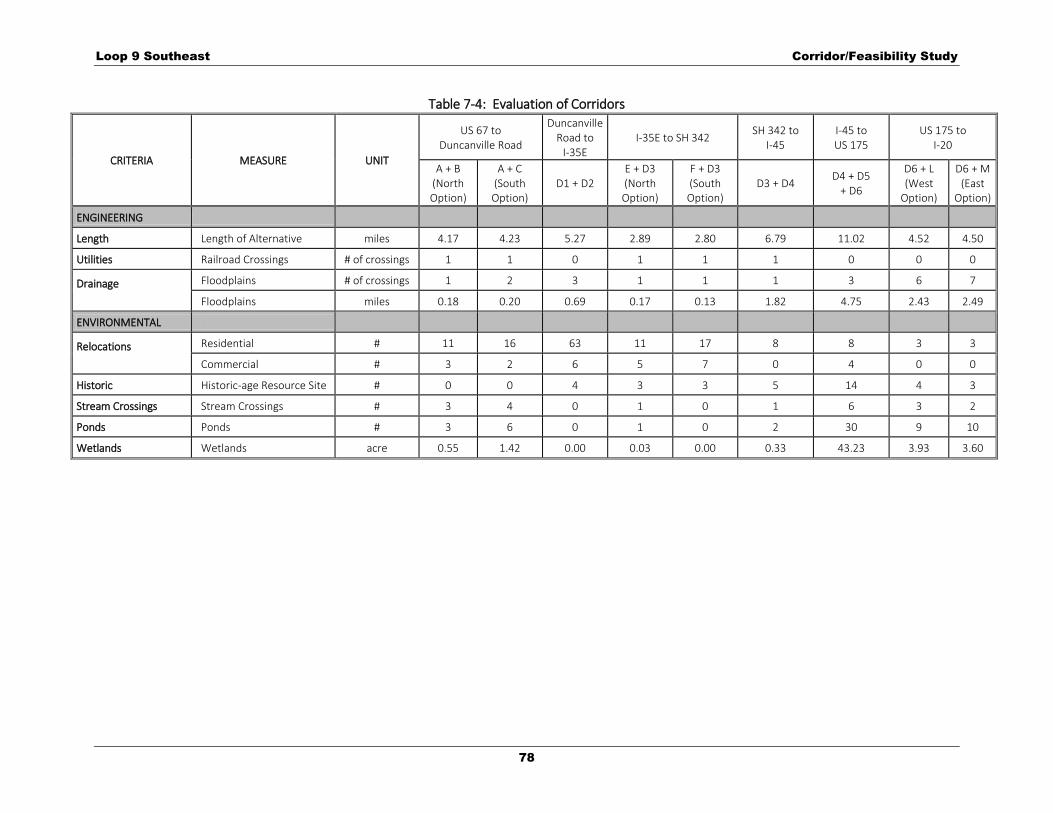
Loop 9 Southeast Corridor/Feasibility Study
78
Table 7-4: Evaluation of Corridors
CRITERIA MEASURE UNIT
US 67 to Duncanville Road
Duncanville Road to
I-35E I-35E to SH 342
SH 342 to I-45
I-45 to US 175
US 175 to I-20
A + B (North Option)
A + C (South Option)
D1 + D2 E + D3 (North Option)
F + D3 (South Option)
D3 + D4 D4 + D5
+ D6
D6 + L (West
Option)
D6 + M (East
Option)
ENGINEERING
Length Length of Alternative miles 4.17 4.23 5.27 2.89 2.80 6.79 11.02 4.52 4.50
Utilities Railroad Crossings # of crossings 1 1 0 1 1 1 0 0 0
Drainage
Floodplains # of crossings 1 2 3 1 1 1 3 6 7
Floodplains miles 0.18 0.20 0.69 0.17 0.13 1.82 4.75 2.43 2.49
ENVIRONMENTAL
Relocations
Residential # 11 16 63 11 17 8 8 3 3
Commercial # 3 2 6 5 7 0 4 0 0
Historic Historic-age Resource Site # 0 0 4 3 3 5 14 4 3
Stream Crossings Stream Crossings # 3 4 0 1 0 1 6 3 2
Ponds Ponds # 3 6 0 1 0 2 30 9 10
Wetlands Wetlands acre 0.55 1.42 0.00 0.03 0.00 0.33 43.23 3.93 3.60
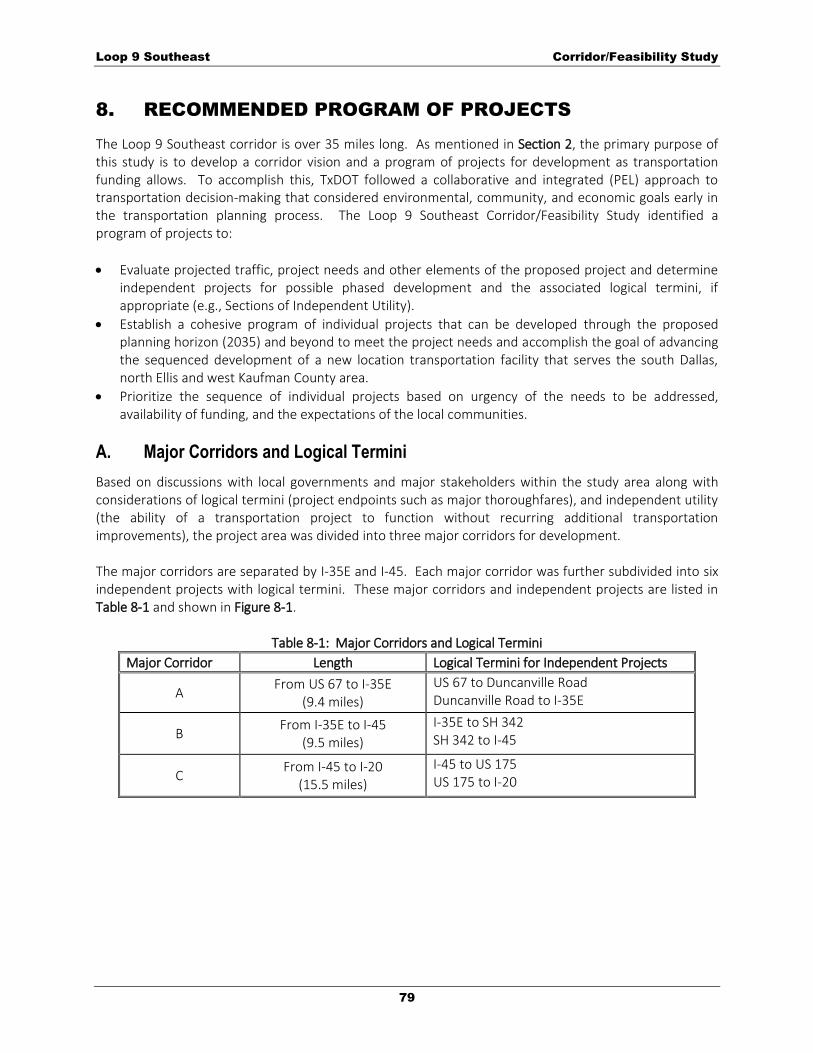
Loop 9 Southeast Corridor/Feasibility Study
79
8. RECOMMENDED PROGRAM OF PROJECTS
The Loop 9 Southeast corridor is over 35 miles long. As mentioned in Section 2, the primary purpose of this study is to develop a corridor vision and a program of projects for development as transportation funding allows. To accomplish this, TxDOT followed a collaborative and integrated (PEL) approach to transportation decision-making that considered environmental, community, and economic goals early in the transportation planning process. The Loop 9 Southeast Corridor/Feasibility Study identified a program of projects to:
Evaluate projected traffic, project needs and other elements of the proposed project and determine independent projects for possible phased development and the associated logical termini, if appropriate (e.g., Sections of Independent Utility).
Establish a cohesive program of individual projects that can be developed through the proposed planning horizon (2035) and beyond to meet the project needs and accomplish the goal of advancing the sequenced development of a new location transportation facility that serves the south Dallas, north Ellis and west Kaufman County area.
Prioritize the sequence of individual projects based on urgency of the needs to be addressed, availability of funding, and the expectations of the local communities.
A. Major Corridors and Logical Termini
Based on discussions with local governments and major stakeholders within the study area along with considerations of logical termini (project endpoints such as major thoroughfares), and independent utility (the ability of a transportation project to function without recurring additional transportation improvements), the project area was divided into three major corridors for development. The major corridors are separated by I-35E and I-45. Each major corridor was further subdivided into six independent projects with logical termini. These major corridors and independent projects are listed in Table 8-1 and shown in Figure 8-1.
Table 8-1: Major Corridors and Logical Termini
Major Corridor Length Logical Termini for Independent Projects
A From US 67 to I-35E
(9.4 miles)
US 67 to Duncanville Road Duncanville Road to I-35E
B From I-35E to I-45
(9.5 miles)
I-35E to SH 342 SH 342 to I-45
C From I-45 to I-20
(15.5 miles)
I-45 to US 175 US 175 to I-20

Loop 9 Southeast Corridor/Feasibility Study
80
Figure 8-1: Major Corridors and Logical Termini
Note: The project team gave each section and option an alphanumeric name for ease of public comments and quantification of impacts. Refer to Table 8-1.
The project team evaluated the major corridors to determine which projects could have the highest
priority. Table 8-2 shows the evaluation matrix.
Table 8-2: Major Corridor Evaluation Matrix
CRITERIA MEASURE CORRIDOR A
US 67 to I-35E CORRIDOR B I-35E to I-45
CORRIDOR C I-45 to I-20
Section Length mile 9.4 9.5 15.5
Total Estimated Cost (in 2013 $)* $ $771 M $710 M $1.3 B
Anticipated Growth High, Med, Low High High Low
Supports economic development opportunities (IIPOD, etc.)
High, Med, Low Med High Low
Supported by Local Governments Yes, No Yes Yes Yes
Supported by Major Stakeholders Yes, No Yes Yes Yes
Impact on Human (Built) Environment (displacements, cultural resources, etc.)
High, Med, Low High Med Low
Impact on Natural Environment (wetlands, habitat, etc.)
High, Med, Low Med High Med
Impacts to Major Utilities (transmission lines, railroads, TV towers, pipelines, etc.)
Yes, No Yes Yes No
*Includes ROW, utilities and construction costs for all four phases.
The project team, utilizing information gathered from the Task Force meetings and public input, determined that Corridors A and B should be the first to advance through project development based on the anticipated growth in these areas. Table 8-3 presents ADTs for the Baseline Forecast and the Higher Growth Forecast which indicate travel demand within these corridors growing at a faster rate than
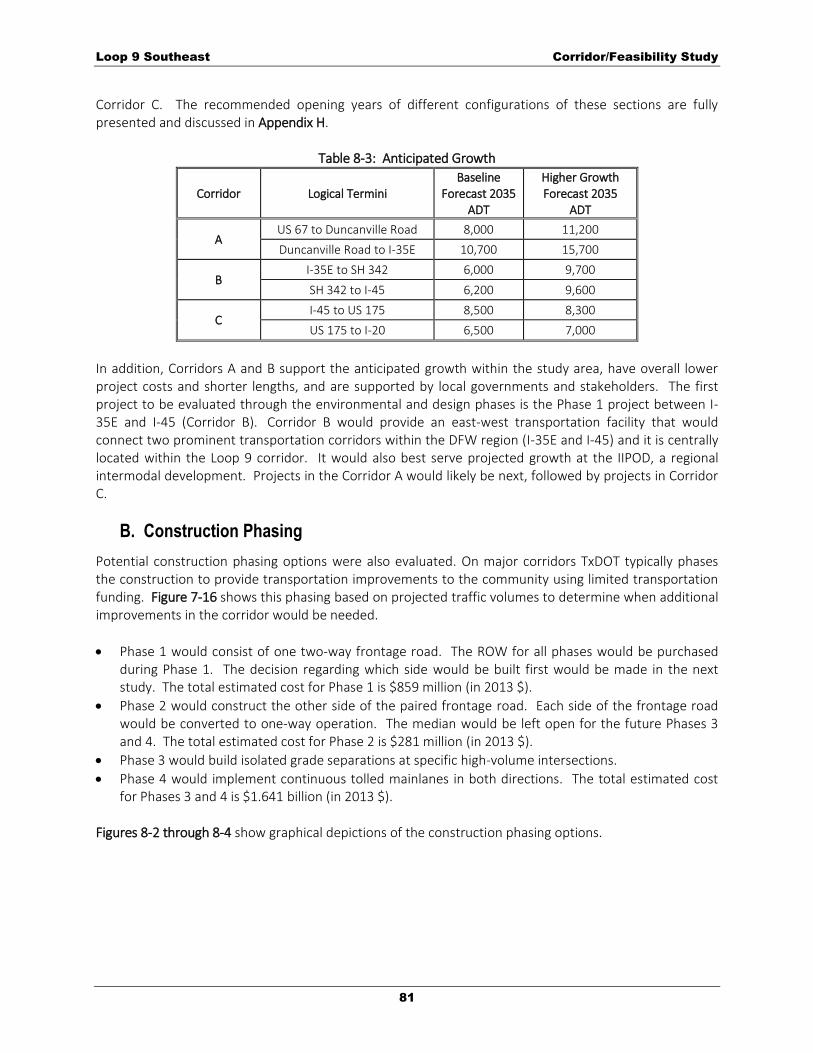
Loop 9 Southeast Corridor/Feasibility Study
81
Corridor C. The recommended opening years of different configurations of these sections are fully presented and discussed in Appendix H.
Table 8-3: Anticipated Growth
Corridor Logical Termini Baseline
Forecast 2035 ADT
Higher Growth Forecast 2035
ADT
A US 67 to Duncanville Road 8,000 11,200
Duncanville Road to I-35E 10,700 15,700
B I-35E to SH 342 6,000 9,700
SH 342 to I-45 6,200 9,600
C I-45 to US 175 8,500 8,300
US 175 to I-20 6,500 7,000
In addition, Corridors A and B support the anticipated growth within the study area, have overall lower project costs and shorter lengths, and are supported by local governments and stakeholders. The first project to be evaluated through the environmental and design phases is the Phase 1 project between I-35E and I-45 (Corridor B). Corridor B would provide an east-west transportation facility that would connect two prominent transportation corridors within the DFW region (I-35E and I-45) and it is centrally located within the Loop 9 corridor. It would also best serve projected growth at the IIPOD, a regional intermodal development. Projects in the Corridor A would likely be next, followed by projects in Corridor C.
B. Construction Phasing
Potential construction phasing options were also evaluated. On major corridors TxDOT typically phases the construction to provide transportation improvements to the community using limited transportation funding. Figure 7-16 shows this phasing based on projected traffic volumes to determine when additional improvements in the corridor would be needed.
Phase 1 would consist of one two-way frontage road. The ROW for all phases would be purchased during Phase 1. The decision regarding which side would be built first would be made in the next study. The total estimated cost for Phase 1 is $859 million (in 2013 $).
Phase 2 would construct the other side of the paired frontage road. Each side of the frontage road would be converted to one-way operation. The median would be left open for the future Phases 3 and 4. The total estimated cost for Phase 2 is $281 million (in 2013 $).
Phase 3 would build isolated grade separations at specific high-volume intersections.
Phase 4 would implement continuous tolled mainlanes in both directions. The total estimated cost for Phases 3 and 4 is $1.641 billion (in 2013 $).
Figures 8-2 through 8-4 show graphical depictions of the construction phasing options.
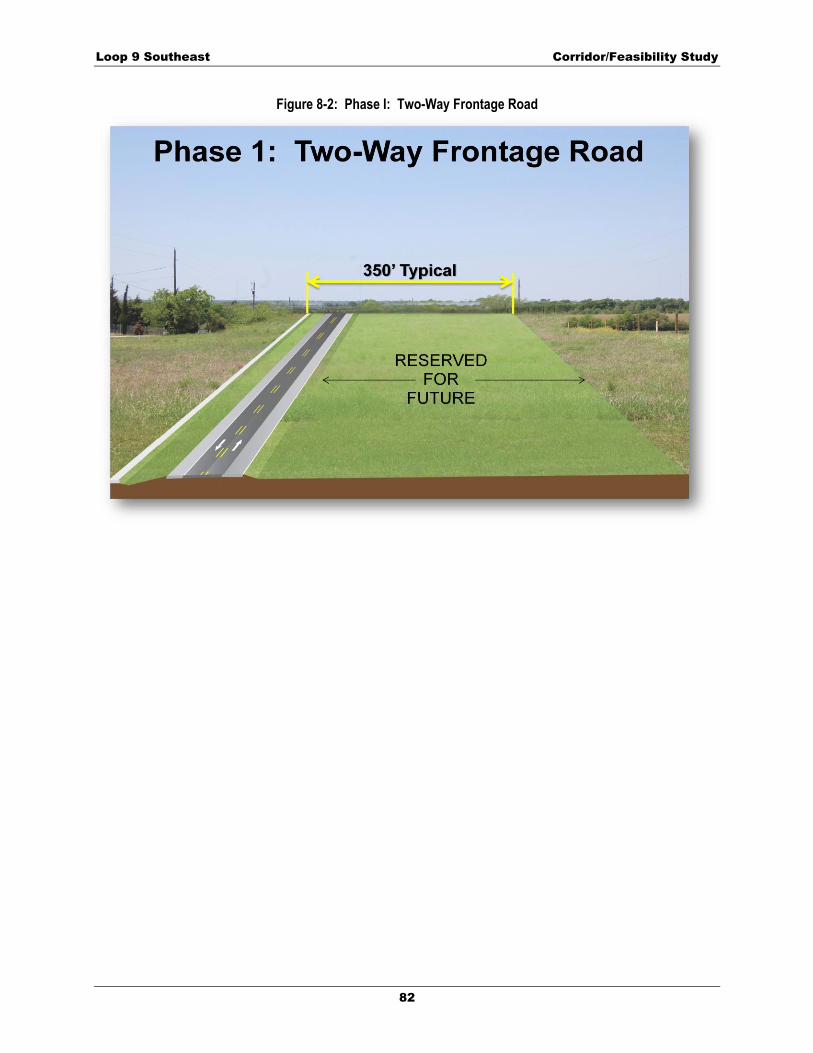
Loop 9 Southeast Corridor/Feasibility Study
82
Figure 8-2: Phase I: Two-Way Frontage Road
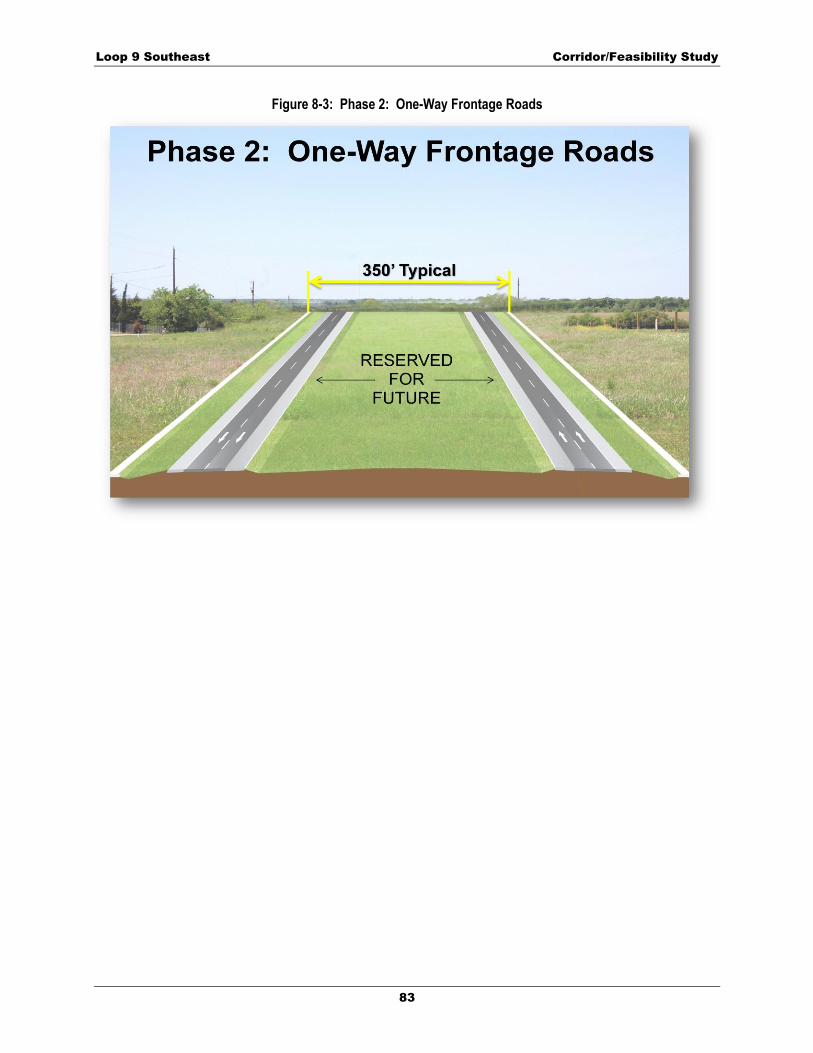
Loop 9 Southeast Corridor/Feasibility Study
83
Figure 8-3: Phase 2: One-Way Frontage Roads

Loop 9 Southeast Corridor/Feasibility Study
84
Figure 8-4: Phases 2 and 4: Continuous Toll Road
C. Program of Projects
Based on Higher Growth Scenario projected traffic data, Phase 1 would be warranted by 2025 for the section from US 67 to I-45. The section from I-45 to I-20 would be warranted by 2030. All other improvements are warranted beyond 2035, including construction of the ultimate toll facility, and are considered long-term projects to be reevaluated again as the corridor matures. Construction of each individual project would be dependent on available funding.

Loop 9 Southeast Corridor/Feasibility Study
85
9. NEXT STEPS
A. Funding
Currently, there is $100 million available to advance individual transportation projects in the Loop 9 Southeast corridor. This funding is derived from state and local sources. The first project to be evaluated through the environmental and design phases would be the Phase 1 project between I-35E and I-45 (Corridor B). Corridor B would provide an east-west transportation facility that would connect two prominent transportation corridors within the DFW region (I-35E and I-45) and it is centrally located within the Loop 9 corridor. It would also best serve projected growth at the IIPOD, a regional intermodal development. Sufficient design would be conducted during this phase of project development to determine the ROW requirements for the full Phase 4 roadway facility. This would allow TxDOT to purchase the necessary ROW for the entire future facility during the Phase 1 project for each corridor. It should be noted that policies provided by the RTC encourages preservation of ROW in key transportation corridors and RTC Policy FT3-002 requires TxDOT to evaluate all new limited access capacity for priced facility potential. As stated in Section 7.E, the total cost to build Loop 9 Southeast is $2.8 billion (2013 $). Therefore, as additional funding is identified, the remaining Phase 1 projects would be advanced and ROW for the Phase 4 roadway facility would be acquired. Projects in Corridor A would likely be next, followed by projects in Corridor C. As future funding is secured for the projects and the projects are advanced into the environmental and design phases, the MTP and TIP would need to be updated to reflect the appropriate project scope and design configuration. TxDOT would work to develop a long term strategy to identify funding for advancing additional projects in the Loop 9 Southeast corridor. This may include federal, state and local resources as well as innovative financing tools such as tolls, establishment of a Transportation Reinvestment Zone (TRZ), local participation in ROW costs and ROW donations from local land owners.
B. ROW Preservation and Acquisition
Initially, a database of potential properties impacted by the proposed corridors was prepared using GIS mapping and appraisal district records obtained from Dallas, Kaufman, and Ellis Counties. The GIS mapping, which included high-resolution aerial imagery, was used to identify potential displacements for each alternative and to develop a project mailings list for public involvement activities. The Loop 9 Southeast project would require the acquisition of ROW along the entire length of the corridor. The proposed interchanges at US 67, I-35E, I-45, US 175, and I-20 would require additional ROW to accommodate the ramps and access roads at these locations. The proposed project would require the relocation of residences and businesses. Refer to Table 7-4 for the anticipated number of residential and commercial displacements in the corridor. The purchase of ROW by TxDOT would not begin until approval of environment documents and schematics for each project.
During Phase 1 of the proposed project development, the entire proposed ROW would be purchased but only a two-way frontage road would be constructed. The remaining portion of the proposed ROW would be preserved for the future additional frontage road and the ultimate toll facility.

Loop 9 Southeast Corridor/Feasibility Study
86
C. Future Engineering and Environmental Studies
Each proposed facility would have logical termini and independent utility. While not connected actions, in context of the Council of Environmental Quality NEPA regulations (40 CFR 1508.25), the proposed system of toll roads and other priced transportation facilities would be part of a transportation network that would serve the long-term transportation needs. Because Environmental Justice (EJ) and other resource considerations should be taken into account when planning a system of independent toll road projects and priced facilities, a regional toll analysis was conducted by NCTCOG to assess how such a toll system could indirectly or cumulatively affect EJ populations and other respective resources in the region. TxDOT in coordination with the NCTCOG and local officials propose to advance the highest priority projects through the environmental process. The intent of the Corridor/Feasibility Study was to have sufficient evaluation and documentation to identify the level of environmental document necessary for each priority project. The environmental process for independent projects would cover the initial near-term phased construction and would also document the need to preserve the necessary ROW to achieve the long-term need and goals. These projects would be incorporated into the MTP, TIP, and STIP, as appropriate. This action is consistent with the RTC policy FT3-008 and FT3-009, to accommodate the ultimate new location, access controlled transportation facility that would meet the long term needs. Figure 9-1 shows the anticipated project schedule for future individual projects. As funding is identified for an individual project, the environmental process, public involvement activities, schematic design, and any necessary environmental permitting would begin. During the environmental process and schematic design, additional agency coordination would be conducted to ensure that the project being developed complies with all state and federal laws, guidance, rules, and regulations, as appropriated. Agency coordination may include but not be limited to: the FHWA, USEPA, USFWS, USACE, FAA, NRCS, TCEQ, TPWD, and THC. This first step could take approximately 12 to 18 months to complete. Once environmental clearance has been obtained, TxDOT would begin the ROW acquisition process, which is estimated to take approximately 24 months to complete. Following ROW acquisition, construction would begin and could take an additional 24 months to complete. Projects can begin at any time once funding for a specific project has been identified.
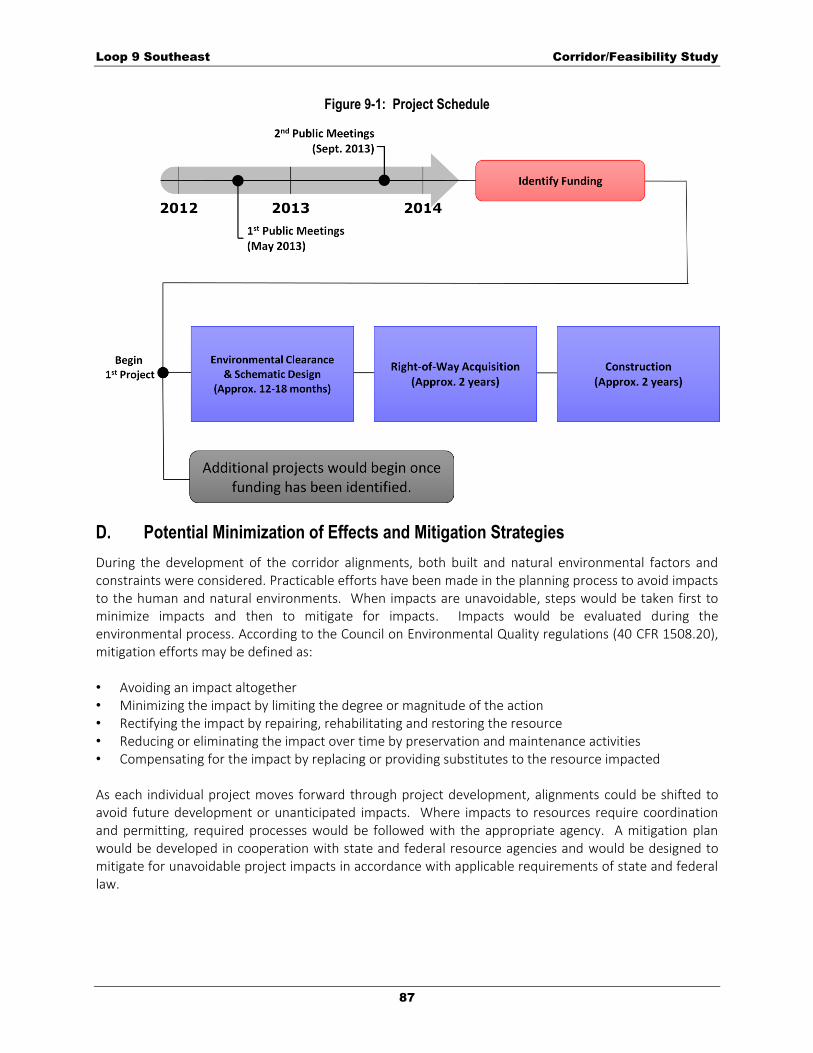
Loop 9 Southeast Corridor/Feasibility Study
87
Figure 9-1: Project Schedule
D. Potential Minimization of Effects and Mitigation Strategies
During the development of the corridor alignments, both built and natural environmental factors and constraints were considered. Practicable efforts have been made in the planning process to avoid impacts to the human and natural environments. When impacts are unavoidable, steps would be taken first to minimize impacts and then to mitigate for impacts. Impacts would be evaluated during the environmental process. According to the Council on Environmental Quality regulations (40 CFR 1508.20), mitigation efforts may be defined as: • Avoiding an impact altogether • Minimizing the impact by limiting the degree or magnitude of the action • Rectifying the impact by repairing, rehabilitating and restoring the resource • Reducing or eliminating the impact over time by preservation and maintenance activities • Compensating for the impact by replacing or providing substitutes to the resource impacted As each individual project moves forward through project development, alignments could be shifted to avoid future development or unanticipated impacts. Where impacts to resources require coordination and permitting, required processes would be followed with the appropriate agency. A mitigation plan would be developed in cooperation with state and federal resource agencies and would be designed to mitigate for unavoidable project impacts in accordance with applicable requirements of state and federal law.
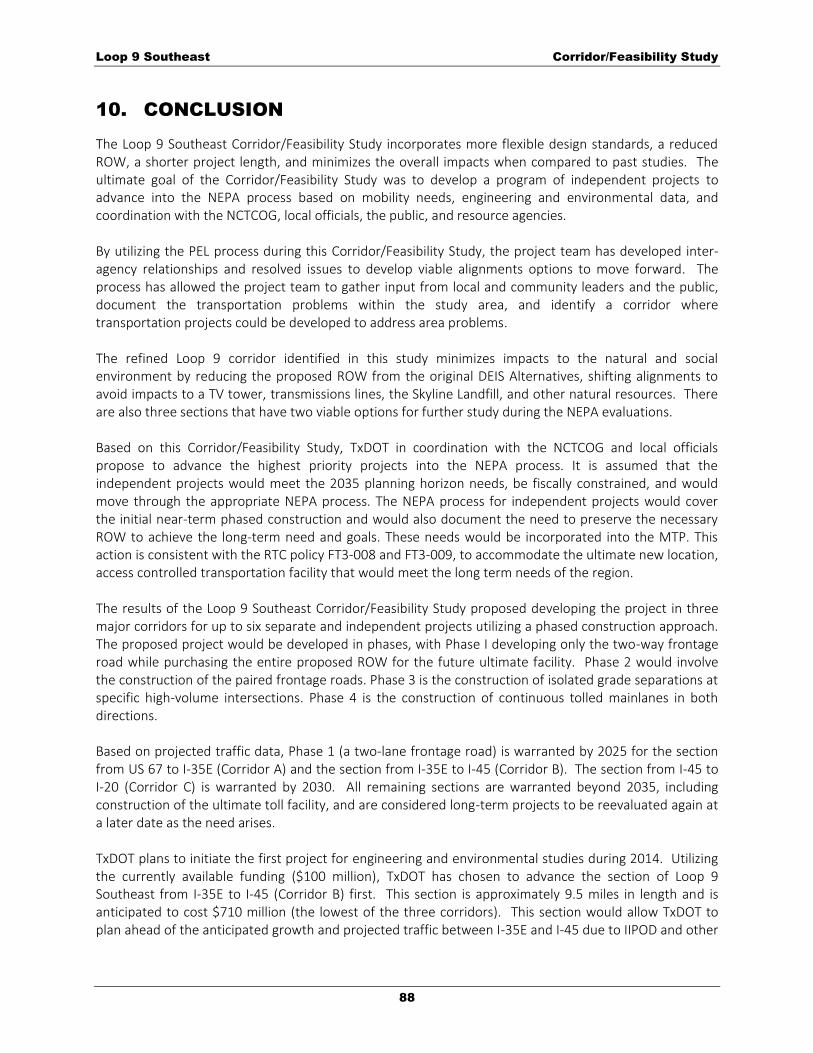
Loop 9 Southeast Corridor/Feasibility Study
88
10. CONCLUSION
The Loop 9 Southeast Corridor/Feasibility Study incorporates more flexible design standards, a reduced ROW, a shorter project length, and minimizes the overall impacts when compared to past studies. The ultimate goal of the Corridor/Feasibility Study was to develop a program of independent projects to advance into the NEPA process based on mobility needs, engineering and environmental data, and coordination with the NCTCOG, local officials, the public, and resource agencies. By utilizing the PEL process during this Corridor/Feasibility Study, the project team has developed inter-agency relationships and resolved issues to develop viable alignments options to move forward. The process has allowed the project team to gather input from local and community leaders and the public, document the transportation problems within the study area, and identify a corridor where transportation projects could be developed to address area problems. The refined Loop 9 corridor identified in this study minimizes impacts to the natural and social environment by reducing the proposed ROW from the original DEIS Alternatives, shifting alignments to avoid impacts to a TV tower, transmissions lines, the Skyline Landfill, and other natural resources. There are also three sections that have two viable options for further study during the NEPA evaluations. Based on this Corridor/Feasibility Study, TxDOT in coordination with the NCTCOG and local officials propose to advance the highest priority projects into the NEPA process. It is assumed that the independent projects would meet the 2035 planning horizon needs, be fiscally constrained, and would move through the appropriate NEPA process. The NEPA process for independent projects would cover the initial near‐term phased construction and would also document the need to preserve the necessary ROW to achieve the long‐term need and goals. These needs would be incorporated into the MTP. This action is consistent with the RTC policy FT3‐008 and FT3‐009, to accommodate the ultimate new location, access controlled transportation facility that would meet the long term needs of the region. The results of the Loop 9 Southeast Corridor/Feasibility Study proposed developing the project in three major corridors for up to six separate and independent projects utilizing a phased construction approach. The proposed project would be developed in phases, with Phase I developing only the two-way frontage road while purchasing the entire proposed ROW for the future ultimate facility. Phase 2 would involve the construction of the paired frontage roads. Phase 3 is the construction of isolated grade separations at specific high-volume intersections. Phase 4 is the construction of continuous tolled mainlanes in both directions. Based on projected traffic data, Phase 1 (a two-lane frontage road) is warranted by 2025 for the section from US 67 to I-35E (Corridor A) and the section from I-35E to I-45 (Corridor B). The section from I-45 to I-20 (Corridor C) is warranted by 2030. All remaining sections are warranted beyond 2035, including construction of the ultimate toll facility, and are considered long-term projects to be reevaluated again at a later date as the need arises. TxDOT plans to initiate the first project for engineering and environmental studies during 2014. Utilizing the currently available funding ($100 million), TxDOT has chosen to advance the section of Loop 9 Southeast from I-35E to I-45 (Corridor B) first. This section is approximately 9.5 miles in length and is anticipated to cost $710 million (the lowest of the three corridors). This section would allow TxDOT to plan ahead of the anticipated growth and projected traffic between I-35E and I-45 due to IIPOD and other

Loop 9 Southeast Corridor/Feasibility Study
89
developers in the area. Subsequent sections would be advanced based on local needs and available funding.
Loop 9 Southeast Corridor/Feasibility Study
90
11. REFERENCES
Bureau of Labor Statistics. 2011. Economy at a Glance-Labor Statistics. (accessed January 16, 2011). Council on Environmental Quality (CEQ) Regulations, Title 40 Code of Federal Regulations Part 1502. Environmental Data Resources, Inc. September 2010. EDR DataMap Environmental Atlas, Loop 9 SE,
Dallas, TX, Inquiry number 02875319.1r. ______. 2010. EDR DataMap Environmental Atlas, Loop 9 SE, Dallas, TX. Federal Highway Administration. 2013. Environmental Review Toolkit.
http://www.environment.fhwa.dot.gov/integ/. Accessed August 14, 2013. ______. October 30, 1987. Technical Advisory T6640.8A Federal Emergency Management Agency. 1991. National Flood Insurance Program (NFIP) Flood Insurance
Rate Map (FIRM). Map Number 4804110100B. ______. 1999. NFIP FIRM. Map Numbers 48139C0060D, 48139C0080D, and 48139C0015D. ______. 2001. NFIP FIRM, , Map Numbers 48113C0590J, 48113C0595J, 48113C0615J, 48113C0620J,
48113C0640J, 48113C0630J, 48113C0645J, 48113C0670J, 48113C0665J, 48113C0660J, 48113C0680J, 48113C0685J, 48113C0540J, 48113C0545J, 48113C0535J, 48113C0565J.
Internal Inland Port of Dallas. 2013. http://www.iipod-texas.org/maps/. Accessed November 1, 2013. McMahan, C.A., R.G. Frye, and K.L. Brown. 1984. The Vegetation Types of Texas, Including Cropland (An
Illustrated Synopsis to Accompany the Map). Texas Parks and Wildlife Department, Austin. North Central Texas Council of Governments and Texas Department of Transportation. April 12, 2012.
2013–2016 Statewide Transportation Improvement Program/ Transportation Improvement Program.
______. 2013. Mobility 2035 – 2013 Update. Found at http://www.nctcog.org/trans/mtp/2035/index.asp (accessed October 2013). ______. 2011. Major Employers. Accessed from NCTCOG website. (Accessed January 2011). Texas Parks and Wildlife Department. September 2005. Texas Comprehensive Wildlife Conservation
Strategy 2005-2010. Texas Parks and Wildlife Department. 2013. Annotated County Lists of Rare Species – Dallas County.
Found at http://gis2.tpwd.state.Texas.us/ (accessed October 29, 2013.) ______. 2011. Annotated County Lists of Rare Species – Ellis and Kaufman Counties. Found at
http://gis2.tpwd.state.Texas.us/ (accessed October 29, 2013.)
Loop 9 Southeast Corridor/Feasibility Study
91
Texas Water Development Board. 2013. 2016 Regional and 2017 State Water Plan Projections Data. Found at http://www.twdb.state.tx.us/waterplanning/data/projections/2017/popproj.asp (accessed October 2013).
U.S. Census Bureau. 2010. Census 2010 Summary File 1 (SF1). Found at
http://factfinder2.census.gov/faces/nav/jsf/pages/index.xhtml (accessed October 2013). ______. 2011. 2007-2011 American Community Survey Five Year Estimates. Found at
http://factfinder2.census.gov/faces/nav/jsf/pages/index.xhtml (accessed October 2013). U.S. Fish and Wildlife Service. 2013. List of Species by County for Texas: Dallas, Ellis, and Kaufman
Counties. Found at http://www.fws.gov/southwest/es/EndangeredSpecies (accessed October 29, 2013.)
World Wildlife Fund. 2001. National Geographic Society Wild World Ecoregion Profiles. Found at
http://www.nationalgeographic.com/wildworld/profiles/terrestrial/na/ na0814.html (accessed March 10, 2007).