Embed Size (px)
Citation preview

Colliers Radar
China Investment Property 27 June 2018
Looking From Above
Scouting for new opportunities in
China’s investment property market

Colliers China Research Team Contact details on back page
Summary of Top Opportunities
East China: > Shanghai business parks
> Retail property, notably in Nanjing and
Hangzhou despite limited liquidity
> Logistics assets in outlying cities, e.g.
Nantong, Changzhou, Wuxi and Changshu
> Long-run rental apartments
North China: > Offices in decentralised areas of Beijing
> Beijing business parks
> Logistics assets in Tianjin and Langfang
> Shenyang as a logistics hub
South China: > Offices in Shenzhen and Guangzhou’s
Pazhou district for growth potential
> Logistics assets in nearby cities such as
Dongguan, Huizhou and Foshan
> Retail property over the long run
West China: > Grade A offices in Chengdu (especially in
Financial Town)
> High-yielding Chengdu business parks
(notably in South High-Tech district)
> Logistics assets over the long run
Executive Summary
Growth prospects in China remain strong, with real GDP
growth set to exceed 6.0% in 2018 and 2019. Monetary
tightening has been modest, and real interest rates may
even fall slightly in coming years. These factors help
explain why investment activity in China has stayed firm,
with completed property deals up 24% YOY in Q1 2018.
Nevertheless, economic risks are rising. Concerns about
a trade war have pulled China’s stock markets down 18-
20%, and the renminbi has weakened. However, these
risks have not hit commercial property prices. Valuations
therefore look full: Grade A offices in Chinese Tier 1
cities yield 3.6-4.0%, barely above ten-year bonds.
But we still see investment opportunities. In East China,
we prefer Shanghai business park assets to offices, with
rent rising due to a growing high-tech sector and better
infrastructure. We also like retail property, which yields
4.0-6.5%. Logistics trends are bright, with rent and prices
rising and assets available in outlying cities. Finally,
long-term rental apartments are an exciting new sector.
In North China, decentralised areas of Beijing still offer
attractive office assets. Business parks offer appealing
yields of 4.2-4.8%. Trends in logistics are rosy, but due
to lack of assets in Beijing we predict more activity in
nearby cities like Tianjin and Langfang. Logistics growth
should also benefit Shenyang, the hub of the North East.
South China should attract more international attention
from the Greater Bay Area plan. In the office sector, we
expect high rent growth in Shenzhen, while Guangzhou’s
Pazhou district should grow into a new CBD. Logistics
assets are in short supply in Shenzhen and Guangzhou,
so investors should turn to outlying cities. High new retail
supply will create new opportunities in the long run.
West China is good value. Grade A offices in Chengdu
yield 5.7%, and the Financial Town area offers ample
supply and high policy support. We also favour business
park assets, which yield 7-8%, notably in South Hi-Tech
district. Despite scarcity of assets now, Chengdu is
growing fast into a key logistics hub. We predict further
logistics development in new areas east of the city.
Figure 1: Investment Property Net Yields in Key China Cities
Source: Colliers International
City Office Retail Logistics/Industrial Business Park
Beijing 4.0% 5.0% 5.0-5.5% 4.2-4.8%
Tianjin 4.5% 6.0% 5.5-6.0% n/a
Shenyang 5.3% 6.3% 6.0% n/a
Shanghai 3.6% 4.0–5.5% 5.0-5.5% 4.3%
Nanjing 5.3% 5.5-6.5% 5.5-6.5% 5.0-6.0%
Hangzhou 5.1% 5.5-6.5% 5.5-6.5% 5.0-6.0%
Shenzhen 3.9% 5.2% 6.7% 4.5-5.0%
Guangzhou 4.0% 5.0% 6.0% 5.5-6.0%
Chengdu 5.7% 6.0% 6.0% 7.0-8.0%

3 Looking From Above | 28 June 2018 | Investment Property | Colliers International
Contents Top opportunities ............................... 5
China: economic outlook ................... 6
Deal volumes and valuation in China 7
Comparison among Asian cities ..... 10
East China ......................................... 11
Summary of opportunities 11
Retail 12
Business Park 13
Logistics/Workshop 14
Office 16
Rental Apartment 17
North China ....................................... 20
Summary of opportunities 20
Retail 20
Business Park 22
Logistics 23
Office 24
South China ...................................... 25
Summary of opportunities 25
Office: Shenzhen 26
Office: Guangzhou 27
Logistics 27
Business Park: Shenzhen 29

4 Looking From Above | 28 June 2018 | Investment Property | Colliers International
Business Park: Guangzhou 30
Retail: Shenzhen 31
Retail: Guangzhou 31
West China ........................................ 32
Summary of opportunities 32
Retail 32
Office 33
Business Park 35
Industrial/Logistics 36

5 Looking From Above | 28 June 2018 | Investment Property | Colliers International
Top opportunities East China
> Business park: In Shanghai, business park assets
offer better value than office properties. Rents
should rise steadily for the next few years driven by
growth in technology and better infrastructure.
> Retail: We also favour retail property, which yields
4.0%-6.5% in East China, notably in Nanjing and
Hangzhou. Liquidity is low in these cities, but recent
projects have been launched with high occupancy.
> Logistics: Trends here are very positive with rent
and capital values rising. Investors should consider
logistics property in outlying markets in East China,
such as Nantong, Changzhou, Wuxi and Changshu.
> Long-term rental apartments: This is an appealing
emerging sector, which is attracting new players due
to government efforts to promote the rental market.
> Office: Yields for Shanghai offices are low versus
other sectors. However, some opportunities still
exist, notably value-add assets. The Pudong office
market offers better prospects since future supply
will be limited. Certain DBD areas llike Wujiaochang
and New Jing’an also merit attention.
North China
> Office: Beijing aims to develop decentralised areas
to relocate enterprises and population. Favoured
non-core areas include Tongzhou, Lize, Fengtai and
Wangjing. In Tianjin, we like central Heping district
although it is small and liquidity is low.
> Business park: Yields range from 4.2% to 4.8%,
and rents should rise further due to policy support
and growth in TMT. The most active business parks
are Shangdi, Beijing Electronic Zone, Fengtai and
Beijing Economic-Technological Development Area.
> Logistics: Trends are rosy, with investors chasing
scarce assets in all four of Beijing’s main logistics
submarkets. We predict greater activity in Tianjin
(where we favour Wuqing, the Airport Economic
Zone and Tianjin Binhai New Area Core Area),
Langfang (where we favour Anci, Longhe and Gu’an)
and Shenyang (see below).
> Shenyang: As the North East’s hub city, Shenyang
benefits from strength in logistics; we favour the
Hunnan, Shenbei, Yuhong, and Tiexi submarkets.
South China
> GBA expansion: While South China has recorded
China’s fastest economic growth, the investment
market has been dominated by domestic groups.
From now on, we expect the region to attract more
international investor attention due to closer regional
integration under the Greater Bay Area plan.
> Office: In Shenzhen, we expect the office sector to
achieve consistent average rental growth of 5% over
the next five years, driven by strong economic
growth. This robust outlook should permit growth in
capital values of 8-10% in 2018. In Guangzhou, we
see Pazhou gradually developing into a new CBD
and attracting new office investment.
> Logistics: There is limited opportunity in logistics in
Shenzhen and Guangzhou due to lack of new
supply. Instead, investors should seek opportunities
in nearby cities, such as Dongguan, Huizhou and
Foshan. Logistics rents in these areas are 10-35%
cheaper than in Shenzhen and Guangzhou, implying
demand from occupiers should be strong.
> Retail: In emerging areas of Shenzhen, new retail
supply of 2.3 million sq metres will put pressure on
rent for three years. However, population growth and
the emergence of new residential communities
should make retail investment attractive for the long
term. In emerging areas of Guangzhou, total retail
new supply in 2018 should reach 886,000 sq metres.
This will create many new opportunities although
capital values may stay flat until these areas mature.
West China
> Office: Grade A office property in Chengdu yields
5.7%, and rent should rise steadily due to firm
demand and high-quality new projects. The Financial
Town district enjoys strong policy support and offers
ample supply.
> Business park: We also favour Chengdu’s business
park segment, which yields 7-8%, notably in South
Hi-Tech district where projects have been launched
with high rents.
Logistics: While available properties are scarce
today, logistics trends are very positive. The national
government’s “One Belt, One Road” plan, the launch
of a free trade zone in Sichuan province, the start of
the Rong'ou international express railway, and the
construction of Tianfu international airport should
drive Chengdu’s further development as a logistics
hub. Looking ahead, industrial activity should shift
eastwards to Longquan Mountain, Jianzhou New
Town, Huaizhou New Town and New Airport Town.

6 Looking From Above | 28 June 2018 | Investment Property | Colliers International
China: economic
outlook
The Chinese economy has maintained the strong growth
seen last year. Real GDP growth of 6.9% for 2017 was
followed by 6.8% in Q1 2018, driven by strong exports,
resilient housing activity and firm consumption. Over
April and May, investment activity weakened slightly,
while export volume growth moderated, reflecting
slowing global trade momentum. On the other hand,
imports growth has accelerated, pointing to continuing
strong domestic demand. In USD terms, imports grew by
21.5% YOY in April, and by 26.0% in May.
Oxford Economics expects the Chinese domestic
economy to cool over the remainder of 2018, and is
concerned about trade tensions with the US.
Nevertheless, given the strong recent import data and
recent policy statements which place slightly greater
emphasis on boosting demand than on reducing
indebtedness, Oxford Economics recently revised its
2018 real GDP growth forecast from 6.3% to 6.4%1.
Looking forward, Oxford Economics expects average
real GDP growth in China to slow from 6.1% over the
period 2017-2021 to 4.9% over the period 2022-2026. In
order to avoid the risk of a financial crisis, the economy
needs to wean itself off the traditional credit-fuelled and
investment-led growth model. Moreover, with returns to
investment now more modest, capital stock is likely to
make a significantly lower contribution to growth in the
future. The contribution from the labour supply will also
be negligible given a declining working age population
from 2016. On the other hand, China should move up
the economic and technological “value chain” as it loses
its competitive edge in labour-intensive sectors.
1 Please see “Country Economic Forecast, China”, 20 June 2018 and
23 May 2018, by Oxford Economics. See also the “Data Insights,
China” reports of 23 April and 8 June.
In contrast to certain other economic forecasters, Oxford
Economics does not expect the Chinese authorities to
push up interest rates significantly. The authorities
certainly are interested in lowering financial risks and in
gradually reducing credit growth. Policies aimed at these
ends, combined with higher interest rates in the US, will
probably maintain upward pressure on Chinese
interbank interest rates. However, Oxford Economics
does not expect higher benchmark (i.e. official) interest
rates in 2018 since it expects CPI inflation to remain
below the 3% target set by the People’s Bank of China.
Looking further ahead, Oxford Economics assumes that
benchmark interest rates will fall slightly over 2019-2021,
whereas CPI inflation will pick up (but remain below
3.0%). As a result, Oxford Economics expects real (i.e.
inflation-adjusted) interest rates in China to decrease
over the next few years, as shown in Figure 3 Falling
real interest rates ought to drive investment activity in the
property market, and so support capital values.
Notwithstanding these positive factors, economic risks
for China are rising. Notably, mounting concerns about
trade have depressed Chinese stock markets and the
Chinese renminbi, with negative implications for property
markets. On 19 June, the CSI 300 Chinese share index
fell 3.5%, bringing its drop from its recent high in January
to 18%. In total, 1,060 stocks on the Shanghai and
Shenzhen markets fell by the daily limit of 10%. The falls
came in response to worries that the US will levy tariffs
on a further USD200 billion of Chinese imports. With
respect to the currency, the renminbi started 2018 at
6.50 versus the US dollar, rallied to a high of 6.27 in
April, and has since fallen back to 6.51 (as of 25 June).
If the US does impose major new tariffs, then exports of
Chinese consumer and industrial goods to the US will
probably suffer. This would potentially reduce demand
for office space from occupiers in the consumer and
manufacturing sectors. The technology sector might also
Figure 2: Major Asian Economies: Estimated Real GDP Growth 2017-2021
Source: Oxford Economics
2017 2018 2019 2020 2021
China 6.9% 6.4% 6.1% 5.7% 5.4%
Japan 1.7% 1.4% 0.9% 0.0% 0.9%
South Korea 3.1% 2.7% 2.6% 2.5% 2.5%
Hong Kong SAR 3.8% 3.6% 2.4% 2.2% 2.2%
Singapore 3.6% 3.1% 2.4% 2.6% 2.5%
India 6.4% 7.3% 7.0% 6.8% 6.6%

7 Looking From Above | 28 June 2018 | Investment Property | Colliers International
be affected, given close dependence on the US for
components, although internet and e-commerce
companies such as Tencent and Alibaba are driven
much more by domestic demand. Lower demand for
space from major occupier sectors would probably result
in a reappraisal of rental growth prospects, with negative
implications for capital values of investment property.
Deal volumes and
valuation in China China general
China is one of the most active real estate markets in
Asia. Commercial property in China has seen strong
demand from urbanisation and the transition to a service
economy. Based on data from the National Bureau of
Statistics, China’s economy is increasingly driven by the
services sector, which has increased as a proportion of
the total from 43% in 2007 to 52% in 2017.
The transaction values of investment property in China
reached USD36.9 billion (RMB236.2 billion) in 2017,
2.6x the transaction volume in 2007 (source: Real
Capital Analytics). High liquidity in the market in search
of returns has pushed up capital values for commercial
property, depressing net yields across the various
property sectors. Grade A office property in Tier 1 cities
now yields only 3.6-4.0%. Yields remain higher for retail,
industrial and business park assets, lying in a range of
4.0-6.7% (and more like 5.0-6.7% excluding Shanghai).
Chengdu stands out as offering good value, with Grade
A office property yielding 5.7%, retail and industrial
property about 6%, and business park assets 7-8%.
Strong demand for Chinese property assets has
persisted in 2018. According to Real Capital Analytics,
total transactions of completed properties grew by 24%
City Office Retail Industrial Business Park
Beijing 4.0% 5.0% 5.0-5.5% 4.2-4.8%
Tianjin 4.5% 6.0% 5.5-6.0% n/a
Shenyang 5.3% 6.3% 6.0% n/a
Shanghai 3.6% 4.0–5.5% 5.0-5.5% 4.3%
Nanjing 5.3% 5.5-6.5% 5.5-6.5% 5.0-6.0%
Hangzhou 5.1% 5.5-6.5% 5.5-6.5% 5.0-6.0%
Suzhou 5.1% 5.0-6.0% 5.0-6.0% 4.5-5.5%
Wuhan 5.5% 5.5-6.5% 5.5-6.5% 5.0-6.0%
Shenzhen 3.9% 5.2% 6.7% 4.5-5.0%
Guangzhou 4.0% 5.0% 6.0% 5.5-6.0%
Chengdu 5.7% 6.0% 6.0% 7.0-8.0%
Figure 3: Real Short-Term Interest Rates for Major Asian Markets
Source: Oxford Economics
Figure 4: Investment Property Net Yields in Key Chinese Cities
Source: Colliers International
Source: Colliers International
-1.2
-0.8
-0.4
0.0
0.4
0.8
1.2
1.6
2.0
2.4
2018Q1 2018Q2 2018Q3 2018Q4 2019Q1 2019Q2 2019Q3 2019Q4 2020Q1 2020Q2 2020Q3 2020Q4 2021Q1 2021Q2 2021Q3 2021Q4
China Hong Kong Singapore Japan South Korea India
%

8 Looking From Above | 28 June 2018 | Investment Property | Colliers International
YOY in Q1 2018, from USD7.4 billion to USD9.2 billion.
However, transactions in Shanghai in particular declined
sharply, falling by 76% to USD1.1 billion (although
Shanghai remained the largest investment centre
overall). By contrast, transactions in Guangzhou jumped
roughly fivefold, to just under USD1.0 billion.
Office
According to Real Capital Analytics, office transaction
volumes totalled USD20.8 billion (RMB133.1 billion) in
2017, representing 56% of the total commercial property
volume. Given the expanding maturity of the services
industry, the demand for prime office space in Tier 1
cities such as Beijing and Shanghai is robust. Strong
demand has been driven by traditional service sector
industries such as finance and professional services, as
well as new demand from IT, technology, flexible
workspace operators and start-up companies. Due to a
shortage of prime grade office space in the CBD in Tier 1
cities, high-quality prime office buildings with attractive
facilities will probably maintain their high valuations and
low yields despite new office development in
decentralised areas. Reflecting improving infrastructure
between major and emerging business districts, newly
completed office buildings in secondary business
districts should be an attractive investment option to
investors and tenants in the future. The average prime
office yield for Tier 1 cities ranges from 3.6% to 4.0%. In
Tier 2 cities, the average prime office yield stands at a
higher level of between about 5% and 6%; however,
these buildings generally come with a higher vacancy
rate.
Figure 5: Asia Property Transaction Volumes by Country and Territory in Q1 2018 (USD, YOY)
Investment Property Transactions in Asian Countries and Territories
US$ million Q1 2017 Q1 2018 YoY
Japan 11,715 13,148 12%
China 7,415 9,222 24%
Hong Kong SAR 4,195 7,877 88%
South Korea 2,783 4,404 58%
Singapore 1,587 995 -37%
Taiwan 500 515 3%
India 289 441 53%
Malaysia 369 107 -71%
Thailand 618 33 -95%
Vietnam 78 17 -78%
Note. These totals exclude undeveloped land. Source: RCA as of 8 May 2017; calculations by Colliers
Figure 6: Asia property transaction volumes by urban centre in Q1 2018 (USD, YOY)
Investment Property Transactions in Asian Cities (USD million)
US$ million Q1 2017 Q1 2018 YoY
Hong Kong 4,195 7,877 88%
Tokyo 4,594 6,864 49%
Seoul 1,793 3,613 102%
Shanghai 4,436 1,065 -76%
Nagoya 196 1,006 413%
Singapore 1,587 995 -37%
Guangzhou 179 958 435%
Beijing 917 675 -26%
Yokohama 1,453 566 -61%
Fukuoka 172 291 69%
Note. These totals exclude undeveloped land. Source: RCA as of 8 May 2017; calculations by Colliers

9 Looking From Above | 28 June 2018 | Investment Property | Colliers International
Retail
Expansion of domestic demand is currently an important
government policy. In 2017, the value of retail sales of
consumer goods was RMB36,626 billion (USD5,605
billion), 3.9x the level in 20072. This is due mainly to
rising incomes. China’s disposable income per capita
reached RMB26,000 or USD4,000 (RMB36,400 or
USD5,570 for urban areas) in 2017. With stable
economic growth and increasing salaries, growth in retail
consumption should be sustained in the future.
However, the retail sector confronts a challenge from the
fast growth of e-commerce and online/mobile shopping
platforms offering convenient payment methods. Large
shopping centres in major cities cannot only emphasise
international chain stores and luxury brands to attract
shoppers, but instead must emphasise the tenant mix
focusing on consumer experience in food, beverages,
leisure and entertainment opportunities. The average
prime retail yield in Tier 1 cities ranges from 4.0% to
5.5%, reflecting the continuing high valuations. For Tier 2
cities, the average prime retail yields lie in a higher range
of 5.5% to 6.5%.
Industrial
Logistics and warehouse properties have become an
attractive investment class. The transaction value for
industrial properties in China reached USD4.4 billion
(RMB28.2 billion) in 20173, representing growth of 40%
YOY. This is the highest recorded YOY growth among
investment sectors, due to strong demand for industrial
space from warehouse operators, e-commerce
companies and third-party logistics providers.
The online retail sales turnover in China increased 32%
YOY in 20174, to RMB5,481 billion (USD856 billion), due
to the fast development of the e-commerce industry and
convenient online and mobile payment methods. This led
to the surge in express delivery volume to 40 billion units
in 2017, up 28% YOY5.
A lack of tradable industrial assets has long been a
major barrier to satisfying strong investor demand. A
shortage of both supply of industrial land and a growing
demand for industrial space have led to a very low
vacancy rate in Tier 1 cities, pushing some warehouse
demand to Tier 2 cities. This has led to certain Tier 2
cities such as Foshan, Dongguan and Kunshan,
becoming favoured destinations for the development of
warehousing and logistics parks as they offer improved
2 National Bureau of Statistics 3 Real Capital Analytics
connectivity and infrastructure. The yield on industrial
properties ranges from about 5% to 7%.
The logistics and warehouse industry has attracted the
attention of investors due to its attractive yield and solid
industry fundamentals. This is especially true when
compared to the competitive office and retail sectors and
the highly regulated residential market.
Business Park
The business park sector is increasingly popular in
China with major demand coming from R&D centres,
data centres, high-tech, early stage and start-up
companies. Business parks offer these innovative
industries the opportunity to create an industry cluster
and ecosystem. Improving transportation and
infrastructure development enhance the connectivity of
business parks beyond the city centres. Business park
yields for Beijing (4.2%-4.8%), Shanghai (4.3%) and
Shenzhen (4.5%-5.0%) are lower than in Guangzhou
(5.5%-6.0%) and Chengdu (7.0-8.0%).
4 National Bureau of Statistics 6 State Post Bureau

10 Looking From Above | 28 June 2018 | Investment Property | Colliers International
Comparison
among Asian
cities Comparing Hong Kong, arguably Asia’s gateway city,
with other cities in the region, it is notable that Hong
Kong has the lowest property yield in the office (2.4%),
retail (2.3-2.5%), industrial (3.5-3.7%) and luxury
apartment (1.9-2.1%) sectors. A shortage of available
commercial buildings, adequate liquidity, the influx of
Chinese investors and local demand are the factors that
have bid up transaction prices in Hong Kong.
Singapore is seeing a boost in market sentiment and
confidence, supported by broadening GDP growth and
an expected multi-year recovery in the office and
residential markets. Vacancy rates are declining in
commercial property after oversupply in previous years,
leading to an attractive property yield on office (3.6%),
retail (4.2-5%), industrial (6%-7%) and business parks
(5.2%-6.2%).
6 Rental apartment in Hong Kong, Singapore, Taipei, Manila and Indian cities refers to luxury residential
Emerging cities in South East Asia and India offer high
yields on office (4.5-9.0%), retail (4.5-9.3%), industrial
(6.5-10.0%) and business park (4.5-9.0%) assets. South
East Asia and India stand out in anticipation of high and
long-term economic growth with a lower cost base and
plentiful investment opportunities. Comparatively, Indian
cities rank highest in terms of property yields. Cities such
as Delhi, Mumbai, Bangalore and Hyderabad are
generating promising office property yields from about
8% to 9%, and from about 8% to over 9% for retail
properties. Investment returns for logistics and
warehouse properties are outstanding, ranging from 9%
to 10%, given limited existing organised industrial
properties supply, rising e-commerce players and
supportive government policies.
For Chinese Tier 1 cities, commercial property yields lie
between those of the well-developed markets (Hong
Kong, Singapore and Taipei) and those offered by cities
in the emerging markets of South East Asia and India.
Stable economic growth and robust commercial property
demand from investors and users should keep
valuations high, putting downward pressure on property
yields for office (3.6-4.0%), retail (4.0-5.5%), industrial
(5.0-6.7%), and business parks (4.2-6.0%).
7 Hong Kong’s retail refers to overall retail facilities 8 Singapore’s industrial and business refers to all grades
Figure 7: Investment Property Net Yields in Asian Gateway Cities, Q1/2018
City Office Retail Industrial Business park Rental
apartment6 Beijing 4.0% 5.0% 5.0-5.5% 4.2-4.8% -
Shanghai 3.6% 4.0-5.5% 5.0-5.5% 4.3% 4.0%
Shenzhen 3.9% 5.2% 6.7% 4.5-5.0% -
Guangzhou 4.0% 5.0% 6.0% 5.5-6.0% -
Hong Kong7 2.4% 2.3-2.5% 3.5-3.7% - 1.9-2.1%
Taipei 2.8% - - 3.0% 2.0%
Tokyo 3.7% - - - -
Seoul 4.3% 4.0-5.0% 6.0-7.0% - -
Singapore8 3.6% 4.2-5.0% 6.0-7.0% 5.2-6.2% 1.8-2.2%
Bangkok 4.5-5.0% 4.5-5.0% 6.5-7.5% 4.5-5.0% 4.5-5.0%
Manila 5.0-6.0% 6.0% - - 4.8-5.3%
Jakarta 6.0-7.0% 6.0-8.0% 9.0% - 4.0-6.0%
Ho Chi Minh City 7.0-7.5% 8.0-8.5% 10.0-10.5% - 6.0-7.0%
Hanoi 7.5-8.0% 8.0-8.5% 9.5-10.0% - 6.0-7.0%
Delhi 8.0-8.25% 8.0-9.0% 9.0-10.0% 8.5-9.0% 1.0-2.0%
Mumbai 8.0-8.25% 8.0-9.0% 9.0-10.0% 8.5-9.0% 1.0-2.0%
Bangalore 8.0-8.5% 8.0-9.0% 9.0-10.0% 8.5-9.0% 1.0-2.0%
Chennai 8.25-9.0% 8.25-9.25% 9.0-10.0% 8.5-9.0% 1.0-2.0%
Pune 8.25-9.0% 8.25-9.25% 9.0-10.0% 8.5-9.0% 1.0-2.0%
Hyderabad 8.0-8.75% 8.25-9.25% 9.0-10.0% 8.5-9.0% 1.0-2.0%
Source: Colliers International

11 Looking From Above | 28 June 2018 | Investment Property | Colliers International
East China
Summary of opportunities
The rental yield of CBD Grade A office property in
Shanghai has continued to decline and now ranges from
3.6%. Grade A office property thus offers no premium
over ten-year bonds, implying that investors must be
highly confident about capital growth to justify
purchases. We prefer the business park segment, where
rent should continue to rise steadily over the next few
years driven by an expanding technology industry and
improved infrastructure. We also favour retail property,
which yields 4.0-6.5% in East China, especially in
Nanjing and Hangzhou where recent projects have been
launched with high occupancy rates. Trends in logistics
remain very positive with rent and capital value showing
an upward trend. In addition, occupiers and investors
can also consider the attractions of the outlying logistics
property markets in East China, such as Nantong,
Changzhou, Wuxi and Changshu. Long-term rental
apartments have become an emerging sector in recent
years. An increasing number of market players are
attracted by government incentives to launch asset
securitisation to free up their cashflows. It will be an eye-
catching segment in the following years.
Retail
> Shanghai. Strong market demand pushed the city’s
vacancy rate down to 10.6% in 1Q 2018. With no
new supply, the city’s overall market rent recently
recorded its first increase since 2H 2016, reaching
RMB34.3 (USD5.25) per sq metre per day in 1Q
2018, showing 0.6% QOQ growth.
> Nanjing. The prime retail leasing market stayed
active over 2017. The overall vacancy rate remained
at a low level of 5.6% at the end of 2017 despite the
addition of new supply.
> Hangzhou. Market rent remains at a stable level
despite a large wave of new supply in 2H 2017. We
expect very heavy future supply; however, strong
market demand should result in only a moderate
increase in the vacancy rate.
Figure 8: East China Investment Targets
SECTOR CITY RENT GROWTH
2017-22 AVG P.A.
VACANCY END-2017
VACANCY END-2022
EST.
NET INCOME YLD (%)
SPREAD OVER 10 YR BOND
Retail
Shanghai 0.5% 12.6% 13.7% 4.0-5.5% 0.4-1.9pp
Nanjing 0.9% 5.6% 8.3% 5.5-6.5% 1.9-2.9pp
Hangzhou -0.8% 4.0% 7.3% 5.5-6.5% 1.9-2.9pp
B'ness Park Shanghai 4.3% 16.2% 12.9% 4.3% 0.7pp
Industrial/Logistics Shanghai 6.1%* 6.4% 4.5%* 5.0-5.5% 1.4-1.9pp
Office
Shanghai** 0.9% 13.8% 11.0% 3.6% 0.0pp
Nanjing 0.4% 7.9% 23.9% 5.3% 1.6pp
Hangzhou 3.1% 17.7% 16.7% 5.1% 1.5pp
Suzhou 2.6% 24.8% 21.5% 5.5% 1.9pp
Wuhan -0.4% 28.8% 37.2% 5.5% 1.9pp
Rental Apartment*** Shanghai 2.6% 10.0% 15.0% 4.0%*** 0.4pp
Source: Colliers International, Bloomberg for ten-year bond yields
*Shanghai logistics property: rental growth and vacancy rate is forecasted between 2017 and 2020.
** Shanghai office property refers to CBD Grade A office.
***Shanghai rental apartment refers to mid-end long-term rental apartment. Given the limited en-bloc transactions in the emerging sector, net yield
refers to serviced apartment.

12 Looking From Above | 28 June 2018 | Investment Property | Colliers International
Retail
Figure 9: Map of Key Shanghai Retail Locations
Source: Colliers International
Figure 10: Shanghai Mid to High-End Shopping Centre New Supply, Net Absorption and Vacancy Rate
Source: Colliers International
In the retail sector, several en-bloc transactions were
witnessed in East China in 1H 2018. In Shanghai, the
17,415 sq metre (187,385 sq ft) Amanda Plaza was
transacted in Q1 for consideration of RMB595 million
(USD93 million) and the 40,693 sq metres (437,857sq ft)
Shanghai Plaza was transacted in Q2 for consideration
of RMB2.5 billion (USD391 million). In our view, high-
quality retail properties in prime locations with strong
occupancy and stable rental performance should
continue to appeal to both domestic and foreign
investors, although we expect the citywide rent to grow
by only 0.6% on average over the coming five years.
Although assets in prime retail areas are believed to be
competitive, limited availability of tradable assets in the
market hinders transactions.
Nanjing and Hangzhou are stable markets: recent
projects have been launched with high occupancy rates,
and this should support rental growth in existing
properties for investors. Net yields in East China retail
market are 4.0-6.5%, well above the level for Grade A
office properties.
Fig. 11: Shanghai Mid to High-End Shopping Centre Avg Ground Floor Rent and Change YOY
Source: Colliers International
0.0%
5.0%
10.0%
15.0%
20.0%
25.0%
0
200
400
600
800
1,000
1,200
1,400
1,600
2002 2003 2004 2005 2006 2007 2008 2009 2010 2011 2012 2013 2014 2015 2016 2017
‘000 sqm
Thousands
New Supply Net Absorption Vacancy Rate
-15%
-10%
-5%
0%
5%
10%
15%
20%
25%
30%
0
5
10
15
20
25
30
35
40
45
2002 2003 2004 2005 2006 2007 2008 2009 2010 2011 2012 2013 2014 2015 2016 2017
RMB psm per day
Average Rent Growth YOY

13 Looking From Above | 28 June 2018 | Investment Property | Colliers International
Business Park
Source: Colliers International
> Caohejing. Affected by two new completions in 1Q
2018, the vacancy rate increased by 2.5 percentage
points QOQ to 10.7%. Average rent increased by
1.6% QOQ or 3.6% YOY to RMB5.03 (USD0.77)
psm per day.
> Linkong. The vacancy rate decreased by 0.4
percentage points QOQ to 8.3% and average rent
increased by 0.1% QOQ or 2.7% YOY to RMB4.17
(USD0.64) per sq metre per day in 1Q 2018.
> Jinqiao. The vacancy rate reached its lowest point
since 2013 at 16.2% and average rent increased by
0.7% QOQ or 6.8% YOY to RMB3.43 (USD0.53) per
sq metre per day in 1Q 2018.
> Zhangjiang. Absorption of space in high-quality new
buildings completed in 2017 led the vacancy rate to
decrease by 3.0 percentage points to 21.9% in 1Q
2018. Average rent increased by 1.8% QOQ or 0.3%
YOY to RMB4.51 (USD0.69) per sq metre per day.
Figure 13: Shanghai Business Park New Supply, Net Absorption and Vacancy Rate
Source: Colliers International
0%
5%
10%
15%
20%
25%
30%
35%
0
200
400
600
800
1000
1200
2006 2007 2008 2009 2010 2011 2012 2013 2014 2015 2016 2017
'000 sqm
New Supply Net Absorption Vacancy Rate
Figure 12: Map of Key Shanghai Business Park Locations

14 Looking From Above | 28 June 2018 | Investment Property | Colliers International
Figure 14: Shanghai Business Park Average
Rent and Change YOY
Source: Colliers International
Shanghai is striving to turn itself into a leading global
centre for entrepreneurship. In 2017, the added value of
the information transmission, software and information
technology services sector grew by 18.9% to
RMB186.2billion (USD28.7 billion), and over 426 R&D
centres including 20 global R&D centres and 17 Asia
Pacific headquarters of multi-national corporations were
established in Shanghai9. Reflecting the rapid expansion
of the technology sector, the net absorption of business
parks surged by 26.5% YOY or 29.3% QOQ in 1Q 2018,
and the vacancy rate decreased to 15.6% despite three
new completions. The average rent continued to see
upward momentum and achieved RMB4.21 (USD0.65)
per sq metre per day in 1Q 2018.
Shanghai’s business park investment market remained
active in 1Q 2018, with four en bloc transactions totalling
RMB2.60 billion (USD406 million). Jinqiao, Zhangjiang
and Caohejing remained the most favourable
destinations. The sentiment of institutional investors,
including foreign funds, domestic institutions and RMB
funds as well as end-users remained positive. In
January, D&J China purchased the Caohejing SBP
Phase III building, Hitone purchased the Zhangjiang
Gaichen building, and WorldUnion Investment
purchased two buildings at City of Elite in Jinqiao. In
March, the Kailong Info Building was sold to Hony
Capital.
Looking ahead, high-tech companies and R&D centres
will still be important demand generators for Shanghai’s
business park market. The growing number of new
enterprises including both MNCs and domestic
companies should keep taking up high-quality business
park space. Moreover, the increasingly convenient
transport connections and improved infrastructure should
continue to benefit business park properties. As a result,
the prospects for Shanghai’s business park property
9 Source: Shanghai Statistics Bureau 10 Source: Vanke’s monthly briefing
market, which is underpinned by these positive
fundamentals, remain positive over 2019-2022.
Logistics/Workshop
> Shanghai Grade A Logistics Market
As of 2017, the total stock of Shanghai's Grade A
logistics property increased to 5.7 million sq metres
(61.3 million sq ft).
We expect 460,000 sq metres (4.95 million sq ft) of
new supply will be completed in the first half of 2018.
Due to the rectification of illegally constructed
facilities in Shanghai in 2017, many tenants moved
towards high-quality logistics properties, creating
additional demand for logistics properties. Beside
demolition of illegally constructed properties, the
rapid growth in e-commerce and the launch of a
variety of online shopping festivals have increased
demand for logistics properties. As a result, the
vacancy rate remains at a low level of about 7% and
average rent increased by 6.2% HOH to RMB1.38
(USD0.21) per sq metre per day in H2 2017.
We expect the average rent will continue to increase
by 5%-7% p.a. over the next three years and
vacancy rates will remain low.
The investment market has been very active, as
foreign and domestic investors are setting up
investment funds with logistics developer to acquire
valuable assets. Vanke had already purchased
seven logistics properties in Shanghai in the first five
months of 2018 according to the company’s monthly
announcements10. In addition, ESR, one of the
largest logistics property developers in Asian, has
set up a fund to buy USD1.0 billion (RMB6.53 billion)
in logistics projects, in the same week that ESR
received a USD306 million (RMB1.99 billion)
investment from JD.com11. GLP has also set up a
RMB10 billion (USD1.53 billion) PE fund to invest in
logistics-related businesses.12
11 Source: Media source from mingtiandi 12 Source: GLP’s news release dated May 10 2018
-15%
-10%
-5%
0%
5%
10%
15%
20%
25%
0.0
0.5
1.0
1.5
2.0
2.5
3.0
3.5
4.0
4.5
2006 2007 2008 2009 2010 2011 2012 2013 2014 2015 2016 2017
RMB psm per day
Average Rent Growth Rate YOY

15 Looking From Above | 28 June 2018 | Investment Property | Colliers International
Source: Colliers International (Shanghai)
> Shanghai Workshop Property Market
Shanghai's workshop property, also known as
standard manufacturing plant, has been mainly
supplied by state-owned enterprises and private
entrepreneurs. As of 2017, total stock stood at
approximately 7.4 million sq metres (79.6 million sq
ft). We expect 680,000 sq metres (7.32 million sq ft)
of new supply will be completed in 2018.
Demand has come mainly from domestic
companies, as many foreign companies have been
attracted by the incentive policies of cities around
Shanghai. By industry, demand from high-end
machinery and equipment manufacturing and high-
end electronic product manufacturing is strong,
accounting for 24.8% and 22.8% of total net
absorption in 2017, followed by the automotive and
bio-medical industries. Rent increased sharply in
2016 and 2017 as a total of 110 million sq metres
(1.18 billion sq ft) of illegally constructed facilities
had been demolished by the end of 2017.
We expect average rent in 2018-2019 will continue
to increase, but at a lower growth rate than in 2017.
The vacancy rate will increase temporarily in 2018
as most new supply will be completed in second half
and are multi-storey workshops which will need
additional time to be leased out. However, we expect
the vacancy rate will revert to a low level in 2019.
> Land Market
The industrial sector's rental yield is relatively stable,
and this fact, coupled with Shanghai's superior
geographical location and good industrial base, has
pushed industrial developers to be very active in the
acquisition of industrial land in Shanghai. These
dynamics have also attracted private entrepreneurs
who are interested in the potential capital gains in
land acquisitions. Strong demand and low supply
should continually push up the price of industrial
land.
> Shanghai demand overflowing to adjacent cities
Strong demand has quickly absorbed vacancies in
Shanghai’s logistics and workshop properties, and
has spilled over to nearby cities. Cities like Kunshan,
Taicang and Jiaxing have benefited from this effect.
Their leasing market has become very active while
average rents have continued to increase. Notably,
average rent of Jiaxing’s logistics property market
increased by 18% in the second half of 2017,
compared to the first half. Strong demand has spilled
over to more cities. As Colliers has monitored, cities
further away such as Suzhou, Hangzhou, Nanjing,
Nantong, Changshu, and Wuxi have all seen
occupancy pick up and increasing rents.
Figure 15: Map of Key Logistics Locations around Shanghai

16 Looking From Above | 28 June 2018 | Investment Property | Colliers International
Office
Fig. 16: Map of Shanghai Office Key Locations
Source: Colliers International
We expect Shanghai’s Grade A office supply will remain
heavy in 2019 before easing in 2020 in CBD areas;
meanwhile emerging clusters should receive a large
number of new completions by end of 2018. Since
Colliers expects that demand from the financial, TMT
and flexible workspace sectors will remain generally firm
over the next three to five years, we predict modest
average rental growth and a slight drop in the average
vacancy rate for Shanghai’s CBDs over 2018 and 2019.
From 2020-22, we expect rents will rise at a slightly
faster pace over as supply eases. In the DBDs, rent
should be flat during 2018-2019 because of the influx of
new completions, but healthy demand should lead to a
gradual rental increase after 2019.
During Q1 2018, the Shanghai government imposed a
strict control of M&A loans to the real estate industry,
while at the same time the upgrading of industrial profile
continues to be a major focus of Shanghai government.
Therefore, the office sector (including business parks),
which generates predictable income, has standard asset
management requirements, and is a major driver of
industrial development, continues to be the most active
investment sector in the Shanghai market.
Compared to Shanghai, opportunities for en-bloc
investment have been limited in Tier 2 cities as most
landlords have held dual-lease and strata-title sale
strategies. Institutional investors have remained cautious
towards these markets, given the high vacancy rate,
amount of new supply in the pipeline and uncertainty of
disposal due to lower liquidity. However, as more wholly
owned projects with high-quality building standards have
been completed in recent years, more investors have
started to seek investment opportunities in these cities.
> Shanghai Pudong. The vacancy rate of Pudong’s
CBD area should fall in the next five years while
demand should remain strong and supply will be
limited, pushing rents upwards. This strong demand

17 Looking From Above | 28 June 2018 | Investment Property | Colliers International
in the CBD ought to push cost-conscious tenants to
the emerging DBDs where large quantities of new
supply are in the pipeline.
> Shanghai Puxi. In contrast, the competition from
both the CBD and DBD areas should lead to flat
rental rates in Puxi in the upcoming five years.
> Hangzhou. Both the leasing and investment markets
have been active with increasing rent and the
disclosure of several en-bloc transactions in 2017.
We expect rent will increase and the vacancy rate
will decrease over the next five years.
> Nanjing. In H2 2017, rent remained stable and the
vacancy rate remained low. The majority of city’s en-
bloc sales were in the Hexi submarket and mainly for
owner-occupiers. A large quantity of supply will
arrive in 2019–2021, but with this supply
concentrated in emerging submarkets, it should not
impact rents in the core.
> Suzhou. Vacancy remains at a high level, and more
supply will be completed in 2018. This may give
investors negotiation power in purchasing assets.
> Wuhan. Heavy supply in next five years should keep
the overall vacancy at a high level, putting pressure
on rental growth.
Figure 17: Shanghai CBD Grade A office new supply, net absorption and vacancy rate (2008-2017)
Source: Colliers International
Figure 18: Shanghai CBD Grade A office average rent and growth Rate (2008 – 2017)
Source: Colliers International
Grade A office property in Shanghai remains China's
largest investment property category by far. However,
the net yield range of 3.5%-4.0% is almost the same as
for ten-year government bonds, meaning that investors
should be highly confident about capital growth when
justify purchases. On the other hand, the control of new
buildable land and the encouragement of regeneration of
existing stock have been the main targets of Shanghai’s
development plan. We therefore expect investors to
continue focusing on value-add projects, especially
opportunities with a large rental reversion upside.
Major Deals to Highlight in Q1 2018:
> Shanghai International Plaza was acquired by
LaSalle Investment Management for USD359 million
(RMB2.34 billion) from Alpha. The project is an office
project with a GFA of 54,037 sq metres (581,438 sq
ft) in Hongkou District.
> Hony acquired KIC, an office project in Wujiaochang,
from Real Power. The project’s total GFA is 28,000
sq metres (301,280 sq ft).
> ZRiver Capital’s ZRT Tower was sold to Five Bulls
for USD225 million (RMB1.47 billion). The office
project has a GFA of 40,736 sq metres (438,319 sq
ft) and is in a DBD of Shanghai’s New Jingan
(Zhabei) District.
0%
3%
6%
9%
12%
15%
18%
0
200
400
600
800
1,000
1,200
2008 2009 2010 2011 2012 2013 2014 2015 2016 2017
'000 sqm
New Supply Net Absorption Vacancy Rate
-30%
-20%
-10%
0%
10%
20%
30%
0.0
2.0
4.0
6.0
8.0
10.0
12.0
2008 2009 2010 2011 2012 2013 2014 2015 2016 2017
RMB psm per day
Average Rent Growth YOY

18 Looking From Above | 28 June 2018 | Investment Property | Colliers International
Rental Apartment
Fig. 19: Map of Key Shanghai Project Locations
*Rental housing focuses on mid-end projects
Source: Colliers International
There are five types of long-term rental housing
operators in Shanghai:
> Government platform, i.e. state-owned developers.
They develop or redevelop their own properties,
lease land to develop or acquire existing assets to
operate long-term lease apartments. The Wonder
brand is expected to be the first product line led by
Shanghai Land Group.
> Standard developers. They develop their own
properties (developers are typically required to retain
15% residential space for self-holding as stipulated
in most of Shanghai’s new residential land supply),
acquire existing properties or rent en-bloc properties.
Typical examples of this category are Port
Apartment (Vanke), Guanyu (Longfor), Youmi
International Community (CIFI), Big+ (Country
Garden).
> Agencies. These rent en-bloc and/or strata-titled
properties, acquire existing properties or operate
through managerial expertise. Typical examples are
World Union’s Home Plus, Lianjia’s Ziroom.
> Hotel management companies. These rent en-bloc
properties and provide light asset management.
> Typical examples are Home Inns’ Comma, Plateno’s
Wowqu.
> Start-up companies. These rent en-bloc properties or
acquire properties (through equity or asset
acquisitions) with support from financial institutions.
Typical examples include YOU+, Harbour Home.
According to Colliers’ research, around 80% of the
existing long-term rental apartments are in the city
centre, are close to the Inner or Middle Ring Road, and
are near metro line stations. In addition, many projects
are close to high-tech parks, innovation and incubation
centres, universities. Developer-led long-term rental
apartments have become a major source of new supply
in recent years.
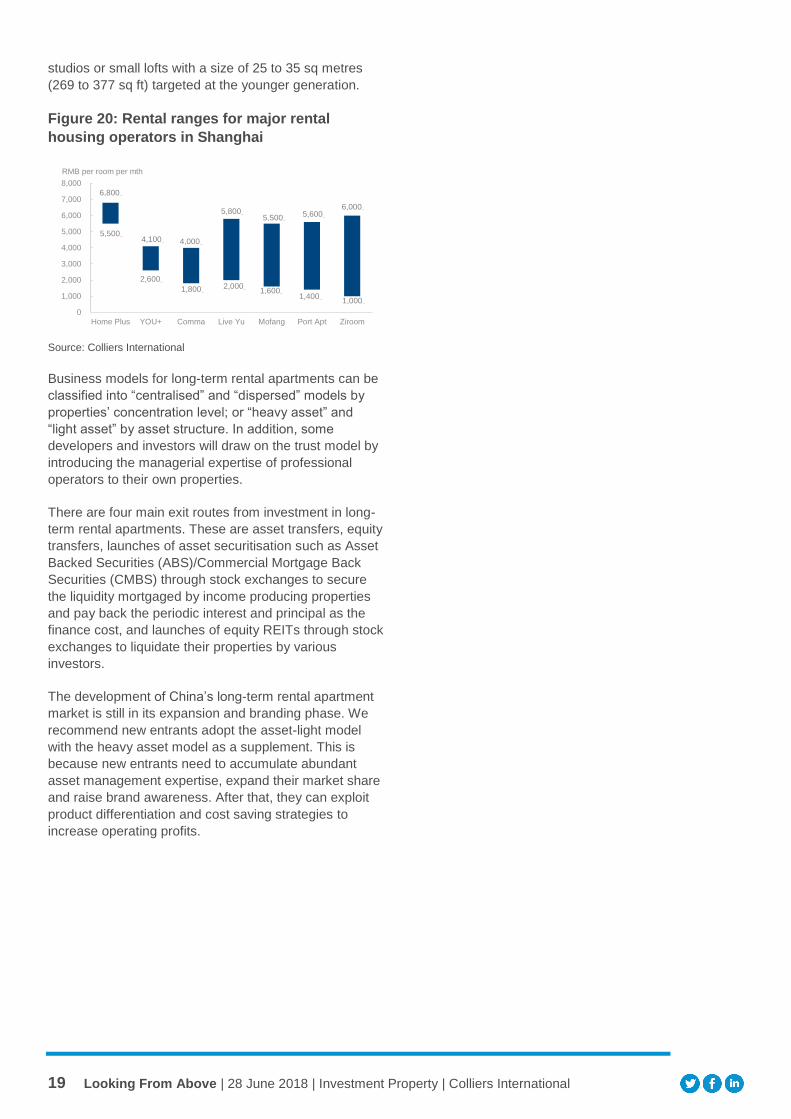
The typical rental rate ranges from RMB3,600 to
RMB6,800 per month (USD551 to USD1,041 per month)
with an additional service charge (mainly Internet fees)
of RMB280 to RMBB300 per month (USD42.9 to
USD45.9 per month) and the average occupancy rate
remains at 85% to 95%. The dominant room plans are
19 Looking From Above | 28 June 2018 | Investment Property | Colliers International
studios or small lofts with a size of 25 to 35 sq metres
(269 to 377 sq ft) targeted at the younger generation.
Figure 20: Rental ranges for major rental
housing operators in Shanghai
Source: Colliers International
Business models for long-term rental apartments can be
classified into “centralised” and “dispersed” models by
properties’ concentration level; or “heavy asset” and
“light asset” by asset structure. In addition, some
developers and investors will draw on the trust model by
introducing the managerial expertise of professional
operators to their own properties.
There are four main exit routes from investment in long-
term rental apartments. These are asset transfers, equity
transfers, launches of asset securitisation such as Asset
Backed Securities (ABS)/Commercial Mortgage Back
Securities (CMBS) through stock exchanges to secure
the liquidity mortgaged by income producing properties
and pay back the periodic interest and principal as the
finance cost, and launches of equity REITs through stock
exchanges to liquidate their properties by various
investors.
The development of China’s long-term rental apartment
market is still in its expansion and branding phase. We
recommend new entrants adopt the asset-light model
with the heavy asset model as a supplement. This is
because new entrants need to accumulate abundant
asset management expertise, expand their market share
and raise brand awareness. After that, they can exploit
product differentiation and cost saving strategies to
increase operating profits.
0
1,000
2,000
3,000
4,000
5,000
6,000
7,000
8,000
Home Plus YOU+ Comma Live Yu Mofang Port Apt Ziroom
RMB per room per mth
5,500
6,800
2,600
4,100
1,800
4,000
2,000
5,800
1,600
5,500
1,400
5,600
1,000
6,000

20 Looking From Above | 28 June 2018 | Investment Property | Colliers International
North China
Summary of opportunities
With solid economic fundamentals supporting demand,
and straightforward operation, office property continues
to be the most attractive sector in the major cities of
North China, including Beijing and Tianjin. This is despite
the fact that the net yield is among the lowest among all
the sectors. A shortage of tradable office assets in
Beijing, especially in the core areas, has pushed the
business park segment to become the chief alternative,
where yields are higher than office properties. Trends in
logistics remain very positive but properties are in short
supply in Beijing. As a result, we expect more en-bloc
transactions to happen in the surrounding cities, such as
Langfang and Tianjin. Investors should also pay more
attention to logistics opportunities in Shenyang, the hub
city of Northeast China. We also foresee investment
opportunities in retail property, considering the higher
yield, and the opportunity to refurbish many
underperforming assets, at the same time as developers
are diversifying their businesses. In addition, flexible
workspaces and the rental housing market have become
popular targets for investors in recent years in Beijing.
Retail
In Beijing, underperforming projects with upside
potential in both prime and emerging submarkets have
attracted investors’ interest. However, local government
restrictions against changing land usage in central areas
mean that investors cannot convert a retail property to
other functions if the project is in the core area.
The retail sector was the most active in Beijing in 2017
as nine deals were announced with a total GFA of
534,920 sq metres (5.8 million sq ft), the largest
proportion by area among all sectors. However, most of
the transacted retail properties had average to mediocre
performance and certain buyers seem to be trying to
convert them into offices or other more profitable uses.
Considering the Beijing local government’s March 2018
guidelines forbid changes to land usage, we expect that
investment in underperforming retail properties with the
intention of converting to office use will decline.
Figure 21: North China Investment Targets
SECTOR RENT GROWTH
2017-22 AVG P.A. VACANCY END-
2017 VACANCY END-
2022 EST. NET INCOME
YLD (%) SPREAD OVER
10 YR BOND
Retail Beijing: -0.2% 3.1% 3.5% 5.0% 1.4pp
B'ness Park 2.0-3.0% n/a n/a 4.2-4.8% 0.6-1.2pp
Industrial/ Logistics
Beijing: 5.2%
Tianjin: 4.4%
0%
2.8%
0%
0.4%
5.0-5.5%
5.5-6.0%
1.4-1.9pp
1.9-2.4pp
Office Beijing: -0.1%
Tianjin: -0.6%
Shenyang: -1.4%
8.3%
33.6%
35.1%
15.5%
34.4%
43.5%
4.0%
4.5%
5.3%
0.4pp
0.9pp
1.7pp
Colliers International

21 Looking From Above | 28 June 2018 | Investment Property | Colliers International
Figure 22: Beijing Retail Submarkets
Source: Colliers International
We expect the average ground floor rent in the Beijing
prime retail market to be largely flat over the next five
years. Due to continued strong demand, we project the
vacancy rate to maintain its low level, at no more than
3.5%, although we expect more than 1.5 million sq
metres (16.1 million sq ft) of new supply to enter the
market during the same period. In addition, net yields for
Beijing retail properties are around 5.0%, much higher
than the level for Grade A office properties, which may
be considered as a key attraction for investors.
Figure 23: Beijing: Prime Shopping Mall Net Absorption, New Supply and Vacancy Rate
Source: Colliers International
As a result, we still expect some retail operators to buy
certain underperforming projects with the intention of
upgrading them, notably in central areas of Beijing or in
certain Tier 2 cities. For example, SCPG Holdings has
teamed up with China Vanke Co., Ltd. and Triwater
Asset Management Holdings Limited, reaching an
agreement with CapitaLand Mall Asia Limited to jointly
acquire 100% of the equity and debt of the operating
-1%
0%
1%
2%
3%
4%
5%
6%
7%
8%
-50,000
0
50,000
100,000
150,000
200,000
250,000
300,000
350,000
400,000
1Q
15
2Q
15
3Q
15
4Q
15
1Q
16
2Q
16
3Q
16
4Q
16
1Q
17
2Q
17
3Q
17
4Q
17
1Q
18
sqm | 平方米
New Supply | 新增供应 Net Absorption | 净吸纳量
Vacancy Rate | 空置率

22 Looking From Above | 28 June 2018 | Investment Property | Colliers International
entities of 20 shopping malls across China in 1Q 2018
for a price of RMB8.37 billion (USD1.33 billion). 13
Business Park
Fig. 24: Map of Key Beijing Business Park Locations
Source: Colliers International
The following four areas are the most active business
park investment areas in Beijing (as indicated in Figure
23).
> Shangdi Information Industry Base is considered by
many to be China’s Silicon Valley. Several en-bloc
transaction sales have been recorded in this area in
recent years, such as Diamond Building, Digital
Media Buildings, Z-Link, and Silicon Valley Tower 4.
Strong demand has maintained the vacancy rate at
below 5% in recent years and rents have continued
to increase to nearly RMB180 (USD27.5) per sq
metre per month by end-2017.
Note. Traditionally, Beijing’s Zhongguancun area has
been considered as China's Silicon Valley. However, in
recent years more and more hi-tech companies,
especially domestic hi-tech groups, have concentrated in
Shangdi (outside North 5th Ring Road) instead of the
core area of Zhongguancun (North 4th Ring Road). Most
famous companies including Sina, Baidu, Xiaomi,
Netease and Didi are now located in Shangdi. Today we
would argue that Zhongguancun is more like a concept
than an actual location because many business parks in
Beijing are named “Zhongguancun xxx Science Park”.
There is, of course, also a large concentration of
13 Source: CapitaLand announcement:
http://infopub.sgx.com/FileOpen/Announcement.050118.ashx?App=Announcement&FileID=484296
technology companies in South China, around Shenzhen
and in the broader Greater Bay Area.
> Beijing Electronic Zone (BEZ). Many international
manufacturing companies, such as Ericsson,
Schneider, ABB, and Siemens have traditionally
concentrated in this area. More and more hi-tech
companies, especially internet companies have
overflowed into BEZ and the surrounding Wangjing
office submarket in the past three years due to
limited new supply in the core area of
Zhongguancun. Two en-bloc deals closed in 2017.
Both properties were purchased by end-users.
> Fengtai The Fengtai Science Park is dominated by
domestic companies with key tenant industries
including rail transit, aerospace, military, emergency
aid and conservation, and environmental protection.
Both investors and end-users are interested in this
area with several en-bloc sales closed in the area in
recent years.
> Beijing Economic-Technological Development
Area (BDA) is the only national-level economic
development area in Beijing, with manufacturing
traditionally dominating this market. The tenant mix
has been changing, however, with an increasing
number of service sector tenants relocating here.
The most famous end-users include JD.com. One
en-bloc transaction announced in 1Q 2018 was the
Nan Hai Land Limited purchase of the Sino-i
Campus from Sino-i Technology Limited for RMB416
million (USD66.2 million).
Beijing’s business park market has become attractive to
investors in recent years due to low capital values
compared to office assets, relatively slow price
appreciation, and strong demand, especially compared
with office properties in core areas. Despite the decline
in yields over the past year as more investors have
started to focus on this sector, the yield ranges from 4.2-
4.8% in 1H 2018, which is still higher than the office
sector.
According to the Beijing City Master Plan (2016-2035)
released in 2H 2017, Beijing is positioning itself as a
national centre of politics, culture, international
commutations and technological innovation, which
should support the steady growth of these and related
industries. The media and technology industries are
typical tenants of business park properties. As a result,
we expect these positive market fundamentals to support
the occupancy rate and rents of the business park
23 Looking From Above | 28 June 2018 | Investment Property | Colliers International
market. In turn, these strong prospects should
encourage more investors to focus on this sector.
Logistics
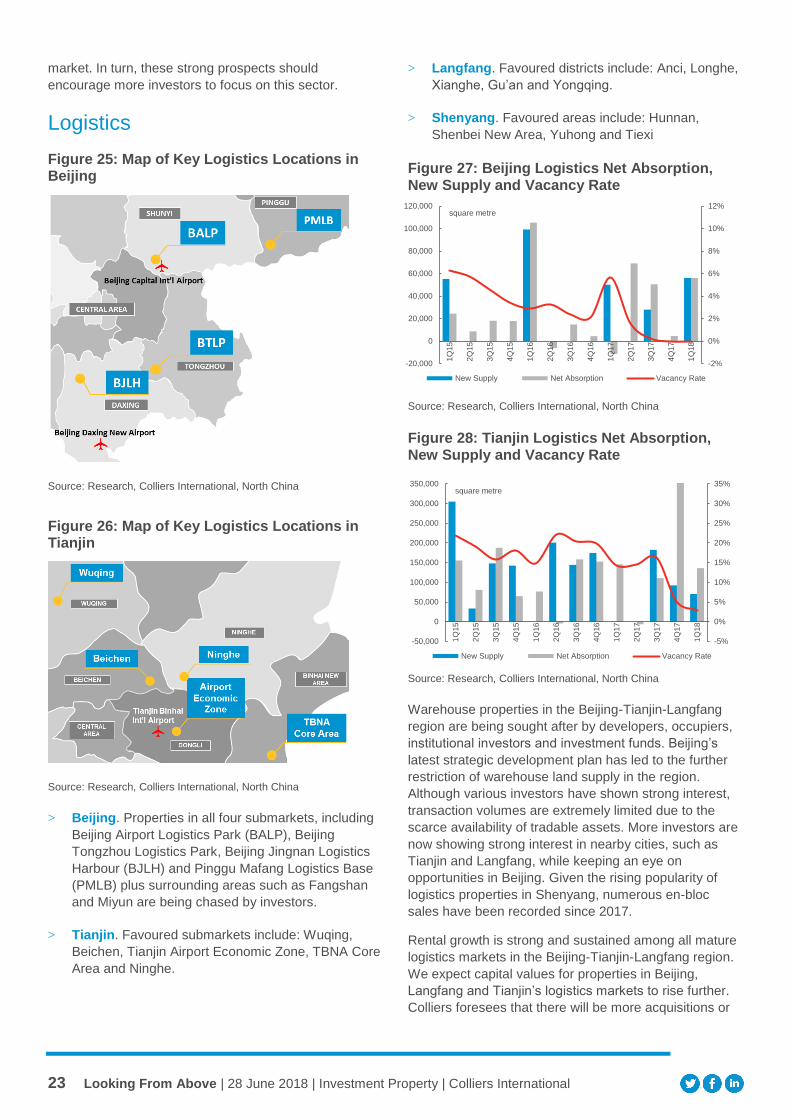
Figure 25: Map of Key Logistics Locations in Beijing
Source: Research, Colliers International, North China
Figure 26: Map of Key Logistics Locations in Tianjin
Source: Research, Colliers International, North China
> Beijing. Properties in all four submarkets, including
Beijing Airport Logistics Park (BALP), Beijing
Tongzhou Logistics Park, Beijing Jingnan Logistics
Harbour (BJLH) and Pinggu Mafang Logistics Base
(PMLB) plus surrounding areas such as Fangshan
and Miyun are being chased by investors.
> Tianjin. Favoured submarkets include: Wuqing,
Beichen, Tianjin Airport Economic Zone, TBNA Core
Area and Ninghe.
> Langfang. Favoured districts include: Anci, Longhe,
Xianghe, Gu’an and Yongqing.
> Shenyang. Favoured areas include: Hunnan,
Shenbei New Area, Yuhong and Tiexi
Figure 27: Beijing Logistics Net Absorption, New Supply and Vacancy Rate
Source: Research, Colliers International, North China
Figure 28: Tianjin Logistics Net Absorption, New Supply and Vacancy Rate
Source: Research, Colliers International, North China
Warehouse properties in the Beijing-Tianjin-Langfang
region are being sought after by developers, occupiers,
institutional investors and investment funds. Beijing’s
latest strategic development plan has led to the further
restriction of warehouse land supply in the region.
Although various investors have shown strong interest,
transaction volumes are extremely limited due to the
scarce availability of tradable assets. More investors are
now showing strong interest in nearby cities, such as
Tianjin and Langfang, while keeping an eye on
opportunities in Beijing. Given the rising popularity of
logistics properties in Shenyang, numerous en-bloc
sales have been recorded since 2017.
Rental growth is strong and sustained among all mature
logistics markets in the Beijing-Tianjin-Langfang region.
We expect capital values for properties in Beijing,
Langfang and Tianjin’s logistics markets to rise further.
Colliers foresees that there will be more acquisitions or
-2%
0%
2%
4%
6%
8%
10%
12%
-20,000
0
20,000
40,000
60,000
80,000
100,000
120,000
1Q
15
2Q
15
3Q
15
4Q
15
1Q
16
2Q
16
3Q
16
4Q
16
1Q
17
2Q
17
3Q
17
4Q
17
1Q
18
square metre
New Supply Net Absorption Vacancy Rate
-5%
0%
5%
10%
15%
20%
25%
30%
35%
-50,000
0
50,000
100,000
150,000
200,000
250,000
300,000
350,000
1Q
15
2Q
15
3Q
15
4Q
15
1Q
16
2Q
16
3Q
16
4Q
16
1Q
17
2Q
17
3Q
17
4Q
17
1Q
18
square metre
New Supply Net Absorption Vacancy Rate

24 Looking From Above | 28 June 2018 | Investment Property | Colliers International
equity transactions of old industrial properties in the
Beijing-Tianjin-Langfang area as the availability of
tradable projects is limited as is prime land for logistics
development. As for Shenyang, we expect that investors
and developers will accelerate plans to acquire local,
high-quality warehouses built by local landlords.
Office
Figure 29: Map of Favoured Non-Core Beijing Office Locations
Source: Colliers International
> Beijing. Favoured non-core areas include
Tongzhou, Lize, Fengtai and Wangjing. Favoured
projects offer relatively convenient transportation and
value-added potential. Beijing will continue to
develop its decentralised areas to relocate more
enterprises and population, further driving growth.
> Tianjin. Favoured central district: Heping District.
Favoured projects ought to provide better facilities
and command acceptable total prices. However,
institutional investors have displayed caution in the
Tianjin office investment market, where en-bloc
sales are dominated by powerful owner occupiers.
As an example of a recent transaction, China Life
purchased 72,900 sq metres (784,689 sq ft) office
space for total consideration of RMB1.91 billion
(USD304 million) in Heping District in 1Q 2018.
China Life plans to keep part of the office space for
its own use and to lease the remaining space.
Figure 30: Beijing Grade A Office Net Absorption, New Supply and Vacancy Rate
Source: Colliers International
Figure 31: Tianjin Prime Office Net Absorption, New Supply and Vacancy Rate
Note: “Prime” refers to Grade A and B. Source: Colliers International
In Beijing's office investment market, both end-users and
investors have continued to seek appropriate
opportunities given the firm economic growth. Office
properties have been one of the most attractive sectors
considering the healthy demand from the service sector
and their straightforward operation. In contrast to Beijing,
institutional investors have been more cautious in Tier 2
cities in North China such as Tianjin and Shenyang due
to the relatively high vacancy rate, constrained rental
growth and investment returns.
Looking forward, we still regard office properties as the
most stable sector for investors given firm demand.
However, high capital values are the key obstacle for
investors in Beijing. In view of the development of
transportation, infrastructure and amenities in
decentralised areas in Beijing, more enterprises and
employees should relocate to these areas. As a result,
we suggest both local and foreign investors seek value-
added opportunities in these decentralised areas.
0%
3%
6%
9%
12%
15%
18%
21%
24%
27%
0
100,000
200,000
300,000
400,000
500,000
600,000
700,000
800,000
900,000
2007 2008 2009 2010 2011 2012 2013 2014 2015 2016 2017 2018
Q1
Sq m
New Supply Net Absorption Vacancy Rate
-10%
0%
10%
20%
30%
40%
50%
-50,000
0
50,000
100,000
150,000
200,000
250,000
2H12 1H13 2H13 1H14 2H14 1H15 2H15 1H16 2H16 1H17 2H17
Sq m
New Supply Net Absorption Vacancy Rate

25 Looking From Above | 28 June 2018 | Investment Property | Colliers International
South China
Summary of opportunities South China’s commercial real estate market is led by
Guangzhou and Shenzhen, the two largest cities.
Although the region has recorded China’s fastest
economic growth, the investment market has been
dominated by domestic investors. However, looking
forward, we expect the region to attract more
international investor attention due to further regional
integration under the Greater Bay Area plan. Although
the office sector remains the most popular sector, there
is arguably greater investment potential in business
parks (especially in Guangzhou) for investors interested
in long-term return. There is limited opportunity in
logistics in Shenzhen and Guangzhou due to lack of new
supply. Instead, investors should look for opportunities in
nearby cities, such as Dongguan, Huizhou and
Zhongshan. With new retail supply concentrated in
decentralised areas, it will take some time for the
surrounding areas to become more mature to generate
greater value for investors.
Shenzhen Across different real estate sectors, we see the office
sector as having the greatest potential with an average
rental growth rate of 5% for the next five years driven by
strong economic growth. We expect the capital
appreciation to be 8-10% in 2018 after steady increases
over the last decade. Business parks, many of which
were redeveloped from old industrial zones, will be an
emerging sector for investment. However, due to
planning requirements and policy restrictions, this sector
is still dominated by local developers, creating an
obstacle for investors. Investment opportunities in the
logistics sector are limited by lack of new supply. More
logistics facilities have been built in the neighbouring
cities of Dongguan and Huizhou. New supply of 2.3
million sq metres (24.7 million sq feet) of retail space in
emerging areas will amount to about 60% of existing
retail stock in Shenzhen. This major new supply should
put pressure on rent over the next three years. However,
strong population growth and the emergence of new
residential communities in those areas should make
retail investment attractive for the long term.
Guangzhou Driven by the government's ambition to further develop
the innovation and technology industries, we expect that
companies in these sectors will either purchase or lease
space in business parks for their operations, making this
segment a new focus in the real estate market. Business
parks enjoy a net yield of 5.5-6.0%, and Intelligence City
Figure 32: South China Investment Targets
SECTOR RENT GROWTH
2017-22 AVG P.A.
VACANCY END-2017
VACANCY END-2022 EST.
NET INCOME YLD (%)
SPREAD OVER 10 YR BOND
Retail
Shenzhen 0.0% 4.6% 12.9% 5.2% 1.6pp
Guangzhou 3.5% 7.5% 6.2% 5.0% 1.4pp
B'ness Park
Shenzhen 5.0% n/a n/a 4.5-5.0% 0.9-1.4pp
Guangzhou 5.0% n/a n/a 5.5-6.0% 1.9-2.4pp
Industrial/ Logistics
Shenzhen 8.0% 10.2% 4.3% 6.7% 3.1pp
Guangzhou 5.3% 6.4% 4.0% 6.0% 2.4pp
Office
Shenzhen 5.0% 13.5% 15.6% 3.9% 0.3pp
Guangzhou 5.1% 8.3% 8.5% 4.0% 0.4pp
Source: Colliers International
26 Looking From Above | 28 June 2018 | Investment Property | Colliers International
in Tianhe District and Sino-Singapore Guanghzou
Knowledge City in Huangpu District should remain the
hotspots in the coming years. As in Shenzhen,
investment opportunities in Guangzhou’s logistics sector
have been limited by lack of new supply, with Huadu and
Nansha accounting for the bulk of expected future new
supply. We expect the office sector in Guangzhou to
grow steadily with Pazhou gradually developing into a
new CBD with the new office development. Net yield for
Grade A office property in Guangzhou currently stands
at 4.0%. Investors interested in retail properties will find
plenty of new opportunities in the emerging districts, with
a total of 886,000 sq metres (9.5 million sq ft) –
equivalent to nearly 30% of existing retail stock in the
city – of new property due to be launched in 2018.
However, property values may well stay flat until the
surrounding areas have becomes more mature.
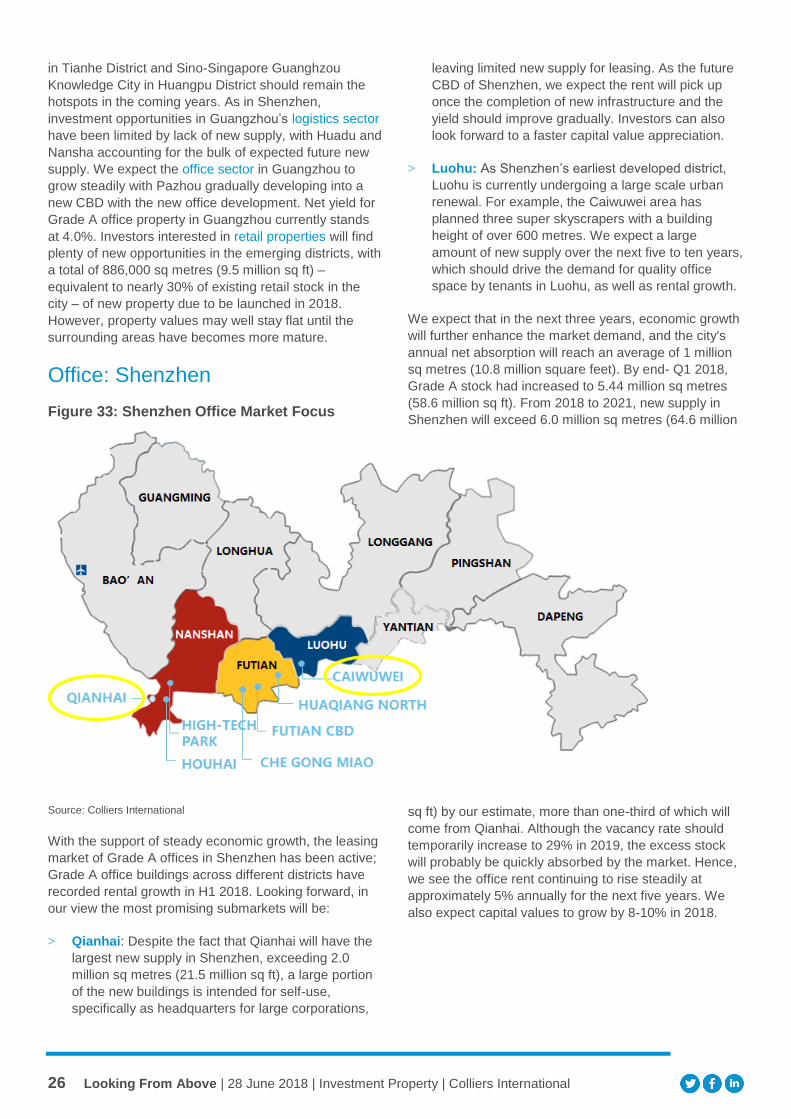
Office: Shenzhen
Figure 33: Shenzhen Office Market Focus
Source: Colliers International
With the support of steady economic growth, the leasing
market of Grade A offices in Shenzhen has been active;
Grade A office buildings across different districts have
recorded rental growth in H1 2018. Looking forward, in
our view the most promising submarkets will be:
> Qianhai: Despite the fact that Qianhai will have the
largest new supply in Shenzhen, exceeding 2.0
million sq metres (21.5 million sq ft), a large portion
of the new buildings is intended for self-use,
specifically as headquarters for large corporations,
leaving limited new supply for leasing. As the future
CBD of Shenzhen, we expect the rent will pick up
once the completion of new infrastructure and the
yield should improve gradually. Investors can also
look forward to a faster capital value appreciation.
> Luohu: As Shenzhen’s earliest developed district,
Luohu is currently undergoing a large scale urban
renewal. For example, the Caiwuwei area has
planned three super skyscrapers with a building
height of over 600 metres. We expect a large
amount of new supply over the next five to ten years,
which should drive the demand for quality office
space by tenants in Luohu, as well as rental growth.
We expect that in the next three years, economic growth
will further enhance the market demand, and the city's
annual net absorption will reach an average of 1 million
sq metres (10.8 million square feet). By end- Q1 2018,
Grade A stock had increased to 5.44 million sq metres
(58.6 million sq ft). From 2018 to 2021, new supply in
Shenzhen will exceed 6.0 million sq metres (64.6 million
sq ft) by our estimate, more than one-third of which will
come from Qianhai. Although the vacancy rate should
temporarily increase to 29% in 2019, the excess stock
will probably be quickly absorbed by the market. Hence,
we see the office rent continuing to rise steadily at
approximately 5% annually for the next five years. We
also expect capital values to grow by 8-10% in 2018.

27 Looking From Above | 28 June 2018 | Investment Property | Colliers International
Figure 34: Shenzhen Office Net Absorption, New Supply and Vacancy Rate
Source: Colliers International
Office: Guangzhou
Underpinned by firm economic growth and dynamic
demand for space, Guangzhou’s Grade A office rent
grew by 10.0% YOY while the vacancy rate dropped by
9.5 percentage points YOY in Q1 2018.
Figure 35: Guangzhou Office Property
Submarket Map
Source: Colliers International
> Pazhou. As the designated emerging business
centre of Guangzhou, the government aims to build
Pazhou into an e-commerce cluster and to attract
technology companies. Pazhou should account for
more than half of the new supply of Guangzhou for
the next five years. Large IT groups like Tencent,
Alibaba and Vipshop have already committed to
building new headquarters at Pazhou. This should
lead to more I&T companies and talent moving into
the area.
We foresee steady rent growth and a low vacancy rate
for the rest of 2018. Looking forward to 2019-2021, the
addition of new supply equivalent to 51% of existing
office stock should prompt vacancy to rise sharply and to
peak in 2020. However, a high proportion of the new
supply will be for self-use and will not disrupt the market.
We believe office rent will increase modestly between
2019 and 2021 owing to a healthy economic growth and
continuous demand for new office space. Net yield in the
Guangzhou Grade A office market stands at 4.0%.
Figure 36: Guangzhou Net Absorption, New Supply and Vacancy Rate
Source: Colliers International
Logistics
As the provincial government has tightened new supply
for industrial lands, secondary sites and logistics
properties have become popular. Despite an average
yield of 6.0-6.7%, investment opportunities for logistics
property have been limited due to a lack of new supply.
Figure 37: Outflow Trend of South China Logistics Sector
Source: Colliers International

28 Looking From Above | 28 June 2018 | Investment Property | Colliers International
Shenzhen demand overflowing to surrounding cities
such Dongguan and Huizhou
The demand driven by e-commerce and retail has been
growing steadily in Shenzhen. In Q1 2018, there was no
new supply and the vacancy rate of high-quality
warehouses was down by 0.4% YOY to 7.3%. The rent
increased by 2.8% YOY.
Firm demand from Shenzhen should drive the rent up
further in the surrounding cities: Dongguan and Huizhou.
Currently, the rental level in Dongguan and Huizhou is
still 27-35% below the level of Shenzhen. By end-2017,
the average rent for Shenzhen had reached RMB45
RMB per sq metre per month (USD0.7 per sq ft per
month), while rents in Dongguan and Huizhou were only
RMB33 per sq metre per month (USD0.5 per sq ft per
month) and RMB29 per sq metre per month (USD0.4 per
sq ft per month) respectively.
Over the next five years, we predict 8% average annual
growth in rent in Shenzhen logistics properties. The
strong outlook for rental growth should push up the
prices of logistics properties in Shenzhen, with prices
growing faster than rents. However, due to limited
supply, finding quality projects could be challenging.
The focus of new supply is gradually shifting from
Guangzhou to Foshan
Given growing demand from e-commerce and 3PL, the
average rent of Guangzhou prime logistics warehouses
increased by 3.2% YOY in Q1 2018, reaching RMB33
per sq metre per month (USD0.5 per sq ft per month).
The net yield of logistics property reached 6.0% by Q1
2018.
Continuous expansion of Guangzhou Baiyun
International Airport and Nasha Port has stimulated
demand for cross-border e-commerce. More prime
logistics warehouses will enter the market in Huadu and
Nansha District, the location of the airport and port, over
the next three years.
New supply in nearby cities with lower cost, such as
Foshan, Qingyuan and Dongguan, has absorbed the
overflowing demand from Guangzhou. Average rent in
Foshan reached RMB30 per sq metre per month
(USD0.44 per sq ft per month) by Q1 2018. Further,
more than 630,000 sq metres of new supply will be
launched in Foshan in 2018.
Figure 39: Map of Key Logistics Locations in Guangzhou
Source: Colliers International
Figure 38: South China Logistics Market Overview
Source: Colliers International

29 Looking From Above | 28 June 2018 | Investment Property | Colliers International
Figure 40: Map of Key Logistics Locations in Foshan
Source: Colliers International
New Infrastructure to drive regional logistics market
We expect the regional logistics market will be further
integrated after the completion of key projects such as
the Shenzhen-Zhongshan Corridor, the Hong Kong-
Zhuhai–Macao bridge, and the second Humen Bridge.
More and more emerging areas will become good
locations for logistics development.
Looking forward, the demand should continue to grow,
and the new supply in emerging areas may drive the
vacancy rate up temporarily; however, in the long run,
the vacancy rate should remain low. We expect the
rental level to increase steadily while capital values may
spike in the short term due to a supply shortage of
quality warehouses.
Business Park: Shenzhen
Currently, there are more than 200 business parks in
Shenzhen and they come with various development
formations, from a decentralised industrial campus to
Grade A office buildings. The boundary between a
business park and a business office building has
become less distinguishable. At present, a business
park generally refers to properties that are: 1) built within
an industrial zone; 2) used as offices or for R&D
activities.
Over time, business park developments have been
following Shenzhen’s industrial development policy.
Individual parks have to target different industrial sectors
and, as a result, have become an aggregation of tenants
sharing a similar industry background, such as new
technology and emerging industries.
Figure 41: Tenant Mix in Key Shenzhen
Business Parks
Source: Colliers International
Over the next five years, we expect urban renewal to
convert 100 industrial areas and release 6.75 million sq
metres (72.6 million sq feet) of new land for emerging
industries in the form of business parks. We believe Che
Gong Miao is one of the most promising submarkets:
> Che Gong Miao, next to Futian CBD, has already
achieved a comparable rent to nearby Grade A
office. Over the next five years, more than 3.0 million
sq metres (32.3 million sq ft) of top quality new office
space should enter the market at different business
parks, focusing on financial, fintech, and business
services tenants.
However, government restrictions on business park
investments, including the requirement that buyers and
tenants must belong to designated industries, strict
regulations on future transactions, and limitations on
future property upgrading opportunities, have stopped
potential investors from entering this market in scale.

30 Looking From Above | 28 June 2018 | Investment Property | Colliers International
Figure 42: Business Park Distribution in
Shenzhen
Source: Colliers International
Business Park: Guangzhou
According to the latest Masterplan, the Guangzhou
government wants to develop an Innovation and
Technology based economy over the next two decades.
More specifically, the government is guiding companies
of the IAB industries (Information Technology, Artificial
Intelligence and Biological Medicine) to settle in
designated business parks.
Figure 43: Business Park Distribution in
Guangzhou
Source: Colliers International
The most promising clusters for such development are:
> More mature markets: Science City and Panyu.
Accounting for 65% of existing stock of business
parks in Guangzhou, Guangzhou Science City in
Huangpu District and Panyu district have matured
into clusters of innovation and technology industries
such as IT, biological technology, new material and
new energy.
> Emerging markets: Knowledge City and
Intelligence City. Focusing on innovation and
technology industries as well, Intelligence City in
Tianhe District and Sino-Singapore Guangzhou
Knowledge City in Huangpu District should be
emerging clusters of business parks for the next five
years.
Business parks have been proven to be popular among
domestic and international companies for use as
regional headquarters and R&D centres. For example,
Netease Games is currently building its headquarters at
Intelligence City and P&G is also committed to
establishing a new China Digital Innovation Centre in the
area. Benefiting from the city government’s preferential
policies, rent for business parks can be as low as
RMB58.6 per sq metre per month (USD0.9 per sq ft per
month).
The existing stock of business parks reached 2.7 million
sq m (29.1 million sq ft) by end-2017, and we expect
over 640,000 sq m (6.9 million sq ft) of new supply to
enter the market between 2018 and 2020. With a yield of
5.5-6.0%, business parks represent an attractive
investment category for institutional investors. However,
quality stock on the market is limited.

31 Looking From Above | 28 June 2018 | Investment Property | Colliers International
Retail: Shenzhen
Fig. 44: 2018-2020 Shenzhen Middle to High-End Retail Property New Supply Distribution (sq m)
Source: Colliers International
By end-2017, the average rent for the Shenzhen retail
market reached RMB907 per sq metre per month
(USD13.2 per sq ft per month). The average rent for the
core areas was RMB1,097 per sq metre per month
(USD16.0 per sq ft per month), while the average rent for
the emerging areas was only RMB619 per sq metre per
month (USD9.0 per sq ft per month). Over the next three
years, we expect a total of 2.3 million sq metres (24.8
million sq ft) of new supply to enter the market, all in
emerging areas. This heavy new supply ought to exert
downward pressure on the average rent. By end-2020,
the average retail rent for Shenzhen should decrease by
1.1% from the level at end-2017.
The population in the emerging areas in 2017 reached
8.5 million, accounting for 68% of the total population of
Shenzhen. In the long run, continuous population growth
in Shenzhen, especially in the emerging areas, should
provide solid support for the retail market. This should
eventually drive up the rent.
In the core-areas, we believe Qianhai will become a new
prominent retail district in coming years:
> Qianhai has no shopping mall at present. However,
new retail developments are on the way, including
China Resources’ Mixc Qianhai with a total GFA of
80,000 sq metres (860,800 sq ft) in 2019. In view of
continuous population growth and probable job
creation in finance, technology, and professional
services, Qianhai should generate great
consumption power. We expect Qianhai to form a
prominent retail market over the next three years.
Retail: Guangzhou
Given a total stock of over 0.96 million sq metres (10.4
million sq ft), Tianhe North-Sport Centre remained the
premier retail submarket in Guangzhou with a rental
level of RMB1,812 per sq metre per month (USD26.2 per
sq ft) per month at end-2017. YueXiu is another
traditional retail submarket with over 300,000 sq metres
(3.2 million sq ft) at end-2017. These submarkets have
matured into the most popular shopping areas and we
expect steady growth in average rent and capital values
due to a lack of new supply for the next five years. The
overall vacancy rate increased by 0.5 percentage points
to 8.2% in Q1 2018 due to the relocation of leading
department stores and new supply. However, rent has
remained firm with 3.2% YOY growth.
In 2018, we expect over 886,000 sq metres (9.5 million
sq ft) of new retail supply to enter the market, entirely in
emerging areas. We see new investment opportunities in
non-core areas like Baiyun and Huangpu:
> Baiyun & Huangpu Districts, accounting for 70% of
new supply, will offer more investment opportunities,
especially the increasing supply of community
shopping centres.
Figure 45: 2018 Guangzhou Retail New Supply
Distribution
Source: Colliers International
1,616,000
668,000673,000460,000
112,000
2018 2019 2020
Emerging Area Core Area

32 Looking From Above | 28 June 2018 | Investment Property | Colliers International
West China
Summary of opportunities
In March 2018, the Chengdu government published
Chengdu’s overall plan 2016-2035. This plan calls for
Chengdu to be developed into a national central city and
international gateway city by 2035. Chengdu is already
developing rapidly, especially in terms of infrastructure,
thus attracting many investors’ attention. Looking
forward, Colliers believes that investors should continue
eyeing investment opportunities in Chengdu.
While firm demand is driving rent growth, Grade A office
property in Chengdu yields about 5.7%, and so offers a
premium of about 2 percentage points over ten-year
bonds. The rent of Chengdu Grade A offices should rise
steadily over the next few years driven by high-quality
new projects and firm demand. Within this segment, the
Financial Town submarket offers ample new supply to
consider in future, and this submarket has strong policy
support. We also favour the business park segment,
which yields 7-8%, especially in South Hi-tech district
where projects have been launched with the highest
rents.
While available logistics properties are scarce today,
trends in the logistics market are very positive. The
national government’s “One Belt, One Road” plan, the
launch of a free trade zone in Sichuan province, the start
of the Rong'ou international express railway, and the
construction of Tianfu international airport should drive
Chengdu’s further development as a logistics hub.
Looking ahead, industrial activity should shift eastwards
to Longquan Mountain, Jianzhou New Town, Huaizhou
New Town and New Airport Town.
Retail
Figure 47: Chengdu Prime Retail Submarket
Location
Source: Colliers International
Retail sales in Chengdu increased 11.5% YOY in 2017,
and retail real estate development is entering a period of
high growth. Chengdu’s commercial pattern focuses on
the traditional CBD along Chunxi and Yanshikou Roads,
supported by other prime retail areas in the city. Over the
next decade, we expect development of Chengdu to
expand to the south of the current CBD, towards the
Tianfu New Area with the core of this new CBD being a
focus for development.
Figure 46: West China Investment Targets
SECTOR RENT
GROWTH 2017-22 AVG P.A.
VACANCY END-2017
VACANCY END-2022 EST.
NET INCOME YLD (%)
SPREAD OVER 10 YR BOND
Retail 3.0-5.0% 12.0-13.0% 15.0-16.0% 6.0% 2.4pp
Business Park 4.0-5.0% 5.0-6.0% 13.0-15.0% 7.0-8.0% 3.4-4.4pp
Logistics 3.0-4.0% 17.0% 15.0% 6.0% 2.4pp
Office 3.0% 26.7% 26.1% 5.7% 2.1pp
Source: Colliers International

33 Looking From Above | 28 June 2018 | Investment Property | Colliers International
Figure 48: Chengdu Prime Retail New Supply,
Net Absorption and Vacancy Rate
Source: Colliers International
Chengdu’s prime retail market experienced steady
development after a large quantity of new supply was
released in 2014. However, net absorption kept pace
with the supply, keeping the vacancy rate between 12-
13% over the long term. In 2017, reflecting continuous
improvement in Chengdu’s commercial vitality, a high
number of fashion and experience-driven commercial
brands gathered in Chengdu, as well as retailers
offering an online/offline presence. Driven by these
factors, net absorption exceeded new supply for the
first time, pushing the vacancy rate down to 11.3%.
Figure 49: 2017 Rents and Vacancy Rates in
Chengdu’s Prime Retail Submarkets
Source: Colliers International
Chengdu’s main retail districts have seen good rental
performance, with yields reaching about 6% and the
vacancy rate declining.
> Chengdu’s traditional retail areas benefit from a
steady stream of customers and limited supply, and
with the evolution of the market, commercial quality
and rental income have improved. The Chunxi Road-
Yanshikou Retail area, due to superior geographical
position and brand aggregation, has become
favoured by investors as it is the best retail area in
Chengdu, offering the highest occupancy rate and
rents. However, vacancy in the Luomashi-Tianfu
Square retail area has increased in a certain period
as some large tenants have closed their shops. We
believe the vacancy rate should decline, returning to
normal levels, as the area matures.
> Tianfu New Area is Chengdu’s new development
district, with a commensurately high vacancy rate.
Two urban commercial projects, Yintai in99, opening
in 2017, and u-fun, opening in Q2 2018, promoted
the regional commercial development and injected
new vitality to the commercial development of Tianfu
New Area. However, as this area matures over time,
the occupancy rate should improve, leading to better
performance and more attractive opportunities for
investors.
Office
Figure 50: Chengdu Office Submarket Location
Map
Source: Colliers International
From 2006 to 2017, official data indicate that the number
of Global Fortune 500 companies in Chengdu grew from
108 to 281, and Chengdu’s utilised FDI increased more
than tenfold to USD10.04 billion. The city government’s
strong support for innovation and start-up companies, as
well as the average annual growth rate of newly registered
companies reaching 19.6% from 2010 to 2017, should
support continued absorption of Chengdu’s Grade A office
space.
0.0%
5.0%
10.0%
15.0%
20.0%
25.0%
30.0%
0
200
400
600
800
1,000
1,200
Rent (RMB/㎡) Vacancy rate(%)

34 Looking From Above | 28 June 2018 | Investment Property | Colliers International
From 2011 to 2015 Chengdu saw a large quantity of
Grade A supply come onstream. This heavy supply
weakened the bargaining power of owners, keeping
Chengdu’s Grade A office capital values at a relatively
low level, leading to the value of high-quality projects
being underestimated. Therefore, Chengdu’s Grade A
office sector is quite attractive to investors, and strategic
investors continue to eye opportunities in Chengdu.
Figure 51: Chengdu Grade A Office Yearly New
Supply, Net Absorption and Vacancy Rate
Source: Colliers International
Demand for Grade A office space in Chengdu increased
significantly in 2017, as evidenced by the fact that net
absorption grew to 327,000 sq metres (3.52 million sq
feet) in 2017, up from just 30,000 sq metres (323,000 sq
ft) in 2011. This pushed the vacancy rate down 21
percentage points from H1 2014 to 26.7% by end-Q1
2018.
Figure 52: Chengdu Office: Rent Trend for Each
Submarket
Source: Colliers International
Average rents in Chengdu’s prime office market saw a
slight rise for the fourth consecutive quarter in Q1 2018.
Chengdu’s average rent was RMB102.1 (USD16.3) psm
per month at the end of Q1. Due to robust demand and
higher market confidence, we expect average rents to
rise by 2-3% in 2018. We predict rent growth of a similar
level over the following three years. Even with this rental
growth, Chengdu’s Grade A office rent is lower than in
Tier 1 cities, and low also compared to other Tier 2
cities. Chengdu’s Grade A office yield is about 5.7%,
which is attractive to investors, with owner-occupiers and
strategic investors being the main source of en bloc
transactions.
Figure 53: 2018 Q1 Net Absorption and Vacancy
Rate by Submarket
Source: Colliers International
With the implementation of Chengdu’s “southwards”
strategy, the Financial Town submarket should grow
rapidly, becoming a hot spot for investment and en-bloc
transactions.
0%
10%
20%
30%
40%
50%
60%
0
100,000
200,000
300,000
400,000
500,000
600,000
1H 14 2H14 1H 15 2H 15 1H 16 2H 16 1H 17 2H 17 1Q 18
New Supply 新增供应 Net Absorption 净吸纳量
Vacancy Rate 空置率
0
20
40
60
80
100
120
140
160
180
2011 2012 2013 2014 2015 2016 2017 2018Q1
Tianfu Square East Avenue
South Renmin Road Financial Town
Dayuan Panchenggang
0%
5%
10%
15%
20%
25%
30%
35%
- 5,000
10,000 15,000 20,000 25,000 30,000 35,000 40,000 45,000 50,000
Net Absorption Vacancy Rate

35 Looking From Above | 28 June 2018 | Investment Property | Colliers International
Business Park
Figure 54: Chengdu Business Park: Location
Map for Each Submarket
Source: Colliers International
Chinese industry is continually moving up the global
value chain, and Chengdu, as a western core city, is
strategically positioned to further integrate into the
industrial chain. Chengdu’s integration into China’s
ambitious “One Belt, One Road” programme should
enable Chengdu to realise the functions of the entire
industrial chain from manufacturing and assembly to
research and design. This should support demand for
Chengdu’s business parks.
The development of business parks has laid the
foundation for urban economic growth. The newer
business parks should have a more diverse tenant base,
with an increasingly standardised and service-oriented
offering. Over the last ten years of development,
Chengdu’s business parks have shifted from being led
by the government to cooperation between the
government and businesses, with increasingly
professional development and operation. More mature
and larger business parks should attract more high-
quality industries and tenants to Chengdu.
Figure 55: Chengdu Prime Business Park Yearly
New Supply, Net Absorption and Vacancy Rate
Source: Colliers International
The functions of Chengdu business parks have also
been expanding continuously, and they now offer
multiple functions including traditional and back office
services, R&D, headquarters and exhibition space. As a
result, the demand for Chengdu’s business parks
remains firm, with the vacancy rate dropping from 5-6%
to 4.3% at end-2017.
Figure 56: Chengdu Prime Business Parks:
Transaction Values and Yields
Source: Colliers International
The average transaction value and yields of Chengdu
business parks have been increasing since 2015,
benefiting from a healthy market environment. The
average yield of Chengdu business park property now
stands at 7.6%.
0%
1%
2%
3%
4%
5%
6%
7%
0
200,000
400,000
600,000
800,000
1,000,000
1,200,000
1,400,000
2014 2015 2016 2017
New Supply(㎡) Net Absorption(㎡)
Vacancy Rate(%)
6.4%
6.6%
6.8%
7.0%
7.2%
7.4%
7.6%
7.8%
6,900
7,000
7,100
7,200
7,300
7,400
7,500
2014 2015 2016 2017
Transaction Value(RMB/㎡) Yield(%)
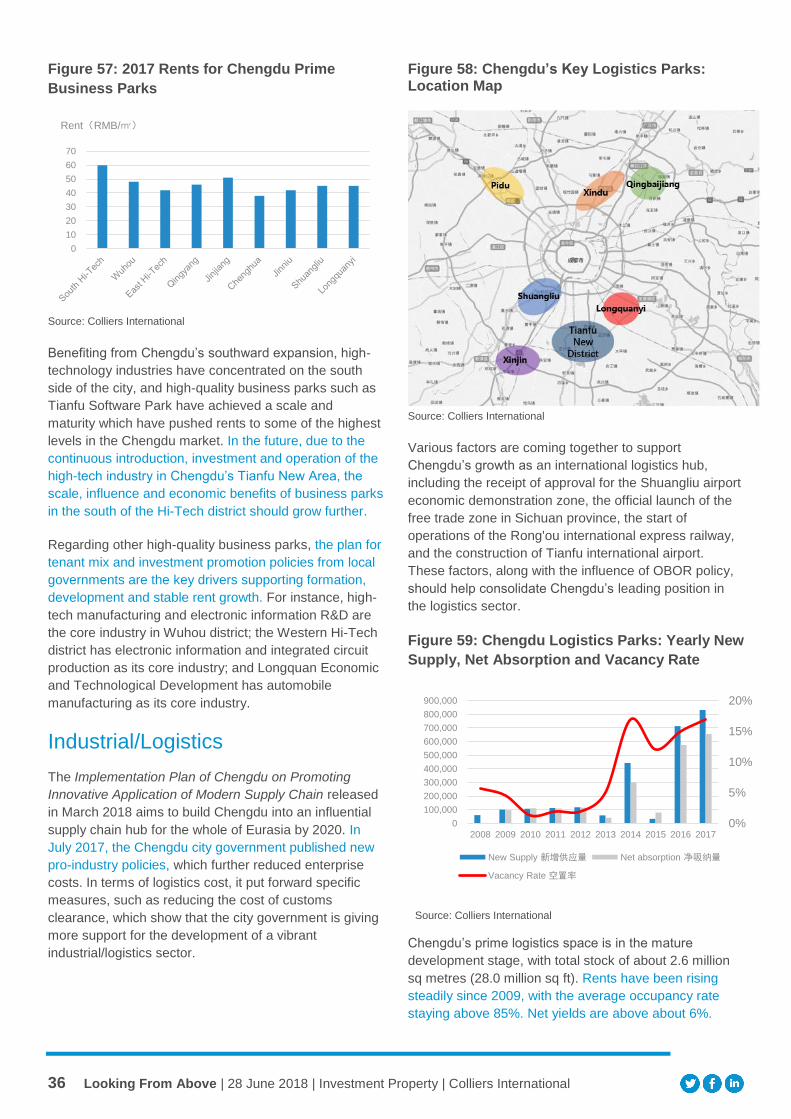
36 Looking From Above | 28 June 2018 | Investment Property | Colliers International
Figure 57: 2017 Rents for Chengdu Prime
Business Parks
Source: Colliers International
Benefiting from Chengdu’s southward expansion, high-
technology industries have concentrated on the south
side of the city, and high-quality business parks such as
Tianfu Software Park have achieved a scale and
maturity which have pushed rents to some of the highest
levels in the Chengdu market. In the future, due to the
continuous introduction, investment and operation of the
high-tech industry in Chengdu’s Tianfu New Area, the
scale, influence and economic benefits of business parks
in the south of the Hi-Tech district should grow further.
Regarding other high-quality business parks, the plan for
tenant mix and investment promotion policies from local
governments are the key drivers supporting formation,
development and stable rent growth. For instance, high-
tech manufacturing and electronic information R&D are
the core industry in Wuhou district; the Western Hi-Tech
district has electronic information and integrated circuit
production as its core industry; and Longquan Economic
and Technological Development has automobile
manufacturing as its core industry.
Industrial/Logistics
The Implementation Plan of Chengdu on Promoting
Innovative Application of Modern Supply Chain released
in March 2018 aims to build Chengdu into an influential
supply chain hub for the whole of Eurasia by 2020. In
July 2017, the Chengdu city government published new
pro-industry policies, which further reduced enterprise
costs. In terms of logistics cost, it put forward specific
measures, such as reducing the cost of customs
clearance, which show that the city government is giving
more support for the development of a vibrant
industrial/logistics sector.
Figure 58: Chengdu’s Key Logistics Parks: Location Map
Source: Colliers International
Various factors are coming together to support
Chengdu’s growth as an international logistics hub,
including the receipt of approval for the Shuangliu airport
economic demonstration zone, the official launch of the
free trade zone in Sichuan province, the start of
operations of the Rong'ou international express railway,
and the construction of Tianfu international airport.
These factors, along with the influence of OBOR policy,
should help consolidate Chengdu’s leading position in
the logistics sector.
Figure 59: Chengdu Logistics Parks: Yearly New
Supply, Net Absorption and Vacancy Rate
Source: Colliers International
Chengdu’s prime logistics space is in the mature
development stage, with total stock of about 2.6 million
sq metres (28.0 million sq ft). Rents have been rising
steadily since 2009, with the average occupancy rate
staying above 85%. Net yields are above about 6%.
0
10
20
30
40
50
60
70
Rent(RMB/㎡)
0%
5%
10%
15%
20%
0
100,000
200,000
300,000
400,000
500,000
600,000
700,000
800,000
900,000
2008 2009 2010 2011 2012 2013 2014 2015 2016 2017
New Supply 新增供应量 Net absorption 净吸纳量
Vacancy Rate 空置率

37 Looking From Above | 28 June 2018 | Investment Property | Colliers International
Well-known developers are concentrated in the
Longquany, Shuangliu, Qingbaijiang and Xindu districts,
but due to limited availability of land, these developers
are gradually looking to expand to the second ring
expressway. Due to the declining supply of logistics and
warehousing land, as well as increasing demand, we
expect the vacancy rate to continue to decline in future.
Figure 60: Chengdu Logistics Parks: Total Stock
and Occupancy Rate
Source: Colliers International
Influenced by the Chinese government’s “One Belt, One
Road” policy, the establishment of the free trade zone
and the Rong'ou international express railway, the import
and export trade in Chengdu in 2017 has accelerated.
Indeed, the growth rate in trade ranks first in China. The
Thirteenth Five-Year Plan for the development of
Chengdu’s modern logistics industry has determined the
key development direction of Chengdu’s modern
logistics industry for the future. The spatial layout and
functional positioning of the five logistics parks and six
logistics centres in Chengdu have been systematically
clarified. According to the government’s planning and
data analysis, there are many projects under
construction in the Chengdu International Railway Port
and Longquanyi district, bringing opportunities to
Chengdu’s logistics industry. Shuangliu airport district,
as a traditional logistics park, has many mature and
quality projects.
According to Chengdu’s “eastwards” policy, in the future
a large amount of industrial capacity should be put into
the Jianzhou new city, Huaizhou new city and new
airport town, with Chengdu's manufacturing centre
moving eastward. The east side of Longquan mountain
should become the main area of industrial space and
economic development. The development of warehouse
space in these districts should benefit from the
expansion of Chengdu international railway port, Tianfu
international airport and industrial aggregation.
0%10%20%30%40%50%60%70%80%90%100%
0100,000200,000300,000400,000500,000600,000700,000800,000900,000
1,000,000
total stock 总体量 occupancy rate 出租率
Figure 61: Location Map of Longquan Mountain and Jianzhou New Town, Huaizhou New Town and New Airport Town
Source: Colliers International

Copyright © 2018 Colliers International.
The information contained herein has been obtained from sources deemed reliable. While every reasonable effort has been made to ensure its accuracy, we cannot guarantee it. No responsibility is assumed for any inaccuracies. Readers are encouraged to consult their professional advisors prior to acting on any of the material contained in this report.
413 offices in
69 countries on
6 continents United States: 145
Canada: 28
Latin America: 23
Asia Pacific: 86
EMEA: 131
$2.7 billion in annual revenue
2 billion square feet under management
15,400 professionals and staff
Primary Authors:
Andrew Haskins
Executive Director | Research | Asia
+852 2822 0511
Timothy Chen
Director | Research | East China
+86 21 6141 3550
Emily Cao
Associate Director | Research | North China
+86 10 8518 1633
Daniel Shih
Senior Director| Research | South China
+852 2822 0654
Sean Sun
Deputy Managing Director | West China
+86 28 8658 6288
For further information, please contact:
Betty Wong
National Head | Capital Markets & Investment Services |
Shanghai
+86 21 6141 3529
Daxuan Zhu
Associate Director | Capital Markets & Investment
Services | Shanghai
+86 21 6141 4318
About Colliers International Group Inc.
Colliers International Group Inc. (NASDAQ & TSX: CIGI) is an industry-leading real estate services
company with a global brand operating in 69 countries and a workforce of more than 12,000 skilled
professionals serving clients in the world’s most important markets. Colliers is the fastest-growing
publicly listed global real estate services company, with 2017 corporate revenues of $2.3 billion ($2.7
billion including affiliates). With an enterprising culture and significant employee ownership and
control, Colliers professionals provide a full range of services to real estate occupiers, owners and
investors worldwide. Services include strategic advice and execution for property sales, leasing and
finance; global corporate solutions; property, facility and project management; workplace solutions;
appraisal, valuation and tax consulting; customized research; and thought leadership consulting.
Colliers professionals think differently, share great ideas and offer thoughtful and innovative advice
that help clients accelerate their success. Colliers has been ranked among the top 100 global
outsourcing firms by the International Association of Outsourcing Professionals for 13 consecutive
years, more than any other real estate services firm. Colliers has also been ranked the number one
property manager in the world by Commercial Property Executive for two years in a row.
For the latest news from Colliers, visit Colliers.com or follow us on Twitter: @Colliers and LinkedIn.


![2008 China, Yunnan [Shanghai Expatriates]](https://img.pdfslide.us/doc/110x75/54c6509a4a79591a6d8b4621/2008-china-yunnan-shanghai-expatriates.jpg)