Embed Size (px)
Citation preview
Looking Back,Looking Ahead
ACBO Fall ConferenceOctober 30, 2013
Download presentation at scottlay.com
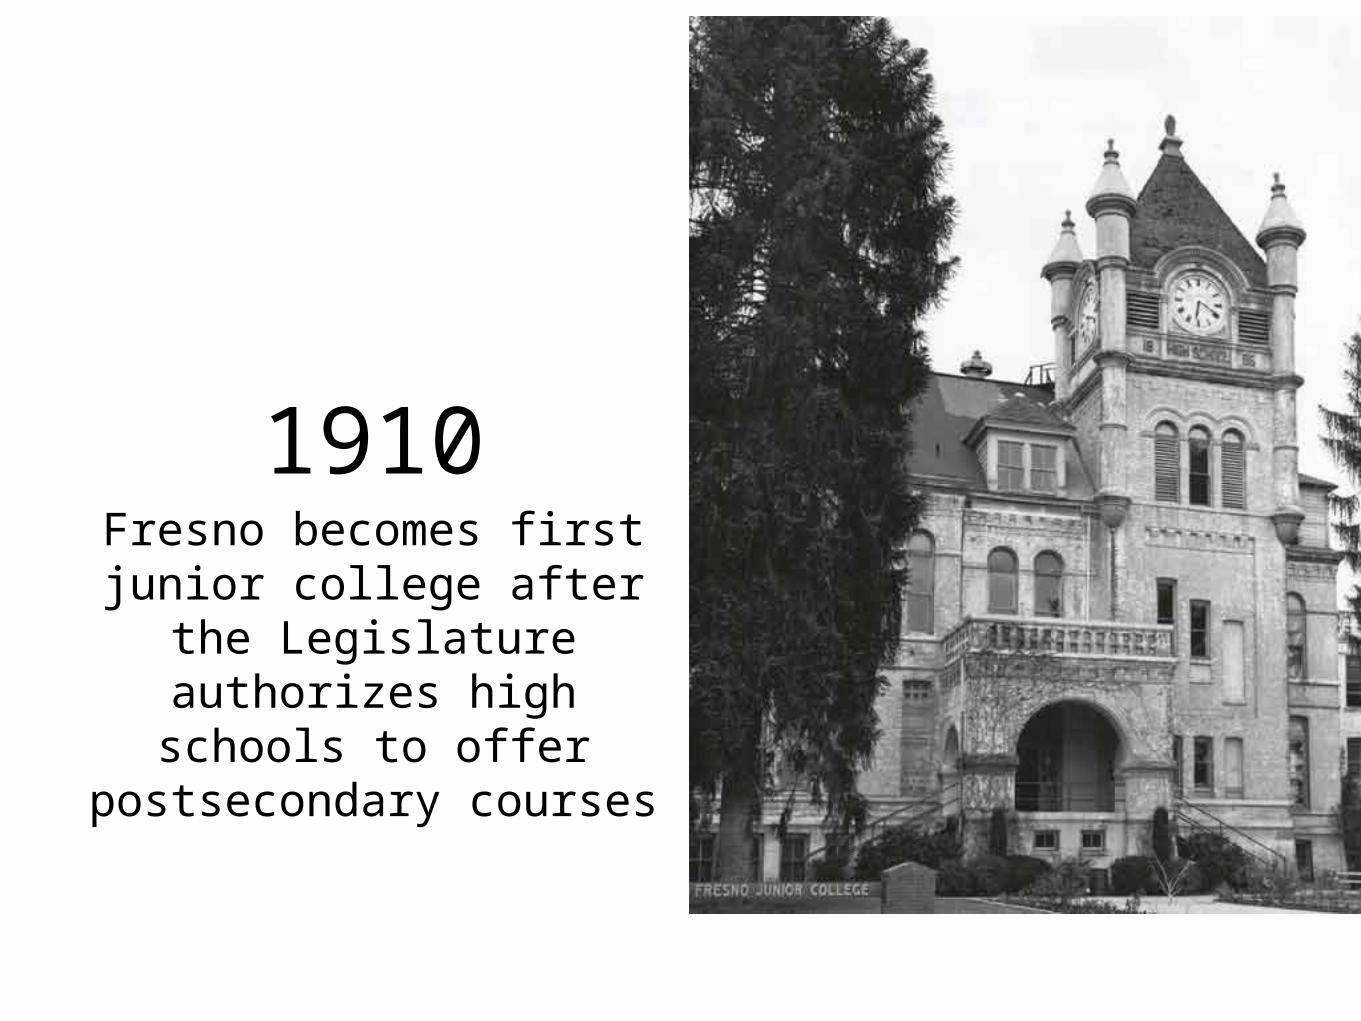
1910Fresno becomes first
junior college after the Legislature authorizes high
schools to offer postsecondary courses
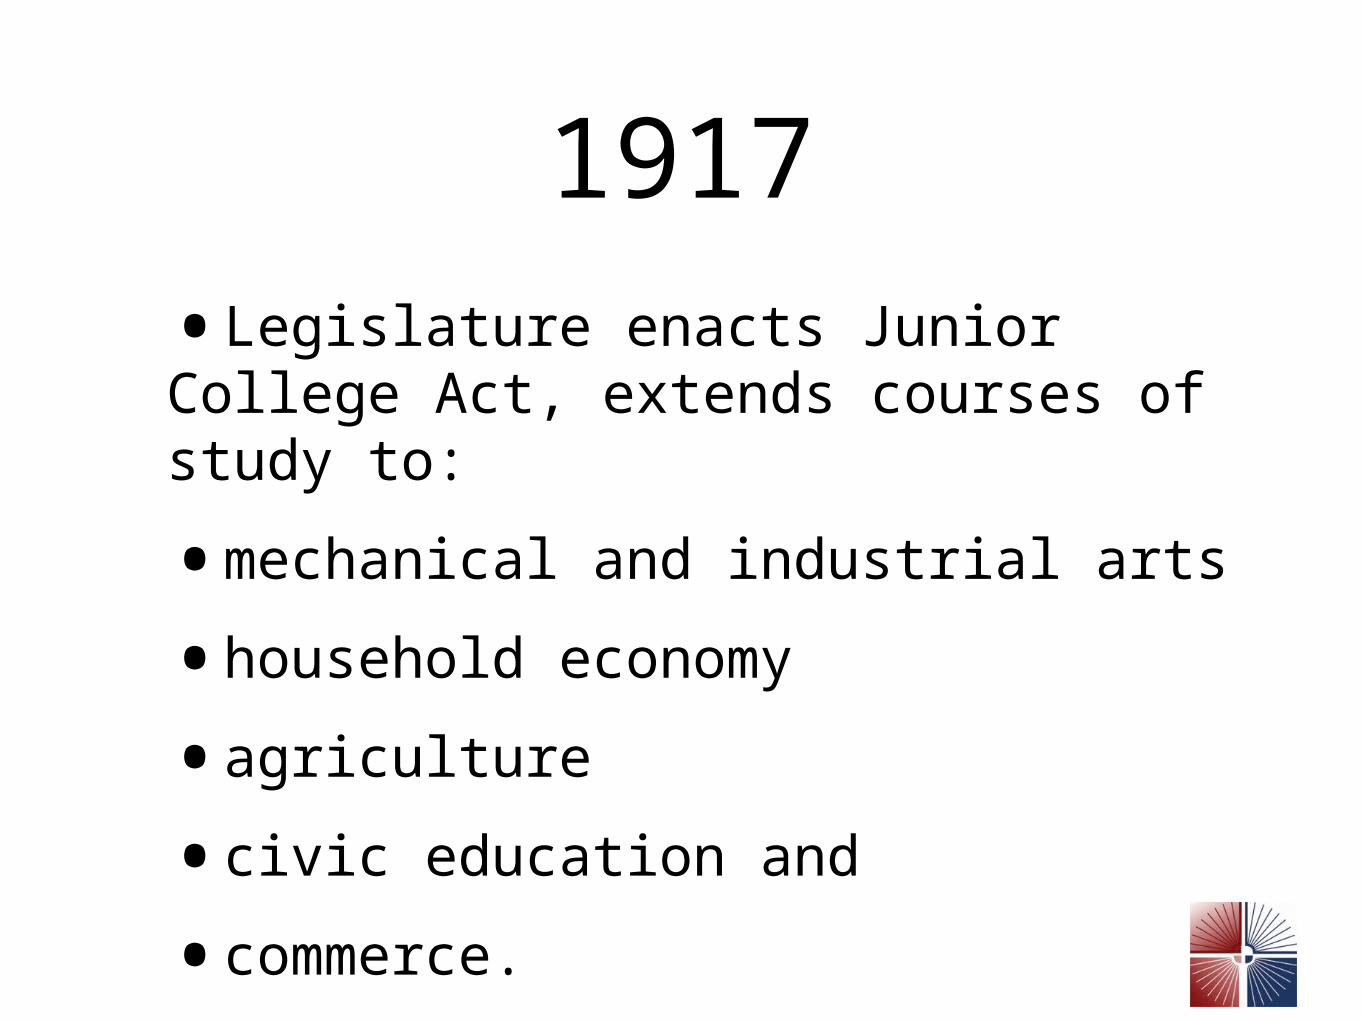
1917•Legislature enacts Junior College Act, extends courses of study to:
•mechanical and industrial arts
•household economy
•agriculture
•civic education and
•commerce.
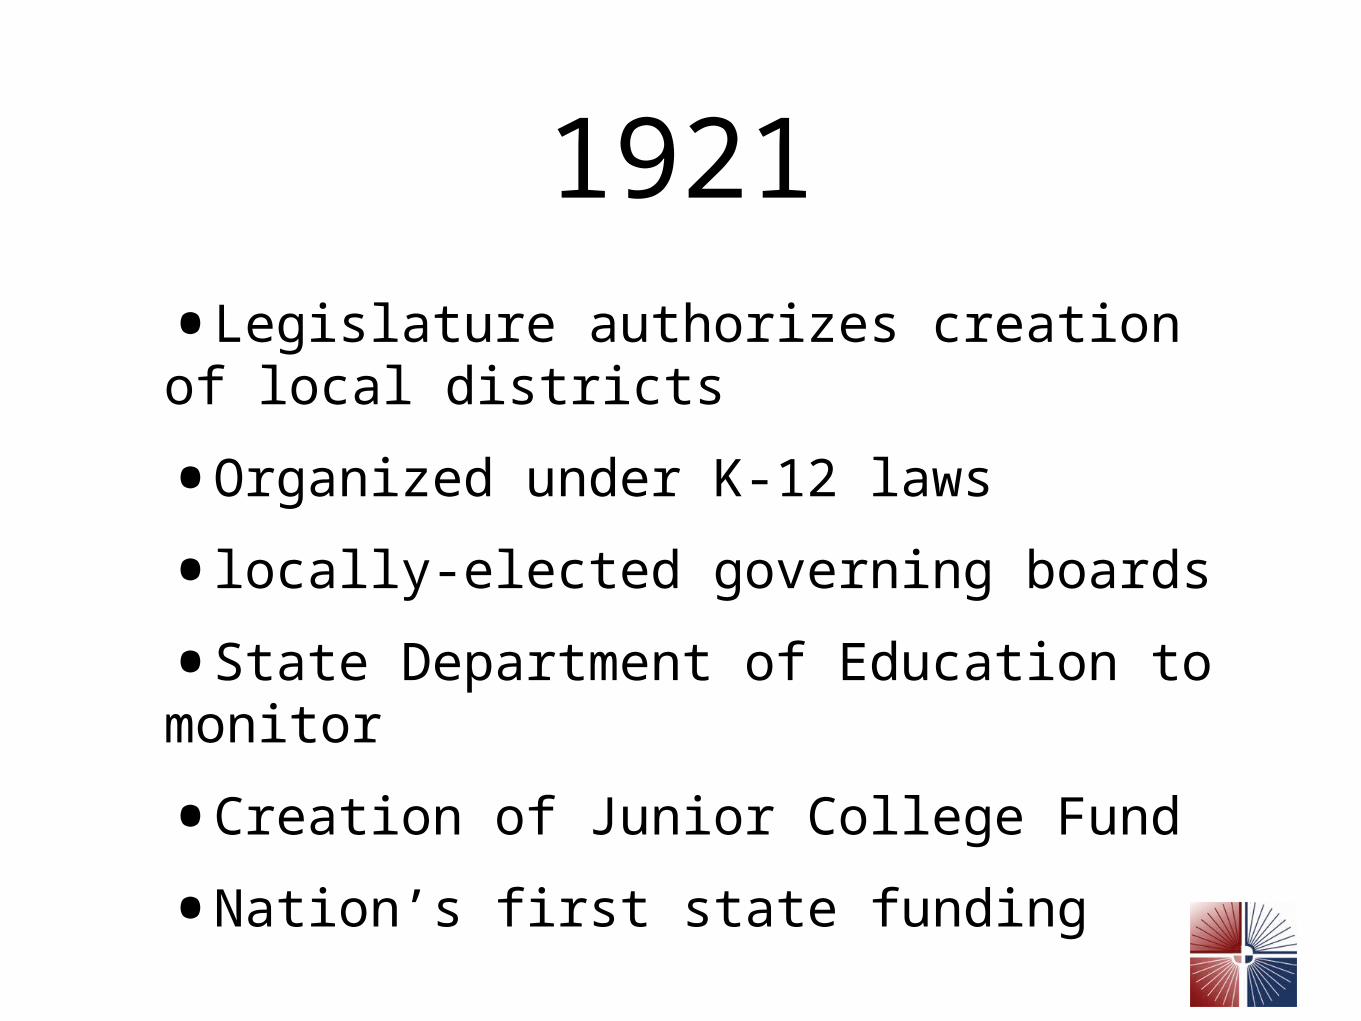
1921•Legislature authorizes creation of local districts
•Organized under K-12 laws
•locally-elected governing boards
•State Department of Education to monitor
•Creation of Junior College Fund
•Nation’s first state funding
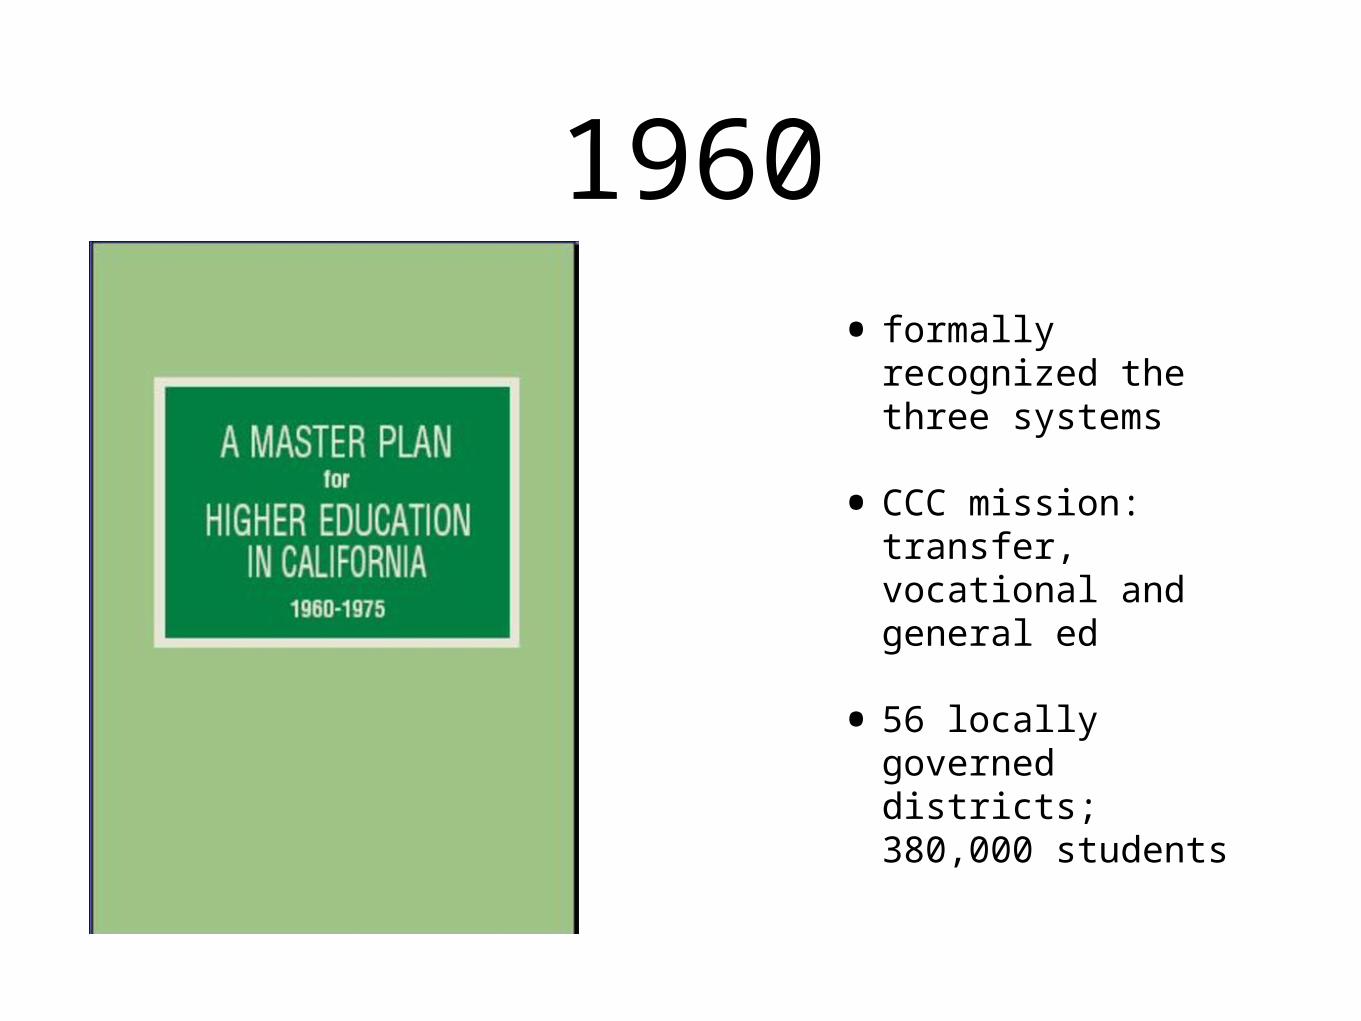
1960• formally
recognized the three systems
•CCC mission: transfer, vocational and general ed
• 56 locally governed districts; 380,000 students
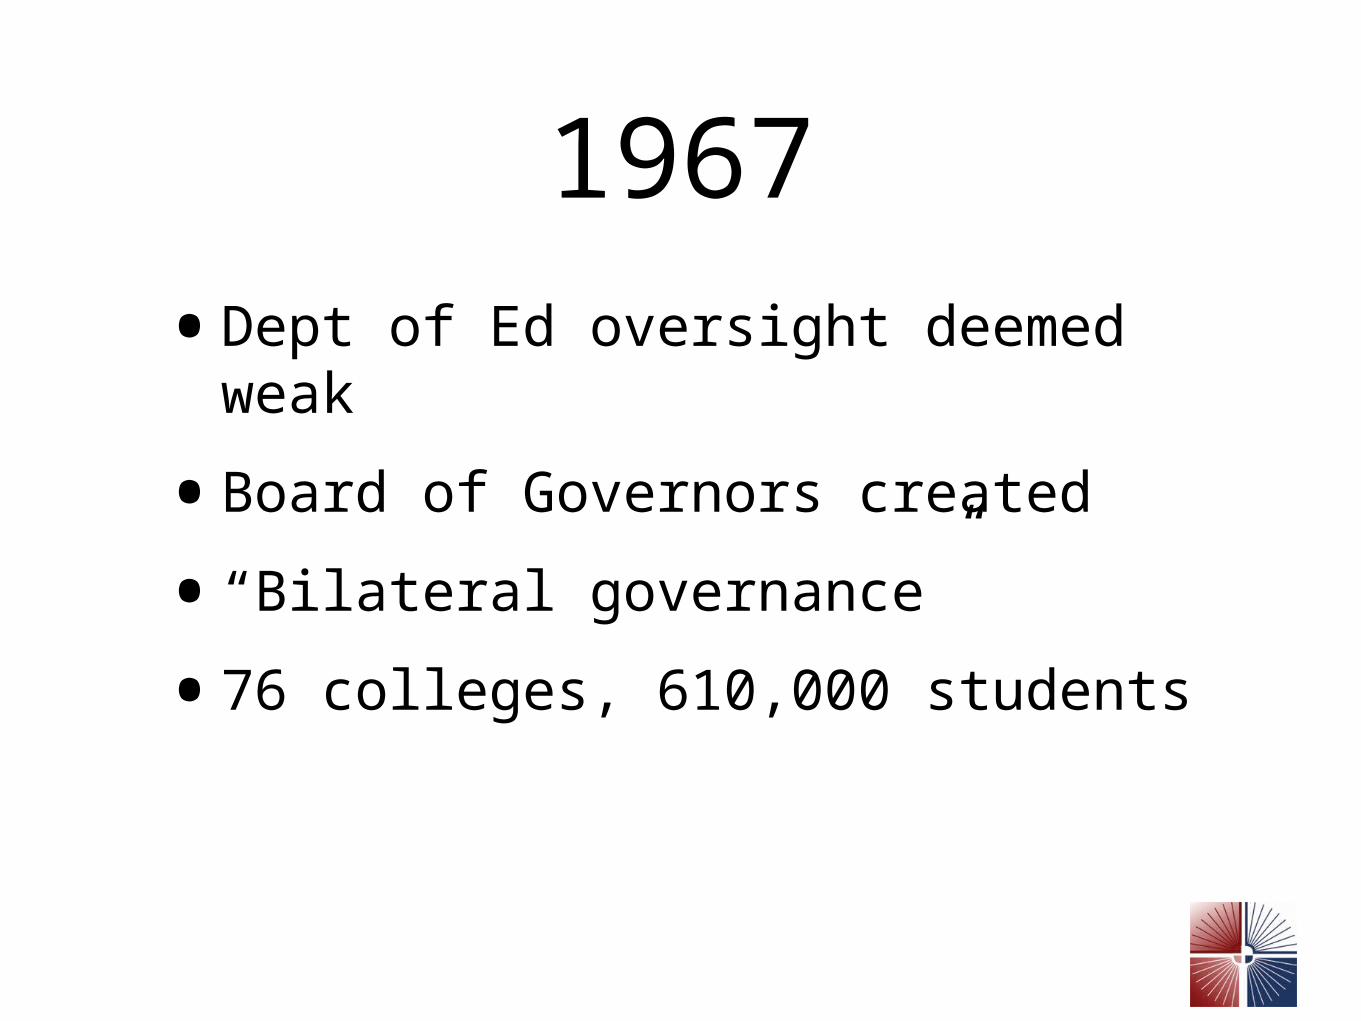
1967•Dept of Ed oversight deemed weak
•Board of Governors created
•“Bilateral governance”
•76 colleges, 610,000 students
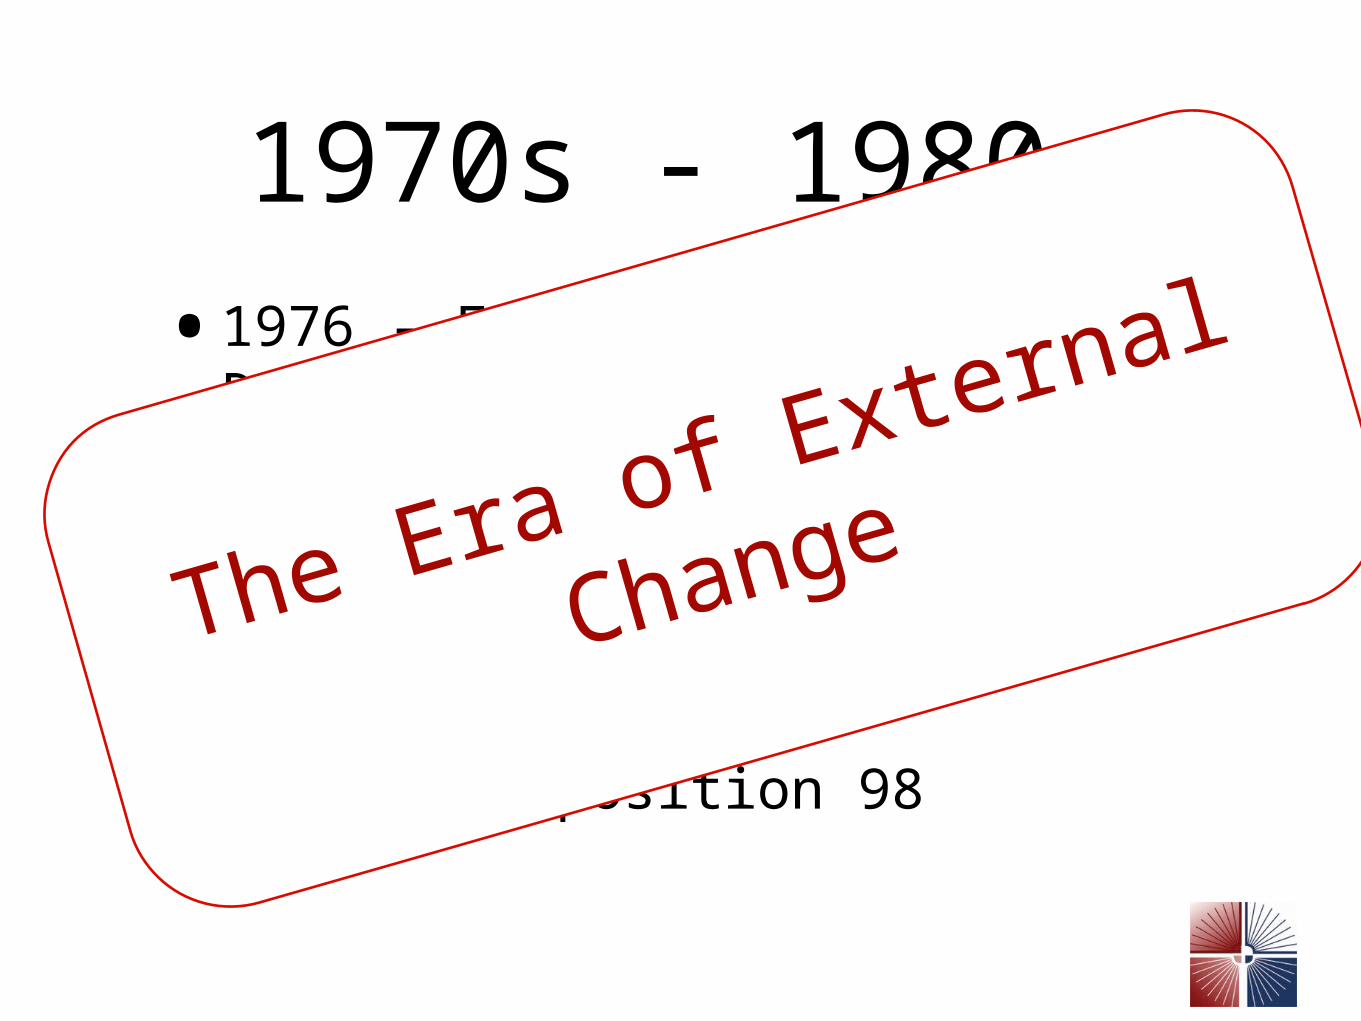
1970s - 1980s•1976 - Education Employment
Relations Act
•1978 - Proposition 13
•1984 - first enrollment fee
•1988 - AB 1725
•1988 - Proposition 98
The Era of External
Change
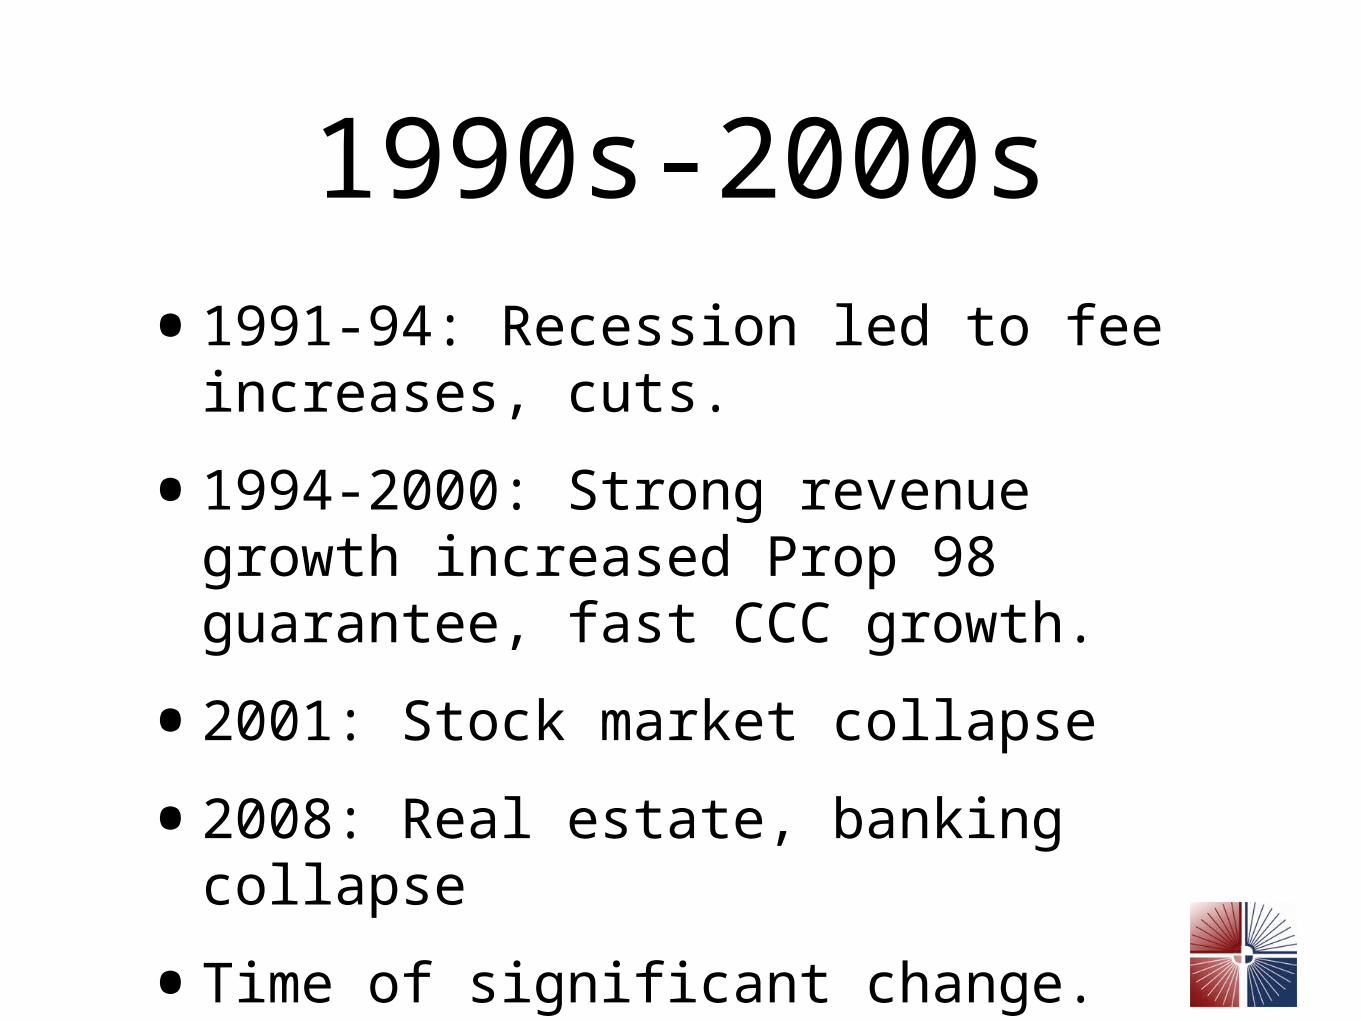
1990s-2000s•1991-94: Recession led to fee
increases, cuts.
•1994-2000: Strong revenue growth increased Prop 98 guarantee, fast CCC growth.
•2001: Stock market collapse
•2008: Real estate, banking collapse
•Time of significant change.
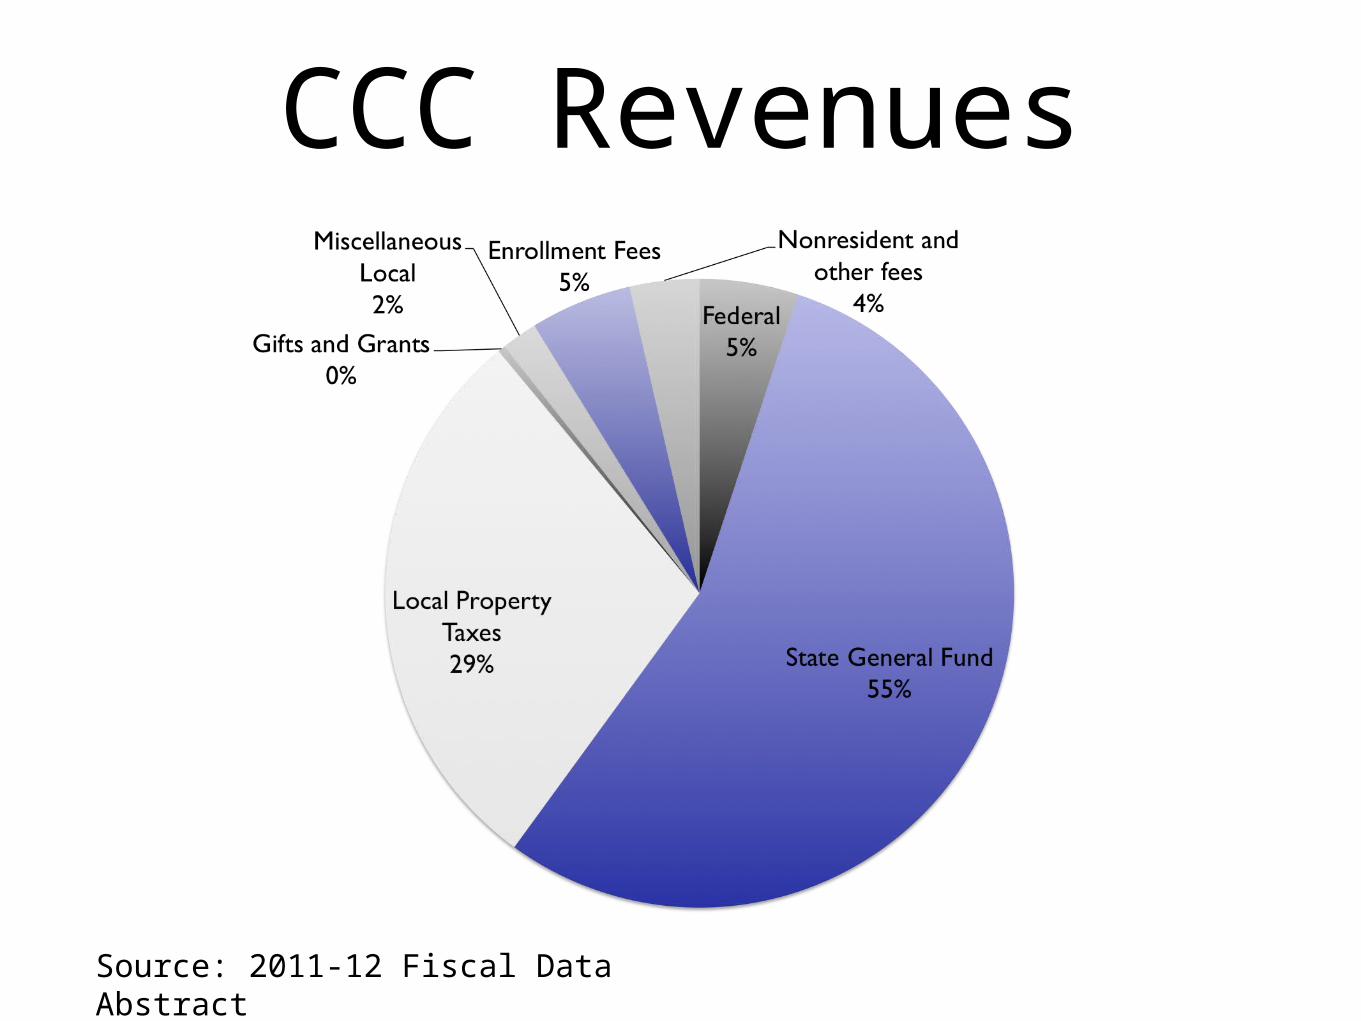
CCC Revenues
Source: 2011-12 Fiscal Data Abstract
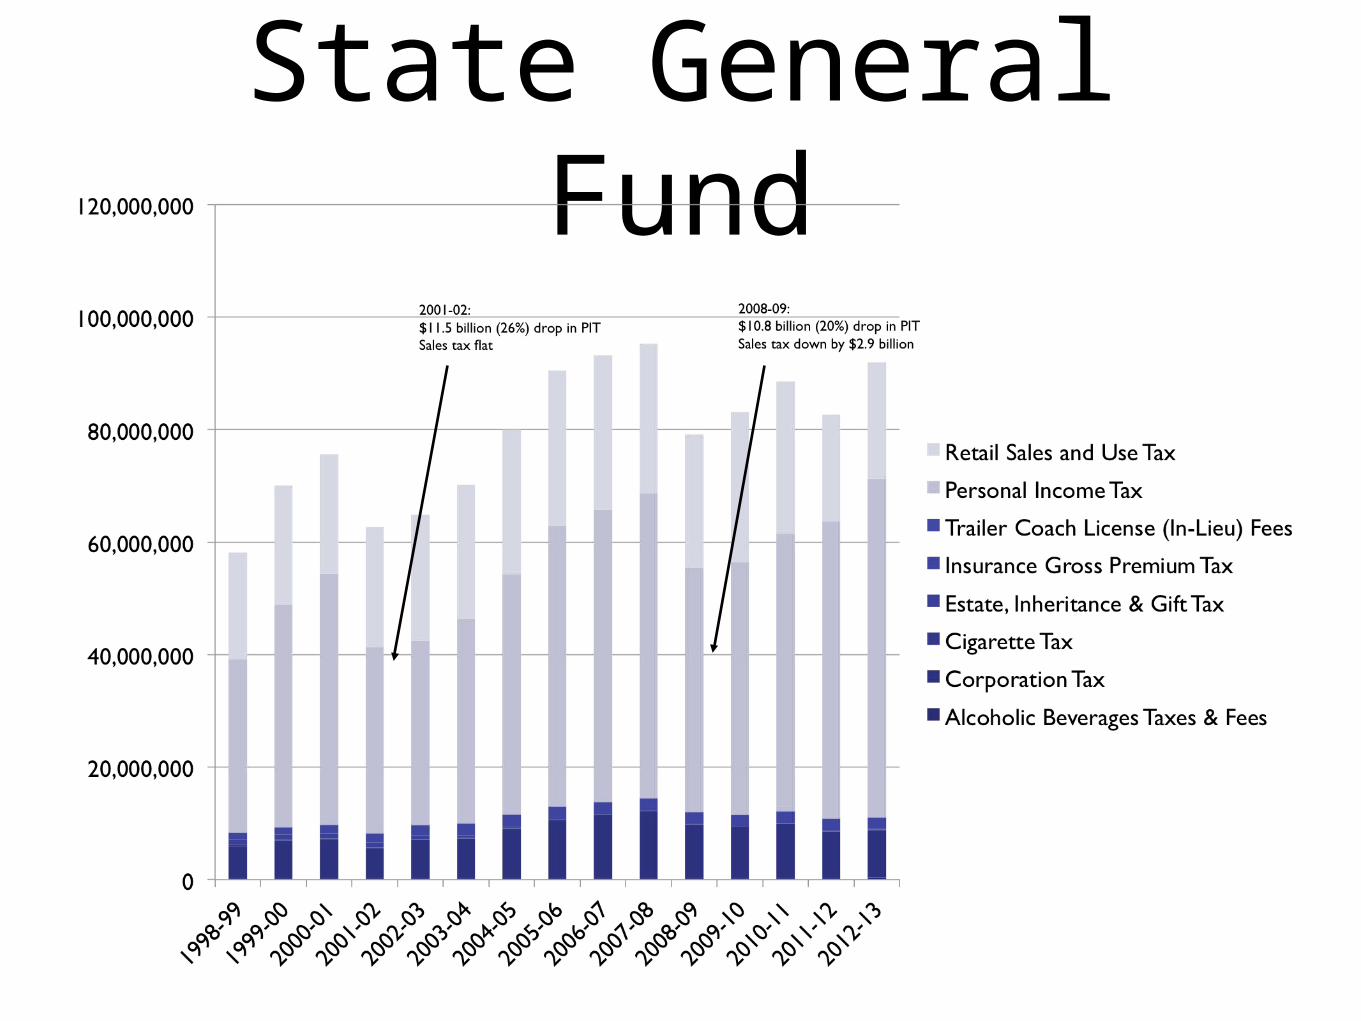
State General Fund
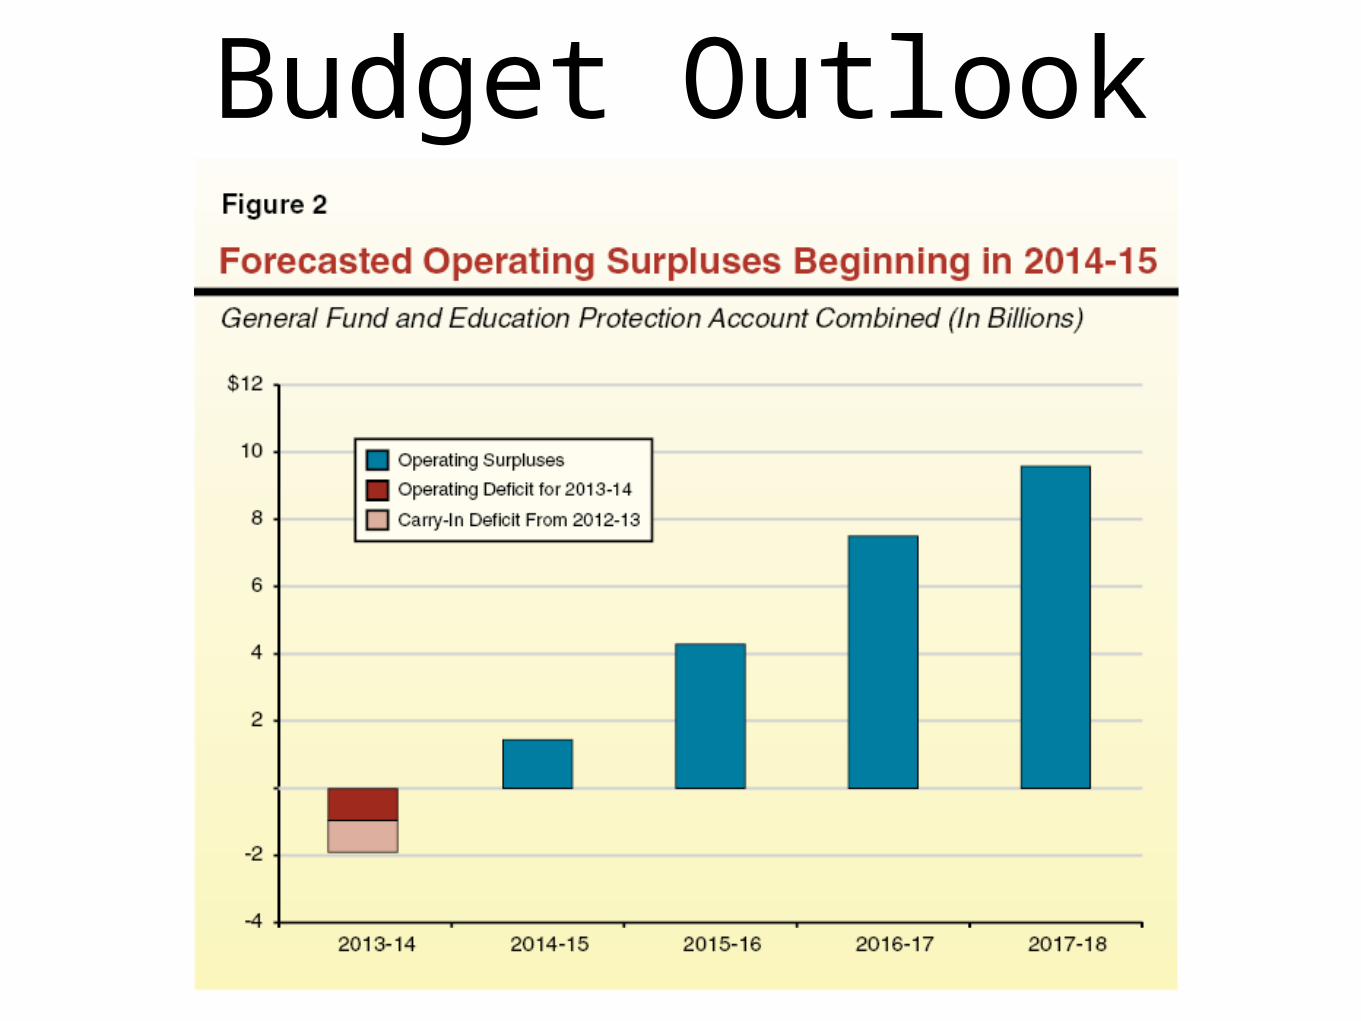
Budget Outlook
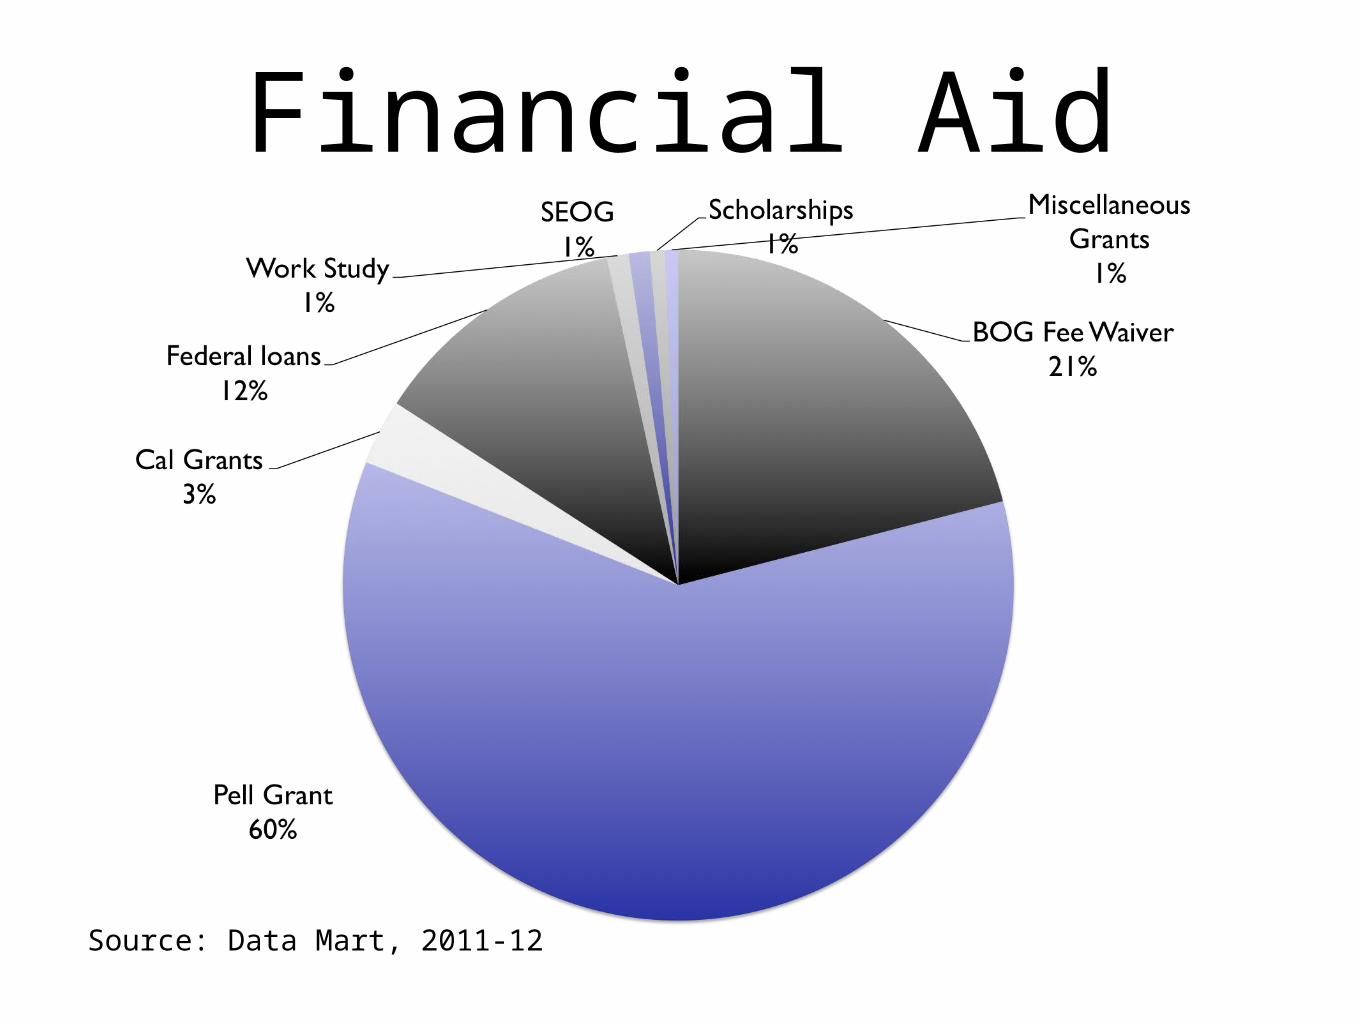
Financial Aid
Source: Data Mart, 2011-12
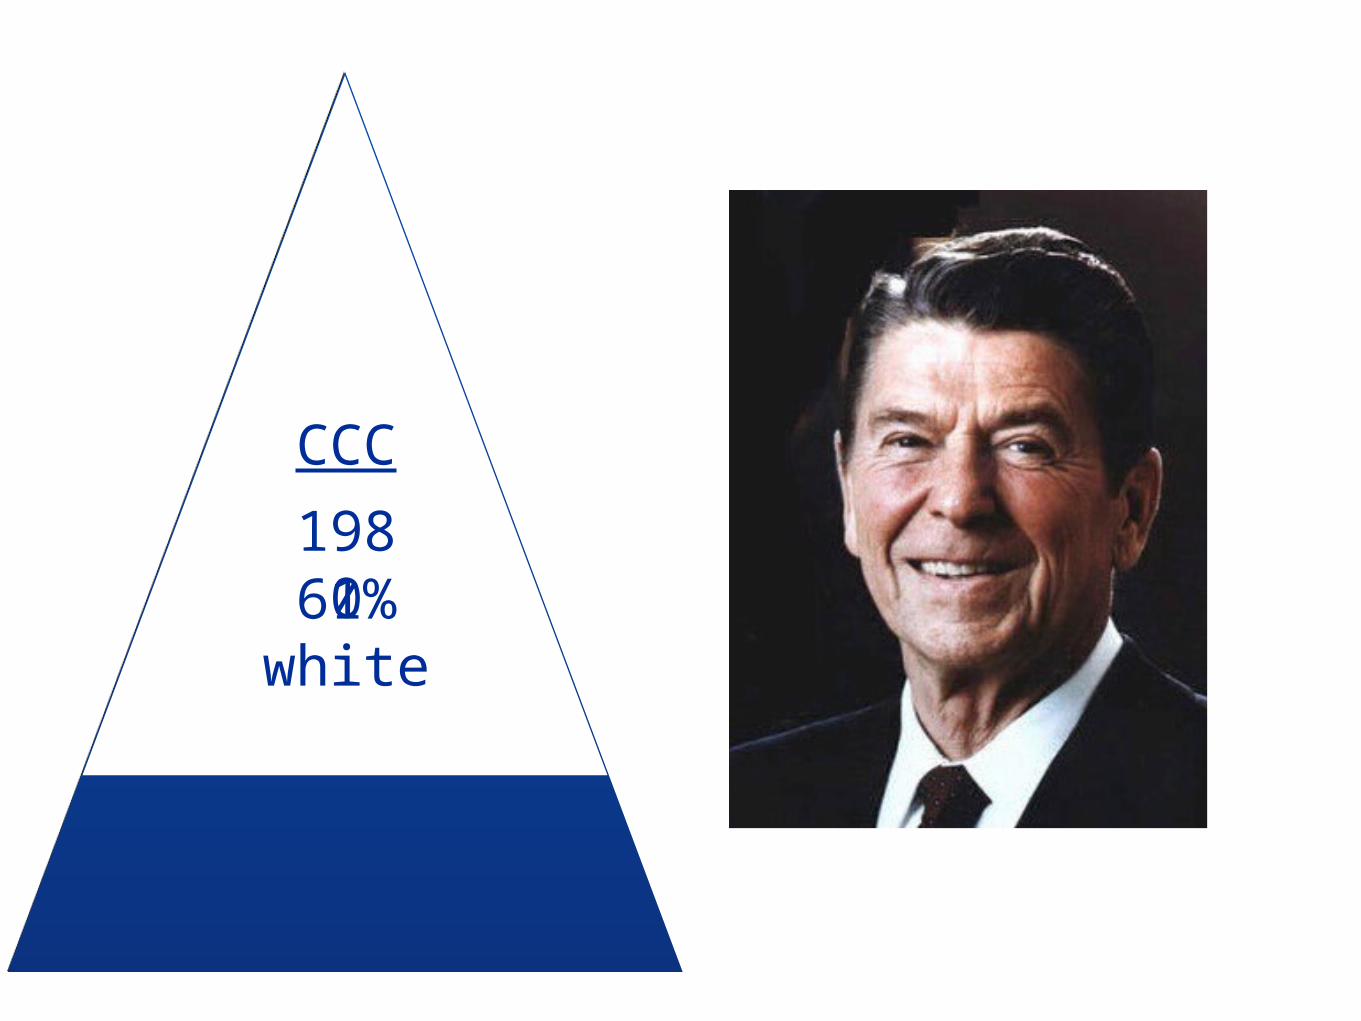
198061%
white
CCC
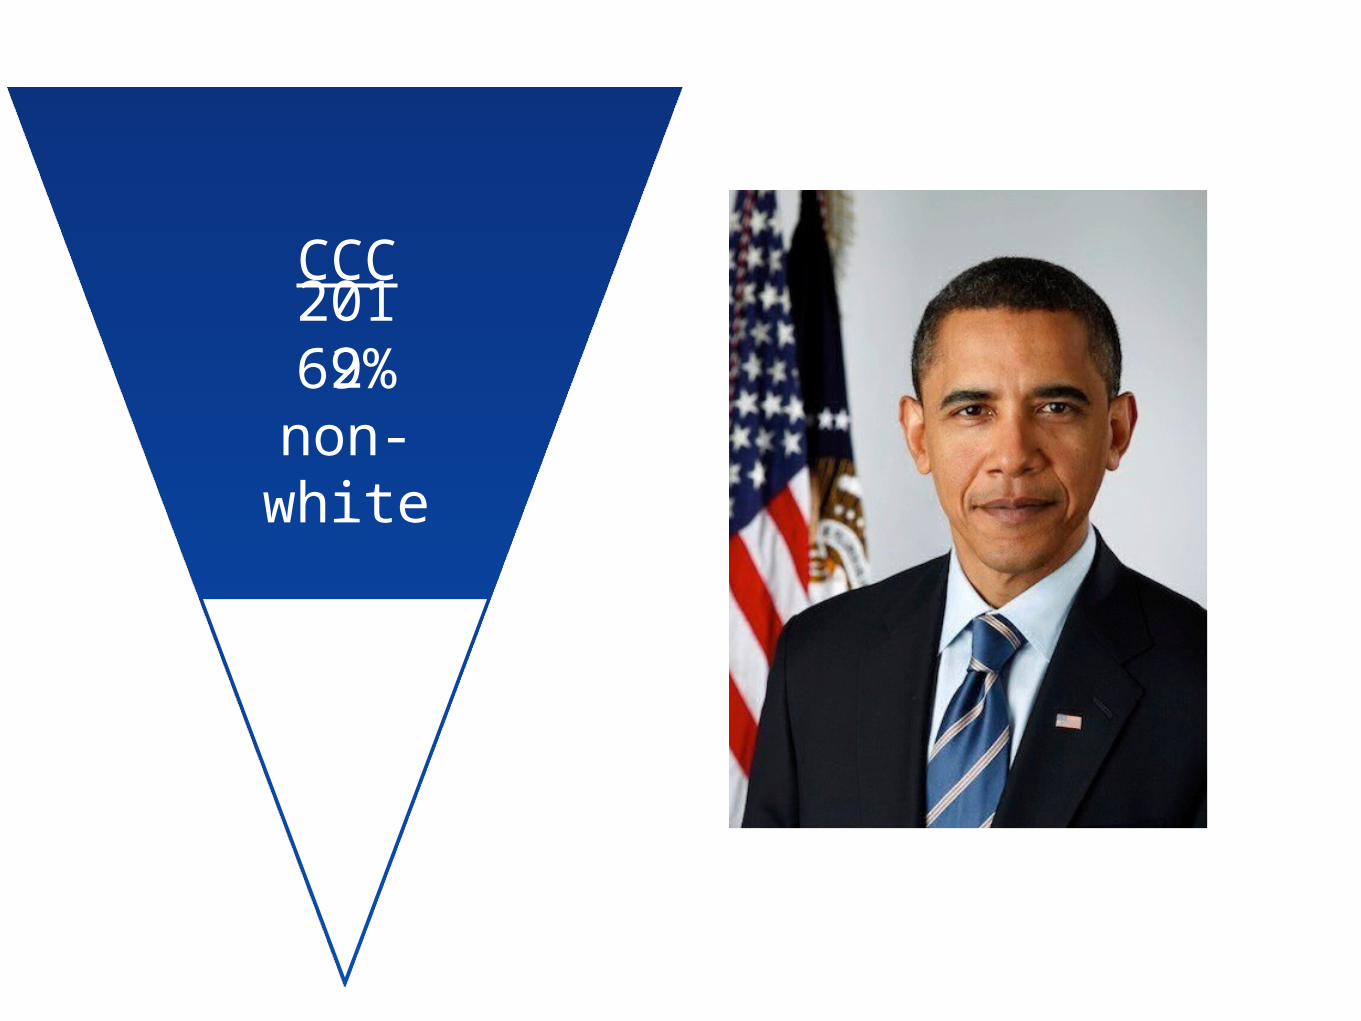
201269%
non-white
CCC

Shift Happens.Are we shifting
accordingly?

How are we doing?
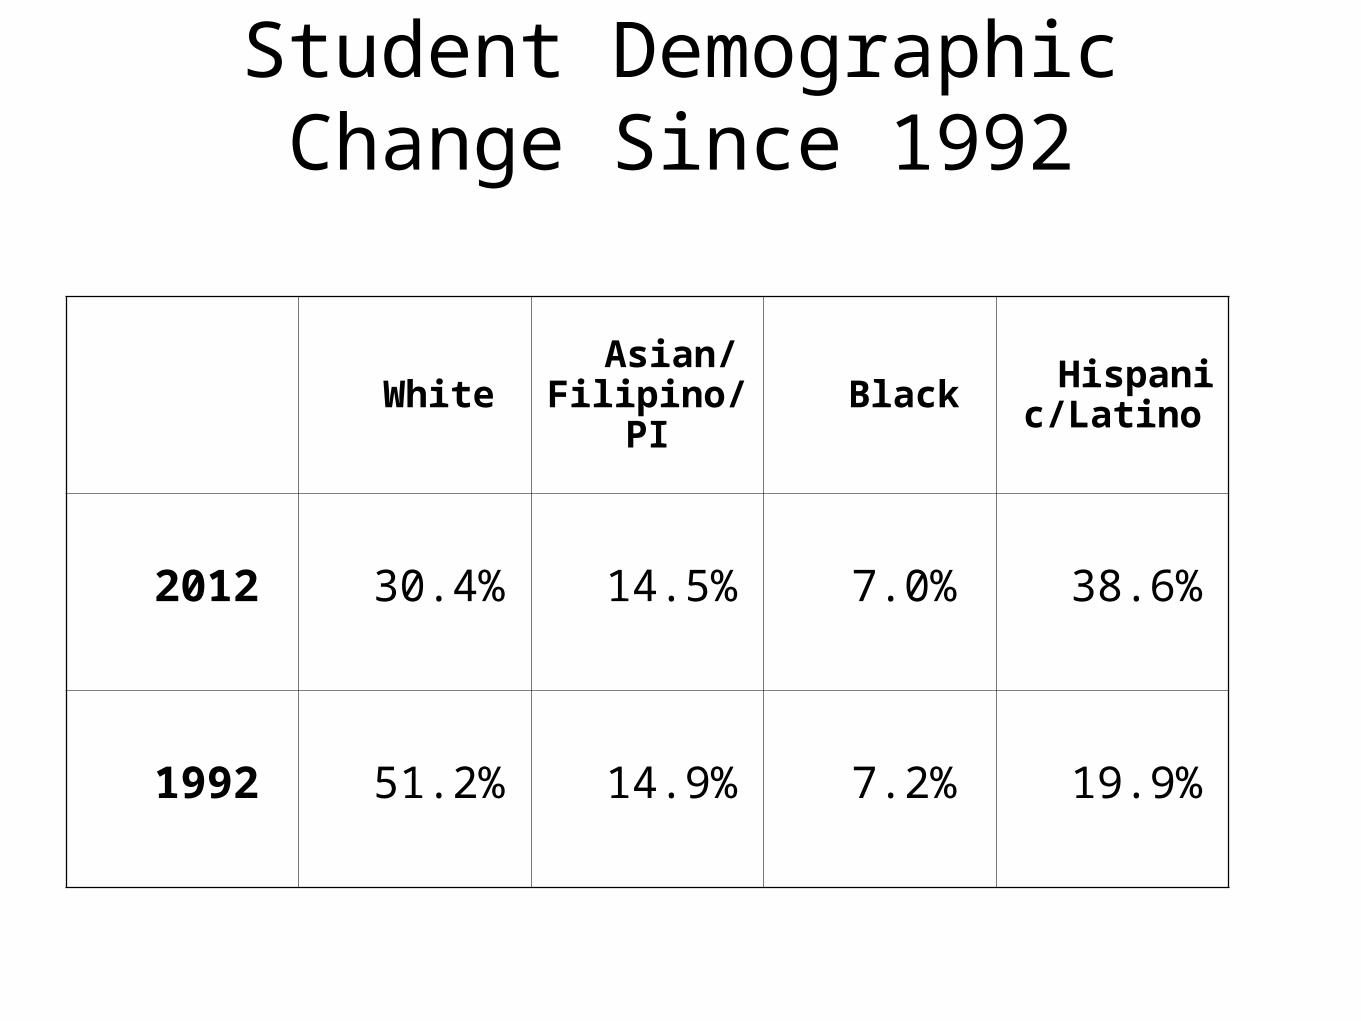
White Asian/Filipino/PI Black Hispani
c/Latino
2012 30.4% 14.5% 7.0% 38.6%
1992 51.2% 14.9% 7.2% 19.9%
Student Demographic Change Since 1992
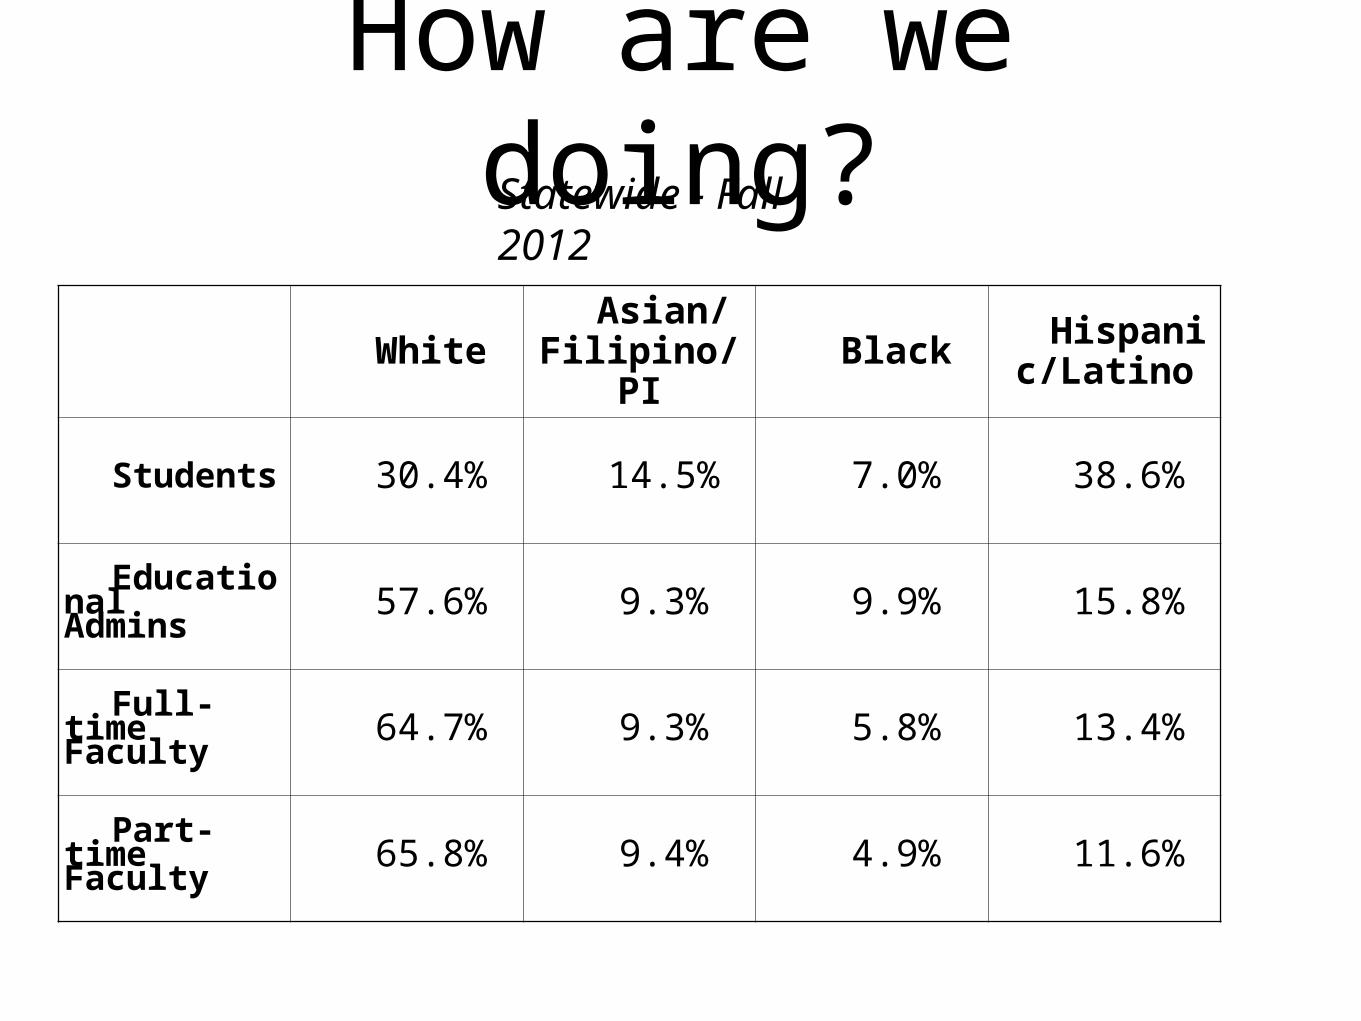
How are we doing?
White Asian/Filipino/PI Black Hispani
c/Latino
Students 30.4% 14.5% 7.0% 38.6%
EducationalAdmins
57.6% 9.3% 9.9% 15.8%
Full-time Faculty
64.7% 9.3% 5.8% 13.4%
Part-timeFaculty
65.8% 9.4% 4.9% 11.6%
Statewide - Fall 2012

No, how are we really doing?
Biggest Challenges• California is 46th in the nation in share of full-time students.
• Cal Grants are rigged against community college students as well, providing only $1,473 per year, when students attending for-profit colleges for the same program can get up to $9,223. This is akin to state support of instruction in for-profits at nearly twice the state support for community college students!
•Only 8% of eligible competitive Cal Grant students who apply are currently receiving awards.
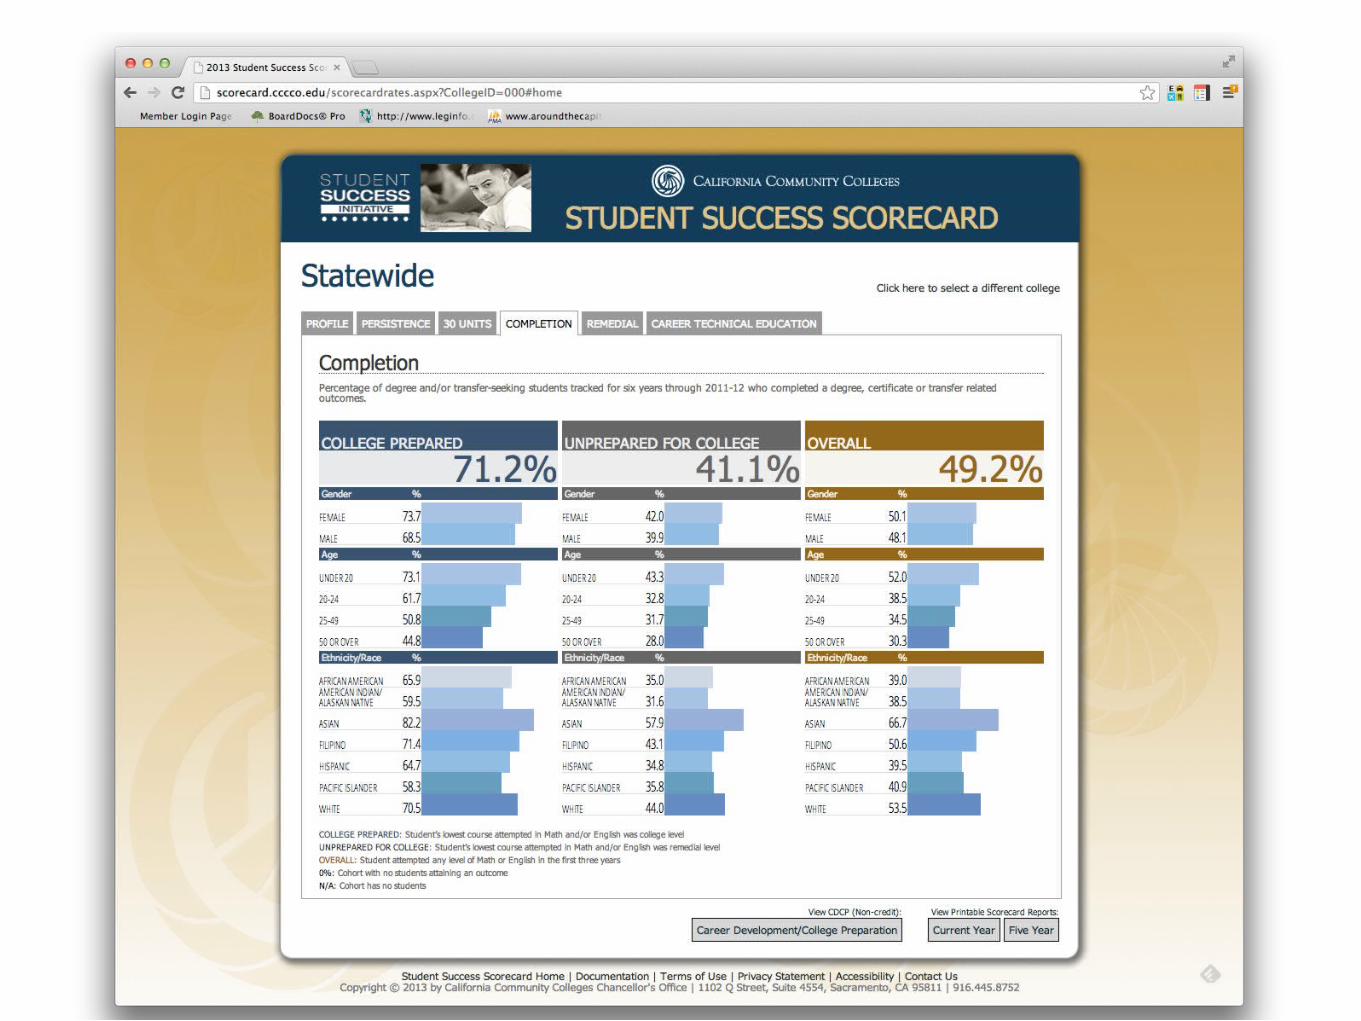
• Supermajority of students are placing in lengthy remedial sequences, and only 25.9% in math and 38.9% in English complete sequence and college-level course.
Four Years of Change
•SB 1440 transfer degrees
•Significant reduction in “recreational” courses or “lifelong learning.”
•Drop of 469,000 headcount.(2.2 FTES/headcount to 2.0 FTES/headcount)
•Limits on community college repeatability.
•Priority registration (forthcoming).
The Era of Internal
Change
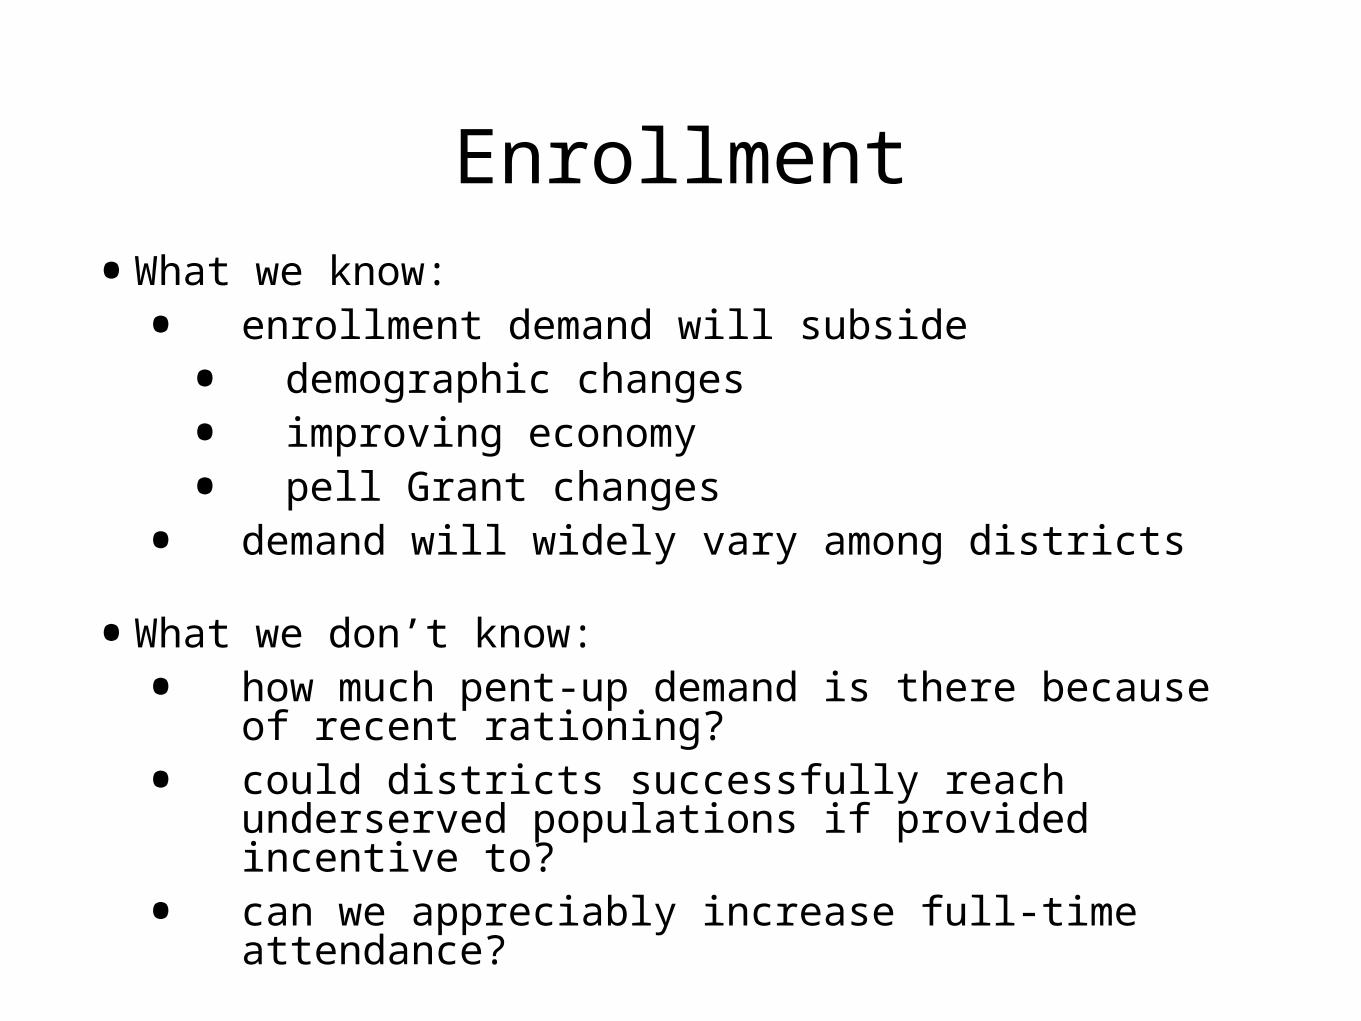
Enrollment
•What we know:
• enrollment demand will subside
• demographic changes
• improving economy
• pell Grant changes
• demand will widely vary among districts
•What we don’t know:
• how much pent-up demand is there because of recent rationing?
• could districts successfully reach underserved populations if provided incentive to?
• can we appreciably increase full-time attendance?
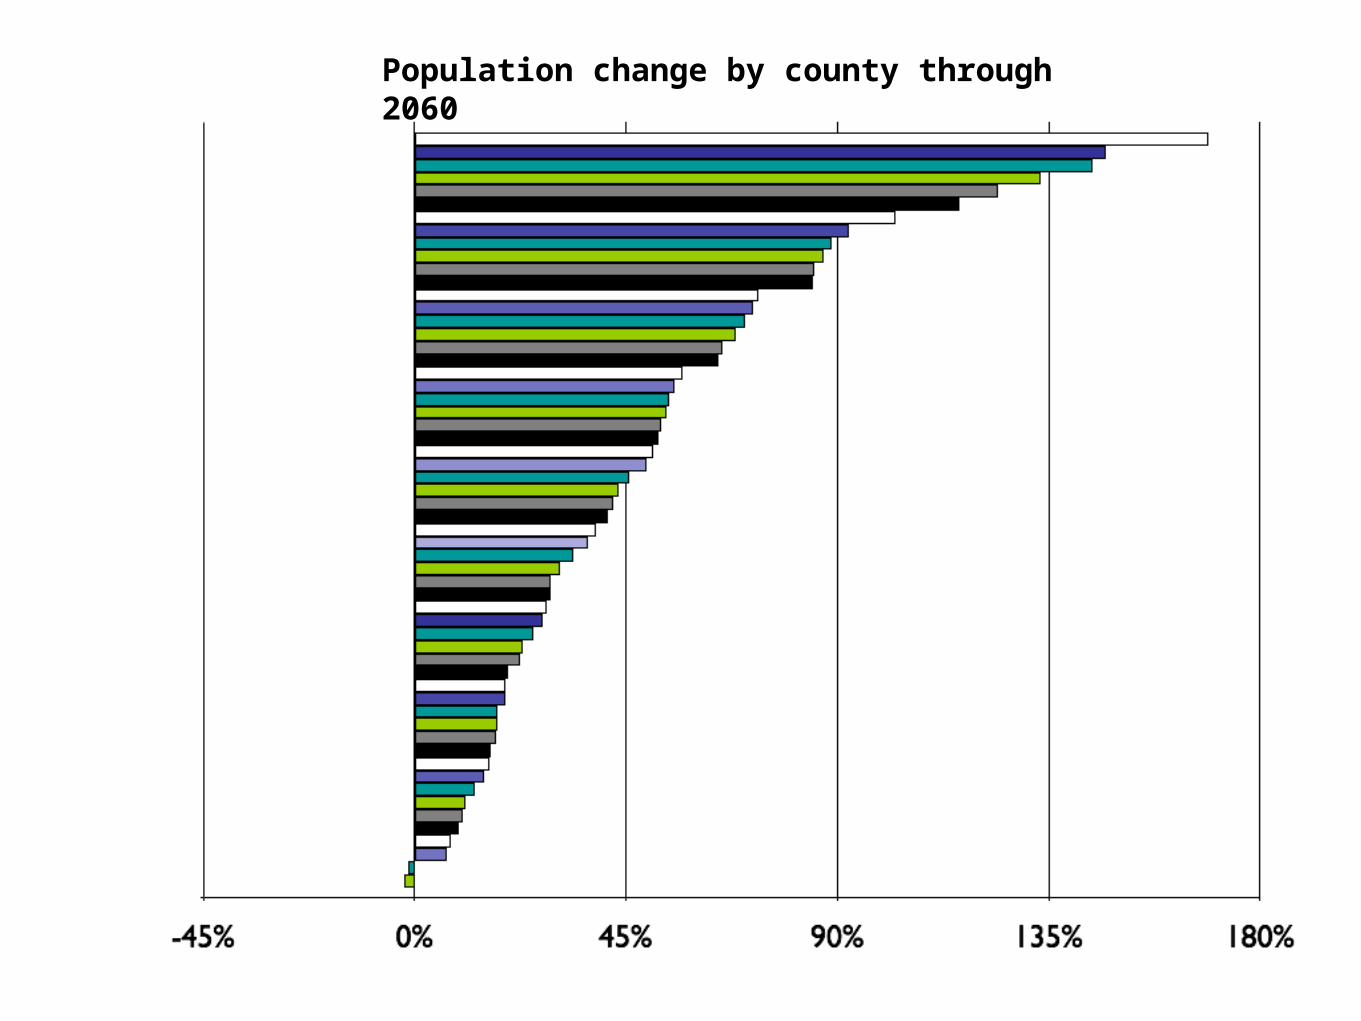
Population change by county through 2060
Our Focus•Boldly and bluntly confront the issue of
equity in higher educational opportunity.
•Fight for the financial aid resources to enable all students ability to attend full-time.
•Reduce the number of students needed remediation through pre-assessment review, K-12 articulation, and alternatives to traditional basic skills sequence.

Download presentation at scottlay.com