Embed Size (px)
Citation preview
Communications of the Association for Information Systems
Volume 28 Article 30
5-2011
Look Before You Leap into ERP Implementation:An Object-Oriented Approach to Business ProcessModelingParag KosalgeMIS, Seidman College of Business, Grand Valley State University, [email protected]
Debabroto ChatterjeeDepartment of Management Information Systems, Terry College of Business, University of Georgia
Follow this and additional works at: https://aisel.aisnet.org/cais
This material is brought to you by the AIS Journals at AIS Electronic Library (AISeL). It has been accepted for inclusion in Communications of theAssociation for Information Systems by an authorized administrator of AIS Electronic Library (AISeL). For more information, please [email protected].
Recommended CitationKosalge, Parag and Chatterjee, Debabroto (2011) "Look Before You Leap into ERP Implementation: An Object-Oriented Approachto Business Process Modeling," Communications of the Association for Information Systems: Vol. 28 , Article 30.DOI: 10.17705/1CAIS.02830Available at: https://aisel.aisnet.org/cais/vol28/iss1/30
Volume 28 Article 30
Look Before You Leap into ERP Implementation: An Object-Oriented Approach to Business Process Modeling
Parag Kosalge
MIS, Seidman College of Business, Grand Valley State University
Debabroto Chatterjee
Department of Management Information Systems, Terry College of Business, University of Georgia
Procedural due diligence is critical for effective adoption and use of enterprise systems. Such procedural review needs to be holistic, capturing both the mechanistic aspects of process workflows as well as the human behavioral influences. Traditional methodologies offer little guidance on how to capture the human dimension of business processes. This article draws upon the Object Oriented (OO) concepts to propose and validate an approach that simultaneously models the content of the process flows and the human behavioral context. The two companies that served as test sites greatly benefited from using this process modeling approach. The analysis results gave these companies—that were on the verge of full-scale Enterprise Resources Planning (ERP) implementation—reason to pause and reevaluate their current state of affairs. Keywords: Object Oriented, process modeling, business process management, Enterprise Systems, Enterprise Resources Planning, behavioral influences, causal patterns
Volume 28, Article 30, pp. 509-536, May 2011
The manuscript was received 10/5/2009 and was with the authors 7 months for 2 revisions.
Look Before You Leap into ERP Implementation: An Object-Oriented Approach to Business Process Modeling
Look Before You Leap into ERP Implementation: An Object-Oriented Approach to Business Process Modeling
510 Volume 28 Article 30
I. INTRODUCTION
Most companies face significant obstacles and challenges in adopting and using Enterprise Resource Planning (ERP) systems. The implementation failure rate is high and the sunk costs run in the millions of dollars [Tchokogué et al., 2005; Rettig, 2007]. While there is no magic formula for improving the success rate, there are some guiding principles and best practices that companies would do well to follow. One such critical principle is a thorough evaluation of relevant processes to be supported by one or more modules of the ERP system. The proverbial saying that ―applying technology to an inefficient process will magnify the inefficiency‖ aptly captures the importance of rigorous process due diligence prior to making ERP adoption and implementation plans. Such procedural due diligence needs to be holistic in its orientation, going beyond workflow assessment and reengineering to include the evaluation of attitudes and motivations of people that support those processes. In other words, it is important to recognize that the success of a process (or a set of processes) is dependent not only on how streamlined it is or the kind of technology used to automate or support it but also on the people responsible for managing and executing it. For instance, variance in customer support services despite representatives going through the same training and having access to the same resources (such as relevant databases) can be attributed to behavioral issues. Similarly, the production efficiency and cost savings realized from using the same ERP system can vary across companies because of contextual factors such as the skill-sets and experience of employees, behavioral orientations and stereotypes, and the reward systems in place. Thus, modeling the presence and influence of these human factors is critical.
Unfortunately, traditional process evaluation methodologies, tools, and techniques tend to focus only on modeling process content, i.e., the specific tasks, activities, and workflows relating to a business process or set of processes [Hess and Oesterle, 1996; Recker et al., 2009]. This is not surprising, given the difficulty involved in identifying and examining the influence of the human behavioral factors. Disillusionment with traditional process analysis led many researchers [Marchand et al., 2000; Legare, 2002; Recker et al., 2009] and practitioners [Wentz, 2000; Grant, 2002; Dillard et al., 2005] to push for modeling the influence of the human behavior. This study responds to the call by developing and testing a more holistic modeling approach that focuses on the people/human dimension of the process. The fundamental research question is: How can the human element of the business process be systematically captured, understood, and integrated with the process content to make sound ERP related decisions?
Conceptualizing organizational roles and functions in terms of objects where each object is made up of three layers—Know What, Know How, and Know Why—the proposed Object Oriented Process Modeling (OOPM) methodology attempts to capture not only the mechanistic aspects of a process (i.e., the workflows and associated rules and logic) but also behavioral factors (such as stereotypes, mindsets, and attitudes) that are likely to influence process performance and outcome. An incremental four-step process comprised of (a) identifying key objects, (b) modeling mechanical process flows using the swim lane technique, (c) capturing human influences using cause–effect linkages, and (d) integrating the mechanistic and humanistic factors using the swim lane technique, is used to discern the real reasons underlying satisfactory or unsatisfactory organizational performance.
Considering the relative newness of the methodology and the need to conduct in-depth examination, the appropriateness of the organizational context and the willingness to participate were the two critical selection criteria. The two companies selected were of similar size, operating in the same industry, and experiencing the same dilemma of whether to invest in an ERP system or not. To enhance the integrity and reliability of the data collection method and the data collected, a variety of tests were conducted for construct validity, internal validity, reliability, and external validity.
This holistic approach to process modeling unearthed patterns and trends that were not evident from the traditional approaches deployed earlier. The findings gave two companies—that were on the verge of jumping into full-scale ERP implementation—reason to pause and revaluate their current state of affairs. One company decided to restructure its process controls before taking the leap, while another postponed its ERP implementation plans until completion of major restructuring of roles, responsibilities, and process flows.
The article begins with a review of the literature. This is followed by a discussion of the theory underlying the proposed modeling approach. The next section presents the methodology and analysis details. This is followed by a discussion of findings, contributions, and limitations. The article concludes with a brief review of the research.
Volume 28 Article 30 511
II. LITERATURE REVIEW
ERP systems represent technological means to improve operating and decision-making processes. At the heart of such a system is a centralized repository or database that feeds the various functional applications designed to meet business needs. By replacing numerous and disjointed applications and databases, it reduces the costs and inefficiencies associated with maintaining fragmented and incompatible systems. More importantly, it can improve the flow of information within and across organizations resulting in benefits such as timely execution of orders, greater planning accuracy, and superior customer service [Davenport, 1998; Scott, 2000]. Adoption of such complex pieces of software often require major changes in organizational processes, structure, and culture [Davenport, 1998; Robey et al., 2002; Law and Ngai, 2007]. For example, at IBM Credit [Hammer and Champy, 1993], a loan application had to pass through several departments and people before getting approved or rejected. It was through process modeling that one was able to identify the existing workflow and make necessary changes to streamline the application review process. Traditional process modeling methodologies (such as ARIS which comes bundled with SAP, a leading ERP product) are widely used for detecting such deficiencies (or weaknesses) in a process flow. They focus on the mechanistic dimension of the process, i.e., workflows and related rules and logic.
However, the influence of the ―human‖ factor or dimension (such as mindsets, attitudes, beliefs, and motivations) is not captured by these modeling tools. This is a major shortcoming as numerous studies find the human element to have a significant influence on process performance. Behavioral orientations and mindsets vary across departments and functions and are often at conflict with each other, resulting in sub-optimal organizational performance [Cooke and Rousseau, 1988]. For instance, people in the sales department tend to be externally focused, with an emphasis on rapid response to customer demands; on the other hand, the production team is generally internally focused and values technical efficiency, cost containment, and gradual change. Grover et al [1995] found that major process problems are primarily due to insufficient understanding of the role of human behavior. Rueylin [2000] traced the causes of technology implementation failure to the attitudes and mindsets of the departments involved. Clemons, Thatcher, and Row [1995] found employees‘ misconception of the organization‘s strategies to be a source of process redesign failure. Zimbardo [2007] demonstrates with an experiment the immediate and immense effect of the human aspects such as roles and responsibilities on the work output in an organization. Gale [2002] examines ERP implementation at three organizations to conclude that successful process automation necessitates a major change in the organizational culture, roles and responsibilities, incentive systems, and performance measurement methods.
It is thus a major shortcoming that the human dimension is not effectively captured by today‘s process modeling methodologies [Cooper and Markus, 1995; Grint and Willcocks, 1995; Hendry, 1995; Willcocks and Smith, 1995; Hess and Oesterle, 1996; Teng et al., 1996; Gaboury, 1999; Wentz, 2000] that guide ERP implementations. The purpose of this article is to address this process modeling deficiency by proposing a more holistic methodology using Object Orientation (OO) to simultaneously capture and examine the mechanistic as well as the humanistic dimensions of a business process.
Object Orientation has its origin and roots in software development. An object is essentially a self-contained program that contains both the data and the methods to process the data. Since these objects are developed to perform specific operations, the program development is very specialized and this generally results in high quality. In addition, since these objects can be reused as part of different business applications, one is able to quickly and efficiently build new and complex systems to respond to evolving business needs. OO has successfully addressed issues of software flexibility by having a modular and reusable construction. The same OO principles can possibly drive process flexibility. As OO is used for software requirements engineering, its use in process modeling can help translate process requirements seamlessly into software requirements. This provides the initial impetus for present research to consider OO in a quest to capture the human element of a business process.
Many researchers believe that OO is the best approach to model processes [Henderson-Sellers, 1997, p. 3; Pope, 1997], as it is well suited to model complex behaviors and promises to enable a holistic approach to organizational and systems modeling [Pope, 1997; Wirth et al., 2006]. Jacobson [1995] showed how OO can be used for process redesign by employing the use-case method. On the other hand, Nakatani [1996] provides a variation to this approach, where an entire process is considered as an object. One problem with this approach is finding the right number of business processes as processes are ―infinitely divisible‖ [Davenport, 1993, p. 27]. Other applications of OO concepts to process modeling include the object-oriented Event Process Chains or the oEPC [Scheer, 2000] and the workflow modeling using OO concepts [Sharp and McDermott, 2008]. Wand and Woo [1999] search for new OO rules and semantics derived from ontological definitions specifically for the purpose of modeling business processes. Some important rules they provide are: (1) Only entities that are active should be modeled as objects: a customer can be an object, but not an order. (2) Objects considered to be a part of the system are ―internal‖ objects and have to provide at least one service. (3) A service cannot be ―invoked‖ or ordered by other objects, but requested. An object is sovereign to decide whether to provide the service and how. (4) Often an object class will
512 Volume 28 Article 30
have few or just one instance in an organization. (5) A composite object formed from a combination of these objects needs to have an emergent property—a property not possessed by the individual objects. These concepts for the first time recognize certain aspects of human behavior. However, the researchers stop at providing the rules and do not explain how the human element may be defined or how its influence on a business process may be understood.
In summary, a review of the literature (see Table 1 below) brings out the following key findings and assertions:
1. Understanding the human dimension of a business process is necessary to bring about desired organizational change.
2. Considering the human aspects while implementing the ERP systems is of utmost importance.
3. Contemporary process redesign methodologies have long neglected the process context, particularly the human context.
4. IT improves business performance only when combined with the right behaviors and values as well as competent information management.
5. The dynamics of IT failure are linked to chains of interlinking causes routed deep inside the subculture, attitudes, and mindsets of the interacting departments.
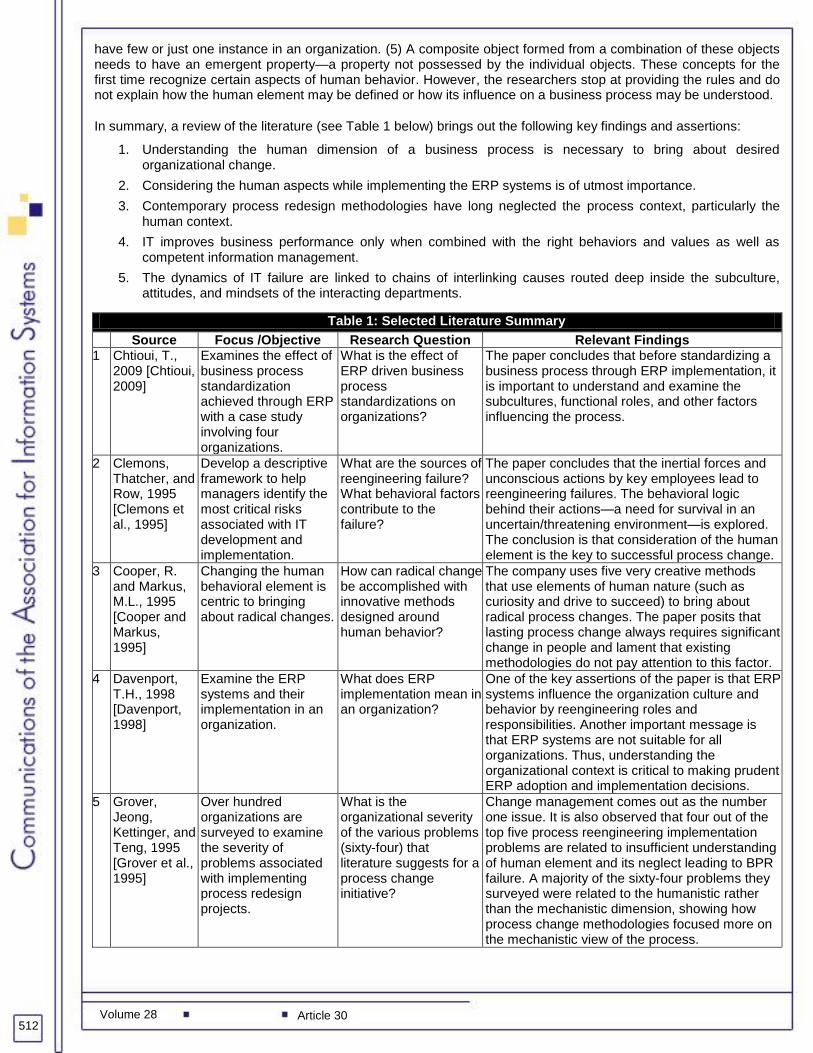
Table 1: Selected Literature Summary
Source Focus /Objective Research Question Relevant Findings 1 Chtioui, T.,
2009 [Chtioui, 2009]
Examines the effect of business process standardization achieved through ERP with a case study involving four organizations.
What is the effect of ERP driven business process standardizations on organizations?
The paper concludes that before standardizing a business process through ERP implementation, it is important to understand and examine the subcultures, functional roles, and other factors influencing the process.
2 Clemons, Thatcher, and Row, 1995 [Clemons et al., 1995]
Develop a descriptive framework to help managers identify the most critical risks associated with IT development and implementation.
What are the sources of reengineering failure? What behavioral factors contribute to the failure?
The paper concludes that the inertial forces and unconscious actions by key employees lead to reengineering failures. The behavioral logic behind their actions—a need for survival in an uncertain/threatening environment—is explored. The conclusion is that consideration of the human element is the key to successful process change.
3 Cooper, R. and Markus, M.L., 1995 [Cooper and Markus, 1995]
Changing the human behavioral element is centric to bringing about radical changes.
How can radical change be accomplished with innovative methods designed around human behavior?
The company uses five very creative methods that use elements of human nature (such as curiosity and drive to succeed) to bring about radical process changes. The paper posits that lasting process change always requires significant change in people and lament that existing methodologies do not pay attention to this factor.
4 Davenport, T.H., 1998 [Davenport, 1998]
Examine the ERP systems and their implementation in an organization.
What does ERP implementation mean in an organization?
One of the key assertions of the paper is that ERP systems influence the organization culture and behavior by reengineering roles and responsibilities. Another important message is that ERP systems are not suitable for all organizations. Thus, understanding the organizational context is critical to making prudent ERP adoption and implementation decisions.
5 Grover, Jeong, Kettinger, and Teng, 1995 [Grover et al., 1995]
Over hundred organizations are surveyed to examine the severity of problems associated with implementing process redesign projects.
What is the organizational severity of the various problems (sixty-four) that literature suggests for a process change initiative?
Change management comes out as the number one issue. It is also observed that four out of the top five process reengineering implementation problems are related to insufficient understanding of human element and its neglect leading to BPR failure. A majority of the sixty-four problems they surveyed were related to the humanistic rather than the mechanistic dimension, showing how process change methodologies focused more on the mechanistic view of the process.
Volume 28 Article 30 513
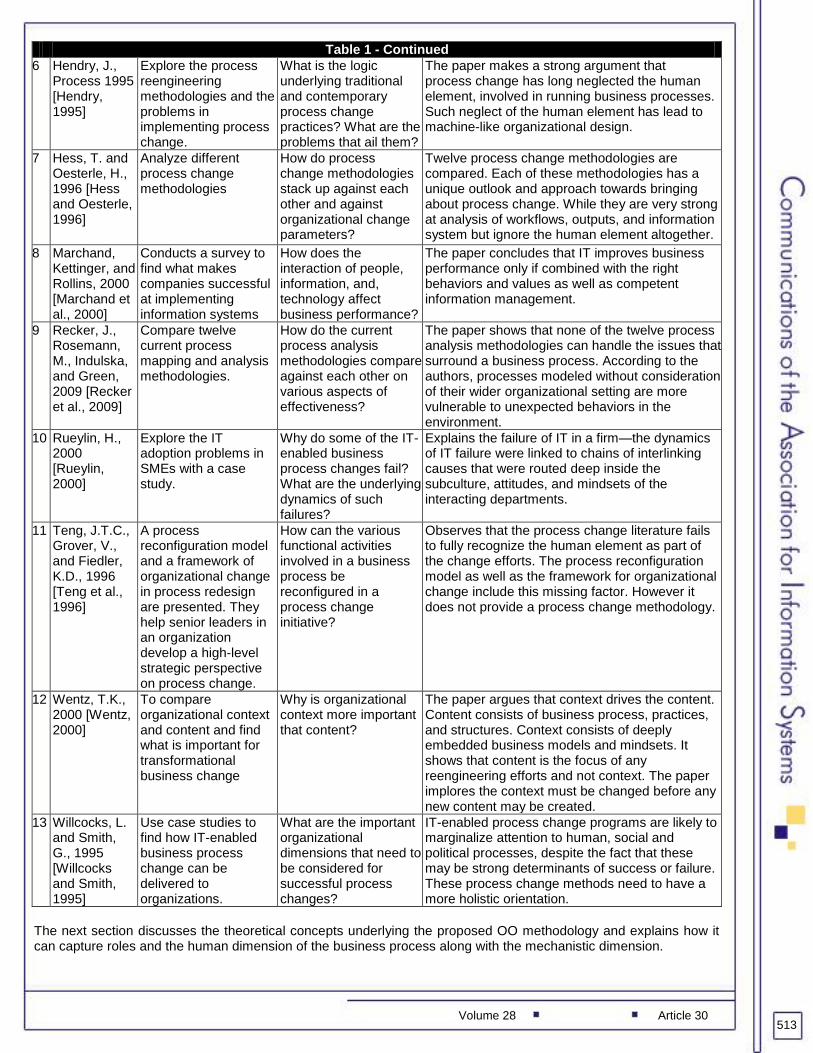
Table 1 - Continued
6 Hendry, J., Process 1995 [Hendry, 1995]
Explore the process reengineering methodologies and the problems in implementing process change.
What is the logic underlying traditional and contemporary process change practices? What are the problems that ail them?
The paper makes a strong argument that process change has long neglected the human element, involved in running business processes. Such neglect of the human element has lead to machine-like organizational design.
7 Hess, T. and Oesterle, H., 1996 [Hess and Oesterle, 1996]
Analyze different process change methodologies
How do process change methodologies stack up against each other and against organizational change parameters?
Twelve process change methodologies are compared. Each of these methodologies has a unique outlook and approach towards bringing about process change. While they are very strong at analysis of workflows, outputs, and information system but ignore the human element altogether.
8 Marchand, Kettinger, and Rollins, 2000 [Marchand et al., 2000]
Conducts a survey to find what makes companies successful at implementing information systems
How does the interaction of people, information, and, technology affect business performance?
The paper concludes that IT improves business performance only if combined with the right behaviors and values as well as competent information management.
9 Recker, J., Rosemann, M., Indulska, and Green, 2009 [Recker et al., 2009]
Compare twelve current process mapping and analysis methodologies.
How do the current process analysis methodologies compare against each other on various aspects of effectiveness?
The paper shows that none of the twelve process analysis methodologies can handle the issues that surround a business process. According to the authors, processes modeled without consideration of their wider organizational setting are more vulnerable to unexpected behaviors in the environment.
10 Rueylin, H., 2000 [Rueylin, 2000]
Explore the IT adoption problems in SMEs with a case study.
Why do some of the IT-enabled business process changes fail? What are the underlying dynamics of such failures?
Explains the failure of IT in a firm—the dynamics of IT failure were linked to chains of interlinking causes that were routed deep inside the subculture, attitudes, and mindsets of the interacting departments.
11 Teng, J.T.C., Grover, V., and Fiedler, K.D., 1996 [Teng et al., 1996]
A process reconfiguration model and a framework of organizational change in process redesign are presented. They help senior leaders in an organization develop a high-level strategic perspective on process change.
How can the various functional activities involved in a business process be reconfigured in a process change initiative?
Observes that the process change literature fails to fully recognize the human element as part of the change efforts. The process reconfiguration model as well as the framework for organizational change include this missing factor. However it does not provide a process change methodology.
12 Wentz, T.K., 2000 [Wentz, 2000]
To compare organizational context and content and find what is important for transformational business change
Why is organizational context more important that content?
The paper argues that context drives the content. Content consists of business process, practices, and structures. Context consists of deeply embedded business models and mindsets. It shows that content is the focus of any reengineering efforts and not context. The paper implores the context must be changed before any new content may be created.
13 Willcocks, L. and Smith, G., 1995 [Willcocks and Smith, 1995]
Use case studies to find how IT-enabled business process change can be delivered to organizations.
What are the important organizational dimensions that need to be considered for successful process changes?
IT-enabled process change programs are likely to marginalize attention to human, social and political processes, despite the fact that these may be strong determinants of success or failure. These process change methods need to have a more holistic orientation.
The next section discusses the theoretical concepts underlying the proposed OO methodology and explains how it can capture roles and the human dimension of the business process along with the mechanistic dimension.
514 Volume 28 Article 30
AAnn oorrggaanniizzaattiioonnaall oobbjjeecctt
Know What (Responsibilities, inputs, outputs) Know How (Mechanistic dimension of process) Know Why (Humanistic dimension of process)
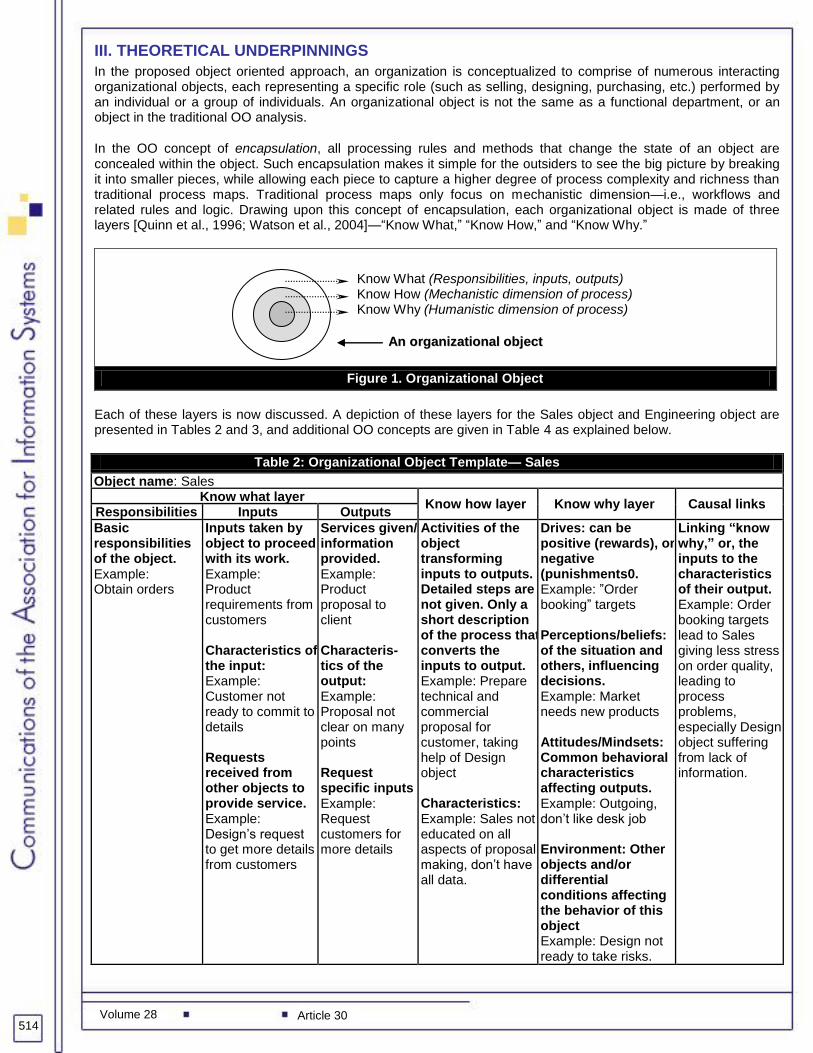
III. THEORETICAL UNDERPINNINGS
In the proposed object oriented approach, an organization is conceptualized to comprise of numerous interacting organizational objects, each representing a specific role (such as selling, designing, purchasing, etc.) performed by an individual or a group of individuals. An organizational object is not the same as a functional department, or an object in the traditional OO analysis.
In the OO concept of encapsulation, all processing rules and methods that change the state of an object are concealed within the object. Such encapsulation makes it simple for the outsiders to see the big picture by breaking it into smaller pieces, while allowing each piece to capture a higher degree of process complexity and richness than traditional process maps. Traditional process maps only focus on mechanistic dimension—i.e., workflows and related rules and logic. Drawing upon this concept of encapsulation, each organizational object is made of three layers [Quinn et al., 1996; Watson et al., 2004]—―Know What,‖ ―Know How,‖ and ―Know Why.‖
Figure 1. Organizational Object
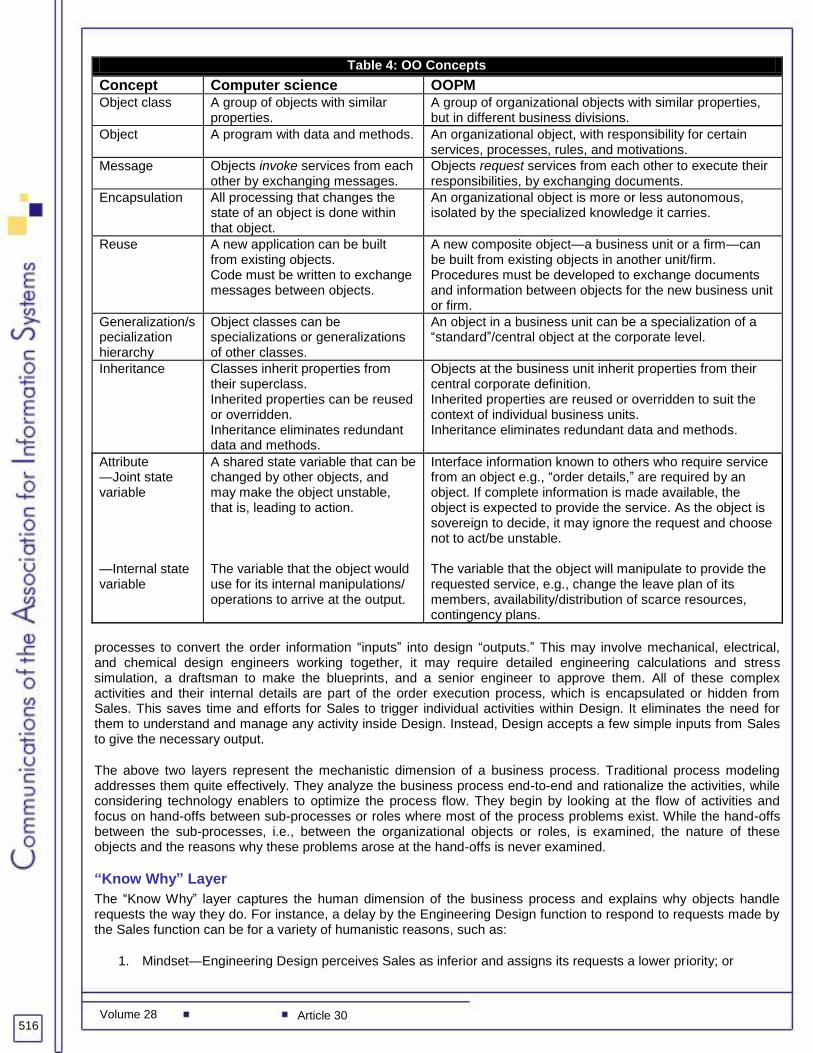
Each of these layers is now discussed. A depiction of these layers for the Sales object and Engineering object are presented in Tables 2 and 3, and additional OO concepts are given in Table 4 as explained below.
Table 2: Organizational Object Template— Sales
Object name: Sales Know what layer
Know how layer Know why layer Causal links Responsibilities Inputs Outputs
Basic responsibilities of the object. Example: Obtain orders
Inputs taken by object to proceed with its work. Example: Product requirements from customers Characteristics of the input: Example: Customer not ready to commit to details Requests received from other objects to provide service. Example: Design‘s request to get more details from customers
Services given/ information provided. Example: Product proposal to client Characteris-tics of the output: Example: Proposal not clear on many points Request specific inputs Example: Request customers for more details
Activities of the object transforming inputs to outputs. Detailed steps are not given. Only a short description of the process that converts the inputs to output. Example: Prepare technical and commercial proposal for customer, taking help of Design object Characteristics: Example: Sales not educated on all aspects of proposal making, don‘t have all data.
Drives: can be positive (rewards), or negative (punishments0. Example: ‖Order booking‖ targets Perceptions/beliefs: of the situation and others, influencing decisions. Example: Market needs new products Attitudes/Mindsets: Common behavioral characteristics affecting outputs. Example: Outgoing, don‘t like desk job Environment: Other objects and/or differential conditions affecting the behavior of this object Example: Design not ready to take risks.
Linking “know why,” or, the inputs to the characteristics of their output. Example: Order booking targets lead to Sales giving less stress on order quality, leading to process problems, especially Design object suffering from lack of information.
Volume 28 Article 30 515
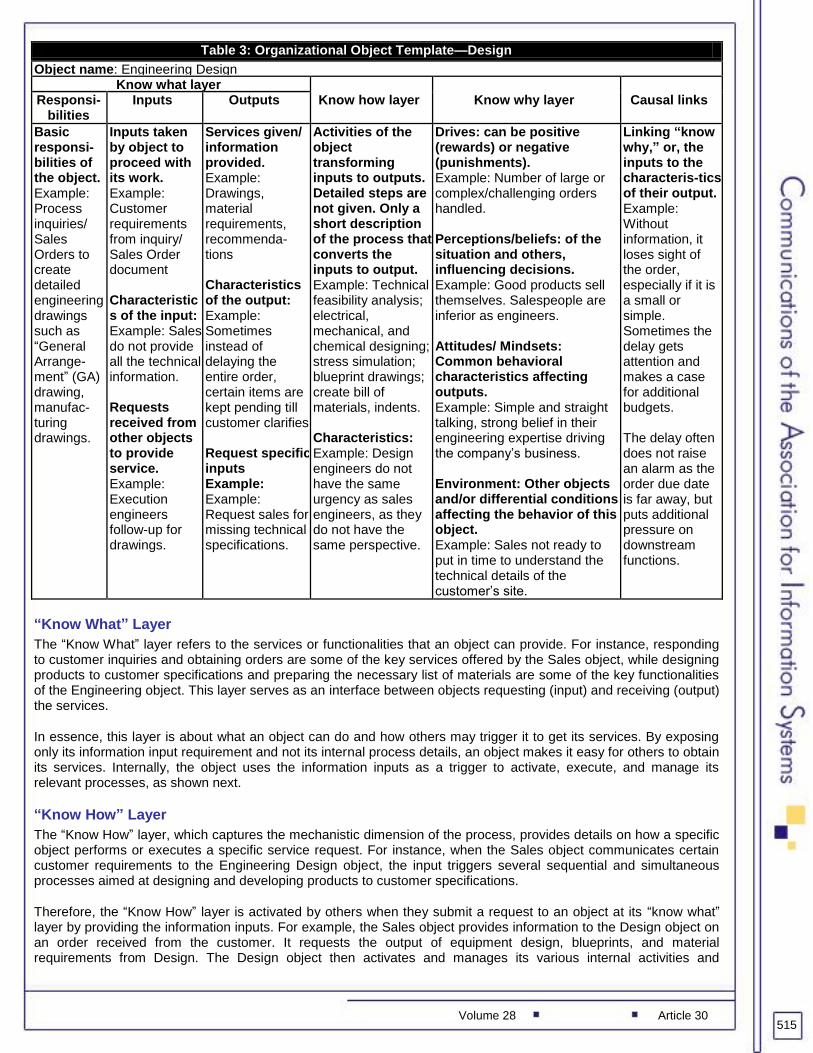
Table 3: Organizational Object Template—Design
Object name: Engineering Design Know what layer
Know how layer Know why layer Causal links Responsi-bilities
Inputs Outputs
Basic responsi-bilities of the object. Example: Process inquiries/ Sales Orders to create detailed engineering drawings such as ―General Arrange-ment‖ (GA) drawing, manufac-turing drawings.
Inputs taken by object to proceed with its work. Example: Customer requirements from inquiry/ Sales Order document Characteristics of the input: Example: Sales do not provide all the technical information. Requests received from other objects to provide service. Example: Execution engineers follow-up for drawings.
Services given/ information provided. Example: Drawings, material requirements, recommenda-tions Characteristics of the output: Example: Sometimes instead of delaying the entire order, certain items are kept pending till customer clarifies. Request specific inputs Example: Example: Request sales for missing technical specifications.
Activities of the object transforming inputs to outputs. Detailed steps are not given. Only a short description of the process that converts the inputs to output. Example: Technical feasibility analysis; electrical, mechanical, and chemical designing; stress simulation; blueprint drawings; create bill of materials, indents. Characteristics: Example: Design engineers do not have the same urgency as sales engineers, as they do not have the same perspective.
Drives: can be positive (rewards) or negative (punishments). Example: Number of large or complex/challenging orders handled. Perceptions/beliefs: of the situation and others, influencing decisions. Example: Good products sell themselves. Salespeople are inferior as engineers. Attitudes/ Mindsets: Common behavioral characteristics affecting outputs. Example: Simple and straight talking, strong belief in their engineering expertise driving the company‘s business. Environment: Other objects and/or differential conditions affecting the behavior of this object. Example: Sales not ready to put in time to understand the technical details of the customer‘s site.
Linking “know why,” or, the inputs to the characteris-tics of their output. Example: Without information, it loses sight of the order, especially if it is a small or simple. Sometimes the delay gets attention and makes a case for additional budgets. The delay often does not raise an alarm as the order due date is far away, but puts additional pressure on downstream functions.
“Know What” Layer
The ―Know What‖ layer refers to the services or functionalities that an object can provide. For instance, responding to customer inquiries and obtaining orders are some of the key services offered by the Sales object, while designing products to customer specifications and preparing the necessary list of materials are some of the key functionalities of the Engineering object. This layer serves as an interface between objects requesting (input) and receiving (output) the services.
In essence, this layer is about what an object can do and how others may trigger it to get its services. By exposing only its information input requirement and not its internal process details, an object makes it easy for others to obtain its services. Internally, the object uses the information inputs as a trigger to activate, execute, and manage its relevant processes, as shown next.
“Know How” Layer
The ―Know How‖ layer, which captures the mechanistic dimension of the process, provides details on how a specific object performs or executes a specific service request. For instance, when the Sales object communicates certain customer requirements to the Engineering Design object, the input triggers several sequential and simultaneous processes aimed at designing and developing products to customer specifications.
Therefore, the ―Know How‖ layer is activated by others when they submit a request to an object at its ―know what‖ layer by providing the information inputs. For example, the Sales object provides information to the Design object on an order received from the customer. It requests the output of equipment design, blueprints, and material requirements from Design. The Design object then activates and manages its various internal activities and
516 Volume 28 Article 30
Table 4: OO Concepts
Concept Computer science OOPM Object class A group of objects with similar
properties. A group of organizational objects with similar properties, but in different business divisions.
Object A program with data and methods. An organizational object, with responsibility for certain services, processes, rules, and motivations.
Message Objects invoke services from each other by exchanging messages.
Objects request services from each other to execute their responsibilities, by exchanging documents.
Encapsulation All processing that changes the state of an object is done within that object.
An organizational object is more or less autonomous, isolated by the specialized knowledge it carries.
Reuse A new application can be built from existing objects.
A new composite object—a business unit or a firm—can be built from existing objects in another unit/firm.
Code must be written to exchange messages between objects.
Procedures must be developed to exchange documents and information between objects for the new business unit or firm.
Generalization/specialization hierarchy
Object classes can be specializations or generalizations of other classes.
An object in a business unit can be a specialization of a ―standard‖/central object at the corporate level.
Inheritance Classes inherit properties from their superclass.
Objects at the business unit inherit properties from their central corporate definition.
Inherited properties can be reused or overridden.
Inherited properties are reused or overridden to suit the context of individual business units.
Inheritance eliminates redundant data and methods.
Inheritance eliminates redundant data and methods.
Attribute —Joint state variable —Internal state variable
A shared state variable that can be changed by other objects, and may make the object unstable, that is, leading to action. The variable that the object would use for its internal manipulations/ operations to arrive at the output.
Interface information known to others who require service from an object e.g., ―order details,‖ are required by an object. If complete information is made available, the object is expected to provide the service. As the object is sovereign to decide, it may ignore the request and choose not to act/be unstable. The variable that the object will manipulate to provide the requested service, e.g., change the leave plan of its members, availability/distribution of scarce resources, contingency plans.
processes to convert the order information ―inputs‖ into design ―outputs.‖ This may involve mechanical, electrical, and chemical design engineers working together, it may require detailed engineering calculations and stress simulation, a draftsman to make the blueprints, and a senior engineer to approve them. All of these complex activities and their internal details are part of the order execution process, which is encapsulated or hidden from Sales. This saves time and efforts for Sales to trigger individual activities within Design. It eliminates the need for them to understand and manage any activity inside Design. Instead, Design accepts a few simple inputs from Sales to give the necessary output.
The above two layers represent the mechanistic dimension of a business process. Traditional process modeling addresses them quite effectively. They analyze the business process end-to-end and rationalize the activities, while considering technology enablers to optimize the process flow. They begin by looking at the flow of activities and focus on hand-offs between sub-processes or roles where most of the process problems exist. While the hand-offs between the sub-processes, i.e., between the organizational objects or roles, is examined, the nature of these objects and the reasons why these problems arose at the hand-offs is never examined.
“Know Why” Layer
The ―Know Why‖ layer captures the human dimension of the business process and explains why objects handle requests the way they do. For instance, a delay by the Engineering Design function to respond to requests made by the Sales function can be for a variety of humanistic reasons, such as:
1. Mindset—Engineering Design perceives Sales as inferior and assigns its requests a lower priority; or
Volume 28 Article 30 517
Organization
Org. Objects Object layers
1. Identify and Describe Organizational Objects 2. Use Swim Lane Technique to Model the Mechanistic Process
3. Model the Humanistic Process using Cause-Effect Links
4. Integrate the Mechanistic Dimension with the Humanistic Dimension
Why
How
What
Why
How
What
Why
How
What
Why
How
What
Cause Effect Cause Effect
Know Why
Know How
Know What
Cause Effect
Why
How
What
Why
How
What
Cause Effect Cause Effect
2. Attitude—it may perceive the request as technically not challenging; or
3. Attention—it is seeking recognition/importance and making the case for higher budget allocations.
4. Inexperience—competitors are luring away experienced employees and thereby reducing the ability of the organization to promptly and effectively respond to customer needs.
According to Homans et. al [1991, p. 95], human behavior is shaped by motivations or sentiments that originate in individual self-interest, which is a major driving force for all action. Self-interest is not just about tangible things like monetary gains, but also intangible emotional gains of attention, respect, prestige, love, power, etc. For instance, driven by a belief that she/he needs to engage in challenging design activities to gain respect, a design engineer might defy the stated product specifications and end up developing something that the customer did not want. In this instance, the humanistic aspect of the process (and not the mechanistic aspect) is to be blamed for not conforming to customer expectations.
Thus, effective execution of a service request is not always a function of the processes that are in place; the individuals also play a key part. The ―Know Why‖ layer captures the human element and its effect. The cascading effect of such interactions can be seen, for instance, when the object Sales, driven by sales targets, leaves important details vague while finalizing an order. This affects performance of the Engineering Design object, which delays order processing, thereby decreasing time available for downstream operations. Product Testing being the last in line, gets squeezed and compromised as it is under pressure to ship the goods on time, leading to on-site product failures and an unhappy customer. Such interactions and impacts are unobservable in traditional process maps.
An object-oriented process modeling (OOPM) approach to understand and model business processes provides a more holistic view of business operations as it models the mechanistic process along with its human dimension. The concepts borrowed from object orientation are used here with some important modifications, as they now capture human interaction instead of interaction between inanimate blocks of code. These differences are noted in Table 4. OOPM was implemented in two different organizations on the verge of implementing an enterprise system to address issues with their business processes. Traditional process analysis with process maps failed to explain why the processes worked the way they did. OOPM surfaced the issues at the root of the problem located in the human dimension of the process. The new understanding led the organizations to reevaluate their plans for process change. The next section details the OOPM method.
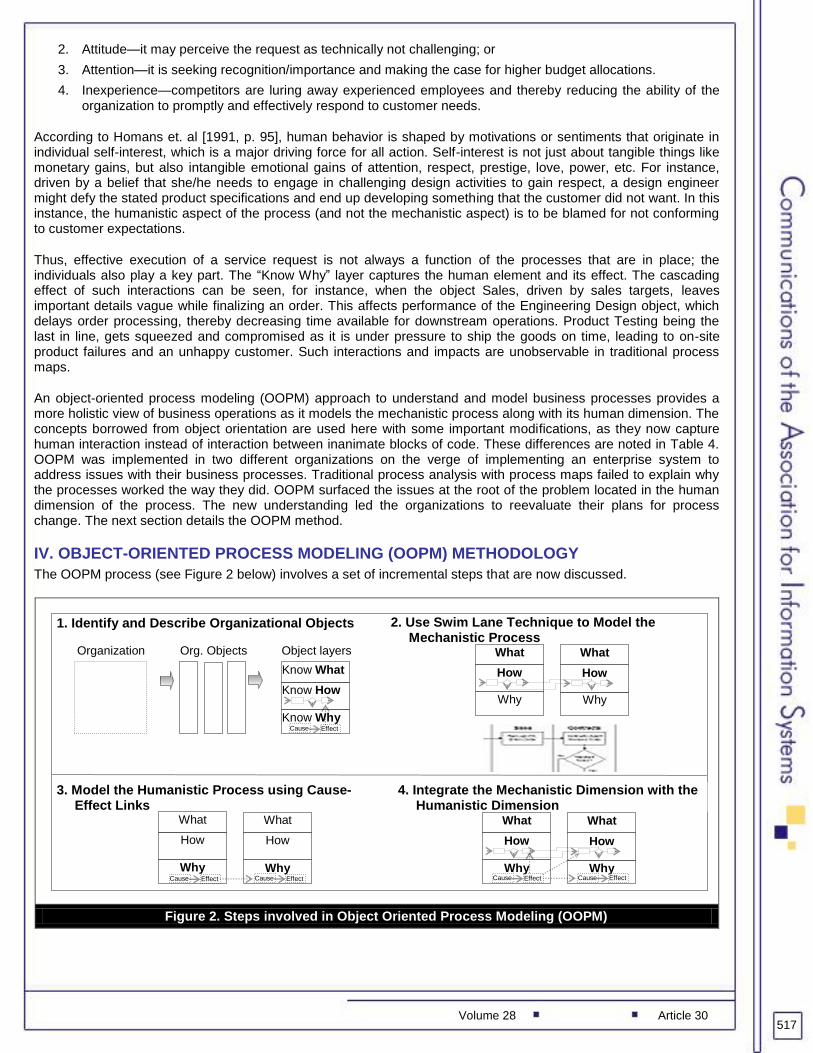
IV. OBJECT-ORIENTED PROCESS MODELING (OOPM) METHODOLOGY
The OOPM process (see Figure 2 below) involves a set of incremental steps that are now discussed.
Figure 2. Steps involved in Object Oriented Process Modeling (OOPM)
518 Volume 28 Article 30
Step 1: Identify and Describe the Organizational Objects
As stated earlier, each organizational object represents a specific role (such as Sales, Design, Procurement, etc.) being performed by an individual or a group of individuals. For instance the Engineering Design object includes people engaged in Electrical, Chemical, and Mechanical design. Similarly, the Sales object represents people engaged in selling different product lines—products and projects. It is important to ensure that people with similar roles and responsibilities are mapped under the same object. For example, the engineering design department may include design engineers as well as quality-control engineers. This department will map into two objects: design object and quality-control object, as quality-control engineers have a different role and responsibility compared to the design engineers.
Once the objects are discerned, each needs to be described in terms of the three encapsulation layers:
• the services each object provides (―Know What‖ layer)
• the work-flow involved in the execution of these services (―Know How‖ layer)
• the influence of human elements on service performance (―Know Why‖ layer)
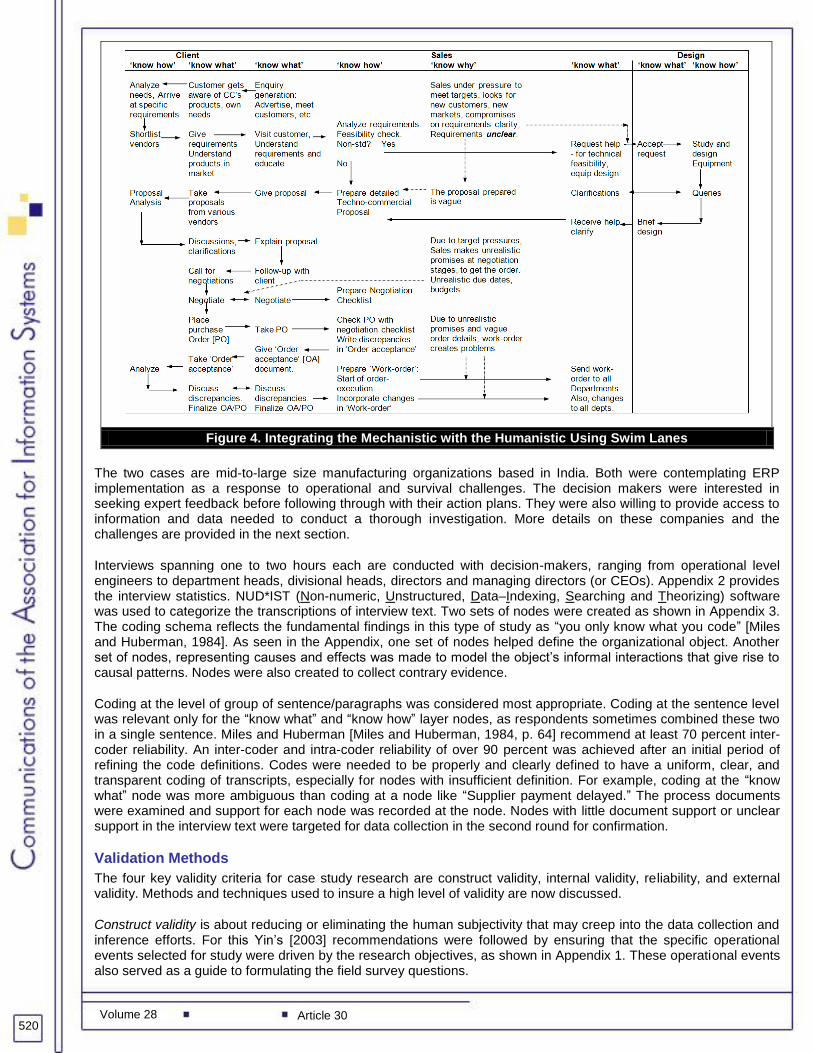
Step 2: Use Swim Lane Technique to Model the Mechanistic Process
The swim lane technique [Fowler and Kendall, 1997] is regularly used by systems developers worldwide to depict the process flow while separating responsibilities and to show which part of the process is automated by which software object. The same technique is now used to effectively model the mechanistic side of the business process as a series of interactions between organizational objects. A swim lane is a commonly used visual representation in process flow diagrams, where vertical lines are drawn on paper to demarcate the domain of a person, a group, or an object. The outcome of this step, i.e., the depiction of process flow, is what traditional process modeling tools and methodologies deliver.
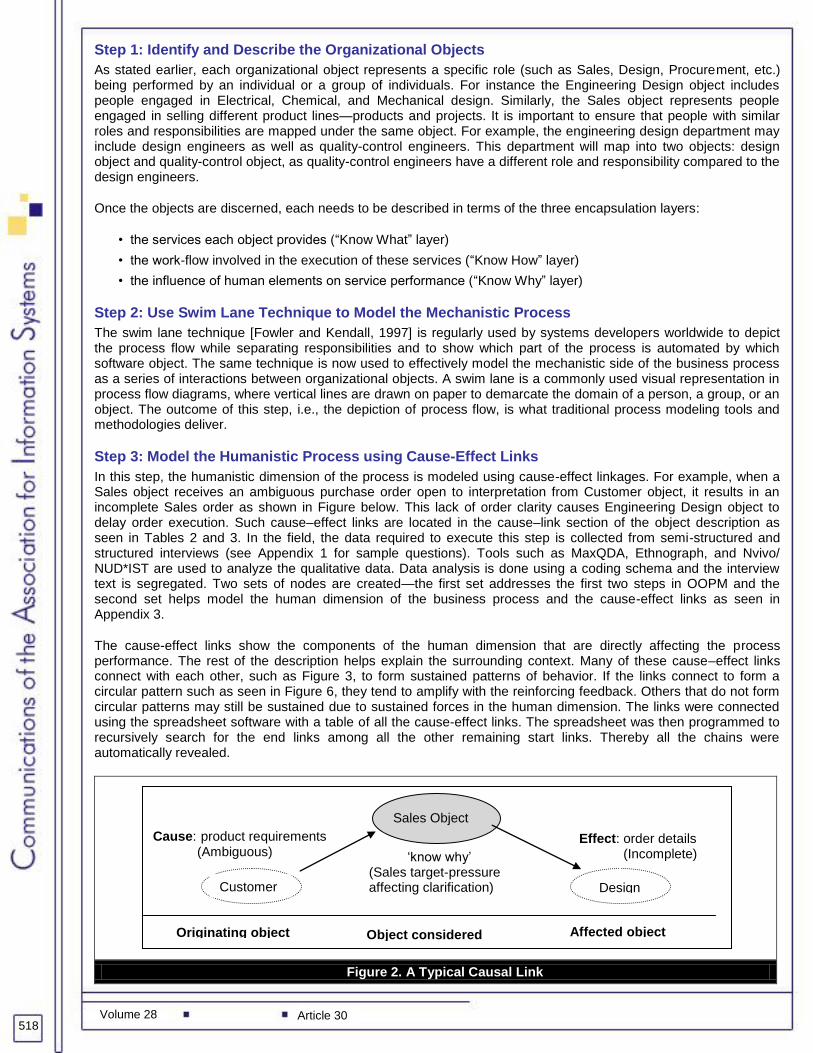
Step 3: Model the Humanistic Process using Cause-Effect Links
In this step, the humanistic dimension of the process is modeled using cause-effect linkages. For example, when a Sales object receives an ambiguous purchase order open to interpretation from Customer object, it results in an incomplete Sales order as shown in Figure below. This lack of order clarity causes Engineering Design object to delay order execution. Such cause–effect links are located in the cause–link section of the object description as seen in Tables 2 and 3. In the field, the data required to execute this step is collected from semi-structured and structured interviews (see Appendix 1 for sample questions). Tools such as MaxQDA, Ethnograph, and Nvivo/ NUD*IST are used to analyze the qualitative data. Data analysis is done using a coding schema and the interview text is segregated. Two sets of nodes are created—the first set addresses the first two steps in OOPM and the second set helps model the human dimension of the business process and the cause-effect links as seen in Appendix 3.
The cause-effect links show the components of the human dimension that are directly affecting the process performance. The rest of the description helps explain the surrounding context. Many of these cause–effect links connect with each other, such as Figure 3, to form sustained patterns of behavior. If the links connect to form a circular pattern such as seen in Figure 6, they tend to amplify with the reinforcing feedback. Others that do not form circular patterns may still be sustained due to sustained forces in the human dimension. The links were connected using the spreadsheet software with a table of all the cause-effect links. The spreadsheet was then programmed to recursively search for the end links among all the other remaining start links. Thereby all the chains were automatically revealed.
Figure 2. A Typical Causal Link
Originating object Object considered Affected object
Cause: product requirements (Ambiguous)
Sales Object
Effect: order details (Incomplete) ‗know why‘
(Sales target-pressure affecting clarification) Design Customer
Volume 28 Article 30 519
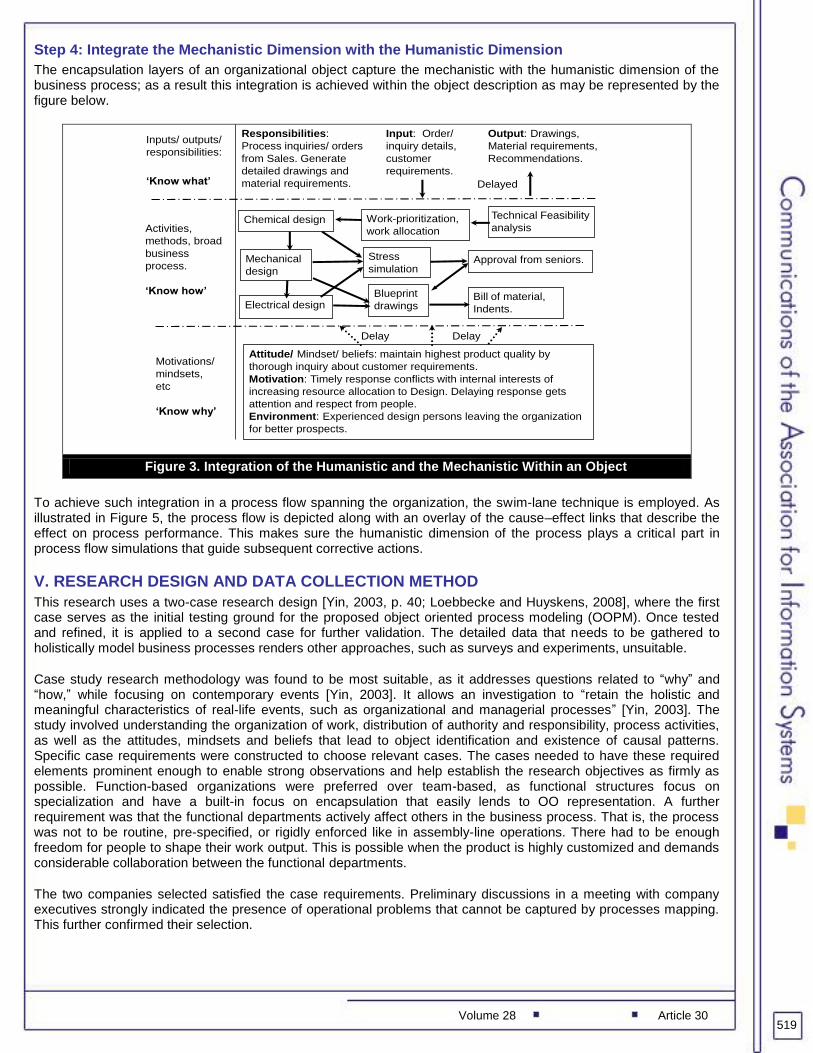
Step 4: Integrate the Mechanistic Dimension with the Humanistic Dimension
The encapsulation layers of an organizational object capture the mechanistic with the humanistic dimension of the business process; as a result this integration is achieved within the object description as may be represented by the figure below.
Responsibilities:
Process inquiries/ orders
from Sales. Generate
detailed drawings and
material requirements.
Mechanical
design
Electrical design
Chemical design
Stress
simulationApproval from seniors.
Technical Feasibility
analysis
Attitude/ Mindset/ beliefs: maintain highest product quality by
thorough inquiry about customer requirements.
Motivation: Timely response conflicts with internal interests of
increasing resource allocation to Design. Delaying response gets
attention and respect from people.
Environment: Experienced design persons leaving the organization
for better prospects.
Blueprint
drawingsBill of material,
Indents.
Work-prioritization,
work allocation
Input: Order/
inquiry details,
customer
requirements.
Output: Drawings,
Material requirements,
Recommendations.
Inputs/ outputs/
responsibilities:
„Know what‟ Delayed
Activities,
methods, broad
business
process.
„Know how‟
Motivations/
mindsets,
etc
„Know why‟
Delay Delay
Figure 3. Integration of the Humanistic and the Mechanistic Within an Object
To achieve such integration in a process flow spanning the organization, the swim-lane technique is employed. As illustrated in Figure 5, the process flow is depicted along with an overlay of the cause–effect links that describe the effect on process performance. This makes sure the humanistic dimension of the process plays a critical part in process flow simulations that guide subsequent corrective actions.
V. RESEARCH DESIGN AND DATA COLLECTION METHOD
This research uses a two-case research design [Yin, 2003, p. 40; Loebbecke and Huyskens, 2008], where the first case serves as the initial testing ground for the proposed object oriented process modeling (OOPM). Once tested and refined, it is applied to a second case for further validation. The detailed data that needs to be gathered to holistically model business processes renders other approaches, such as surveys and experiments, unsuitable.
Case study research methodology was found to be most suitable, as it addresses questions related to ―why‖ and ―how,‖ while focusing on contemporary events [Yin, 2003]. It allows an investigation to ―retain the holistic and meaningful characteristics of real-life events, such as organizational and managerial processes‖ [Yin, 2003]. The study involved understanding the organization of work, distribution of authority and responsibility, process activities, as well as the attitudes, mindsets and beliefs that lead to object identification and existence of causal patterns. Specific case requirements were constructed to choose relevant cases. The cases needed to have these required elements prominent enough to enable strong observations and help establish the research objectives as firmly as possible. Function-based organizations were preferred over team-based, as functional structures focus on specialization and have a built-in focus on encapsulation that easily lends to OO representation. A further requirement was that the functional departments actively affect others in the business process. That is, the process was not to be routine, pre-specified, or rigidly enforced like in assembly-line operations. There had to be enough freedom for people to shape their work output. This is possible when the product is highly customized and demands considerable collaboration between the functional departments.
The two companies selected satisfied the case requirements. Preliminary discussions in a meeting with company executives strongly indicated the presence of operational problems that cannot be captured by processes mapping. This further confirmed their selection.
520 Volume 28 Article 30
Figure 4. Integrating the Mechanistic with the Humanistic Using Swim Lanes
The two cases are mid-to-large size manufacturing organizations based in India. Both were contemplating ERP implementation as a response to operational and survival challenges. The decision makers were interested in seeking expert feedback before following through with their action plans. They were also willing to provide access to information and data needed to conduct a thorough investigation. More details on these companies and the challenges are provided in the next section.
Interviews spanning one to two hours each are conducted with decision-makers, ranging from operational level engineers to department heads, divisional heads, directors and managing directors (or CEOs). Appendix 2 provides the interview statistics. NUD*IST (Non-numeric, Unstructured, Data–Indexing, Searching and Theorizing) software was used to categorize the transcriptions of interview text. Two sets of nodes were created as shown in Appendix 3. The coding schema reflects the fundamental findings in this type of study as ―you only know what you code‖ [Miles and Huberman, 1984]. As seen in the Appendix, one set of nodes helped define the organizational object. Another set of nodes, representing causes and effects was made to model the object‘s informal interactions that give rise to causal patterns. Nodes were also created to collect contrary evidence.
Coding at the level of group of sentence/paragraphs was considered most appropriate. Coding at the sentence level was relevant only for the ―know what‖ and ―know how‖ layer nodes, as respondents sometimes combined these two in a single sentence. Miles and Huberman [Miles and Huberman, 1984, p. 64] recommend at least 70 percent inter-coder reliability. An inter-coder and intra-coder reliability of over 90 percent was achieved after an initial period of refining the code definitions. Codes were needed to be properly and clearly defined to have a uniform, clear, and transparent coding of transcripts, especially for nodes with insufficient definition. For example, coding at the ―know what‖ node was more ambiguous than coding at a node like ―Supplier payment delayed.‖ The process documents were examined and support for each node was recorded at the node. Nodes with little document support or unclear support in the interview text were targeted for data collection in the second round for confirmation.
Validation Methods
The four key validity criteria for case study research are construct validity, internal validity, reliability, and external validity. Methods and techniques used to insure a high level of validity are now discussed.
Construct validity is about reducing or eliminating the human subjectivity that may creep into the data collection and inference efforts. For this Yin‘s [2003] recommendations were followed by ensuring that the specific operational events selected for study were driven by the research objectives, as shown in Appendix 1. These operational events also served as a guide to formulating the field survey questions.
Volume 28 Article 30 521
Since the responses often provided insight into more than one layer of the OOPM methodology, the interview was coded at the sentence level with some sentences coded at multiple nodes. Responses about the ―Know what‖ layer did not have as much descriptive text as the ―know how‖ or the ―know why.‖ As shown in Appendix 1, the first two questions helped explain the ―Know What‖ layer, while the second, third, and forth questions explain the ―Know how.‖ The ―Know why‖ layer was explained using all the remaining questions. As the ―Know why‖ layers deals with drives, perceptions, attitudes, and environmental factors, a series of questions were designed to elicit responses to issues such as responsibility-authority balance, problems in interactions, issues tackled in various meetings, perceptions on the root cause of the problems and how the situation may be corrected.
These guiding questions were pilot tested with two executives. The feedback helped rephrase the questions for better focus and clarity. Two separate rounds of interviews and document collections were conducted at each case site. Additional field questions were selected after the first round of data collection and initial definitions of organizational objects.
Multiple interviews were conducted for each object and related documents examined; the sequence of interviews followed the process flow; and the reports were reviewed by key informants.
In summary, construct validity was insured by doing the following:
1. Multiple interviews were conducted—at least two interviews per object. At least one junior and one senior executive were interviewed to gain different perspectives, insights, and views.
2. About thirty different types of organizational, order processing, and order monitoring documents were examined such as the organization structure, order monitoring plans, invoicing plans, payment schedules, and blank document formats. The researchers had unlimited read-only access to archives of all order-specific documents such as sales orders, purchase orders, minutes of meetings, and a few of the financial records.
3. The sequence of interviews was in sequence with the process flow, helping maintain a chain of evidence on order execution and causal patterns. The second round of interviews targeted the missing links of information in interviews and documents.
4. The interview transcripts were reviewed by key informants to insure accuracy.
5. Finally, a ―processual narrative‖ was developed by pulling together the individual pieces of data/evidence. This narrative was also reviewed by key interviewees to reduce or remove researcher bias.
Internal validity is about ensuring that the causal inferences made are accurate and justified. This validity is best achieved with Pattern-matching logic [Yin, 2003, p. 136], where strong causal inferences can be made if the initial predicted values are found while alternate patterns of predicted values are not found. Also if inconsistent patterns arise, they indicate problems in data collection such as data not collected from everyone/everything involved in the phenomenon. In the present research, a series of event-outcome pairs were linked to each other to create patterns.
Event : Leading to Outcome: Finance delays payment
Supplier delays material
Supplier delays material
Part shipment to customer
Each event can possibly lead to many outcomes, for example ―finance delays payment‖ can lead to errors in payments due to a large time gap in receipt of invoice (bill) and payments. Here only one outcome—delay in Supplier shipping the material—was found in the NUD*IST database. If rival explanations existed, they would appear at the proper nodes in the database. The spreadsheet software was used to automatically connect validated nodes with one another and form chains or causal patterns, thereby reducing researcher error. Causal patterns from the second case site were sought to be matched with practical observations from the first case site. The pattern test was carried out by using the second set of nodes in NUD*IST database that covered such events and outcomes. Each causal link was tested for existence of any contrary evidence as seen in Appendix 3. The present research unearthed consistent causal patterns across the organization even when nodes were created to explicitly capture any evidence to the contrary.
522 Volume 28 Article 30
Sometimes the evidence may not support the initial predictions of outcome and yet support the underlying logic of the research proposition, to provide a theoretical replication [Yin, 2003, pp. 54–60]. Provision was made to capture such evidence by allowing the second case study to have new causal links that were not supported in the first case study, leading to new causal patterns. There were many event–outcome nodes that did not connect. These were considered less significant as they did not lead to any chains or any cascading effects.
Reliability represents the idea of replicability or repeatability of results or observations. In other words, if another investigator conducted the same case study and followed the exact same procedures, she/he should arrive at the same findings and conclusions. Methods to improve reliability in data collection are: A. Use case study protocol, and B. Develop case study database [Yin, 2003, p. 45] as detailed below.
A. Case study protocol consists of
1. Overview of the case study project, such as case study issues and relevant reading on the organization investigated
2. Field procedures, e.g., credentials and access to case study sites, general sources of information
3. Case study questions
4. Guide for the case study report such as outlines, specification of bibliographical information and other documentation
Each of these were covered extensively and are described briefly in this article.
B. Developing a case study database consists of two separate collections.
1. The data or the evidentiary base—raw, categorized data, like the organizational documents and the responses to questions [NUD*IST based]
2. The report of the investigator—consisting of more than 100 pages of process flowcharts, 175 pages of process observations, 125 pages of cause–effect analysis, fifty pages of executive summary, and fifty pages of process change recommendations report submitted to each organization and acknowledgement received.
The extensive use of NUD*IST software to build the database or the evidentiary base ensured an easy and effective separation of raw data from analysis and inferences made in this research.
External validity is about the generalizability of findings. Since a case study relies on analytical generalizations and not statistical generalizations, a theory may be tested by replication of findings in one or two cases [Yin, 2003, p. 43]. The replication need not be literal replication, that is, one need not find exactly identical causal patterns in another organization. It could be theoretical replication where the presence of any causal patterns proves their existence. In this research, the same set of nodes from the first case was carried over to the second case. However, only one of the causal patterns from the first case found exact replication in the second case, while others were specific to those organizations, leading to theoretical replication.
VI. DISCUSSION OF FINDINGS
Insights from the new process modeling approach are preceded by a review of company information and findings from traditional analysis.
BoilerCo
The flagship divisions of BoilerCo were operating at a loss. They had high account receivable balances, i.e., money owed by the customers. The CEO is certain the cause is located somewhere in the order execution and fulfillment process. He felt the solution lay in process improvements and automation. This belief was influenced by recent remedial measures adopted by BoilerCo‘s sister company. These measures took the form of process improvements coupled with the adoption of an ERP system. So the CEO commissions a process study of BoilerCo with the intent of following through with an ERP implementation.
Findings from Traditional Process Analysis
Traditional process analysis with ARIS detected a few procedural weaknesses; for example, the customer order execution processes had too many human touch points that slowed the process. Existing systems that supported/ automated these processes were fragmented and incompatible, and this resulted in re-entering the same data multiple times which, in turn, caused errors and delays. No differentiation was built into the order execution
Volume 28 Article 30 523
process—customer orders for urgent and critical spares followed the same long-drawn route as any other normal order. However, none of these detected problems were significant influences to the operating losses and rising debt balances. This was confirmed by running simulations to assess the extent of impact of the inefficient process flows. Computerization is routinely used in BoilerCo to improve performance; for example, engineers use AutoCAD software to speed up the product design and development process, and sales automation provides similar improvements in customer response time. So using process automation to solve process problems is routine for BoilerCo. So what were the root causes of BoilerCo‘s mounting losses and debt balances? The management was willing to give the new OOPM a try to find answers to their operating woes. The findings from this holistic process modeling approach are presented in the following sub-sections.
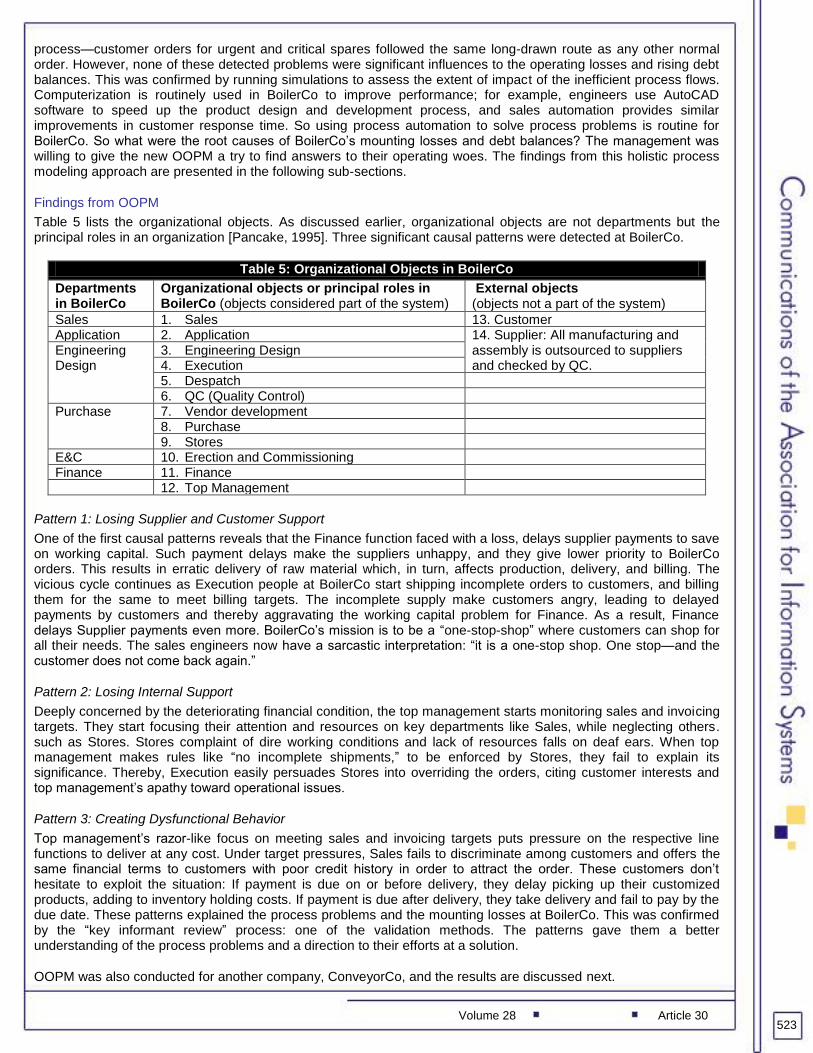
Findings from OOPM
Table 5 lists the organizational objects. As discussed earlier, organizational objects are not departments but the principal roles in an organization [Pancake, 1995]. Three significant causal patterns were detected at BoilerCo.
Table 5: Organizational Objects in BoilerCo
Departments in BoilerCo
Organizational objects or principal roles in BoilerCo (objects considered part of the system)
External objects (objects not a part of the system)
Sales 1. Sales 13. Customer Application 2. Application 14. Supplier: All manufacturing and
assembly is outsourced to suppliers and checked by QC.
Engineering Design
3. Engineering Design 4. Execution 5. Despatch 6. QC (Quality Control)
Purchase
7. Vendor development 8. Purchase 9. Stores
E&C 10. Erection and Commissioning Finance 11. Finance 12. Top Management
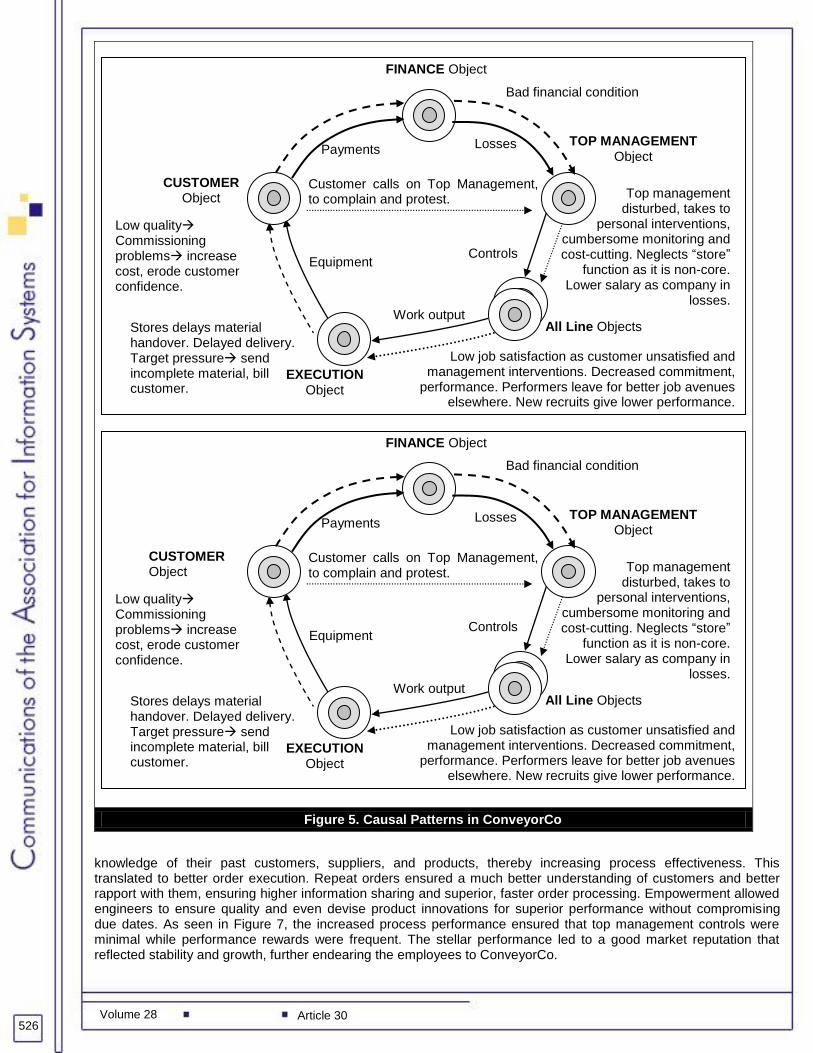
Pattern 1: Losing Supplier and Customer Support
One of the first causal patterns reveals that the Finance function faced with a loss, delays supplier payments to save on working capital. Such payment delays make the suppliers unhappy, and they give lower priority to BoilerCo orders. This results in erratic delivery of raw material which, in turn, affects production, delivery, and billing. The vicious cycle continues as Execution people at BoilerCo start shipping incomplete orders to customers, and billing them for the same to meet billing targets. The incomplete supply make customers angry, leading to delayed payments by customers and thereby aggravating the working capital problem for Finance. As a result, Finance delays Supplier payments even more. BoilerCo‘s mission is to be a ―one-stop-shop‖ where customers can shop for all their needs. The sales engineers now have a sarcastic interpretation: ―it is a one-stop shop. One stop—and the customer does not come back again.‖
Pattern 2: Losing Internal Support
Deeply concerned by the deteriorating financial condition, the top management starts monitoring sales and invoicing targets. They start focusing their attention and resources on key departments like Sales, while neglecting others. such as Stores. Stores complaint of dire working conditions and lack of resources falls on deaf ears. When top management makes rules like ―no incomplete shipments,‖ to be enforced by Stores, they fail to explain its significance. Thereby, Execution easily persuades Stores into overriding the orders, citing customer interests and top management‘s apathy toward operational issues.
Pattern 3: Creating Dysfunctional Behavior
Top management‘s razor-like focus on meeting sales and invoicing targets puts pressure on the respective line functions to deliver at any cost. Under target pressures, Sales fails to discriminate among customers and offers the same financial terms to customers with poor credit history in order to attract the order. These customers don‘t hesitate to exploit the situation: If payment is due on or before delivery, they delay picking up their customized products, adding to inventory holding costs. If payment is due after delivery, they take delivery and fail to pay by the due date. These patterns explained the process problems and the mounting losses at BoilerCo. This was confirmed by the ―key informant review‖ process: one of the validation methods. The patterns gave them a better understanding of the process problems and a direction to their efforts at a solution.
OOPM was also conducted for another company, ConveyorCo, and the results are discussed next.
524 Volume 28 Article 30
ConveyorCo
ConveyorCo is the flagship product division of a group of privately-owned companies. It was founded by a technocrat with a focus on innovative engineering design. The Chief of Engineering Design (ED), expected to be the next CEO, is concerned about the multitude of operational problems facing the company. In the past decade, liberalization policies in India led to a rapid growth in market demand. ConveyorCo‘s sterling reputation made it easy to get new orders and ConveyorCo decided to increase its scale of operations. It rapidly recruited new employees at all levels to take care of the growing number of orders. Soon the organization became too big and unwieldy for a top management accustomed to a small, close-knit, and experienced group of people. To add to the woes, industry recession set in, dramatically shrinking the market size. There were many sellers and too few buyers, and the buyers did not have enough money. Margins reduced and so did average order size and order volume. More effort was required to acquire an order and execute it, leading to an increase in the overhead burden. Understandably, ConveyorCo‘s profits deteriorated. For the first time in its history the company is operating at a loss. However, the ED chief is baffled by an extraordinary deterioration in the performance of their business process; cost overruns, product failures, incomplete order shipments, and delayed shipments are rampant. The company is not accustomed to such problems, as it was reputed for product and service quality. While ERP implementation was envisioned as a potential solution to these operational problems, the expense of ERP is daunting for a medium-sized firm with severe profitability issues. The ED Chief welcomes a study of the operations, hoping to find a cheaper solution.
Findings from Traditional Process Analysis
Traditional process analysis with ARIS showed a few more process problems in ConveyorCo than in BoilerCo. However, the detected procedural weaknesses did not quite explain the dismal operating performance. For instance, one of the key observations was a two-week delay by Design in handing over documents to production. ARIS simulation recommends either reducing the time for the activities through workflow redesign/automation, or hiring more design engineers for the workload. But, this wasn‘t much of a new insight, as manpower shortage is a commonly-known concern in ConveyorCo. So, the company turned to an OOPM based investigation which unearthed some interesting causal patterns.
Findings from OOPM
Table 6 lists the organizational objects found in ConveyorCo. The causal patterns unearthed are described next.
Table 6: Organizational Objects in ConveyorCo
Departments in ConveyorCo
Organizational objects or principal roles in ConveyorCo (objects considered part of the system)
External objects (objects not a part of the system)
Sales 1. Sales 15. Customer 2. Application 16. Supplier
Engineering Design
3. Engineering Design
Works 4. Execution: Project planning and control (PPC) group
5. Vendor development 6. Manufacturing 7. Assembly 8. Despatch 9. Stores 10. Erection and Commissioning
Purchase 11. Purchase QA 12. QA (Quality Assurance) Central Finance 13. Finance 14. Top Management
Pattern 1: Exploiting Supplier Goodwill
Earlier, as ConveyorCo had a good financial situation, supplier payments were made immediately on receiving invoice instead of the contracted thirty-day deferment. It saved Finance object the process of scheduling and monitoring future payments. Today the same Finance object, concerned with profitability, began implementing the supplier payment conditions rigorously to save on working capital. The justification by Finance was, ―in fact, we earned (1.5 million) interest last year. It is important, because it reduces my offer price to customer. If I earn the interest, my G&A (General and Administrative) costs go down.‖ This argument appealed to top management and consequently, payments were no longer made immediately after invoice, but after the contracted number of days—typically thirty. The situation rapidly deteriorated, and payments were being made after sixty to ninety days. Some
Volume 28 Article 30 525
were delayed by as much as 180 days. As a result, ConveyorCo lost Supplier support in its order execution, resulting in delays and incomplete supplies. The Execution department was now faced with delayed shipment, payment penalties, and the ire of the customer as well as top management. Most importantly, Execution faced the prospect of missing their invoicing targets due to ―mistakes of others upstream.‖ Hence they regularly shipped incomplete orders on due-dates and raised invoices for partial orders, promising the missing items soon. The missing items then became the responsibility of the Purchasing department. Once received, the items were rushed to angry customers by any means possible, sometimes even air-lifted. Although such transportation increased shipping costs, it did not hurt anyone‘s target, while creating an impression of ―concern for the customer.‖ As the situation went out of control, organizational performance kept deteriorating.
Pattern 2: Intensive Monitoring and Operational Intervention
As illustrated in Figure 6, top management, disturbed by the deteriorating financial condition, initiated operational monitoring and intervention while increasing pressure on Sales. Increasingly the customers called upon the top management to complain and threaten to sever all ties. It led the top management to take the operational control back into their own hands, especially as they were at the operating level only a few years back when the company was small and close-knit. They distrusted the new hires to be capable enough to deliver what they could. Such operational interventions frustrated line managers, especially when top management chose to reallocate their department‘s work and people without their knowledge or support. This led to poor performance from all the line functions. The lack of job satisfaction and lower compensation due to poor financial health of ConveyorCo led to a rapid departure of experienced performers. It was replaced with inexperienced ones that extracted time from their seniors for training, while providing lower levels of output in terms of quantity as well as quality, leading to rework.
On the other hand, the increased target pressure led Sales to make unrealistic promises to get orders. The unrealistic delivery dates, combined with lack of support from suppliers and a new and inexperienced staff not yet well-integrated into the company, led to delays along the process. As conducting ―cold runs‖ to test the product was the last stage before shipping, it was routinely shortchanged to meet delivery and invoicing targets. Incomplete and untested product reached customer sites, where ConveyorCo‘s erection and commissioning team faced a losing battle and rapidly increasing costs. The cost of correcting an error on-field is ten times that of correcting it before shipping. The poor show in making the equipment work disappointed the customers, who rapidly lost faith in the equipment as well as the company and its engineers. ConveyorCo billed the customer only for the incomplete supply and the remainder billed later. As the customers were looking for performance and not the supply of equipment, they often delayed or even refused payments, especially when their production suffered as a consequence of the delay in getting the equipment to perform. A repeat order was out of the question and Sales required extra efforts and discounts to acquire new customers. With old, repeat customers, it was easy to process an order as their operations were well known to ConveyorCo‘s engineers and there was a level of rapport and trust between the companies that helped order execution. With new customers, the amount of cooperation and information sharing was low, needing more time and efforts to get the right information, sometimes leading to errors on the field. So a new customer, or even a new market certainly did not help with unrealistic delivery dates.
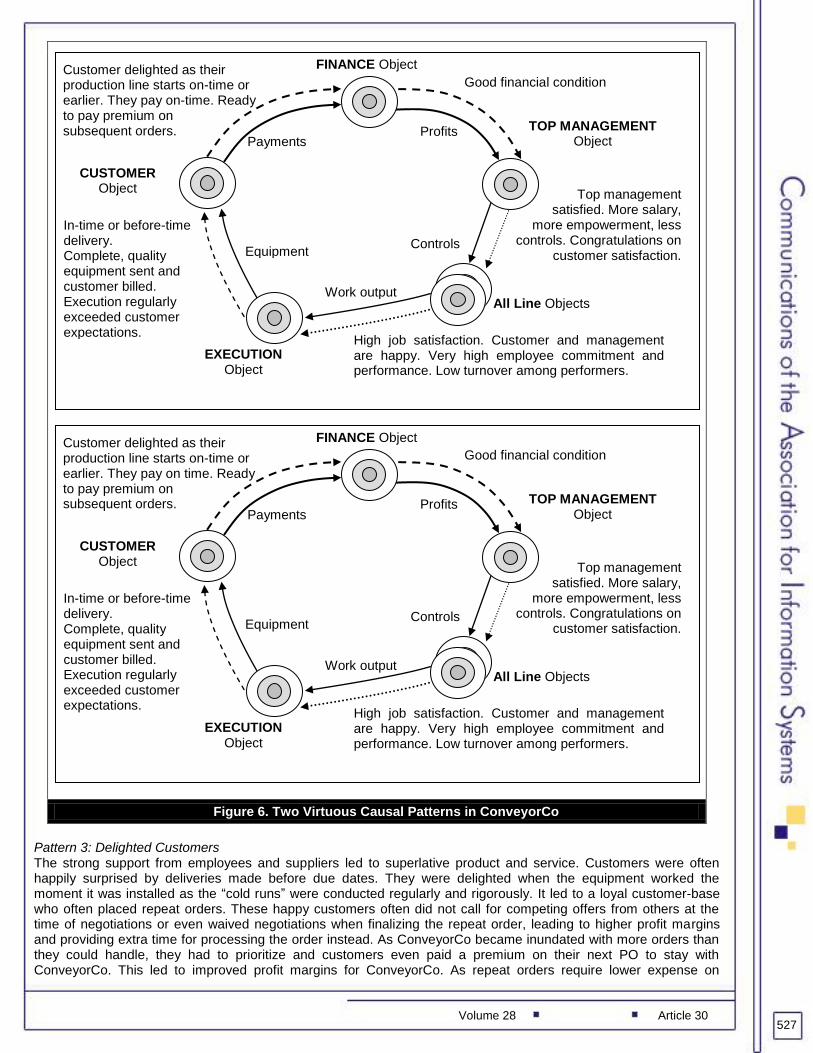
Executives at ConveyorCo often contrasted the current process performance deterioration with stunning process performances just a couple of years back. Therefore, information was collected about the process operations of the past. It excavated several causal patterns that were ―virtuous‖ as described below.
Pattern 1: A Strong Bond with the Suppliers
Until two years ago, customers rewarded ConveyorCo for its innovative products and in turn ConveyorCo rewarded its suppliers who were paid the day after their invoices were rendered—much before the contracted terms of ―net 30‖ (i.e., thirty days after the invoice date). Suppliers were happy and willing, therefore, to help ConveyorCo meet the delivery schedule even when customers changed their requirements. Complete, in-time, and high-quality deliveries endeared customers to ConveyorCo. They not only paid on time, but often paid a premium on their next PO (purchase order) to stay with ConveyorCo. With cash surplus, Finance department was ready to make supplier payments immediately, removing the additional process of scheduling and monitoring future payments. This virtuous pattern led to a leadership position for ConveyorCo.
Pattern 2: High Employee Commitment
Better financial condition and customer satisfaction led to management being generous and rewarding employees for the success. They relaxed their control and provided empowerment, generating a positive work environment, thereby increasing employee commitment and performance. As the engineers remained loyal, ConveyorCo retained
526 Volume 28 Article 30
Figure 5. Causal Patterns in ConveyorCo
knowledge of their past customers, suppliers, and products, thereby increasing process effectiveness. This translated to better order execution. Repeat orders ensured a much better understanding of customers and better rapport with them, ensuring higher information sharing and superior, faster order processing. Empowerment allowed engineers to ensure quality and even devise product innovations for superior performance without compromising due dates. As seen in Figure 7, the increased process performance ensured that top management controls were minimal while performance rewards were frequent. The stellar performance led to a good market reputation that reflected stability and growth, further endearing the employees to ConveyorCo.
Low quality Commissioning problems increase cost, erode customer confidence.
FINANCE Object
TOP MANAGEMENT Object
EXECUTION Object
CUSTOMER Object
All Line Objects
Controls Equipment
Payments
Work output
Low job satisfaction as customer unsatisfied and management interventions. Decreased commitment,
performance. Performers leave for better job avenues elsewhere. New recruits give lower performance.
Customer calls on Top Management, to complain and protest.
Bad financial condition
Losses
Top management disturbed, takes to
personal interventions, cumbersome monitoring and cost-cutting. Neglects ―store‖
function as it is non-core. Lower salary as company in
losses.
Stores delays material handover. Delayed delivery. Target pressure send incomplete material, bill customer.
Volume 28 Article 30 527
Figure 6. Two Virtuous Causal Patterns in ConveyorCo
Pattern 3: Delighted Customers The strong support from employees and suppliers led to superlative product and service. Customers were often happily surprised by deliveries made before due dates. They were delighted when the equipment worked the moment it was installed as the ―cold runs‖ were conducted regularly and rigorously. It led to a loyal customer-base who often placed repeat orders. These happy customers often did not call for competing offers from others at the time of negotiations or even waived negotiations when finalizing the repeat order, leading to higher profit margins and providing extra time for processing the order instead. As ConveyorCo became inundated with more orders than they could handle, they had to prioritize and customers even paid a premium on their next PO to stay with ConveyorCo. This led to improved profit margins for ConveyorCo. As repeat orders require lower expense on
FINANCE Object
TOP MANAGEMENT Object
EXECUTION Object
CUSTOMER Object
All Line Objects
Controls Equipment
Payments
Work output
Top management satisfied. More salary,
more empowerment, less controls. Congratulations on
customer satisfaction.
High job satisfaction. Customer and management are happy. Very high employee commitment and performance. Low turnover among performers.
In-time or before-time delivery. Complete, quality equipment sent and customer billed. Execution regularly exceeded customer expectations.
Customer delighted as their production line starts on-time or earlier. They pay on-time. Ready to pay premium on subsequent orders.
Good financial condition
Profits
FINANCE Object
TOP MANAGEMENT Object
EXECUTION Object
CUSTOMER Object
All Line Objects
Controls Equipment
Payments
Work output
Top management satisfied. More salary,
more empowerment, less controls. Congratulations on
customer satisfaction.
High job satisfaction. Customer and management are happy. Very high employee commitment and performance. Low turnover among performers.
In-time or before-time delivery. Complete, quality equipment sent and customer billed. Execution regularly exceeded customer expectations.
Customer delighted as their production line starts on-time or earlier. They pay on time. Ready to pay premium on subsequent orders.
Good financial condition
Profits
528 Volume 28 Article 30
marketing and order execution due to higher levels of trust and cooperation, it further increased the profit margin. As seen in Figure 7, loyal customers also helped ConveyorCo enter new markets with positive recommendations.
Cross-Case Analysis
Traditional Process Analysis, OOPM, and Process Changes
Both ConveyorCo and BoilerCo failed to recognize the virtuous and vicious patterns and, as a result, failed to manage and nurture them. Interestingly, for both :‖virtuous‖ and ―vicious‖ situations, the mechanistic dimension of the business process had remained unchanged as there were hardly any variation in the dataflow or in the workflow. The change had occurred only in the human dimension of the business process and traditional process analysis with ARIS failed to detect this change. In these engineering organizations, the process problems detected by the traditional process analysis were already known and discussed in their internal meetings. On the other hand, the causal patterns were a revelation to the managers in both the organizations as they sincerely believed they were doing the right thing, especially as their organization rewarded their behavior. This is because the ―know why‖ layer is not well understood or planned and, therefore, may not be aligned with overall organizational objectives. It drives many organizational issues affecting process performance, such as recurrent firefighting, noncooperation between objects, and defiance of rules. These cannot be located by traditional process analysis. Therefore, the steps for correcting the problems in the ―know why‖ layer do not lie in changing process flows, altering resource allocations, or in process automation. Instead changes are required in the work description and the work environment such as policies, rules, and procedures.
Process-related findings prompted ConveyorCo to made extensive changes in the organization structure, personnel, policies, and process flows. For instance, the product line was divided vertically into Product and Projects and the Execution department was centralized for better monitoring. They created a new role, the Business Development Group, located in the head office to approve any new markets or nonstandard orders and to monitor order quality. The ERP implementation was postponed until these changes were well-anchored. On the other hand, BoilerCo, the other case site, began discussions on radically redefining the organization structures, roles, and responsibilities. For the present, however, they significantly increased monitoring and control operations. The company realized that without process controls in place, an ERP implementation was unlikely to be effective. For example, it made sure the supplier payment policies were followed, no incomplete-shipments were made, and minimum order quality was ensured. These process controls were later transferred to the ERP system, which made monitoring and control easier. OOPM helped BoilerCo understand the human dimension and the causal flow underlying their process failures. Now ERP is used to automate the workflow, as well as to monitor and control the dysfunctional human behavior and causal patterns that led to financial loss. The key indicators of these causal patterns: order quality, supplier payments, and incomplete shipments, are as vigorously monitored as other process indicators like order quantity, short-term financial gains, and billing targets.
The long term OOPM recommendation to radically change the objects were put on the backburner by ConveyorCo, as it entailed extensive changes. BoilerCo, on the other hand, went for extensive internal discussions on alternate organizational structures and role definitions. They hired a management consulting firm to guide them in the implementation of these organizational changes over the long run.
Comparison of Causal Patterns
The causal patterns originate in the ―know why‖ layer. One of the causal pattern in BoilerCo was replicated in ConveyorCo, where only a few years ago the same objects had led to virtuous causal patterns. Such virtuous causal patterns were not found in BoilerCo. The reason for this is a change in the humanistic dimensions of the business process. ConveyorCo is in business for about fifteen years. It was founded by a local engineer, a technocrat with some brilliant product innovations and an expertise in manufacturing engineering. The CEO guided a close-knit group of engineers with one objective: deliver uncommon levels of product and service excellence. To do this, they also maintained a close relationship with their local suppliers. It endeared them to their customers, resulting in more business. ConveyorCo in turn made prompt payments to Suppliers in recognition of their support to a start-up firm, thus beginning the virtuous pattern. It was possible to maintain the same motivational drive among all employees as the organization was close-knit, with loosely defined roles. Moreover, ConveyorCo faced a threat to its survival that was known and recognized equally well. In contrast, BoilerCo was established about fifty years ago. It was started by a businessman in a sheltered economy. If it had any virtuous causal patterns at its inception, the records and the people are no longer accessible. Today the focus is more on profits and competing in a global economy. Today, like ConveyorCo, the roles are sharply defined and individual motivations in terms of measures of functional success are institutionalized. They operate in separate environments, have different motivational drives, and do not recognize organizational threats in the same manner.
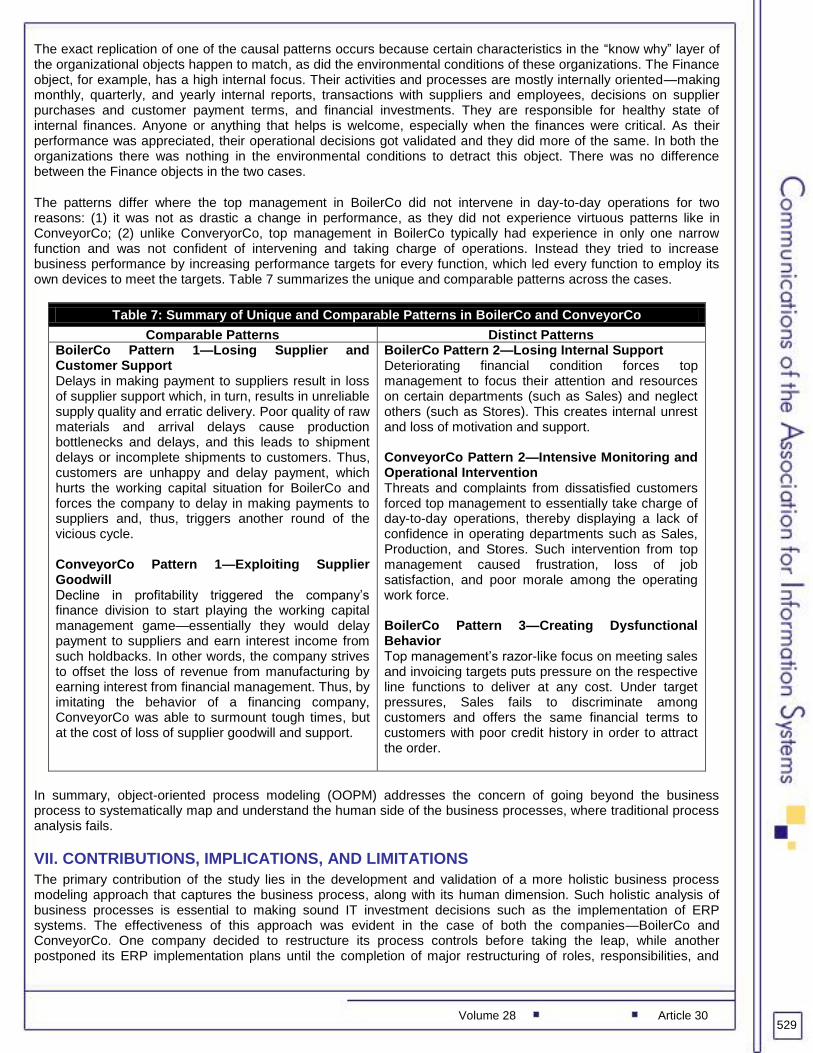
Volume 28 Article 30 529
The exact replication of one of the causal patterns occurs because certain characteristics in the ―know why‖ layer of the organizational objects happen to match, as did the environmental conditions of these organizations. The Finance object, for example, has a high internal focus. Their activities and processes are mostly internally oriented—making monthly, quarterly, and yearly internal reports, transactions with suppliers and employees, decisions on supplier purchases and customer payment terms, and financial investments. They are responsible for healthy state of internal finances. Anyone or anything that helps is welcome, especially when the finances were critical. As their performance was appreciated, their operational decisions got validated and they did more of the same. In both the organizations there was nothing in the environmental conditions to detract this object. There was no difference between the Finance objects in the two cases.
The patterns differ where the top management in BoilerCo did not intervene in day-to-day operations for two reasons: (1) it was not as drastic a change in performance, as they did not experience virtuous patterns like in ConveyorCo; (2) unlike ConveryorCo, top management in BoilerCo typically had experience in only one narrow function and was not confident of intervening and taking charge of operations. Instead they tried to increase business performance by increasing performance targets for every function, which led every function to employ its own devices to meet the targets. Table 7 summarizes the unique and comparable patterns across the cases.
Table 7: Summary of Unique and Comparable Patterns in BoilerCo and ConveyorCo
Comparable Patterns Distinct Patterns BoilerCo Pattern 1—Losing Supplier and Customer Support Delays in making payment to suppliers result in loss of supplier support which, in turn, results in unreliable supply quality and erratic delivery. Poor quality of raw materials and arrival delays cause production bottlenecks and delays, and this leads to shipment delays or incomplete shipments to customers. Thus, customers are unhappy and delay payment, which hurts the working capital situation for BoilerCo and forces the company to delay in making payments to suppliers and, thus, triggers another round of the vicious cycle. ConveyorCo Pattern 1—Exploiting Supplier Goodwill Decline in profitability triggered the company‘s finance division to start playing the working capital management game—essentially they would delay payment to suppliers and earn interest income from such holdbacks. In other words, the company strives to offset the loss of revenue from manufacturing by earning interest from financial management. Thus, by imitating the behavior of a financing company, ConveyorCo was able to surmount tough times, but at the cost of loss of supplier goodwill and support.
BoilerCo Pattern 2—Losing Internal Support Deteriorating financial condition forces top management to focus their attention and resources on certain departments (such as Sales) and neglect others (such as Stores). This creates internal unrest and loss of motivation and support. ConveyorCo Pattern 2—Intensive Monitoring and Operational Intervention Threats and complaints from dissatisfied customers forced top management to essentially take charge of day-to-day operations, thereby displaying a lack of confidence in operating departments such as Sales, Production, and Stores. Such intervention from top management caused frustration, loss of job satisfaction, and poor morale among the operating work force. BoilerCo Pattern 3—Creating Dysfunctional Behavior Top management‘s razor-like focus on meeting sales and invoicing targets puts pressure on the respective line functions to deliver at any cost. Under target pressures, Sales fails to discriminate among customers and offers the same financial terms to customers with poor credit history in order to attract the order.
In summary, object-oriented process modeling (OOPM) addresses the concern of going beyond the business process to systematically map and understand the human side of the business processes, where traditional process analysis fails.
VII. CONTRIBUTIONS, IMPLICATIONS, AND LIMITATIONS
The primary contribution of the study lies in the development and validation of a more holistic business process modeling approach that captures the business process, along with its human dimension. Such holistic analysis of business processes is essential to making sound IT investment decisions such as the implementation of ERP systems. The effectiveness of this approach was evident in the case of both the companies—BoilerCo and ConveyorCo. One company decided to restructure its process controls before taking the leap, while another postponed its ERP implementation plans until the completion of major restructuring of roles, responsibilities, and
530 Volume 28 Article 30
process flows. Thus, this research paves the way for effective business process analysis prior to enterprise systems implementation.
Another contribution lies in overcoming the often-cited limitation of process granularity [Davenport, 1993]. Because numerous processes and sub-processes exist within an organization, it is hard to model these infinite processes and pinpoint those responsible for certain organizational failures or successes. With the OOPM approach, the organizational object serves as a useful and unifying means of identifying and capturing the relevant processes. An organizational object is at the atomic level of the process, where the mechanistic aspect together with the humanistic aspect of the process is indivisible. At this atomic level, changes in the humanistic dimension reinforce changes in mechanistic process flow, making the change relevant and sustainable. Further, as processes and information systems are often deeply intertwined [Seddon et al., 1999], using OO, a set of concepts based in systems design, to design systems as well as business processes, can help improve systems implementation.
A managerial implication of this research is that it enhances the importance of the human component in effective systems implementation efforts. More specifically, it brings to light the need to deploy the right mix of people with appropriate mindset and attitude to manage ERP initiatives. This research is also likely to motivate refinements in process modeling tools and methodologies to effectively capture the humanistic aspects of business processes. For example, the ARIS software used in ERP implementations has the EPC (Event-driven Process Charts) method that has recently adopted OO principles [Scheer, 2000]. So, hopefully this research will motivate the evolution of this software to capture the human element using OOPM.
The limitations of the study fall under two categories: (1) standard or usual limitations associated with qualitative case study research; (2) proposed methodology related limitations. In field studies, data gathering accuracy and completeness can be compromised for a variety of reasons, such as executive turnover, unwillingness to share certain facts and figures, and recency effects (i.e., the inability to accurately recall past events). Data quality can also suffer when interview transcripts are being prepared. While every effort was made to gather high quality data and maintain its integrity, this study did face some of these data collection challenges. The next limitation relates to the applicability and effectiveness of the OOPM methodology as it needs to be tested across different industries, firms of different sizes and ages, and for different IT implementation scenarios. Finally, as per the current version of the methodology, a particular object represents a certain stereotype (or behavioral orientation) that is associated with a certain role (or function). However, such generalization and encapsulation of human behavior fails to capture the effects of change agents who generally transcend stereotypical attitudes and behaviors. Thus, the OOPM approach could benefit from further refinement, testing, and validation.
In conclusion, effective management of business processes is a critical component of successful implementation of enterprise systems. Even though change management and IT implementation literatures strongly recommend consideration of the human dimension, process analysis methodologies consistently failed to address this issue. The human dimension is usually very complex and unstructured, making it difficult to capture, understand, or analyze. The purpose of this article is to develop an approach that can systematically capture the human context of business process flow. To reiterate, in the OO approach, an organization is viewed in terms of various organizational objects interacting with each other. An organizational object is a role played by a group of people who have similar drives and motivations derived from the role definition. The organizational object has three encapsulation layers: ―Know What‖ (responsibility, input, output), ―Know How‖ (internal business processes) and the ―Know Why‖ (drives and motivations); these layers describe the mechanistic and humanistic aspects of the object. When objects interact, they illustrate the mechanistic flow of activities, as well as the causal patterns that are driven by the human side of the business process.
Volume 28 Article 30 531
REFERENCES
Editor’s Note: The following reference list contains hyperlinks to World Wide Web pages. Readers who have the ability to access the Web directly from their word processor or are reading the article on the Web, can gain direct access to these linked references. Readers are warned, however, that:
1. These links existed as of the date of publication but are not guaranteed to be working thereafter. 2. The contents of Web pages may change over time. Where version information is provided in the
References, different versions may not contain the information or the conclusions referenced. 3. The author(s) of the Web pages, not AIS, is (are) responsible for the accuracy of their content. 4. The author(s) of this article, not AIS, is (are) responsible for the accuracy of the URL and version
information.
Chtioui, T. (2009) "Understanding the Impact of ERP Standardization on Business Process Performance‖, International Journal of Business (14)2, pp. 151–162.
Clemons, E.K., M.E. Thatcher, and M.C. Row (1995) "Identifying Sources of Reengineering Failure: A Study of Behavioral Factors Contributing to Reengineering Failure‖, Journal of Information Systems (12)2, pp. 9–36.
Cooke, R.A. and D.M. Rousseau (1988) "Behavioural Norms and Expectations: A Quantitative Approach to the Assessment of Org. Culture", Group & Organisation Studies (13)3, pp. 245–273.
Cooper, R. and M.L. Markus (1995) "Human Reengineering‖, Harvard Business Review (36)4, pp. 39–50.
Davenport, T.H. (1993) Process Innovation, Boston, MA: Harvard Business School Press.
Davenport, T.H. (1998) "Putting the Enterprise into the Enterprise System", Harvard Business Review (76)4, pp. 121–131.
Dillard, J.F., L. Ruchala, and K. Yuthas (2005) "Enterprise Resource Planning Systems: A Physical Manifestation of Administrative Evil‖, International Journal of Accounting Information Systems (6)2, pp. 107–127.
Fowler, M. and S. Kendall (1997) UML Distilled: Applying the Standard Object Modeling Language, Reading, MA: Addison Wesley.
Gaboury, J. (1999) "Context Is Everything‖, IIE Solutions (31)10, p. 4.
Gale, S.F. (2002) "For ERP Success, Create a Culture Change‖, Workforce (81)9, pp. 88–94.
Grant, D. (2002) "A Wider View of Business Process Reengineering‖, Communications of the ACM (45)2, pp. 85–90.
Grint, K. and L. Willcocks (1995) "Business Process Reengineering in Theory and Practice: Business Paradise Regained?" New Technology, Work and Employment (10)2, pp. 99–109.
Grover, V., S.Y. Jeong, W.J. Kettinger, and J.T.C. Teng (1995) "The Implementation of Business Process Reengineering‖, Journal of Management Information Systems (12)1, pp. 109–145.
Hammer, M. and J. Champy (1993) Reengineering the Corporation: A Manifesto for Business Revolution, New York, NY: Harper Business.
Henderson-Sellers, B. (1997) Book of Object-Oriented Knowledge: An Introduction to Object-Oriented Software Engineering, Upper Saddle River, NJ: Prentice Hall.
Hendry, J. (1995) "Process Reengineering and the Dynamic Balance of the Organisation‖, European Management Journal (13)1, pp. 52–57.
Hess, T. and H. Oesterle (1996) "Methods for Business Process Redesign: Current State and Development Perspectives‖, Business Change & Reengineering (3)2, pp. 73–83.
Homans, G.C., A. Hare, and R. Polley (1991) The Human Group, Piscataway, NJ: Transaction Publishers.
Jacobson, I. (1995) The Object Advantage: Business Process Reengineering with Object Technology, Reading, MA: Addison Wesley/ACM.
Law, C.C.H. and E.W.T. Ngai (2007) "ERP Systems Adoption: An Exploratory Study of the Organizational Factors and Impacts of ERP Success‖, Information & Management (44)4, pp. 418–432.
Legare, T.L. (2002) "The Role of Organizational Factors in Realizing ERP Benefits‖, Information Systems Management (19)4, pp. 21–42.
Loebbecke, C. and C. Huyskens (2008) "Item-Level RFID in the Japanese Publishing Industry: A Case Study", Communications of the Association for Information Systems (23)18, pp. 319–332.
532 Volume 28 Article 30
Marchand, D.A., W.J., Kettinger, and J.D. Rollins, (2000) "Information Orientation: People, Technology and the Bottom Line‖, Sloan Management Review (41)4, pp. 69–80.
Miles, M.B. and A.M. Huberman (1984) Qualitative Data Analysis: A Sourcebook of New Methods, Newbury Park, CA: Sage Publications.
Nakatani, K. and S.B. Yadav (1996) "An Extended Object-Oriented Modeling Method for Business Process Reengineering [BPR]", Proceedings of the Second Americas Conference on Information Systems, Phoenix, AZ, pp. 167–169.
Pancake, C.M. (1995) "The Promise and Cost of Object Technology: A Five-Year Forecast", Communications of the ACM. (38)10, pp. 33–49.
Pope, A. (1997) The CORBA Reference Guide: Understanding the Common Object Request Broker Architecture, Reading, MA: Addison Wesley.
Quinn, J.B., P. Anderson, and S. Finkelstein (1996) "Leveraging Intellect‖, The Academy of Management Executive (10)3, pp. 7–24.
Recker, J., et al (2009) "Business Process Modeling—A Comparative Analysis‖, Journal of the Association for Information Systems (10)4, pp. 333–363.
Rettig, C. (2007) "The Trouble with Enterprise Software", MIT Sloan Management Review (49)1, pp. 21–27.
Robey, D., J.W. Ross, and M.C. Boudreau (2002) "Learning to Implement Enterprise Systems: An Exploratory Study of the Dialectics of Change‖, Journal of Management Information Systems (19)1, pp. 17–46.
Rueylin, H. (2000) "Why IT-Enabled Change Fail‖, Working Paper: Centre for e-Business Research, NUS Business School, http://replay.web.archive.org/20030802114313/http://www.bschool.nus.edu.sg/faculty/ds/papers.htm (current May 2, 2011).
Scheer, A.W. (2000) ARIS—Business Process Modeling, Berlin, Germany: Springer Verlag.
Scott, J.E. and L. Kaindl (2000) "Enhancing Functionality in an Enterprise Software Package‖, Information & Management (37)3, pp. 111–122.
Seddon, P.B., et al. (1999) "Dimensions of Information Systems Success‖, Communications of the Association for Information Systems (2)3, pp. 1–39.
Sharp, A. and P. McDermott (2008) Workflow Modeling: Tools for Process Improvement and Applications Development, Norwood, MA: Artech House Publishers.
Tchokogué, A., C. Bareil, and C. Duguay (2005) "Key Lessons from the Implementation of an ERP at Pratt & Whitney Canada‖, International Journal of Production Economics (95)2, pp. 151–163.
Teng, J.T.C., V. Grover, and K.D. Fiedler (1996) "Developing Strategic Perspectives on Business Process Reengineering: From Reconfiguration to Organisational Change‖, Omega (24)3, pp. 271–294.
Wand, Y. and C. Woo (1999) "Ontology-Based Rules for Object-Oriented Enterprise Modeling", Technical Report 99-MIS-001, University of British Colombia, http://replay.web.archive.org/20060810204947/http://mis.sauder.ubc.ca/members/woo/papers/ooem.rules.pdf (current May 2, 2011).
Watson, R.T., G.M. Zinkhan, and L.F. Pitt (2004) "Object-Orientation: A Tool for Enterprise Design‖, California Management Review (46)4, pp. 89–110.
Wentz, T.K. (2000) "Beyond the Barrier of Context‖, IIE Solutions (32)1, pp. 26–31.
Willcocks, L. and G. Smith (1995) "IT-Enabled Business Process Reengineering: Organisational and Human Resource Dimensions‖, Journal of Strategic Information Systems (4)3, pp. 279–301.
Wirth, N., E.T. Hochschule, and S. Zurich (2006) "Good Ideas, Through the Looking Glass [computing history]‖, Computer (39)1, pp. 28–39.
Yin, R. (2003) Case Study Research: Design and Methods, Thousand Oaks, CA: Sage Publications..
Zimbardo, P. (2007) The Lucifer Effect: Understanding How Good People Turn Evil, New York, NY: Random House.
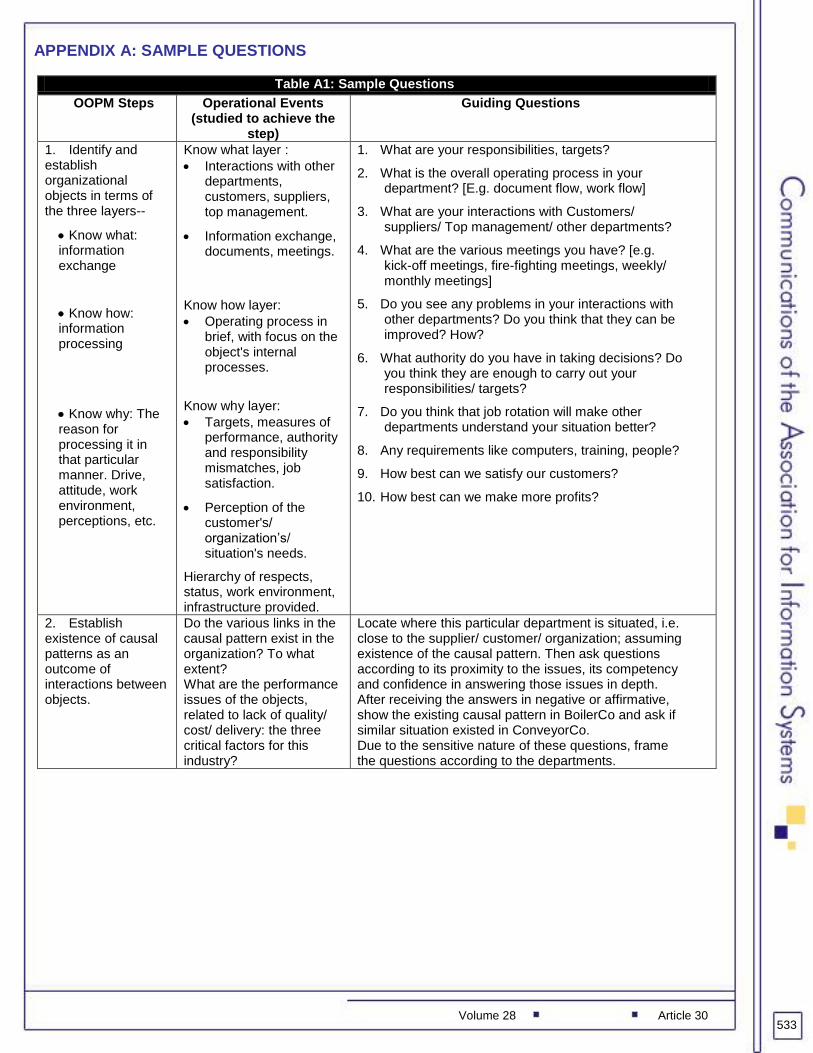
Volume 28 Article 30 533
APPENDIX A: SAMPLE QUESTIONS
Table A1: Sample Questions
OOPM Steps Operational Events (studied to achieve the
step)
Guiding Questions
1. Identify and establish organizational objects in terms of the three layers--
Know what: information exchange
Know how: information processing
Know why: The reason for processing it in that particular manner. Drive, attitude, work environment, perceptions, etc.
Know what layer :
Interactions with other departments, customers, suppliers, top management.
Information exchange, documents, meetings.
Know how layer:
Operating process in brief, with focus on the object's internal processes.
Know why layer:
Targets, measures of performance, authority and responsibility mismatches, job satisfaction.
Perception of the customer's/ organization‘s/ situation's needs.
Hierarchy of respects, status, work environment, infrastructure provided.
1. What are your responsibilities, targets?
2. What is the overall operating process in your department? [E.g. document flow, work flow]
3. What are your interactions with Customers/ suppliers/ Top management/ other departments?
4. What are the various meetings you have? [e.g. kick-off meetings, fire-fighting meetings, weekly/ monthly meetings]
5. Do you see any problems in your interactions with other departments? Do you think that they can be improved? How?
6. What authority do you have in taking decisions? Do you think they are enough to carry out your responsibilities/ targets?
7. Do you think that job rotation will make other departments understand your situation better?
8. Any requirements like computers, training, people?
9. How best can we satisfy our customers?
10. How best can we make more profits?
2. Establish existence of causal patterns as an outcome of interactions between objects.
Do the various links in the causal pattern exist in the organization? To what extent? What are the performance issues of the objects, related to lack of quality/ cost/ delivery: the three critical factors for this industry?
Locate where this particular department is situated, i.e. close to the supplier/ customer/ organization; assuming existence of the causal pattern. Then ask questions according to its proximity to the issues, its competency and confidence in answering those issues in depth. After receiving the answers in negative or affirmative, show the existing causal pattern in BoilerCo and ask if similar situation existed in ConveyorCo. Due to the sensitive nature of these questions, frame the questions according to the departments.

534 Volume 28 Article 30
APPENDIX B: INTERVIEW STATISTICS
BoilerCo Interview Statistics ConveyorCo Interview Statistics
SN Designation Department
Interview
Time
(min) SN Designation Department
Interview
Time
(min)
1 Sr. Manager Sales -HOD 45 1 Manager Sales -HOD 45
2 Manager Sales- local area 45 2 Engineer Sales 75
3 Sr. Engineer Sales- Product 30 3 Sr.Engineer Sales(Application) 100
4 Sr. Engineer Sales- Project 30 4 Cust. relationship off. Sales 30
5 Br. Manager Sales Branch 60 5 Sr.Engineer Sales(Application) 90
6 Sr. Engineer Sales Branch 60 6 Manager Design- HOD 60
7 Sr. Manager Application -HOD 45 7 Dy.Manager Design 45
8 Sr. Engineer Application 60 8 Asst.Manager Design 60
9 Manager Quality Control 30 9 Asst.Manager Design 45
10 Sr. Manager Design -HOD 60 10 Engineer Design--Planning 20
11 Sr. Engineer Design- Mech, Chem 45 11 Asst.Manager Works (PPC) 90
12 Sr. Engineer Design- Electrical 45 12 Sr.Engineer Works (PPC) 120
13 Engineer Design- Mechanical 45 13 Sr.Manager Works --HOD 60
14 Manager Execution 120 14 Sr.Engineer Works (Assembly) 60
15 Sr. Engineer Execution 100 15 Sr.Engineer Works (Assembly) 45
16 Sr. Manager Materials -HOD 45 16 Dy.General Manager Purchase- HOD 60
17 Manager Materials bought-out 120 17 Manager Purchase 30
18 Sr. Engineer Materials fabrication 60 18 Asst.Manager Works(Vendor dev) 60
19 Engineer Stores -Head 90 19 Engineer Works (Stores) 45
20 Engineer Stores 90 20 Asisstant Works (Dispatch) 30
21 Engineer Stores 90 21 Sr.Manager Works (QA) 90
22 Sr. Engineer Despatch 60 22 Engineer Works (QA) 45
23 Engineer Despatch 30 23 Sr.Manager Machine shop 60
24 Manager Service -HOD 45 24 Sr.Manager Finance 45
25 Sr. Engineer Service 45 25 General Manager 60
26 Engineer Service 45
27 Director Finance-- Corporate 30 Avg interview time: 56.40
28 Sr. Manager Finance -HOD 45
29 Manager Finance 90
30 Manager Finance- Branch 45
31 Manager Finance- Branch 45
32 Director Systems- corporate 30
33 Sr. Manager Systems -HOD 90
34 General Manager 60
35 Managing Director 60
36 Owner 30
37 Owner Supplier-1 Fabricator 60
38 Owner Supplier-2 Bought out 60
39 Owner Customer-1 90
40 Managing Director Customer-2 60
Table B1: Interview Statistics
Interviews were conducted in two waves. In the second round, many people were re-interviewed for reasons such as missing or inconsistent data. Thus, the interview time (listed above) includes time taken for conducting first and second round interviews.
HOD = Head of Department PPC = Project Planning and Control = Execution QA = Quality Assurance = Quality Control
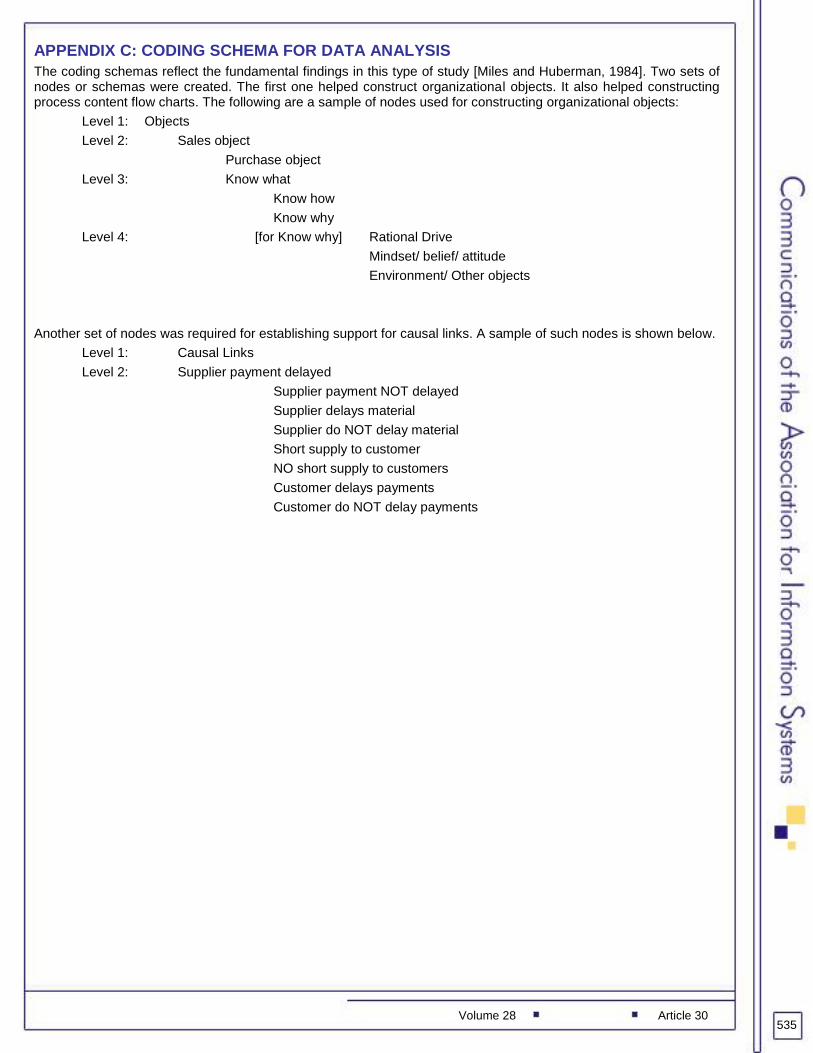
Volume 28 Article 30 535
APPENDIX C: CODING SCHEMA FOR DATA ANALYSIS
The coding schemas reflect the fundamental findings in this type of study [Miles and Huberman, 1984]. Two sets of nodes or schemas were created. The first one helped construct organizational objects. It also helped constructing process content flow charts. The following are a sample of nodes used for constructing organizational objects:
Level 1: Objects
Level 2: Sales object
Purchase object
Level 3: Know what
Know how
Know why
Level 4: [for Know why] Rational Drive
Mindset/ belief/ attitude
Environment/ Other objects
Another set of nodes was required for establishing support for causal links. A sample of such nodes is shown below.
Level 1: Causal Links
Level 2: Supplier payment delayed
Supplier payment NOT delayed
Supplier delays material
Supplier do NOT delay material
Short supply to customer
NO short supply to customers
Customer delays payments
Customer do NOT delay payments
536 Volume 28 Article 30
ABOUT THE AUTHORS
Dr. Parag Kosalge is Associate Professor in Management Information Systems at Grand Valley State University, Michigan. His research focuses on business processes and the application of emerging technologies. This includes understanding business processes, process redesign, enterprise systems, and electronic commerce. His research is published in journals such as Electronic Markets, International Journal of Electronic Business, Journal of Information Technology Management, Journal of Enterprise Information Management, International Journal of Manufacturing Excellence, International Journal of Business Excellence, and various international conferences. He is a recipient of university-wide teaching awards: the Pew Teaching Excellence Award and the Pew Teaching with Technology Award. He has over a decade of industry experience in managing multi-national projects in process reengineering, B2B e-commerce, SAP implementation, and XML databases. He is an SAP-certified application consultant in Project Systems, Sales and Distribution, and Finance Accounting modules.
Dr. Dave Chatterjee is Associate Professor in the Management Information Systems at Terry College of Business, The University of Georgia (UGA). Driven by a mission to positively impact practice, he engages and influences executives through his teaching, writing, talks, and consultations. Much of Dr. Chatterjee‘s work has focused on recognizing and leveraging the strategic value of IT and reducing the disconnect between technical and business people. He has received numerous teaching accolades and honors over the years, such as the Outstanding Executive MBA Professor of the Year and UGA Outstanding Teaching Faculty Honoree. His research has been sponsored by grants from industry and been published in prestigious journals, such as The Wall Street Journal, MIT Sloan Management Review, California Management Review, MIS Quarterly, Journal of Management Information Systems, and the Communications of the ACM. Dr. Chatterjee has been actively involved with the Society of Information Management (SIM) since 2001. He has been the chairman of the SIM Atlanta Chapter since 2008 and served as co-chair of SIMposium 2010, the SIM International Conference. He also serves as the host and conference director of several prestigious IT practitioner conferences, such as the annual CIO Forum and Executive IT Summit in Atlanta. He also served as a judge for the 2010 Georgia CIO of the Year Awards.
Copyright © 2011 by the Association for Information Systems. Permission to make digital or hard copies of all or part of this work for personal or classroom use is granted without fee provided that copies are not made or distributed for profit or commercial advantage and that copies bear this notice and full citation on the first page. Copyright for components of this work owned by others than the Association for Information Systems must be honored. Abstracting with credit is permitted. To copy otherwise, to republish, to post on servers, or to redistribute to lists requires prior specific permission and/or fee. Request permission to publish from: AIS Administrative Office, P.O. Box 2712 Atlanta, GA, 30301-2712, Attn: Reprints; or via e-mail from [email protected].
Volume 28 Article 30
.
ISSN: 1529-3181
EDITOR-IN-CHIEF Ilze Zigurs
University of Nebraska at Omaha
AIS SENIOR EDITORIAL BOARD Guy Fitzgerald Vice President Publications Brunel University
Ilze Zigurs Editor, CAIS
University of Nebraska at Omaha
Kalle Lyytinen Editor, JAIS
Case Western Reserve University
Edward A. Stohr Editor-at-Large Stevens Institute of Technology
Blake Ives Editor, Electronic Publications University of Houston
Paul Gray Founding Editor, CAIS Claremont Graduate University
CAIS ADVISORY BOARD Gordon Davis University of Minnesota
Ken Kraemer University of California at Irvine
M. Lynne Markus Bentley University
Richard Mason Southern Methodist University
Jay Nunamaker University of Arizona
Henk Sol University of Groningen
Ralph Sprague University of Hawaii
Hugh J. Watson University of Georgia
CAIS SENIOR EDITORS Steve Alter University of San Francisco
Jane Fedorowicz Bentley University
Jerry Luftman Stevens Institute of Technology
CAIS EDITORIAL BOARD Monica Adya Marquette University
Michel Avital University of Amsterdam
Dinesh Batra Florida International University
Indranil Bose University of Hong Kong
Thomas Case Georgia Southern University
Evan Duggan University of the West Indies
Mary Granger George Washington University
Åke Gronlund University of Umea
Douglas Havelka Miami University
K.D. Joshi Washington State University
Michel Kalika University of Paris Dauphine
Karlheinz Kautz Copenhagen Business School
Julie Kendall Rutgers University
Nancy Lankton Marshall University
Claudia Loebbecke University of Cologne
Paul Benjamin Lowry Brigham Young University
Sal March Vanderbilt University
Don McCubbrey University of Denver
Fred Niederman St. Louis University
Shan Ling Pan National University of Singapore
Katia Passerini New Jersey Institute of Technology
Jan Recker Queensland University of Technology
Jackie Rees Purdue University
Raj Sharman State University of New York at Buffalo
Mikko Siponen University of Oulu
Thompson Teo National University of Singapore
Chelley Vician University of St. Thomas
Padmal Vitharana Syracuse University
Rolf Wigand University of Arkansas, Little Rock
Fons Wijnhoven University of Twente
Vance Wilson Worcester Polytechnic Institute
Yajiong Xue East Carolina University
DEPARTMENTS Information Systems and Healthcare Editor: Vance Wilson
Information Technology and Systems Editors: Sal March and Dinesh Batra
Papers in French Editor: Michel Kalika
ADMINISTRATIVE PERSONNEL James P. Tinsley AIS Executive Director
Vipin Arora CAIS Managing Editor University of Nebraska at Omaha
Sheri Hronek CAIS Publications Editor Hronek Associates, Inc.
Copyediting by S4Carlisle Publishing Services