Embed Size (px)
Citation preview

Journal of Physics Conference Series
OPEN ACCESS
Long-term variations of muon flux angulardistributionTo cite this article V V Shutenko et al 2013 J Phys Conf Ser 409 012193
View the article online for updates and enhancements
You may also likeMuon flux measurement at China JinpingUnderground LaboratoryZi-yi Guo Lars Bathe-Peters et al
-
Cosmic muon flux measurement andtunnel overburden structure imagingR Han Q Yu Z Li et al
-
3D Anisotropy of Solar Wind TurbulenceTubes or RibbonsAndrea Verdini Roland Grappin OlgaAlexandrova et al
-
This content was downloaded from IP address 1232196544 on 13032022 at 1152
Long-term variations of muon flux angular distribution
V V Shutenko I I Astapov N S Barbashina A N Dmitrieva R P KokoulinK G Kompaniets A A Petrukhin I I YashinNational Research Nuclear University MEPhI Moscow 115409 Russia
E-mail vvshutenkomephiru
Abstract Intensity of the atmospheric muon flux depends on a number of factors energyspectrum of primary cosmic rays (PCR) heliospheric conditions state of the magnetosphereand atmosphere of the Earth The wide-aperture muon hodoscope URAGAN (Moscow Russia557ordm N 377ordm E 173 m asl) makes it possible to investigate not only variations of theintensity of muon flux but also temporal changes of its angular distribution For the analysis ofangular distribution variations the vector of local anisotropy is used The vector of localanisotropy is the sum of individual vectors (directions of the reconstructed muon tracks)normalized to the total number of reconstructed tracks The vector of local anisotropy and itsprojections show different sensitivities to parameters of the processes of modulation of PCR inthe heliosphere and the Earthrsquos magnetosphere and the passage of secondary cosmic raysthrough the terrestrial atmosphere In the work results of the analysis of long-term variationsof hourly average projections of the vector of local anisotropy obtained from the URAGANdata during experimental series of 2007-2011 are presented
1 IntroductionThe first experiments on measurements of the intensity of cosmic rays (CR) on the surface of the Earthshowed the presence of pronounced periodic variations of the intensity Thus in [1] it was noticed thatin the experiments the obvious periods in variations of CR intensity were observed diurnal 27-daysrsquoand annual ones In 1955 Dorman and Feinberg [2] systematized all knowledge on CR variations bythat time In the work [3] on the study of solar diurnal variations of muon component at sea level theanisotropy was understood as amplitudes and phases of the first (24 hour) and the second (12 hour)harmonics in the Fourier analysis of solar diurnal deviations of the intensity averaged over two monthsduring 540 days In the work [4] for the analysis of 24- 12- and 8-hour harmonics of diurnalvariations the data of Deep River neutron monitor during the period from 1981 to 1994 were used
With the development of the first muon hodoscopes TEMP [5] and URAGAN [6] new possibilitiesin the study of variations of cosmic rays were opened In this work the results accumulated withURAGAN which represents the device consisting of four independent supermodules are analyzedEach supermodule consists of eight planes of streamer tubes with resistive cathode blown withAr+CO2+n-pentane mixture On the sides of each plane mutually orthogonal aluminium strips(320+288) which form eight XY-coordinate planes are situated Each supermodule has an area about115 m2 The URAGAN is located on the surface and registers angular distribution of muon flux withthreshold energies from 026 up to 06 GeV over a wide range of zenith angles (0-80ordm) Angularaccuracy of track reconstruction is better than 1ordm The track angular distribution is stored as minutematrixes M with the cells of 1ordm in zenith angle θ and 4ordm in azimuth angle φ The matrix method of
23rd European Cosmic Ray Symposium (and 32nd Russian Cosmic Ray Conference) IOP PublishingJournal of Physics Conference Series 409 (2013) 012193 doi1010881742-65964091012193
Published under licence by IOP Publishing Ltd 1
storage of the information allows carrying out the analysis of angular distribution in various intervalsof zenith and azimuth angles Here for the analysis of long-term variations the hourly average datafor zenith angle interval 25ordm le θ lt 76ordm were used Typical energies of primary protons givingcontribution to muon flux in this range of angles have been estimated the average energy is ~ 80 GeVand the median energy is ~ 60 GeV
2 Vector of local anisotropyFor a long time the basic information for the study of variations of cosmic rays was only the numberof events (counting rate) registered in a detector Thus the data acquisition system of the detector aftereach event practiced only an increment to the counter of events But if the detector allows to obtain avector of a direction of a registered particle it is possible to apply the vector sum The summary vector(vector of local anisotropy) will characterize the angular distribution of registered particles
Projections of the vector of local anisotropy (AX AY AZ) from the initial matrix data M are definedas
1 1( ) cos sin ( ) sin sin
1 ( ) cos ( )
X Y
Z
A M A MN N
A M N MN
q j q j
q j q j
= q j j q = q j j q
= q j q = q j
aringaring aringaring
aringaring aringaring(1)
where θ and φ are the angles corresponding to the matrix cell midpoints M(θ φ) is the number ofrecorded events in a corresponding matrix cell (θ φ) of the matrix M and N is the total number ofevents in the used angular range
When processing experimental data for calculations of values of horizontal projections AX and AYthe source matrixes M without additional barometric and temperature corrections are used Duringcalculations of AZ values of matrix M with barometric corrections are used In the present work axesof coordinates X and Y are directed to the South and to the East correspondingly
Local atmospheric perturbations (thunderstorms showers etc) can influence the angulardistribution of the muon flux Thus in a zone of atmospheric sensitivity (up to 150 km radius)atmospheric pressure and temperature can be strongly inhomogeneous At such moments it isimpossible to obtain correct data on atmospheric pressure and temperature profile It is possible toobserve only how the vector of local anisotropy changes in these events and this is a subject of aseparate study But as a rule atmospheric perturbations are short-term and not regular ones thereforethe vector of local anisotropy gives unique opportunities for the analysis of long-term variations of themuon flux caused by extra-atmospheric processes
3 Time seriesFor the analysis of long-term variations of muon angular distribution hour matrixes of angulardistributions from three supermodules of the URAGAN have been used The vector of localanisotropy was calculated in the range of zenith angles 25ordm le θ lt 76ordm since the data in this range aremore steady in comparison with the range 0ordm le θ lt 76ordm to changes of the detector registrationefficiency which could take place during long-time observation period
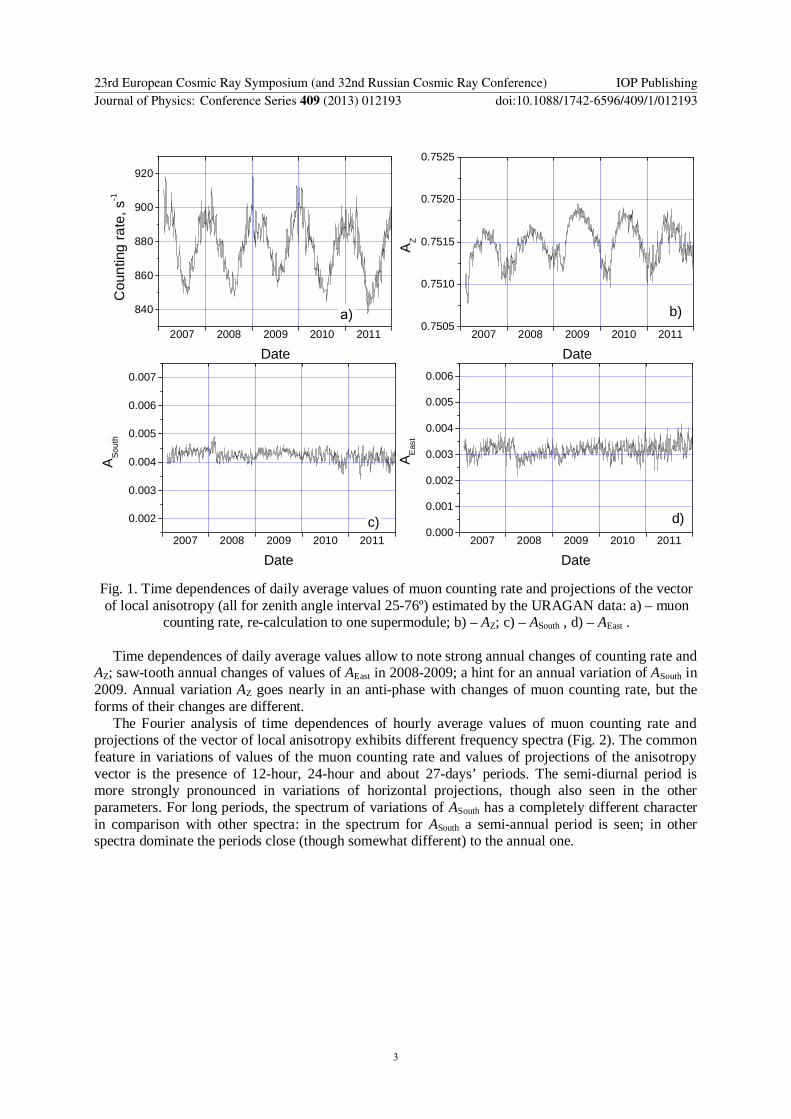
Strong diurnal variations complicate the visual perception therefore in Fig 1 the time dependencesof daily average values of muon counting rate (re-calculated to one supermodule) and of projections ofthe vector of local anisotropy are presented vertical (AZ) and two horizontal ones (to the South - ASouthand to the East - AEast)
23rd European Cosmic Ray Symposium (and 32nd Russian Cosmic Ray Conference) IOP PublishingJournal of Physics Conference Series 409 (2013) 012193 doi1010881742-65964091012193
2
2007 2008 2009 2010 2011
840
860
880
900
920
а)
Cou
ntin
g ra
te s
-1
Date2007 2008 2009 2010 2011
07505
07510
07515
07520
07525
b)
AZ
Date
2007 2008 2009 2010 2011
0002
0003
0004
0005
0006
0007
c)
ASo
uth
Date2007 2008 2009 2010 2011
0000
0001
0002
0003
0004
0005
0006
A Eas
t
Date
d)
Fig 1 Time dependences of daily average values of muon counting rate and projections of the vectorof local anisotropy (all for zenith angle interval 25-76ordm) estimated by the URAGAN data a) ndash muon
counting rate re-calculation to one supermodule b) ndash AZ c) ndash ASouth d) ndash AEast
Time dependences of daily average values allow to note strong annual changes of counting rate andAZ saw-tooth annual changes of values of AEast in 2008-2009 a hint for an annual variation of ASouth in2009 Annual variation AZ goes nearly in an anti-phase with changes of muon counting rate but theforms of their changes are different
The Fourier analysis of time dependences of hourly average values of muon counting rate andprojections of the vector of local anisotropy exhibits different frequency spectra (Fig 2) The commonfeature in variations of values of the muon counting rate and values of projections of the anisotropyvector is the presence of 12-hour 24-hour and about 27-daysrsquo periods The semi-diurnal period ismore strongly pronounced in variations of horizontal projections though also seen in the otherparameters For long periods the spectrum of variations of ASouth has a completely different characterin comparison with other spectra in the spectrum for ASouth a semi-annual period is seen in otherspectra dominate the periods close (though somewhat different) to the annual one
23rd European Cosmic Ray Symposium (and 32nd Russian Cosmic Ray Conference) IOP PublishingJournal of Physics Conference Series 409 (2013) 012193 doi1010881742-65964091012193
3
1 10 10010-8
10-7
10-6
10-5
10-4
10-3
10-2
12
27 182
ASouth
Period day
Pow
er
10-12
10-11
10-10
10-9
10-8
10-7
10-6
10-5
10-4
271
12
1
363
Pow
erCounting rate
1 10 10010-8
10-7
10-6
10-5
10-4
10-3
10-2
12 1 34728
AEast
Period day
Pow
er
10-12
10-11
10-10
10-9
10-8
10-7
10-6
10-5
10-4
29112
369
Pow
er
AZ
Fig 2 Fourier power spectra of time dependences of muon counting rate and of projections of thevector of local anisotropy In the boxes the values of the periods (in days) are specified for
corresponding peaks
4 ConclusionsMuon hodoscopes allow to use for the analysis not only muon counting rate but also angulardistribution of the registered particles As a quantitative characteristic at the study of variations of theangular distribution of the muon flux it is expedient to use the vector of local anisotropy The analysisof variations of the vector of local anisotropy for zenith angle intervals 25ordm le θ lt 76ordm has revealed thepresence of annual semi-annual 27-day diurnal and semi-diurnal variations Variations of the vectorof local anisotropy and muon counting rate have a different character Thus the use of the vector oflocal anisotropy for the analysis extends the possibilities of muon detectors in the studies of thedependence of muon flux on various heliospheric magnetospheric and atmospheric processes
AcknowledgmentsThe research has been performed in Scientific and Educational Centre NEVOD with the support of theFederal Target Program Scientific and Pedagogical Cadres for Innovative Russia the grant of theLeading Scientific School NSh-681720122 and Ministry of Education and Science(contract no 16518117053)
References[1] Wollan E O 1939 Present status of solar and sidereal time variation of cosmic rays Rev Mod
Phys 11 160[2] Dorman L I and Feinberg E L 1958 On the nature of cosmic ray variations Proc of 4th Intern
Cosmic Ray Conf (Guanajuato Mexico) vol 4 pp 393-432[3] Briggs R M et al 1969 Periodic solar time variations in the cosmic-ray muon component near
sea level J Phys A Gen Phys 2 584[4] Mishra R K and Mishra R A 2007 A study of daily variation in cosmic ray intensity during
highlow amplitude days Pramana ndash J Phys 68 407[5] Borog V V et al 1995 Large aperture muon hodoscope for studies in solar-terrestrial physics
Proc 24th ICRC (Rome) vol 4 pp 1291-95[6] Barbashina N S et al 2008 Instruments and Experimental Techniques 51 180
23rd European Cosmic Ray Symposium (and 32nd Russian Cosmic Ray Conference) IOP PublishingJournal of Physics Conference Series 409 (2013) 012193 doi1010881742-65964091012193
4

Long-term variations of muon flux angular distribution
V V Shutenko I I Astapov N S Barbashina A N Dmitrieva R P KokoulinK G Kompaniets A A Petrukhin I I YashinNational Research Nuclear University MEPhI Moscow 115409 Russia
E-mail vvshutenkomephiru
Abstract Intensity of the atmospheric muon flux depends on a number of factors energyspectrum of primary cosmic rays (PCR) heliospheric conditions state of the magnetosphereand atmosphere of the Earth The wide-aperture muon hodoscope URAGAN (Moscow Russia557ordm N 377ordm E 173 m asl) makes it possible to investigate not only variations of theintensity of muon flux but also temporal changes of its angular distribution For the analysis ofangular distribution variations the vector of local anisotropy is used The vector of localanisotropy is the sum of individual vectors (directions of the reconstructed muon tracks)normalized to the total number of reconstructed tracks The vector of local anisotropy and itsprojections show different sensitivities to parameters of the processes of modulation of PCR inthe heliosphere and the Earthrsquos magnetosphere and the passage of secondary cosmic raysthrough the terrestrial atmosphere In the work results of the analysis of long-term variationsof hourly average projections of the vector of local anisotropy obtained from the URAGANdata during experimental series of 2007-2011 are presented
1 IntroductionThe first experiments on measurements of the intensity of cosmic rays (CR) on the surface of the Earthshowed the presence of pronounced periodic variations of the intensity Thus in [1] it was noticed thatin the experiments the obvious periods in variations of CR intensity were observed diurnal 27-daysrsquoand annual ones In 1955 Dorman and Feinberg [2] systematized all knowledge on CR variations bythat time In the work [3] on the study of solar diurnal variations of muon component at sea level theanisotropy was understood as amplitudes and phases of the first (24 hour) and the second (12 hour)harmonics in the Fourier analysis of solar diurnal deviations of the intensity averaged over two monthsduring 540 days In the work [4] for the analysis of 24- 12- and 8-hour harmonics of diurnalvariations the data of Deep River neutron monitor during the period from 1981 to 1994 were used
With the development of the first muon hodoscopes TEMP [5] and URAGAN [6] new possibilitiesin the study of variations of cosmic rays were opened In this work the results accumulated withURAGAN which represents the device consisting of four independent supermodules are analyzedEach supermodule consists of eight planes of streamer tubes with resistive cathode blown withAr+CO2+n-pentane mixture On the sides of each plane mutually orthogonal aluminium strips(320+288) which form eight XY-coordinate planes are situated Each supermodule has an area about115 m2 The URAGAN is located on the surface and registers angular distribution of muon flux withthreshold energies from 026 up to 06 GeV over a wide range of zenith angles (0-80ordm) Angularaccuracy of track reconstruction is better than 1ordm The track angular distribution is stored as minutematrixes M with the cells of 1ordm in zenith angle θ and 4ordm in azimuth angle φ The matrix method of
23rd European Cosmic Ray Symposium (and 32nd Russian Cosmic Ray Conference) IOP PublishingJournal of Physics Conference Series 409 (2013) 012193 doi1010881742-65964091012193
Published under licence by IOP Publishing Ltd 1
storage of the information allows carrying out the analysis of angular distribution in various intervalsof zenith and azimuth angles Here for the analysis of long-term variations the hourly average datafor zenith angle interval 25ordm le θ lt 76ordm were used Typical energies of primary protons givingcontribution to muon flux in this range of angles have been estimated the average energy is ~ 80 GeVand the median energy is ~ 60 GeV
2 Vector of local anisotropyFor a long time the basic information for the study of variations of cosmic rays was only the numberof events (counting rate) registered in a detector Thus the data acquisition system of the detector aftereach event practiced only an increment to the counter of events But if the detector allows to obtain avector of a direction of a registered particle it is possible to apply the vector sum The summary vector(vector of local anisotropy) will characterize the angular distribution of registered particles
Projections of the vector of local anisotropy (AX AY AZ) from the initial matrix data M are definedas
1 1( ) cos sin ( ) sin sin
1 ( ) cos ( )
X Y
Z
A M A MN N
A M N MN
q j q j
q j q j
= q j j q = q j j q
= q j q = q j
aringaring aringaring
aringaring aringaring(1)
where θ and φ are the angles corresponding to the matrix cell midpoints M(θ φ) is the number ofrecorded events in a corresponding matrix cell (θ φ) of the matrix M and N is the total number ofevents in the used angular range
When processing experimental data for calculations of values of horizontal projections AX and AYthe source matrixes M without additional barometric and temperature corrections are used Duringcalculations of AZ values of matrix M with barometric corrections are used In the present work axesof coordinates X and Y are directed to the South and to the East correspondingly
Local atmospheric perturbations (thunderstorms showers etc) can influence the angulardistribution of the muon flux Thus in a zone of atmospheric sensitivity (up to 150 km radius)atmospheric pressure and temperature can be strongly inhomogeneous At such moments it isimpossible to obtain correct data on atmospheric pressure and temperature profile It is possible toobserve only how the vector of local anisotropy changes in these events and this is a subject of aseparate study But as a rule atmospheric perturbations are short-term and not regular ones thereforethe vector of local anisotropy gives unique opportunities for the analysis of long-term variations of themuon flux caused by extra-atmospheric processes
3 Time seriesFor the analysis of long-term variations of muon angular distribution hour matrixes of angulardistributions from three supermodules of the URAGAN have been used The vector of localanisotropy was calculated in the range of zenith angles 25ordm le θ lt 76ordm since the data in this range aremore steady in comparison with the range 0ordm le θ lt 76ordm to changes of the detector registrationefficiency which could take place during long-time observation period
Strong diurnal variations complicate the visual perception therefore in Fig 1 the time dependencesof daily average values of muon counting rate (re-calculated to one supermodule) and of projections ofthe vector of local anisotropy are presented vertical (AZ) and two horizontal ones (to the South - ASouthand to the East - AEast)
23rd European Cosmic Ray Symposium (and 32nd Russian Cosmic Ray Conference) IOP PublishingJournal of Physics Conference Series 409 (2013) 012193 doi1010881742-65964091012193
2
2007 2008 2009 2010 2011
840
860
880
900
920
а)
Cou
ntin
g ra
te s
-1
Date2007 2008 2009 2010 2011
07505
07510
07515
07520
07525
b)
AZ
Date
2007 2008 2009 2010 2011
0002
0003
0004
0005
0006
0007
c)
ASo
uth
Date2007 2008 2009 2010 2011
0000
0001
0002
0003
0004
0005
0006
A Eas
t
Date
d)
Fig 1 Time dependences of daily average values of muon counting rate and projections of the vectorof local anisotropy (all for zenith angle interval 25-76ordm) estimated by the URAGAN data a) ndash muon
counting rate re-calculation to one supermodule b) ndash AZ c) ndash ASouth d) ndash AEast
Time dependences of daily average values allow to note strong annual changes of counting rate andAZ saw-tooth annual changes of values of AEast in 2008-2009 a hint for an annual variation of ASouth in2009 Annual variation AZ goes nearly in an anti-phase with changes of muon counting rate but theforms of their changes are different
The Fourier analysis of time dependences of hourly average values of muon counting rate andprojections of the vector of local anisotropy exhibits different frequency spectra (Fig 2) The commonfeature in variations of values of the muon counting rate and values of projections of the anisotropyvector is the presence of 12-hour 24-hour and about 27-daysrsquo periods The semi-diurnal period ismore strongly pronounced in variations of horizontal projections though also seen in the otherparameters For long periods the spectrum of variations of ASouth has a completely different characterin comparison with other spectra in the spectrum for ASouth a semi-annual period is seen in otherspectra dominate the periods close (though somewhat different) to the annual one
23rd European Cosmic Ray Symposium (and 32nd Russian Cosmic Ray Conference) IOP PublishingJournal of Physics Conference Series 409 (2013) 012193 doi1010881742-65964091012193
3
1 10 10010-8
10-7
10-6
10-5
10-4
10-3
10-2
12
27 182
ASouth
Period day
Pow
er
10-12
10-11
10-10
10-9
10-8
10-7
10-6
10-5
10-4
271
12
1
363
Pow
erCounting rate
1 10 10010-8
10-7
10-6
10-5
10-4
10-3
10-2
12 1 34728
AEast
Period day
Pow
er
10-12
10-11
10-10
10-9
10-8
10-7
10-6
10-5
10-4
29112
369
Pow
er
AZ
Fig 2 Fourier power spectra of time dependences of muon counting rate and of projections of thevector of local anisotropy In the boxes the values of the periods (in days) are specified for
corresponding peaks
4 ConclusionsMuon hodoscopes allow to use for the analysis not only muon counting rate but also angulardistribution of the registered particles As a quantitative characteristic at the study of variations of theangular distribution of the muon flux it is expedient to use the vector of local anisotropy The analysisof variations of the vector of local anisotropy for zenith angle intervals 25ordm le θ lt 76ordm has revealed thepresence of annual semi-annual 27-day diurnal and semi-diurnal variations Variations of the vectorof local anisotropy and muon counting rate have a different character Thus the use of the vector oflocal anisotropy for the analysis extends the possibilities of muon detectors in the studies of thedependence of muon flux on various heliospheric magnetospheric and atmospheric processes
AcknowledgmentsThe research has been performed in Scientific and Educational Centre NEVOD with the support of theFederal Target Program Scientific and Pedagogical Cadres for Innovative Russia the grant of theLeading Scientific School NSh-681720122 and Ministry of Education and Science(contract no 16518117053)
References[1] Wollan E O 1939 Present status of solar and sidereal time variation of cosmic rays Rev Mod
Phys 11 160[2] Dorman L I and Feinberg E L 1958 On the nature of cosmic ray variations Proc of 4th Intern
Cosmic Ray Conf (Guanajuato Mexico) vol 4 pp 393-432[3] Briggs R M et al 1969 Periodic solar time variations in the cosmic-ray muon component near
sea level J Phys A Gen Phys 2 584[4] Mishra R K and Mishra R A 2007 A study of daily variation in cosmic ray intensity during
highlow amplitude days Pramana ndash J Phys 68 407[5] Borog V V et al 1995 Large aperture muon hodoscope for studies in solar-terrestrial physics
Proc 24th ICRC (Rome) vol 4 pp 1291-95[6] Barbashina N S et al 2008 Instruments and Experimental Techniques 51 180
23rd European Cosmic Ray Symposium (and 32nd Russian Cosmic Ray Conference) IOP PublishingJournal of Physics Conference Series 409 (2013) 012193 doi1010881742-65964091012193
4
2007 2008 2009 2010 2011
840
860
880
900
920
а)
Cou
ntin
g ra
te s
-1
Date2007 2008 2009 2010 2011
07505
07510
07515
07520
07525
b)
AZ
Date
2007 2008 2009 2010 2011
0002
0003
0004
0005
0006
0007
c)
ASo
uth
Date2007 2008 2009 2010 2011
0000
0001
0002
0003
0004
0005
0006
A Eas
t
Date
d)
Fig 1 Time dependences of daily average values of muon counting rate and projections of the vectorof local anisotropy (all for zenith angle interval 25-76ordm) estimated by the URAGAN data a) ndash muon
counting rate re-calculation to one supermodule b) ndash AZ c) ndash ASouth d) ndash AEast
Time dependences of daily average values allow to note strong annual changes of counting rate andAZ saw-tooth annual changes of values of AEast in 2008-2009 a hint for an annual variation of ASouth in2009 Annual variation AZ goes nearly in an anti-phase with changes of muon counting rate but theforms of their changes are different
The Fourier analysis of time dependences of hourly average values of muon counting rate andprojections of the vector of local anisotropy exhibits different frequency spectra (Fig 2) The commonfeature in variations of values of the muon counting rate and values of projections of the anisotropyvector is the presence of 12-hour 24-hour and about 27-daysrsquo periods The semi-diurnal period ismore strongly pronounced in variations of horizontal projections though also seen in the otherparameters For long periods the spectrum of variations of ASouth has a completely different characterin comparison with other spectra in the spectrum for ASouth a semi-annual period is seen in otherspectra dominate the periods close (though somewhat different) to the annual one
23rd European Cosmic Ray Symposium (and 32nd Russian Cosmic Ray Conference) IOP PublishingJournal of Physics Conference Series 409 (2013) 012193 doi1010881742-65964091012193
3
1 10 10010-8
10-7
10-6
10-5
10-4
10-3
10-2
12
27 182
ASouth
Period day
Pow
er
10-12
10-11
10-10
10-9
10-8
10-7
10-6
10-5
10-4
271
12
1
363
Pow
erCounting rate
1 10 10010-8
10-7
10-6
10-5
10-4
10-3
10-2
12 1 34728
AEast
Period day
Pow
er
10-12
10-11
10-10
10-9
10-8
10-7
10-6
10-5
10-4
29112
369
Pow
er
AZ
Fig 2 Fourier power spectra of time dependences of muon counting rate and of projections of thevector of local anisotropy In the boxes the values of the periods (in days) are specified for
corresponding peaks
4 ConclusionsMuon hodoscopes allow to use for the analysis not only muon counting rate but also angulardistribution of the registered particles As a quantitative characteristic at the study of variations of theangular distribution of the muon flux it is expedient to use the vector of local anisotropy The analysisof variations of the vector of local anisotropy for zenith angle intervals 25ordm le θ lt 76ordm has revealed thepresence of annual semi-annual 27-day diurnal and semi-diurnal variations Variations of the vectorof local anisotropy and muon counting rate have a different character Thus the use of the vector oflocal anisotropy for the analysis extends the possibilities of muon detectors in the studies of thedependence of muon flux on various heliospheric magnetospheric and atmospheric processes
AcknowledgmentsThe research has been performed in Scientific and Educational Centre NEVOD with the support of theFederal Target Program Scientific and Pedagogical Cadres for Innovative Russia the grant of theLeading Scientific School NSh-681720122 and Ministry of Education and Science(contract no 16518117053)
References[1] Wollan E O 1939 Present status of solar and sidereal time variation of cosmic rays Rev Mod
Phys 11 160[2] Dorman L I and Feinberg E L 1958 On the nature of cosmic ray variations Proc of 4th Intern
Cosmic Ray Conf (Guanajuato Mexico) vol 4 pp 393-432[3] Briggs R M et al 1969 Periodic solar time variations in the cosmic-ray muon component near
sea level J Phys A Gen Phys 2 584[4] Mishra R K and Mishra R A 2007 A study of daily variation in cosmic ray intensity during
highlow amplitude days Pramana ndash J Phys 68 407[5] Borog V V et al 1995 Large aperture muon hodoscope for studies in solar-terrestrial physics
Proc 24th ICRC (Rome) vol 4 pp 1291-95[6] Barbashina N S et al 2008 Instruments and Experimental Techniques 51 180
23rd European Cosmic Ray Symposium (and 32nd Russian Cosmic Ray Conference) IOP PublishingJournal of Physics Conference Series 409 (2013) 012193 doi1010881742-65964091012193
4

1 10 10010-8
10-7
10-6
10-5
10-4
10-3
10-2
12
27 182
ASouth
Period day
Pow
er
10-12
10-11
10-10
10-9
10-8
10-7
10-6
10-5
10-4
271
12
1
363
Pow
erCounting rate
1 10 10010-8
10-7
10-6
10-5
10-4
10-3
10-2
12 1 34728
AEast
Period day
Pow
er
10-12
10-11
10-10
10-9
10-8
10-7
10-6
10-5
10-4
29112
369
Pow
er
AZ
Fig 2 Fourier power spectra of time dependences of muon counting rate and of projections of thevector of local anisotropy In the boxes the values of the periods (in days) are specified for
corresponding peaks
4 ConclusionsMuon hodoscopes allow to use for the analysis not only muon counting rate but also angulardistribution of the registered particles As a quantitative characteristic at the study of variations of theangular distribution of the muon flux it is expedient to use the vector of local anisotropy The analysisof variations of the vector of local anisotropy for zenith angle intervals 25ordm le θ lt 76ordm has revealed thepresence of annual semi-annual 27-day diurnal and semi-diurnal variations Variations of the vectorof local anisotropy and muon counting rate have a different character Thus the use of the vector oflocal anisotropy for the analysis extends the possibilities of muon detectors in the studies of thedependence of muon flux on various heliospheric magnetospheric and atmospheric processes
AcknowledgmentsThe research has been performed in Scientific and Educational Centre NEVOD with the support of theFederal Target Program Scientific and Pedagogical Cadres for Innovative Russia the grant of theLeading Scientific School NSh-681720122 and Ministry of Education and Science(contract no 16518117053)
References[1] Wollan E O 1939 Present status of solar and sidereal time variation of cosmic rays Rev Mod
Phys 11 160[2] Dorman L I and Feinberg E L 1958 On the nature of cosmic ray variations Proc of 4th Intern
Cosmic Ray Conf (Guanajuato Mexico) vol 4 pp 393-432[3] Briggs R M et al 1969 Periodic solar time variations in the cosmic-ray muon component near
sea level J Phys A Gen Phys 2 584[4] Mishra R K and Mishra R A 2007 A study of daily variation in cosmic ray intensity during
highlow amplitude days Pramana ndash J Phys 68 407[5] Borog V V et al 1995 Large aperture muon hodoscope for studies in solar-terrestrial physics
Proc 24th ICRC (Rome) vol 4 pp 1291-95[6] Barbashina N S et al 2008 Instruments and Experimental Techniques 51 180
23rd European Cosmic Ray Symposium (and 32nd Russian Cosmic Ray Conference) IOP PublishingJournal of Physics Conference Series 409 (2013) 012193 doi1010881742-65964091012193
4