Embed Size (px)
Citation preview

MANAGERIAL DECISIONS AND LONG-TERM STOCK PRICE PERFORMANCE
by Mark L. Mitchell and Erik Stafford *
First Draft: June 1997
Current Draft: October 1999
ABSTRACT:
A rapidly growing literature claims to reject the efficient market hypothesis byproducing large estimates of long-term abnormal returns following majorcorporate events. The preferred methodology in this literature is to calculateaverage multi-year buy-and-hold abnormal returns and conduct inferences via abootstrapping procedure. We show that this methodology is severely flawedbecause it assumes independence of multi-year abnormal returns for event firms,producing test statistics that are up to four times too large. After accounting forthe positive cross-correlations of event firm abnormal returns we find virtuallyno evidence of reliable abnormal performance for our samples.
* Harvard Business School, Soldiers Field, Boston, MA 02163. Mitchell (617-495-1014, [email protected]) andStafford (617-495-8064 [email protected]). We thank Gregor Andrade, Reto Bachmann, Alon Brav, Ken French,Tim Loughran, Lisa Meulbroek, Jay Ritter, William Schwert (1997 AFA Discussant), René Stulz, Luigi Zingales,and seminar participants at Duke, Harvard, Penn State, University of Chicago, and Virginia Tech for helpfulcomments. We especially thank Eugene Fama for insightful comments and discussions. Mitchell thanks MerrillLynch for a grant to study mergers and acquisitions. Both authors thank the Center for Research in Security Prices(CRSP) at the University of Chicago for financial support.

1
How reliable are estimates of long-term abnormal returns subsequent to major corporate
events? The view expressed in recent long-term event studies is that we can precisely identify
systematic mis-pricings of large samples of equity securities for up to five years following major
corporate decisions. Taken at face value, these findings strongly reject the notion of stock
market efficiency. However, this is at odds with the conventional view that the stock market
quickly and completely incorporates public information into the stock price. We try to reconcile
these two views by reassessing the reliability of recent long-term abnormal return estimates and
providing new estimates that are robust to common statistical problems. In particular, we
investigate the impact on inferences of several potential, but often overlooked problems with
common methodologies using three large well-studied samples of major managerial decisions,
namely, mergers, seasoned equity offerings (SEOs), and share repurchases, all of which have
been the focus of numerous long-term event studies, and each of which have the benefit of a long
sample period, 1958-1993.
There are several important components to measuring long-term abnormal stock price
performance, including an estimator of abnormal performance and a means for determining the
distribution of the estimator. Beginning with Ritter (1991), the most popular estimator of long-
term abnormal performance is the mean buy-and-hold abnormal return, BHAR . Concerns
arising from the skewness of individual firm long horizon abnormal returns hampered statistical
inference in many initial studies, which either avoided formal statistical inference or relied on
assumptions that were later questioned, such as normality of the estimator. To address the
skewness problem, Ikenberry, Lakonishok, and Vermaelen (1995) introduce a bootstrapping
procedure for statistical inference, which simulates an empirical null distribution of the estimator,
relaxing the assumption of normality.
Several long-term event study methodology papers have questioned each aspect of
measuring long-term abnormal performance. Barber and Lyon (1997) argue that the BHAR is
the appropriate estimator because it “precisely measures investor experience.” However, Barber
and Lyon (1997) and Kothari and Warner (1997) provide simulation evidence showing that

2
common estimation procedures can produce biased BHAR estimates. In particular, biases arise
from new listings, rebalancing of benchmark portfolios, and skewness of multi-year abnormal
returns. Proposed corrections include careful construction of benchmark portfolios to eliminate
known biases and conducting inferences via a bootstrapping procedure as applied by Ikenberry,
Lakonishok, and Vermaelen (1995). In addition, large sample sizes mitigate many of these
biases. The common conclusion of these methodology papers is that “measuring long-term
abnormal performance is treacherous.”
Fama (1998) argues against the BHAR methodology because the systematic errors that
arise with imperfect expected return proxies the bad model problem are compounded with
long-horizon returns. In addition, any methodology that ignores cross-sectional dependence of
event firm abnormal returns that are overlapping in calendar-time is likely to produce overstated
test statistics. Therefore, Fama strongly advocates a monthly calendar-time portfolio approach
for measuring long-term abnormal performance. First, monthly returns are less susceptible to the
bad model problem. Second, by forming monthly calendar-time portfolios, all cross-correlations
of event-firm abnormal returns are automatically accounted for in the portfolio variance. Finally,
the distribution of this estimator is better approximated by the normal distribution, allowing for
classical statistical inference.
Despite the apparent attractiveness of the calendar-time portfolio approach, Lyon, Barber,
and Tsai (1999) and Loughran and Ritter (1999) prefer the BHAR methodology. Lyon, Barber,
and Tsai again argue that the BHAR is the appropriate estimator because it “accurately
represents investor experience,” and that statistical inference should be performed via either a
bootstrapped skewness-adjusted t-statistic or the bootstrapping procedure of Ikenberry,
Lakonishok, and Vermaelen (1995). Loughran and Ritter primarily argue that the calendar-time
portfolio approach has low power to detect abnormal performance because it averages over
months of “hot” and “cold” event activity. For example, the calendar-time portfolio approach
may fail to measure significant abnormal returns if abnormal performance primarily exists in
months of heavy event activity.
3
Following the prescriptions of the methodology papers described above; there is a second
wave of long-term event studies also finding large estimates of abnormal performance. The
typical approach is to focus on BHARs, using various benchmarks that are carefully constructed
to avoid known biases, and assessing statistical significance of the BHAR via a bootstrapping
procedure. The authors conclude that since they find evidence of long-term abnormal
performance even after taking into account the potential problems highlighted by the
methodology papers, their results are especially robust. There is some sense that the recent
estimates of abnormal performance are perhaps conservative, but since they are still very
statistically significant, market efficiency is strongly rejected.
The general findings from the long-term abnormal performance studies can be described
by Figure 1. Typically, the estimated mean buy-and-hold abnormal return, BHAR , falls far into
the tail of the null distribution of the BHAR , and often falls well beyond the maximum, or below
the minimum, of the bootstrapped null distribution. The methodology papers emphasize that the
benchmarks must be carefully constructed to avoid known biases, which can move the BHAR in
either direction. However, this has little impact on inferences in practice for large samples. For
our samples, different methods of constructing benchmark portfolios change estimated mean
BHARs roughly 20% in either direction. In other words, if the mean BHAR is -10%, modifying
the benchmark construction produces estimates ranging from -8% to -12%. Although this may
appear significant, this is not a meaningful difference since the minimum of the bootstrapped null
distribution is only around -4%, producing a p-value of 0.000 regardless of which estimate is
used. The common inference from results similar to these is that average BHARs following
major corporate events are very far from zero, and thus market efficiency is rejected.
We are suspicious of this interpretation. It is difficult to reconcile extremely precise
measurement of abnormal performance when expected performance is difficult to determine, a
priori. Our view of Figure 1 is that the popular bootstrapped distribution of three-year sBHAR
may be too tight given that we cannot price equity securities very precisely, especially at long
horizons, and thus, it is not clear whether the BHAR is far from zero or not.
4
Our primary concern with the advocated bootstrapping procedure is that it assumes event
firm abnormal returns are independent. Major corporate actions are not random events, and thus
event samples are unlikely to consist of independent observations. In particular, major corporate
events cluster through time by industry. This leads to positive cross-correlation of abnormal
returns making test statistics that assume independence, severely overstated. We are more
comfortable assuming that the mean BHAR is normally distributed with large sample sizes than
we are assuming that all multi-year event firm abnormal returns are independent. The
dependence problem increases with sample size, whereas the normality assumption becomes
more plausible with large samples.
To gain perspective on the magnitude of the dependence problem, we assume normality
of the mean BHAR and impose a simple structure on the covariance matrix to estimate average
cross-correlations of three-year BHARs. The estimated correlations are used to calculate
correlation-adjusted standard errors of the BHAR for each of the three samples. We find that the
normality assumption for the mean BHAR is reasonable for our three large event samples.
However, accounting for dependence has a huge effect on inferences. It is common for
t-statistics to fall from over 6.0 to less than 1.5 after accounting for cross-correlations.
Equivalently, we find that a three-year BHAR of 15% is not statistically different from zero. In
fact, after accounting for the positive cross-correlations of individual firm BHARs, we find no
reliable evidence of long-term abnormal performance for any of the three event samples using the
BHAR approach. Importantly, this result is due to accounting for the dependence of individual
event firm abnormal returns, not due to the construction of the benchmark portfolios. Although
our estimated returns are similar in magnitude to those reported in previous studies, our test
statistics that allow for dependence are dramatically smaller.
Our results directly contradict the prescriptions of most methodology papers that advocate
the BHAR approach in conjunction with bootstrapping. On the other hand, the calendar-time
portfolio approach advocated by Fama (1998) is robust to the most serious statistical problems.
Interestingly, the inferences from the calendar-time portfolio approach are quite similar to those
5
from our modified BHAR analysis after accounting for the positive cross-sectional dependence of
event firm abnormal returns. Moreover, we directly address the concerns raised by Loughran and
Ritter (1999), and find no evidence in their support. In fact, we find that the calendar-time
portfolio procedure has more power to identify reliable evidence of abnormal performance in our
samples than the BHAR approach after accounting for dependence. We, like Fama (1998),
strongly advocate a calendar-time portfolio approach.
Contemporaneous research by Brav (1999) also emphasizes the problems of long-term
abnormal performance methodologies that assume independence. In particular, Brav develops an
elaborate Bayesian predictive methodology for measuring long-term abnormal returns, which
relaxes the assumption of independence in certain circumstances. However, his approach does
not provide a complete correction to the dependence problem.
Finally, we show that much of what is typically attributed to an “event,” is merely a
manifestation of known mispricings of the model of expected returns. Following Fama and
French (1992, 1993), virtually all recent studies documenting long-term abnormal returns use
some form of risk-adjustment that assumes the cross-section of expected returns can be
completely described by size and book-to-market equity. However, this appears to be a mis-
reading of the evidence presented in Fama and French (1993). Although expected returns are
systematically related to size and book-to-market attributes, Fama and French point out that three
of twenty-five portfolios formed based on these characteristics are associated with abnormal
return estimates that are significantly different from zero. In other words, the model of market
equilibrium used to identify mis-pricing cannot completely price the cross-section of expected
returns on the dimensions that it is designed to explain. After controlling for the sample
composition of our three samples, based on size and book-to-market attributes, reliable evidence
of abnormal performance is substantially reduced, and is restricted to a few sub-samples of small
stocks. This is consistent with the evidence provided by Brav and Gompers (1997) for IPOs and
suggests that many of the “event anomalies” previously documented by other researchers are
actually manifestations of known pricing deficiencies of the model of expected returns. This
6
further highlights the inconsistency of being able to reliably identify mis-priced assets when asset
pricing is imprecise.
I. DATA DESCRIPTION
A. Sample Selection
The datasets for this paper consist of three large samples of major managerial decisions,
namely mergers, SEOs, and share repurchases, completed during 1958-1993.1 Each of these
event samples has been the focus of numerous recent studies of long-term stock price
performance, although data from the 1960s is for the most part unexplored. The use of three
large well-explored samples facilitates comparisons of abnormal performance estimates across
both our samples and those of other studies, as well as across various methodologies. In
addition, the use of data from the 1960s may be useful in determining how sensitive results are to
short sample periods.
The sample consists of 4,911 underwritten primary and combination seasoned equity
offerings (SEOs); 2,421 open market and tender-offer share repurchases (excludes odd-lot
repurchases); and 2,193 acquisitions of CRSP firms. We exclude multiple events by the same
firm within any three-year period. In other words, after the first event, we ignore additional
events until after the three-year event window. Our objective is to focus on the long-run price
performance of the broad samples rather than to delve into the cross-sectional particulars, so we
limit the cross-sectional characteristics of individual transactions to those that previous research
has shown to be important. For example, we classify merger transactions based on form of
1 The event samples are from the CRSP-EVENTS database currently under development at the University ofChicago’s Center for Research in Security Prices. The CRSP-EVENTS database contains detailed information onmergers & tender offers, primary seasoned equity issues, and stock repurchases from 1958 to present, where CRSPprice data is available at the time of the event announcement. Data sources include corporate annual reports,Investment Dealer’s Digest, Mergers & Acquisitions, U.S. Securities & Exchange Commission filings, Standard &Poor’s Compustat database, The Wall Street Journal (and Dow Jones News Retrieval Service), and variousmiscellaneous sources.

7
payment. For repurchase events we distinguish between open market repurchases and self-
tenders, similar to prior research.
B. Announcement and Completion Dates
In the long-run abnormal performance tests, we begin the multi-year event window at the
end of the completion month rather than the announcement date. For example, the
announcement date for SEOs is the registration date, whereas the completion date is the offering
date. The average time between the registration and completion date is one month. For mergers,
the interval between announcement and completion is typically several months. Since stock
repurchase programs rarely provide a definitive completion date and because these programs can
take place over a period of a year or two, we treat the announcement date as the completion date.
In the empirical tests examining the pre-event long-term abnormal performance, the event
window ends in the month before the event announcement.
C. Returns, Size, and Book-to-Market Equity
The return data come from the CRSP monthly NYSE, AMEX, and Nasdaq stock files.2
Firm size refers to the market value of common equity at the beginning of the month. In part of
the empirical analysis that follows, we assign sample firms to portfolios based on size and book-
to-market equity (BE/ME). We follow Fama and French (1997), and define book equity as total
shareholder’s equity, minus preferred stock, plus deferred taxes (when available), plus
investment tax credit (when available), plus post-retirement benefit liabilities (when available).
Preferred stock is defined as redemption, liquidation, or carrying value (in this order), depending
on availability. If total shareholder’s equity is missing, we substitute total assets minus total
liabilities. Book-to-market equity is the ratio of fiscal year-end book equity divided by market
capitalization of common stock at calendar year-end. We use the most recent fiscal year-end
2 Shumway (1997) reports that “performance” related delistings often have missing final returns, which he estimatesto be -30%. We find that substituting missing performance related delisting returns with -30% does not alter ourfindings, and so we report results based on the unaltered data.

8
book equity, as long as it is no later than the calendar year-end market equity. Consequently, if
the fiscal year-end occurs in January through May, we use book equity from the prior fiscal-year.
The event samples begin in 1958, and extend through 1993. Since the book-equity data is
limited on Compustat during the early part of the sample period, we fill in much of the missing
data by hand-collecting book-equity from Moody’s Manuals (Chan, Jegadeesh, and Lakonishok
(1995), Kothari, Shanken, and Sloan (1995)). In the fiscal year 1962, we supplement the 974
firms with Compustat book equity data with 769 firms from the Moody’s Manuals. In all, we
replace about 7,000 missing book-equity observations.
D. Distribution of Event Firms by Size and Book-to-Market
In some of the empirical tests to follow, we compare the stock price performance of the
event firms to 25 portfolios formed on size and book-to-market quintiles using NYSE
breakpoints (see Fama and French (1992, 1993)). Table 1 displays the distribution of the event
firms according to the size and BE/ME classifications.
All three event samples have size distributions that are tilted towards large firms relative
to the population of CRSP firms. Close to 60% of all CRSP firms fall into the bottom size
quintile based on NYSE breakpoints. Acquirers are more likely to have relatively low BE/ME
ratios and large equity values. SEO issuers are also more likely to have low BE/ME ratios, and
tend to be small firms relative to the NYSE breakpoints. Share repurchasers are also relatively
small firms, and interestingly, more likely to be low BE/ME firms, suggesting that these firms are
not typically “value” stocks as some behavioral stories suggest.
The distribution of sample firms does not change very much between the pre- and post-
event years. This suggests that there is little systematic change in the firm-level size and book-
to-market characteristics following the event. However, this hides the fact that most firms
change portfolio assignments following the event. In particular, only 25% of our sample firms
are in their original size and book-to-market portfolio three years after the event.

9
II. BUY-AND-HOLD ABNORMAL RETURNS (BHARS)
Buy-and-hold abnormal returns have become the standard method of measuring long-
term abnormal returns (see Barber and Lyon (1997) and Lyon, Barber, and Tsai (1999)). Buy-
and-hold abnormal returns measure the average multi-year return from a strategy of investing in
all firms that complete an event and selling at the end of a pre-specified holding period, versus a
comparable strategy using otherwise similar non-event firms.
Barber and Lyon (1997) and Lyon, Barber, Tsai (1999) argue that BHARs are important
because they “precisely measure investor experience.” While it is true that BHARs capture the
investor’s experience from buying and holding securities for three to five years, this is not a
particularly compelling reason to restrict attention to this methodology if reliably assessing long-
term stock price performance is the objective. First, this is only one type of investor
experience the buy-and-hold experience. There are other reasonable trading strategies that
capture other investors’ experiences, for example, periodic portfolio rebalancing. Second,
because of compounding, the buy-and-hold abnormal performance measure is increasing in
holding period, given abnormal performance during any portion of the return series. For
instance, if abnormal performance exists for only the first six months following an event, and one
calculates three- and five-year BHARs, both can be significant, and the five-year BHAR will be
larger in magnitude than the three-year BHAR. This is important to consider since the length of
the holding period is arbitrary, and various holding period intervals are often analyzed to
determine how long the abnormal performance continues after the event. Finally, and most
important, we show in the next section that there are serious statistical problems with BHARs that
cannot be easily corrected. Since our objective is to reliably measure abnormal returns, it is
imperative that the methodology allows for reliable statistical inferences.

10
A. Calculating BHARs
We calculate three-year BHARs for each firm in the three event samples using 25 value-
weight, non-rebalanced, size-BE/ME portfolios as expected return benchmarks3
BHAR R Ri i tt
T
benchmark tt
T
= + − += =
∏ ∏( ) ( ), ,1 11 1
(1)
where the mean buy-and-hold abnormal return is the weighted average of the individual BHARs:
BHAR w BHARi ii
N
= ⋅=1
(2)
Both equal-weight (EW) and value-weight (VW) averages are computed, where the value-
weights are based on market capitalizations at event completion, divided by the implicit value-
weight stock market deflator. In other words, we standardize market values of the sample firms
by the level of the CRSP VW market index at each point in time before determining the weights.
This is to avoid the obvious problems with unstandardized value-weights, which would weight
recent observations much more heavily than early observations. The size-BE/ME portfolio
benchmarks are designed to control for the empirical relation between expected returns and these
two firm characteristics (see Fama and French (1992, 1993) for discussion and evidence).
The benchmark portfolios exclude event firms, but otherwise include all CRSP firms that
can be assigned to a size-BE/ME portfolio. At the end of June of each year t, all stocks are
allocated to one of five size groups based on market capitalization rankings relative to NYSE
quintiles. In an independent sort, all stocks are also allocated to one of five BE/ME groups based
on where their BE/ME ranks relative to NYSE quintiles. The returns for the 25 portfolios are
calculated for the year defined July of year t through June of year t+1, as the value-weight
average of the individual firm monthly returns in each of the size-BE/ME quintile intersections.
To allow for changing firm characteristics, the size-BE/ME benchmarks are allowed to change at
the end of June of each year when new portfolio assignments are available. Moreover, the size-
3 Employing long-term windows of different lengths does not alter the substantive results of this paper.

11
BE/ME portfolios are composed of firms that have reported prior BE data, which partially
mitigate any bias caused by including recent IPOs in the benchmarks.
In calculating the BHARs for the individual firms, we impose two conditions to ensure
that all BHARs represent true three-year buy-and-hold returns. First, because of delistings, not all
of the sample firms have a full three years of valid return data following the completion of the
event. Therefore, we fill-in missing sample firm returns with the benchmark portfolio return.
Second, in forming the benchmark portfolios, we do not rebalance, so that each BHAR is a true
buy-and-hold return. This means that we compute the three-year returns for each of the 25 size-
BE/ME portfolios each calendar month.
B. Statistical Inference via Bootstrapping
Since the BHAR is the difference of a sample firm’s three-year return and the three-year
return on a benchmark portfolio, the distribution of individual firm BHARs is strongly positively
skewed (Barber and Lyon, 1997) and generally does not have a zero mean. Therefore, statistical
inference for the mean BHAR is often based on an empirical distribution simulated under the null
of the model as applied by Brock, Lakonishok, and LeBaron (1992) and Ikenberry, Lakonishok,
and Vermaelen (1995). Within this framework, the implied model of expected three-year returns
is simply the average three-year return of firms that have similar size and BE/ME.
Following their methodology, for each sample firm, we assign the completion date to a
randomly selected firm with the same size-BE/ME portfolio assignment at the time of the event.
This procedure yields a pseudo-sample that has the same size-BE/ME distribution, the same
number of observations, and the same calendar time frequency as the original event sample. We
then calculate the BHAR for this pseudo-sample in the same way as for the original sample.
This results in one BHAR under the null of the model. We repeat these steps to generate 1,000
sBHAR , and thus an empirical distribution of the BHAR under the null. A p-value is calculated
as the fraction of the sBHAR from the pseudo-samples that are larger in magnitude (but with the
same sign) than the original BHAR .

12
C. Results from the BHAR Analysis Assuming Independence
Table 2 displays the BHAR results for the three event samples over the period July 1961
through December 1993. We report both EW and VW results and compare to previous research
when possible.
C.1 Mergers
As displayed in Table 2.a, the three-year EW BHAR for acquirers is -1%, and has a
p-value of 0.164. The wealth relative, measured as the average gross return of the event firms
divided by the average gross return of the benchmark firms, is 0.994, implying that investing in
these acquirers generated total wealth 0.6% less than a strategy which invested in similar size-
BE/ME firms after three years. The VW BHAR is -0.038 with a p-value of 0.027, and a wealth
relative of 0.973.4
The closest comparison to our results is with Loughran and Vijh (1997) who study 947
acquisitions during 1970-1989. They report an EW five-year BHAR of -6.5%, with a t-statistic
of -0.96. The most extreme abnormal returns in other papers are usually documented for special
groupings of event firms, based on BE/ME rankings or form of payment. Popular groupings
based on BE/ME are commonly denoted as “growth” (or glamour), which refers to firms with
low BE/ME; and “value,” which refers to firms with high BE/ME. The growth and value
groupings are important for several recent behavioral theories of stock market over- and
underreaction following major corporate decisions. These theories have been interpreted as
predicting negative long-term abnormal returns for growth firms and positive abnormal returns
for value firms completing major corporate actions. For example, Rau and Vermaelen (1998)
document large differentials in performance between glamour and value acquirers. Specifically,
they report bias adjusted three-year CARs for glamour acquirers of -17.3% (t-statistic = -14.45)
4 The pre-event BHARs document superb performance before the event for small acquirers relative to the benchmarkportfolios, with an EW average three-year raw return of 88%, an abnormal return of 28.5%, and a wealth relative of1.18. However, this abnormal performance appears to be stronger for small acquirers, as the VW average pre-eventBHAR is insignificant.

13
and value acquirers of 7.6% (t-statistic = 14.23). In direct contrast, when we analyze the stock
price performance of growth and value acquirers we find no evidence of reliable differential
performance, 1% on an EW basis, representing differential performance several times smaller
than the amount previously documented.
Similar to previous research, we find that acquirers that use stock to finance the merger
perform worse than those that abstain from equity financing. The EW average unadjusted three-
year return for acquirers that finance mergers with at least some stock is roughly two-thirds that
of acquirers that abstain from stock financing, 39% vs. 63%. The EW BHAR for stock acquirers
is -8.4% (p-value = 0.000), while the BHAR for non-stock acquirers is 6.4% (p-value = 0.047).
The VW results are similar, although the differences are much smaller in magnitude. Loughran
and Vijh (1997) document a similar pattern in abnormal returns related to financing, albeit their
differences are larger by a magnitude of three times. They report a five-year EW BHAR of
-24.2% (t-statistic = -2.92) for stock mergers and 18.5% (t-statistic = 1.27) for cash mergers.
C.2 Seasoned Equity Offerings (SEOs)
Table 2.b reports the BHAR results for SEOs. The EW average three-year return for the
SEO sample is 35%, while the average size-BE/ME three-year return is 45%, producing a BHAR
of -10% with a p-value of 0.000. The EW BHAR of -10% is 2.5 times smaller than the
minimum of the empirical distribution which is only -4.1%. In other words, not a single one of
the 1,000 pseudo-sample sBHAR even comes close to the -10% EW BHAR , which is typical of
many of the sBHAR reported. The VW BHAR is -4.2%, with a p-value of 0.165.5 To facilitate
comparison to other studies, we also report results after excluding utilities. These results are
virtually identical to the full sample results.
5 During the three-year pre-event period, small issuers experience enormous average returns. The EW averageunadjusted pre-event buy-and-hold return is 144%, corresponding to an abnormal three-year return of 75%. Theseextremely large pre-event returns appear strongest for small stocks, as the VW BHAR is slightly negative, althoughinsignificant.

14
Overall, our results are similar to other research. Spiess and Affleck-Graves (1995) and
Brav, Geczy, and Gompers (1999) both report EW three-year raw returns of 34% and 32%,
respectively, whereas the average benchmark returns are on the order of 57% and 44%,
respectively. Brav, Geczy, and Gompers also document that the abnormal performance is largely
confined to small low BE/ME firms, and is substantially reduced with value-weighting.
C.3 Share Repurchases
The EW BHAR for repurchasers is 14.5% with p-value = 0.000 (Table 2.c). Again, not a
single one of the 1,000 pseudo-sample BHAR even comes close to the 14.5% EW BHAR .
These results are virtually identical to those reported by Ikenberry, Lakonishok, and Vermaelen
(1995) for repurchase programs announced during 1980-1990. The abnormal performance is
considerably reduced with value-weighting, VW BHAR equals 6.6% (p-value = 0.227).6
The EW BHAR is larger for firms repurchasing their shares on the open market (15.6%,
p-value=0.000), rather than through tender offers (8.7%, p-value=0.228). This is interesting in
light of a tender offer being a more dramatic event in the life of a firm. In addition, the abnormal
returns are twice as large for value firms than for growth firms (24.4% versus 9.9%), similar to
Ikenberry, Lakonishok, and Vermaelen (1995). But, the VW sBHAR are not reliably different
from zero for the sub-samples.
III. ASSESSING THE STATISTICAL RELIABILITY OF BHARS
As described in Section II, it is common to simulate an empirical distribution in order to
perform statistical inference of the sBHAR since the individual BHARs have poor statistical
properties, producing biased test statistics in random samples [see Barber and Lyon (1997),
Kothari and Warner (1997), and Lyon, Barber, and Tsai (1999)]. Most researchers view this
bootstrapping as a robust solution to the known statistical problems associated with the BHAR
6 One misconception about firms that repurchase their shares is that they perform poorly before the event. The pre-event abnormal performance is insignificant on both an EW and VW basis.

15
methodology. In this section, we question the robustness of the bootstrapping procedure with
respect to statistical inference for event samples.
The empirical distribution is simulated under the null hypothesis assuming (1) the 25
size-BE/ME benchmark portfolios completely describe expected returns, and (2) the randomly
selected firms used to construct the empirical distribution have the same covariance structure as
the sample firms. Fama (1998) details the problems associated with the first assumption as the
“bad model” problem, arguing that “all models for expected returns are incomplete descriptions
of the systematic patterns in average returns during any sample period.” In other words, if the
model for expected returns does not fully explain stock returns, measured abnormal performance
is likely to exist with respect to event samples exhibiting common characteristics. The best
means of checking the robustness of our results with respect to this assumption is to repeat the
analysis with a different model of expected returns and a different methodology.
We focus on the second assumption, which is crucial to the statistical reliability of
BHARs and is unique to the manner in which the empirical distribution is constructed. The
bootstrapping procedure makes two implicit assumptions: (1) the residual variances of sample
firms are no different from randomly selected firms and (2) the observations are independent.
The first assumption may pose a problem if the sample firms’ returns are more or less volatile
than the firms that are used to create the pseudo-samples. Although on average, the BHAR will
be correct, the empirical distribution may be too “tight,” leading to an overstatement of
significance (see Brav (1999)). The second assumption may be problematic if the events
themselves are driven by some underlying factor not captured by size and BE/ME. Andrade and
Stafford (1999) show that mergers (from the acquirer’s perspective) tend to cluster in calendar-
time by industry. Similarly, Mitchell and Mulherin (1996) identify fundamental industry shocks
that lead to increased takeover activity at the industry level, and Comment and Schwert (1995) do
the same at the aggregate level. Ritter (1991) states that IPOs cluster by industry at given points
in time. It is also likely that SEOs and share repurchases cluster by industry. If the event

16
clustering leads to positively correlated individual BHARs, statistical significance will be
overstated by any methodology that assumes independence.
We have some reason to be concerned that the p-values reported in Table 2 are overstated
because we find strong statistical significance for economically small estimates. For example,
the VW BHAR for acquirers is -3.8% with a p-value of 0.027, and a wealth relative of 0.973. In
other words, the average three-year investment in acquiring firms generated 2.7% less wealth
than an otherwise similar investment in non-acquirers, on a value-weight basis. In economic
terms, this does not seem significant, but the test statistic suggests that this represents statistically
significant long-term mispricing. In addition, we find sBHAR 2.5 times larger (in magnitude)
than the extreme of the empirical distribution. For example, the EW BHAR for SEOs is -10.2%,
whereas the minimum of the empirical distribution is only -4.1%. Assuming normality of the
empirical distribution of the mean BHAR, this corresponds to a p-value less than 0.000000001.
A. Properties of the Empirical Distribution of the Mean BHAR
Figure 1 plots the simulated empirical null distribution of the EW BHAR for the SEO
sample, as described above. The plots reveal that the distributions are quite symmetric and
reasonably well approximated by the normal density superimposed on the graphs. Because of the
large sample size, the mean should be close to normal regardless of the underlying distribution of
the individual firm BHARs.7 However, the Jarque-Bera test statistic rejects normality of both the
EW and VW empirical distributions. Although the empirical distributions are not normal, it is
interesting to see how poor an assumption normality is. Table 3 reports various critical values
based on the empirical distributions for the three event samples, and compares them to the
critical values assuming normality. The critical values assuming normality are calculated based
on the mean and standard deviation of the empirical distribution. For the most part, assuming
7 The Central Limit Theorem guarantees that a standardized sum of random variables will converge to a Normal(0,1)random variable, even if the individual random variables are correlated (see Chung (1974) for a discussion).
17
normality seems reasonable, and inferences would be unaffected at either the 1% or 5% levels for
all three samples, both EW and VW.
We also create a bootstrapped distribution of the BHAR (not reported) for the three
samples by re-sampling from the event-firm BHARs themselves (see Efron and Tibshirani, 1993).
This again assumes that the events are independent, but the bootstrapping makes no assumptions
about the event-firm residual variances relative to randomly selected firms, as re-sampling is
done using the original BHAR data. This allows us to isolate the effect of differential residual
variance on inferences via the empirical distribution. Comparison of the empirical and the
bootstrapped distributions reveals no noticeable difference in dispersion, suggesting that
increased residual variance of event firms is not a serious problem with these three samples.8
B. Cross-Sectional Dependence of BHARs
Our primary statistical concern is that major corporate actions are not random events, and
thus may not represent independent observations. The very nature of an event sample is that all
of these firms have chosen to participate in an event, while other firms have chosen not to. As
indicated above, major corporate events cluster through time by industry. This may lead to cross-
correlation of abnormal returns, which could flaw inferences from methodologies that assume
independence. There is an extensive accounting literature documenting cross-sectional
dependence of individual firm residuals (see Bernard, 1987; Collins and Dent, 1984; and Sefcik
and Thompson, 1986). These studies find that contemporaneous market model residuals for
individual firms are significantly correlated, on the order of 18% within individual industries.
Since major corporate events cluster in certain industries at any given point in time; correlated
residuals will pose a significant problem for the BHAR methodology, which assumes
independence of all observations, including those that are overlapping in calendar time.9
8 In general, this may be a major problem. For example, Brav (1999) documents that IPO firms have significantlylarger residual variances than otherwise similar non-IPO firms.9 Note that overlapping observations on the same firm are excluded from the samples. The overlapping observationsthat are important for this analysis are those of similar firms, such as those in the same industry.

18
To gain perspective on the magnitude of this problem, we calculate average pairwise
correlations of monthly and annual BHARs for each of our three event samples where there is
perfect calendar-time overlap. In other words, all possible unique correlations are calculated
using five years of either monthly or annual abnormal return data for firms that complete events
in the same month. The grand average is displayed below.
Average Pairwise Correlations of BHARs with Complete Calendar-Time Overlap
Frequency Mergers SEOs RepurchasesMonthly 0.0020 0.0177 0.0085Annual 0.0175 0.0258 0.0175
The average correlations increase substantially with the interval for all three event samples,
which is consistent with previous research. For example, Bernard (1987) finds that average
intra-industry correlations in individual firm market model residuals increase with holding
period, nearly doubling from 0.18 to 0.30 when the interval is increased from monthly to annual.
Although the average correlations appear small, they can have a significant impact on
inferences with large samples. This can be seen by inspecting the formulas for the sample
standard deviation, equation (3), and the ratio of the standard deviation assuming independence
to the standard deviation accounting for dependence, equation (4).10
jijiiBHAR NN
Nσσρσσ ,
2 )1(1 ⋅−+⋅= (3)
jiBHAR
BHAR
NDependenceceIndependen
,)1(1
1)()(
ρσσ
−+≈ (4)
where: =N number of sample events, =2iσ average variance of individual BHARs, =jiji σσρ ,
average covariance of individual BHARs, and =ji ,ρ average correlation of individual BHARs.
In large samples with positive cross-correlations, the covariance term comes to dominate the
individual variances. As such, ignoring cross-correlations will lead to overstated test-statistics.
10 The approximation of the ratio of σ(Independence) to σ(Dependence) assumes equal variances of the individualBHARs.

19
To determine the severity of overstated test-statistics for our event samples, we calculate
“corrected” t-statistics that account for dependence in BHARs under various assumptions about
the average correlation of three-year BHARs and the covariance structure. We report results only
for the EW test-statistics because EW results are the largest and tend to be the focus of most
previous research. We assume that the average correlation for overlapping observations is linear
in the number of months of calendar-time overlap, ranging from 0.0 for non-overlapping
observations to the estimated average correlation of three-year BHARs of firms with complete
overlap. Table A.1 in the appendix displays the assumed covariance structure for the SEO
sample. It is difficult to directly estimate average correlations of three-year BHARs because of
limited data. Therefore, we report a range of estimates and show the impact on t-statistics over
this range. Table 4 displays the results.
First, we should point out that we are assuming that the empirical distribution is normal,
which although not technically true, appears to be a reasonable approximation. This assumption
allows us to calculate t-statistics for the sBHAR using the mean and standard deviation from the
empirical distribution. We are also able to calculate t-statistics using standard deviations that
account for cross-correlations. Second, because the average correlation appears to be increasing
in holding period, it is unlikely that the average correlation of three-year BHARs is less than the
average correlation from the annual BHARs. Therefore, the t-statistics that assume that the
average correlation of three-year BHARs is equal to our estimate of average correlations from
annual BHARs are still likely to be overstated.
The corrected t-statistics reveal that there is no statistical evidence of abnormal returns for
any of the three event samples. The massive t-statistics of -6.05 (SEOs) and 4.86 (repurchases)
that assume independence fall to -1.49 and 1.91, respectively, after accounting for the positive
cross-correlations of individual BHARs. Since the average correlation of three-year BHARs is
almost surely larger than that of annual BHARs, the t-statistics that assume average correlations
of 0.02 for mergers and repurchases and 0.03 for SEOs are probably more reflective of the true
level of significance.

20
C. The Bottom Line on BHARs
The literature on long-term stock price performance heavily emphasizes results from the
BHAR methodology despite well-known potential problems. Barber and Lyon (1997), Kothari
and Warner (1997), and Lyon, Barber and Tsai (1999) provide simulation evidence showing that
BHAR estimates can be biased because of poor statistical properties of individual firm BHARs.
Many of these biases are mitigated with large sample sizes and careful construction of
benchmark portfolios. However, the problems associated with standard error estimates for
BHARs on non-random samples cannot easily be corrected, and are generally increasing in
sample size. This point is often missed in methodology papers and dismissed in long-term event
studies, which frequently claim that bootstrapping solves all dependence problems. However,
this is not true. Event samples are clearly different from random samples. Event firms have
chosen to participate in a major corporate action, while non-event firms have chosen to abstain
from the action. An empirical distribution created by randomly selecting firms with similar size-
BE/ME characteristics does not replicate the covariance structure underlying the original event
sample. In fact, the typical bootstrapping approach does not even capture the cross-sectional
correlation structure related to industry effects documented by Bernard (1987), Brav (1999) and
others. Moreover, Bernard shows that the average inter-industry cross-sectional correlation of
individual abnormal returns is also positive, suggesting that dependence corrections
concentrating only on industry effects will not account for all cross-correlations.
Our results suggest that the popular BHAR methodology, in its traditional form, should
not be used for statistical inference. Some type of correction for positive cross-correlations of
individual event firm BHARs should be made. Bootstrapping may be useful for determining the
mean of the null distribution. Finally, it is worth noting that for our three major events there is
no statistical evidence of long-term abnormal returns after accounting for positive cross-
correlations of individual event firm BHARs.

21
V. CALENDAR-TIME PORTFOLIO APPROACH
An alternative approach to measuring long-term stock price performance is to track the
performance of an event portfolio in calendar-time relative to either an explicit asset pricing
model or some other benchmark. The calendar-time portfolio approach was first used by Jaffe
(1974) and Mandelker (1974), and is strongly advocated by Fama (1998). The event portfolio is
formed each period to include all companies that have completed the event within the prior n
periods. By forming event portfolios, the cross-sectional correlations of the individual event firm
returns are automatically accounted for in the portfolio variance, at each point in calendar-time.
In light of our strong evidence that the individual event firm abnormal returns are cross-
sectionally correlated, calendar-time portfolios represent an important improvement over the
traditional BHAR methodology, which assumes independence of individual firm abnormal
returns.
A. Calculating Calendar-Time Abnormal Returns
Each month from July 1961 to December 1993, we form EW and VW portfolios of all
sample firms that participated in the event within the previous three-years.11 Portfolios are
rebalanced monthly to drop all companies that reach the end of their three-year period and add all
companies that have just executed a transaction. The portfolio excess returns are regressed on
the three Fama and French (FF) (1993) factors as in equation (5):
Rp,t - Rf,t = ap + bp (Rm,t - Rf,t) + sp SMBt + hp HMLt + ep,t (5)
The three factors are zero-investment portfolios representing the excess return of the
market; the difference between a portfolio of “small” stocks and “big” stocks, SMB; and the
difference between a portfolio of “high” BE/ME stocks and “low” BE/ME stocks, HML. Within
this framework, the intercept, ap, measures the average monthly abnormal return on the portfolio
of event firms, which is zero under the null of no abnormal performance, given the model. If the
11 We exclude multiple observations on the same firm that occur within three-years of the initial observation.
22
FF model provides a complete description of expected returns, then the intercept measures
mispricing. However, if the model provides only an imperfect description of expected returns,
then the intercept represents the combined effects of mispricing and model misspecification.
This is what Fama (1970) refers to as the joint test problem tests of market efficiency are
necessarily joint tests of market efficiency and the assumed model of expected returns.
Table 5 reports the intercepts from regressions of the 25 EW and VW size-BE/ME
portfolios on the FF three-factor model. These are the original assets used in Fama and French
(1993) to test the model. As pointed out by Fama and French, the FF three-factor model is
unable to completely describe the cross-section of expected returns, even on the dimensions on
which it is based, which is illustrated by the several significant intercepts in Table 5. This
suggests that the null hypothesis intercept equals zero may be problematic for samples tilted
towards characteristics that the model cannot price in the first place. This can be seen most
easily with IPOs. IPO firms are overwhelmingly small low BE/ME firms. When the abnormal
returns of IPO firms are estimated with the FF three-factor model, the estimates are on the order
of -12% to -15% for an EW portfolio over a three year period, or about -0.35% to -0.42% per
month. However, Brav and Gompers (1997) argue that the underperformance of IPOs is not an
IPO effect, per se. They find that similar size and book-to-market firms that have not issued
equity perform as poorly as IPOs. Note that the intercept for all small, low BE/ME firms
reported in Table 5 is -0.37, which is essentially identical to that found for IPOs.
In order to gain perspective on whether the known pricing deficiencies of the FF three-
factor model affect the three samples studied in this paper, we decompose the intercepts into two
components: (1) the expected abnormal performance, given the sample composition (based on
size-BE/ME portfolio assignment and calendar-time frequency); and (2) the amount of abnormal
performance attributable to other sources, including the event.
In particular, we estimate the expected intercept, conditional on the sample composition,
as the mean intercept from 1,000 calendar-time portfolio regressions of random samples of
otherwise similar non-event firms. This is directly comparable to the empirical distribution used

23
in the BHAR analysis. However, we are using this methodology to determine the mean of the
null distribution, not to measure the dispersion. Each of the 1,000 random samples has the same
calendar-time frequency, and at each point in time, the portfolio of randomly selected firms has
the same size-BE/ME composition as the corresponding event-portfolio. A new t-statistic is
calculated using the expected intercept, 0a , as the null, and the original intercept and standard
error estimates. We refer to the difference between the estimated intercept and the expected
intercept as the “adjusted intercept.”
saat
ˆˆˆ 0−= (6)
B. Calendar-Time Portfolio Regression Results
Table 6 displays the EW and VW calendar-time portfolio regression results for the three
samples over the period July 1961 through December 1993. The number of monthly
observations varies slightly for different samples and sub-samples, as we require a minimum of
10 firms in each monthly event portfolio.
The EW three-year acquirer portfolio exhibits statistically significant average abnormal
returns: -0.20% per month, or -7.2% after three years (-0.20% x 36 months), with a t-statistic of
-3.70 (Table 6.a). When the intercept is adjusted to control for the size and BE/ME
characteristics of the sample, the abnormal performance is lower. The adjusted intercept is
-0.14%, which corresponds to a three-year abnormal return of -5% (t-statistic = -2.61). The
intercept from the VW regression is not significant at -0.03 (t-statistic = -0.48), translating into a
three year average abnormal return of only -1.1%. The adjusted intercept for the VW acquirer
portfolio is virtually identical. Since the abnormal returns are only significant when the event
firms receive equal weight in the portfolio, it appears that small acquirers are more prone to
underperformance in the post-event period. This finding is similar to that previously documented
by Brav and Gompers (1997) and Brav, Geczy, and Gompers (1999) with equity issuers.

24
With respect to portfolios composed of firms in the lowest BE/ME quintile (growth or
glamour firms), EW acquirer portfolios have significantly negative intercepts of -0.37
(t-statistic = -3.64), corresponding to three-year average abnormal returns of -13.3%. However,
this does not appear to be entirely a “merger effect,” as the adjusted intercept is only -0.18%
(-6.5% over three years), with a t-statistic of -1.76. Acquirers with high BE/ME (value firms)
have an EW portfolio intercept of 0.00 and an adjusted intercept of -0.08, suggesting that these
firms are fairly priced during the post-event period. Again, when the firms are value-weighted,
the intercepts are statistically insignificant for both the growth and value portfolios.12
Like other researchers, we find that acquirer underperformance is limited to those firms
that use at least some stock to finance the acquisition. The EW stock financed acquirer portfolio
intercept is -0.33 (t-statistic = -4.64), versus -0.09 (t-statistic = -1.14) for the EW no stock
portfolio. The differential performance based on the type of financing survives value-weighting.
The t-statistic for the difference between the stock financed and the non-stock financed adjusted
intercepts is 2.06, although neither adjusted intercept is significant on its own.
The conclusion from the acquirer regressions is that, on an EW basis, acquirers tend to
significantly underperform in the three years following the acquisition, but that this appears to be
limited to those acquirers using stock financing. On a VW basis, there is virtually no evidence of
acquirer stock price underperformance. This can be due to either the VW regressions having low
power to detect abnormal performance, or because the larger firms actually do not underperform.
We try to distinguish between these two scenarios in the subsequent section, but the high R-
squares (generally over 0.90) hint that these regressions indeed have considerable power.
Moreover, the VW adjusted intercept estimates are small in economic terms, ranging from -0.20
to 0.15, which is consistent with these firms being fairly priced on average.
12 Acquiring firms have significantly positive average monthly abnormal returns in the three-year period prior to themerger, on both an equal- and value-weight basis (17.6% and 6.8% over the three-year period, respectively).
25
Table 6.b displays the calendar-time SEO portfolio regression results. The EW issuer
portfolio has significantly negative abnormal returns in the three years following the equity issue,
averaging -0.33% per month or -12% over three years (t-statistic = -5.19). Again, not all of the
measured abnormal performance is attributable to the equity issue event, as the adjusted intercept
is -0.22, or -7.9% over three years (t-statistic = -3.51).13 Although utilities account for a sizeable
fraction of the equity issue sample, the measured underperformance is essentially unchanged
when we exclude utilities. It appears that the underperformance of the seasoned equity issuers is
confined to the EW value portfolio. When the equity issuer event portfolio is value-weighted,
there is virtually no evidence of underperformance, for the full sample or for the various sub-
samples.
The full sample repurchase portfolios show no signs of abnormal performance on either
an EW or VW basis.14 The EW post-repurchase average abnormal return is 0.08% per
month less than 3% after three years and less than half this large for the VW portfolio. On an
EW basis, there is strong support for the notion that value repurchasers outperform their expected
return benchmark. The EW portfolio adjusted intercept is 0.48% per month, or 17.3% after three
years, largely consistent with Ikenberry, Lakonishok, and Vermaelen (1995). However, this
relation disappears when the repurchase firms are value-weighted.
C. Robustness of the Calendar-Time Portfolio Regressions
While the calendar-time portfolio approach solves the dependence problem associated
with event-time abnormal performance measures, it has several potential problems that should be
addressed. First, the regressions assume that the factor loadings are constant through time, up to
390 months, which is unlikely since the composition of the event portfolio changes each month.
These events tend to cluster through time by industry, and different industries have different
13 On an EW basis, issuing firms have significantly positive abnormal returns in the three years prior to issuingequity, averaging 1.19% per month or 42.8% over three years (t-statistic = 14.05), while the VW issue portfoliosshow no evidence of significant abnormal returns in the pre-issue period.14 There is no evidence of abnormal performance prior to the stock repurchase.

26
factor loadings (Fama and French, 1997). The portfolio composition is likely heavily weighted
in a few industries at each point in time, but different industries at longer intervals. This may
lead to biased estimates. Second, the changing portfolio composition may introduce
heteroskedasticity, as the variance is related to the number of firms in the portfolio. This may
cause the OLS estimator to be inefficient, but will not lead to biased estimates. A third concern
of this procedure is that the calendar-time portfolio approach weights each month equally, so that
months that reflect heavy event activity are treated the same as months with low activity
(Loughran and Ritter, 1999). If there is differential abnormal performance in periods of high
activity versus periods of low activity, the regression approach will average over these, and may
be less likely to uncover abnormal performance. In other words, the full sample period
regression, which tests for average monthly abnormal returns (given the model), will have low
power against the alternative of abnormal performance in “hot” markets and no abnormal
performance otherwise. A final concern is that the calendar-time portfolio regressions have low
power to detect abnormal performance, as argued by Loughran and Ritter (1999).
Our first approach is to directly address the specific concerns of Loughran and Ritter
(1999). In addition, we address these concerns simultaneously, by repeating the calendar-time
portfolio analysis using the calendar-time abnormal return (CTAR) methodology, first used by
Jaffe (1974) and Mandelker (1974), and strongly advocated by Fama (1998).
C.1. Heteroskedasticity
One important statistical issue is whether and how to control for heteroskedasticity.
Since the number of firms in the event portfolio changes through time, the portfolio residual
variance may also be changing through time. We mitigate the heteroskedasticity problem
substantially by requiring at least 10 firms in the event portfolio at each point in time, which
accounts for the majority of the diversification effect of the portfolio residual variance. The
question is whether more should be done. One common “correction” for EW portfolios is
weighted least squares, where the weights are proportional to n (for example, see Franks,

27
Harris, and Titman (1991). Here, the effects of the number of firms in the event portfolio
changing through time on the residual variance can be neutralized by transforming the regression
as in equation (7).
22
2
1,,
,,
,,
1)(
)()()()(
tt
n
ititp
tppttp
tppttp
nnne
nVarnVarn
VarnXVarnRVarnXnRn
σσε
εβεβ
=⋅⋅=���
�⋅=⋅
⋅+⋅⋅=⋅
+⋅⋅=⋅
=
(7)
This transformation assumes that the individual firm residuals are independent, and
effectively gives equal weight to all observations. However, this completely defeats the purpose
of forming calendar-time portfolios, which is to account for the fact that individual firm residuals
are cross-sectionally correlated.
Our approach to deal with the potential problems of heteroskedasticity is to calculate the
finite-sample critical values using a general non-parametric bootstrap procedure detailed in
Horowitz (1996). This procedure is quite general and can be used for unknown forms of
heteroskedasticity. Specifically, the bootstrapping procedure amounts to sampling 1,000 (y,X)
pairs from the original data with replacement. We estimate b*, s*, and t* for each bootstrap
sample, where b* and s* are the OLS coefficient and standard error estimates, and t* = (b*-β)/s*,
where β is the original OLS estimate. The empirical distribution of the t-statistics is used to
determine the finite-sample critical values. We reject the null if |t| > z*, where t is the original
t-statistic and z* is the critical value from the empirical distribution of t-statistics.
We find that inferences are unaffected using the bootstrapped critical values rather than
the traditional 5% level critical value of 1.96 for all of the intercepts. As can be seen below, the
full sample bootstrapped critical values are tightly scattered around the theoretical 5% critical
value of 1.96.
Bootstrapped Critical Values for Full Sample Calendar-Time Portfolio Regressions
Equal-Weight Value-WeightMergers SEOs Repurchases Mergers SEOs Repurchases
2.09 2.13 1.92 2.08 1.91 1.92

28
C.2. Hot versus Cold Markets
We test for differential performance in heavy and low event activity periods. We rerun
the full sample portfolio regressions after including two dummy variables, formed on whether
there are an unusually large or small number of firms in the event portfolio during that calendar
month (see Table 6). We define monthly activity as the number of firms in the event portfolio
divided by the number of firms listed in the CRSP monthly return files that month, accounting
for the changing composition of the CRSP population through time. Because Nasdaq firms are
added to CRSP in the middle of our sample period, we first define event activity for each
exchange, and then create a CRSP-level activity index as the weighted average of the exchange-
level activity indices. The “HOT” variable is equal to one if event activity lies above the 70th
percentile of all monthly activities, and zero otherwise; while the “COLD” variable is equal to
one if event activity lies below the 30th percentile of all monthly activities, and zero otherwise.
The coefficient on the HOT dummy variable is insignificant for all of the samples, regardless of
whether EW or VW portfolios are analyzed, and regardless of whether the coefficients are
adjusted or not. The coefficient on the COLD dummy variable is only significant for the VW
SEO portfolio. Specifically, the average monthly abnormal returns (adjusted) for the VW SEO
portfolio are -0.15% (t-statistic = -1.26) in normal activity periods, 0.07% (t-statistic = 0.41) in
heavy activity periods, and 0.42% (t-statistic = 2.34) in low activity periods. These results
suggest that the measured abnormal performance for our event samples is not systematically
related to the intensity of the event activity. Our evidence is inconsistent with the hypothesis
advanced by Loughran and Ritter (1999) that abnormal performance is concentrated in periods
when there are a relatively large number of events.
C.3. Calendar-Time Abnormal Returns (CTARs)
The CTAR is the average abnormal return calculated each calendar month for all sample
firms that have completed the event within the prior three years:
CTAR R E Rt p t p t= −, ,( ) (8)

29
where Rp,t is the monthly return on the portfolio of event firms, and E(Rp,t) is the expected return
on the event portfolio. The expected return on the event portfolio is proxied by both the Fama
and French (FF) three-factor model and with the 25 size-BE/ME portfolios. The CTAR approach
is similar in spirit to the portfolio regression method, in that event portfolio abnormal returns are
calculated in calendar-time, such that the portfolio variance accounts for the cross-sectional
correlation in the individual event firm abnormal returns.
When the 25 size-BE/ME portfolios serve as the expected return proxy, the benchmark
can change through time to reflect changes in the firm’s characteristics. Moreover, even when
expected returns are proxied by the FF three-factor model, the changing parameter problem is
mitigated. Proxying expected returns with the FF three-factor model amounts to estimating
individual firm factor loadings over a five-year post-event estimation period (requiring at least 36
months of valid returns), and then averaging these to form the monthly portfolio factor loadings.
Although parameter estimates are assumed constant for each sample firm over the five-year
estimation period, the event portfolio parameters are allowed to change each month as new firms
are added, and seasoned firms are dropped.
The monthly CTARs are standardized by estimates of the portfolio standard deviation,
which serves two purposes (see Table 7 for details). First, by standardizing the monthly CTARs,
we control for heteroskedasticity. Second, standardizing effectively gives more weight to periods
of heavy event activity than periods of low event activity because the portfolio residual variance
is decreasing in portfolio size, all else equal. Each standardized monthly CTAR should have
mean zero, and should be independent. Therefore, statistical inference is based on the time-series
mean of the monthly standardized CTARs, and standard error of the mean.15
The results from the CTAR analysis are presented in Table 7. For the most part, the
CTAR results are similar to the portfolio regression results for all three of the event samples,
15 The time-series mean monthly CTARs is the measure of abnormal performance, while t-statistics are calculatedfrom the time-series of monthly standardized CTARs. In some cases, it is possible for the mean CTAR to beassociated with a t-statistic of opposite sign, depending on the estimated variances.

30
indicating that the regression results are quite robust. The primary difference is that virtually all
of the CTARs are smaller in magnitude than the corresponding regression estimate, suggesting
that the regression intercepts are not biased towards zero as some of the potential concerns
predict.
The main result from the acquirer sample significantly negative abnormal returns are
limited to stock mergers is robust to the CTAR methodology, with the exception of the EW
portfolio relative to the 25 size-BE/ME portfolios. In fact, when the 25 size-BE/ME portfolios
are used as the expected return benchmark, none of the EW post-event acquirer portfolios have
significant abnormal returns the three year abnormal return for the full sample is only -1.44%
with a t-statistic of 0.78. Moreover, there is no significant difference between the value and
growth acquirer portfolios for either of the benchmarks, regardless of whether the portfolios are
EW or VW.
Again, the CTAR results for issuers largely confirm those from the calendar-time portfolio
regressions. The EW portfolio experiences abnormally low returns following the equity issue, on
the order of -9% over three years, with a t-statistic around -4.6 or -3.4 depending on which
benchmark is used. There is no hint of differential abnormal performance between the growth
and value portfolios, as the t-statistics for the difference range from -0.07 to 0.57. Value-
weighting eliminates reliable underperformance for the full sample.
The EW CTAR results for repurchasers have a greater tendency to be statistically
significant than the calendar-time portfolio regressions, but are of similar magnitude. The most
notable difference is that the EW repurchase portfolio average abnormal returns are now
significant. In particular, the three-year EW abnormal returns are 3.2% (t-statistic = 2.06) and
5.8% (t-statistic = 3.65) for the FF 3-factor and 25 size-BE/ME adjusted CTARs, respectively.
Again, there is no difference between the abnormal returns of the value and growth portfolios,
and no evidence of abnormal performance when the repurchaser portfolios are value-weighted.

31
Overall, the CTAR results tend to confirm our inferences from the calendar-time portfolio
regressions, but indicate that the point estimates are slightly smaller. To the extent that the CTAR
methodology is plagued by fewer statistical flaws, more faith should be placed in these results.
C.4. Power of the Calendar-Time Portfolio Approach
In order to directly address the concerns raised in Loughran and Ritter (1999), we assess
the specification and power of the calendar-time portfolio regressions and the FF CTARs.
Specifically, we calculate abnormal performance for random samples of similar size and time
period to those analyzed in this study. We draw 1,000 random samples of 2,000 firms over the
period July 1963 to December 1993 from the population of CRSP firms with at least one valid
return. For each of the 1,000 random samples, we induce three-year abnormal returns ranging
from -20% to 20%. Tables 8.a and 8.b report the results, and plot the power functions. The
calendar-time portfolio regressions and CTARs are better specified when the portfolios are value-
weighted rather than equally-weighted. Moreover, both of the calendar-time portfolio
methodologies reject over 99% of the time with induced abnormal performance of ±15% over
three years, regardless of weighting scheme.
We conclude that the calendar-time portfolio approach has sufficient power to detect
abnormal performance over economically important ranges. Moreover, in direct contrast to the
claims of Loughran and Ritter (1999), we find that the calendar-time portfolio approach has more
power to detect abnormal performance than the BHAR approach after accounting for cross-
sectional dependence of individual firm abnormal returns.
VI. INTERPRETING THE RESULTS
A. Violating the Assumption of Independence
Because of positive cross-sectional correlation of individual firm abnormal returns, which
is increasing in holding period, the p-values associated with BHARs are surely overstated. For
our three samples, standard errors that account for cross-sectional correlations of annual

32
abnormal returns are over 4 times as large for the SEO sample and roughly 2.5 times those that
assume independence for the merger and share repurchase samples. Consistent with earlier
research by Bernard (1987), we find that the average correlation of individual firm abnormal
returns increases dramatically with the holding period, suggesting that the standard errors
assuming independence for three-year BHARs are even more severely overstated.
This point is often dismissed in long-term event studies, which frequently claim that
bootstrapping solves all dependence problems. However, this is not true. An empirical
distribution created by randomly selecting firms with similar size-BE/ME characteristics does not
replicate the covariance structure underlying the original event sample. In fact, the typical
bootstrapping approach does not even capture the cross-sectional correlation structure related to
industry effects documented by Bernard (1987), Brav (1999) and others. Moreover, Bernard
shows that the average inter-industry cross-sectional correlation of individual abnormal returns is
also positive. Our estimate of the average correlation of three-year BHARs for SEOs is only
0.0035, but this is important when there are over 9.8 million unique correlations.
There are essentially three approaches to dealing with cross-sectional correlation of
abnormal returns. The first approach is to ignore the problem by assuming all event
announcements are independent, and that event firms are directly comparable to randomly
selected non-event firms. The second approach is to recognize that cross-sectional dependence
may be a serious problem, and estimate the covariance structure. The final approach is to form
calendar-time portfolios, which completely avoids the problems associated with cross-sectional
dependence. In light of the evidence that the event firm abnormal returns for our three samples
show considerable cross-sectional dependence, ignoring the problem is clearly not appropriate.
Moreover, the approaches prescribed by Brav (1999) and Lyon, Barber, and Tsai (1999) do not
provide a complete correction to the dependence problem. Like Fama (1998), we strongly
advocate the use of a calendar-time portfolio approach.
33
B. On the Joint Test Problem and Attributing Mis-Pricing to “Event” Samples
All tests of long-term stock price performance are necessarily joint tests of market
efficiency and the assumed model of expected returns, whether an asset pricing model, such as
the FF three-factor model, or some other expected return benchmark, such as the 25 size-BE/ME
portfolios. With this in mind, it is interesting to examine whether the measured abnormal
performance is merely a manifestation of known mis-pricings of the FF three-factor model. In
other words, it is clear that there is some reliable mis-pricing of securities, given the model.
However, it is not clear that all of the mis-pricing is unique to the event firms.
Fama and French (1993, 1996), Fama (1998), and Davis, Fama, and French (1999)
emphasize that the FF three-factor model is unable to completely describe the cross-section of
expected returns, even on the dimensions on which it is based. This is illustrated by the several
statistically significant intercepts from the generic size-BE/ME portfolios reported in Table 5.
Interestingly, across all three event samples, both EW and VW, none of the full sample post-
event average abnormal returns fall outside of the range of the generic size-BE/ME portfolio
intercepts. Although the EW acquirer and issuer portfolios have significantly negative intercepts,
the estimates are smaller in magnitude than some of the intercepts that are deemed sufficiently
small to justify use of the model in the first place.
This suggests that the null hypothesis intercept equals zero may be problematic for
samples tilted towards characteristics that the model cannot price in the first place. We find that
much of what is typically attributed to an “event” is really a more common phenomenon that the
event firms happen to be correlated with. For example, comparison of the estimated intercepts
and the adjusted intercepts for the EW portfolios suggests that one-third of the estimated
abnormal performance for mergers and SEOs is due to model mis-specification, rather than the
“event.” The model misspecification is especially severe for the EW event portfolios composed
of “growth” firms. In particular, one half of the estimated abnormal return for growth acquirers,
and virtually none of the estimated abnormal returns for growth equity issuers and share
repurchasers is unique to the event firms, per se. Instead, the FF three-factor model over

34
estimates the expected returns of otherwise similar non-event growth firms just as poorly. This is
especially severe for small growth firms.
C. Economic Significance
Interpreting the economic significance of the estimates is nearly as tricky as assessing the
statistical reliability. Consider the SEO sample, which is associated with the most reliable
abnormal return estimate. The EW and VW calendar-time portfolio regressions imply three-year
abnormal returns of -7.9% and 0.0%, respectively, after adjusting for the expected abnormal
performance, given the sample composition. On an equal-weight basis, where all firms are
treated as equally important, this is suggestive of serious mis-pricing. However, the reliable
evidence of abnormal performance is restricted to the smallest stocks. After controlling for the
known pricing deficiencies of the FF three-factor model, only the smallest quintile of SEO firms
have reliably significant abnormal returns, and this only on an EW basis (results not reported).
Fama and French (1993) report that the firms in the smallest quintile (based on NYSE
breakpoints) account for only 2.8% of the value of the CRSP VW stock market, on average.
Although this represents a large number of firms, it is not clear how economically important this
portion of the market is for assessing overall stock market efficiency.
In general, the VW average abnormal returns are not very large in economic terms. For
the full samples, the VW calendar-time portfolio adjusted intercepts correspond to a range of
-1.4% to 0.0% over three-years. Finally, it is interesting to note that for the firms in the largest
size quintile on average representing 73.9% of the value of the CRSP VW stock market none
of the adjusted intercepts from the calendar-time portfolio regressions are reliably different from
the expected null for any of the three-samples, regardless of whether EWs or VWs are used
(results not reported).

35
VII. CONCLUSION
This paper re-examines the reliability of recent long-term stock price performance
estimates using three large well-explored samples of major corporate events. We find that the
popular approach of measuring long-term abnormal performance with mean BHARs in
conjunction with bootstrapping is not an adequate methodology because it assumes independence
of multi-year event firm abnormal returns. We show that event firm abnormal returns are
positively cross-correlated when overlapping in calendar-time. As such, assuming independence
is problematic for any long-term abnormal performance methodology. Moreover, this is likely to
be a problem for most event samples, not just the mergers, SEOs, and share repurchases
examined in this paper, since major corporate actions are not random. As a result, we strongly
advocate a methodology that accounts for the dependence of event firm abnormal returns, such as
the calendar-time portfolio approach.
The primary implication of our results is that most of the evidence against market
efficiency consisting of recent studies measuring significant long-term abnormal returns
following major corporate events is largely irrelevant because these studies assume
independence. Our estimates of long-term abnormal performance that account for the positive
cross-correlations of event firm abnormal returns produce very little evidence of long-term
abnormal performance.

36
APPENDIX A --- CALCULATING “CORRECTED” t-STATISTICS
To calculate “corrected” t-statistics that account for cross-correlation of three-year
BHARs, we assume a very simple correlation structure to calculate the average correlation of
three-year BHARs across all of our 4,439 observations. The correlation matrix requires only an
estimate of the average correlation of three-year BHARs for sample firms with complete (36
months) calendar-time overlap. This is because we assume that the correlation is decreasing
linearly as the amount of overlap falls from complete calendar-time overlap of 36 months to no
overlap between observations (see Table A.1). We assume that the average correlation of BHARs
with 36 months of calendar-time overlap is ρ = 0.02576. Recall that this is our estimate using
annual BHARs, which almost surely understates the true correlation of three-year BHARs with 36
months of overlap. We then estimate the correlation of three-year BHARs with 35 months of
overlap as 02504.036/35 =⋅ ρ , and so on. The estimate for non-overlapping observations is
zero. This procedure produces an average correlation for the BHARs of 0.00351.
We then use the average correlation of the three-year BHARs to adjust the t-statistic that
assumes independence. Using equation (4), we are able to determine by how much the t-statistic
that assumes independence is understated.16
0.24600351.0)1439,4(1
1
)1(1
1)()(
,
=⋅−+
=−+
≈jiBHAR
BHAR
NDependenceceIndependen
ρσσ (4)
Although the average correlation is small, the standard deviation that assumes independence is
less than one-fourth the magnitude of the standard deviation that accounts for cross-correlation.
This translates directly into t-statistics that are four times too large if observations are assumed to
be independent (-6.05 versus -1.49).
16 The approximation of the ratio of σ(Independence) to σ(Dependence) assumes equal variances of the individualBHARs.

37
Table A.1Correlation Structure for the Seasoned Equity Issuer Sample
Number of Monthsof Overlap
Number of UniqueCorrelations
2/)1( −nnAssumed Correlation
Structure Estimated Correlation
36 50,241 ρ 0.0257635 96,914 35/36*ρ 0.0250434 92,094 34/36*ρ 0.0243333 88,297 33/36*ρ 0.0236132 84,531 0.0229031 80,937 0.0221830 79,158 0.0214729 75,881 0.0207528 73,894 0.0200427 72,001 0.0193226 71,554 0.0186025 70,956 0.0178924 71,347 0.0171723 69,456 0.0164622 68,503 0.0157421 66,132 0.0150320 66,093 0.0143119 65,627 0.0136018 65,674 0.0128817 63,926 0.0121616 63,106 0.0114515 62,344 0.0107314 62,531 0.0100213 63,139 0.0093012 64,265 0.0085911 62,811 0.0078710 63,017 0.007169 61,357 0.006448 62,370 0.005727 61,621 0.005016 61,945 0.004295 61,800 0.003584 62,704 0.002863 63,196 0.002152 63,684 2/36*ρ 0.001431 63,357 1/36*ρ 0.000720 7,373,678 0 0.00000
Average = 0.00351

38
REFERENCES
Andrade, Gregor and Erik Stafford, 1999. “Investigating the Economic Role of Mergers,” HarvardBusiness School working paper.
Barber, Brad M. and John D. Lyon, 1997. “Detecting Long-Run Abnormal Stock Returns: The EmpiricalPower and Specification of Test Statistics,” Journal of Financial Economics 43, 341-372.
Barberis, N., Andrei Shleifer, and Robert Vishny, 1998. “A Model of Investor Sentiment,” Journal ofFinancial Economics.
Bernard, Victor L., 1987. “Cross-Sectional Dependence and Problems in Inference in Market-BasedAccounting Research,” Journal of Accounting Research 25, 1-48.
Brav, Alon, 1999. “Inference in Long-Horizon Event Studies: A Parametric Bootstrap Approach withApplication to Initial Public Offerings,” forthcoming, Journal of Finance.
Brav, Alon, Christopher C. Geczy, and Paul A. Gompers, 1999. “Is the abnormal return following equityissuances anomalous?” forthcoming, Journal of Financial Economics.
Brav, Alon, Paul A. Gompers, 1997. “Myth or Reality? The Long-Run Underperformance of InitialPublic Offerings: Evidence from Venture- and Nonventure-capital-backed Companies” Journal ofFinance.
Brock, William, Josef Lakonishok, and Blake LeBaron, 1992. “Simple Trading Rules and the StochasticProperties of Stock Returns,” Journal of Finance 47, 1731-1764.
Chan, Louis K. C., Narasimhan Jegadeesh, and Josef Lakonishok, 1995. “Evaluating the Performance ofValue versus Glamour Stocks: The Impact of Selection Bias,” Journal of Financial Economics 38,pp. 269-296.
Collins, Daniel W. and Warren T. Dent, 1984. “A Comparison of Alternative Testing MethodologiesUsed in Capital Market Research,” Journal of Accounting Research 22, 48-84.
Comment, Robert, and G. William Schwert, 1995. “Poison or Placebo? Evidence on the Deterrent andWealth Effects of Modern Antitakeover Measures,” Journal of Financial Economics 39, 3-43.
Davis, James L., Eugene F. Fama, and Kenneth R. French, 1999. “Characteristics, Covariances, andAverage Returns: 1929 to 1997,” forthcoming, Journal of Finance.
Efron, Bradley and Robert J. Tibshirani, 1993. An Introduction to the Bootstrap (Chapman & Hall, NewYork, NY).
Fama, Eugene F., 1970. “Efficient Capital Markets: A Review of Theory and Empirical Work,” Journalof Finance, Vol. 25, No. 2, pp. 383-417.
Fama, Eugene F., 1998. “Market Efficiency, Long-Term Returns, and Behavioral Finance,” Journal ofFinancial Economics.
39
Fama, Eugene. F. and Kenneth R. French, 1992. “The Cross-Section of Expected Stock Returns,”Journal of Finance 46, 427-465.
Fama, Eugene F. and Kenneth R. French, 1993. “Common Risk Factors in the Returns on Stocks andBonds,” Journal of Financial Economics 33, 3-56.
Fama, Eugene F. and Kenneth R. French, 1997. “Industry Costs of Equity,” Journal of FinancialEconomics 43, 153-193.
Franks, Julian, Robert S. Harris, and Sheridan Titman, 1991. “The Postmerger Share-Price Performanceof Acquiring Firms,” Journal of Financial Economics, Vol. 29, No. 1, pp. 81-96.
Horowitz, Joel L., 1996. “Bootstrap Methods in Econometrics: Theory and Numerical Performance,” inAdvances in Economics and Econometrics: Theory and Applications, Seventh World Congress, D.M. Kreps and K. F. Wallis, eds., Cambridge University Press.
Ikenberry, David, Josef Lakonishok, and Theo Vermaelen, 1995. “The Underreaction to Open MarketShare Repurchases,” Journal of Financial Economics 39, 181-208.
Jaffe, Jeffrey, 1974. “Special Information and Insider Trading,” Journal of Business 47, 411-428.
Kothari, S.P. and Jerold B. Warner, 1997. “Measuring Long-horizon Security Performance,” Journal ofFinancial Economics 43, 301-339.
Kothari, S.P., Jay Shanken, and Richard G. Sloan, 1995. “Another Look at the Cross-section of ExpectedStock Returns,” Journal of Finance 50, 185-224.
Loughran, Tim and Jay R. Ritter, 1995. “The New Issues Puzzle,” Journal of Finance 50, 23-51.
Loughran, Tim and Anand M. Vijh, 1997. “Do Long-Term Shareholders Benefit from CorporateAcquisitions?” Journal of Finance.
Loughran, Tim and Jay R. Ritter, 1999. “Uniformly Least Powerful Tests of Market Efficiency,”forthcoming, Journal of Financial Economics.
Lyon, John D., Brad Barber and Chih-Ling Tsai, 1999. “Improved Methods for Tests of Long-RunAbnormal Stock Returns,” Journal of Finance, Vol. 54, No.1.
Mandelker, Gershon, 1974. “Risk and Return: The Case of Merging Firms,” Journal of FinancialEconomics 1, 303-335.
Mitchell, Mark L. and J. Harold Mulherin, 1996. “The Impact of Industry Shocks on Takeover andRestructuring Activity,” Journal of Financial Economics 41, 193-229.
Rau, P. Raghavendra and Theo Vermaelen, 1998. “Glamour, Value and the Post-AcquisitionPerformance of Acquiring Firms,” Journal of Financial Economics, Vol. 49, No. 2, pp. 223-253.
Ritter, Jay R., 1991. “The Long-run Performance of Initial Public Offerings,” Journal of Finance 46,pp. 3-27.

40
Sefcik, Stephen E. and Rex Thompson, 1986. “An Approach to Statistical Inference in Cross-SectionalModels with Security Abnormal Returns as Dependent Variables,” Journal of Accounting Research24, 316-334.
Shumway, Tyler, 1997. “The Delisting Bias in CRSP Data,” Journal of Finance 52, 327-340.
Speiss, D. Katherine and John Affleck-Graves, 1995. “Underperformance in Long-Run Stock ReturnsFollowing Seasoned Equity Offerings,” Journal of Financial Economics 38, 243-267.

41
Table IDistribution of Event Sample Firms by Size and Book-to-Market Equity (7/61 – 12/93)
Size and book-to-market equity groupings are based on independent rankings of sample firms relative to NYSEquintiles in both the year prior (t-1) and subsequent (t+1) to the completion of the event.
Panel A: MergersBook-to-Market (t-1) Book-to-Market (t+1)
Low 2 3 4 High Low 2 3 4 High
Small 3.3 2.1 2.4 2.5 4.0 14.3 3.0 2.1 2.5 2.0 4.0 13.62 3.0 2.8 2.9 2.7 2.8 14.2 2.5 3.2 2.1 2.3 2.4 12.53 4.2 2.6 3.3 3.5 1.9 15.5 3.5 3.5 2.9 3.4 1.9 15.24 5.1 5.3 5.3 4.2 2.6 22.7 5.3 5.9 6.1 4.4 2.2 23.9
Large 11.4 8.5 6.6 5.0 1.8 33.3 12.0 8.2 7.0 5.1 2.6 34.827.1 21.3 20.6 17.9 13.1 100.0 26.3 22.9 20.7 17.1 13.0 100.0
Panel B: Seasoned Equity OfferingsLow 2 3 4 High Low 2 3 4 High
Small 16.1 6.0 4.4 4.6 5.5 36.6 16.5 5.8 3.8 2.8 2.7 31.62 8.2 3.0 2.9 2.6 2.5 19.3 10.9 3.9 2.6 2.2 1.6 21.13 4.3 2.9 2.9 3.2 2.0 15.3 7.1 2.7 2.7 2.8 1.4 16.64 3.0 2.3 3.9 3.3 1.7 14.2 4.3 2.7 3.7 3.2 1.5 15.4
Large 2.4 2.6 3.3 4.2 2.1 14.6 3.0 2.7 3.6 3.7 2.2 15.234.1 16.8 17.5 17.9 13.7 100.0 41.7 17.9 16.3 14.7 9.4 100.0
Panel C: Share RepurchasesLow 2 3 4 High Low 2 3 4 High
Small 4.9 6.6 5.4 5.6 10.0 32.6 3.7 5.5 7.3 7.8 9.7 34.02 3.7 4.8 3.8 3.6 2.5 18.3 2.9 4.1 4.1 3.7 3.1 18.03 4.2 3.1 3.1 2.5 1.9 14.8 3.7 3.7 3.0 2.6 1.6 14.64 4.0 3.7 4.1 2.2 1.8 15.8 3.5 3.9 3.8 2.9 2.0 16.2
Large 6.5 4.2 3.7 3.0 1.0 18.5 5.8 4.2 3.2 2.7 1.3 17.223.4 22.4 20.1 16.9 17.2 100.0 19.6 21.3 21.5 19.8 17.8 100.0
Panel D: CRSP UniverseLow 2 3 4 High
Small 14.5 8.8 8.2 9.7 16.8 57.92 4.0 2.9 2.9 2.6 2.4 14.83 3.0 2.3 2.2 1.9 1.4 10.74 2.6 2.0 1.8 1.5 0.9 8.7Large 2.7 1.8 1.5 1.2 0.6 7.9
26.9 17.7 16.5 16.8 22.1 100.0

42
Table II.aThree-Year Mean Buy-and-Hold Abnormal Returns (BHARs) for Acquirers (7/61 - 12/93)
BHARs are calculated as the difference between the equal- and value-weight average three-year return for the event firms and the benchmark portfolios. Three-year returns begin the month following completion of the event. The benchmark portfolios are 25 value-weight non-rebalanced portfolios formed on size andbook-to-market equity (BE/ME) based on NYSE breakpoints. Statistical inference is based on an empirical distribution created by simulating 1,000 pseudo-samples with similar characteristics to those of the event sample firms and then calculating the mean BHAR for each pseudo-sample. The p-value is the fractionof the mean BHARs from the pseudo-samples larger in magnitude (but with the same sign) than the original mean BHAR. The wealth relative (W.R.) is theaverage three-year gross return of the sample firms divided by the average three-year gross return of the benchmark firms. Growth firms are identified as firmswith BE/ME ratios in the lowest quintile of all NYSE firms. Value firms are identified as firms with BE/ME ratios in the highest quintile of all NYSE firms.
Equal-Weight Value-WeightSample Bench W.R. BHAR p-value n Sample Bench W.R. BHAR p-value n
Post-Event 0.514 0.524 0.994 -0.010 0.164 2,068 0.381 0.419 0.973 -0.038 0.027 2,068
Pre-Event 0.881 0.597 1.178 0.285 0.000 1,796 0.468 0.420 1.034 0.048 0.320 1,796
Financed with Stock 0.393 0.477 0.943 -0.084 0.000 1,029 0.297 0.350 0.961 -0.053 0.009 1,029
Financed without Stock 0.634 0.570 1.041 0.064 0.047 1,039 0.483 0.503 0.986 -0.021 0.291 1,039
Growth Firms 0.390 0.372 1.013 0.018 0.481 526 0.302 0.333 0.977 -0.031 0.186 526
Value Firms 0.718 0.691 1.016 0.027 0.471 257 0.556 0.697 0.917 -0.142 0.149 257
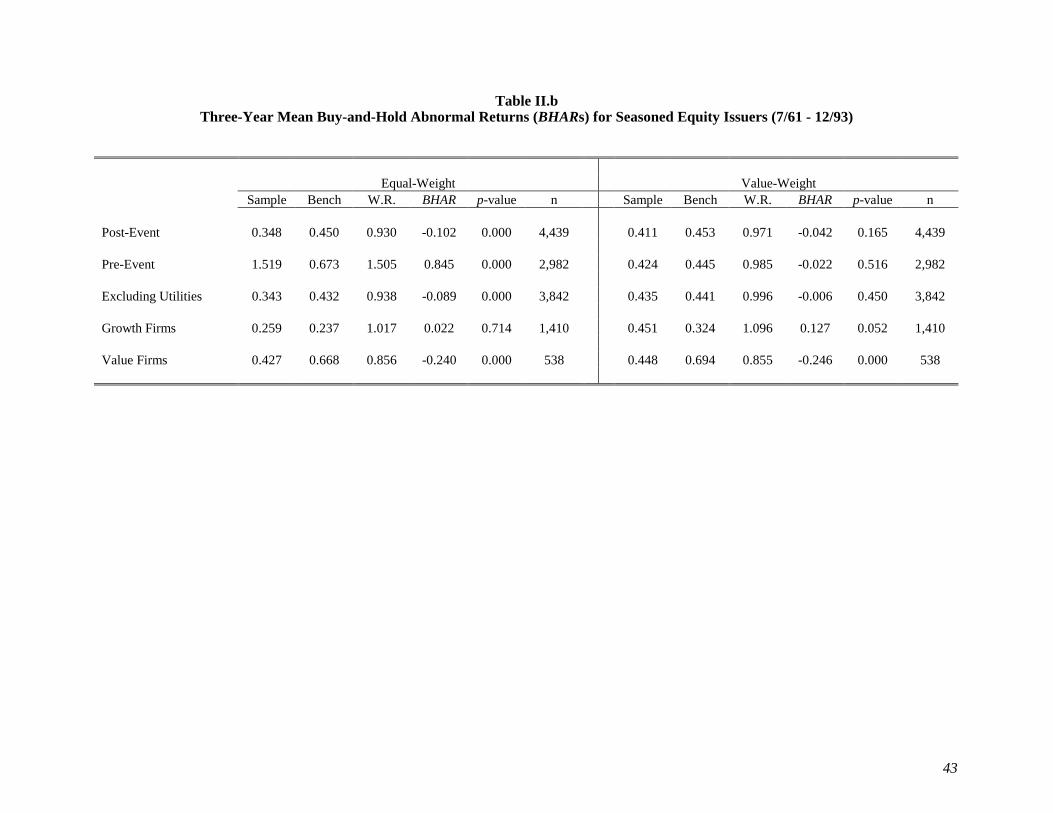
43
Table II.bThree-Year Mean Buy-and-Hold Abnormal Returns (BHARs) for Seasoned Equity Issuers (7/61 - 12/93)
Equal-Weight Value-WeightSample Bench W.R. BHAR p-value n Sample Bench W.R. BHAR p-value n
Post-Event 0.348 0.450 0.930 -0.102 0.000 4,439 0.411 0.453 0.971 -0.042 0.165 4,439
Pre-Event 1.519 0.673 1.505 0.845 0.000 2,982 0.424 0.445 0.985 -0.022 0.516 2,982
Excluding Utilities 0.343 0.432 0.938 -0.089 0.000 3,842 0.435 0.441 0.996 -0.006 0.450 3,842
Growth Firms 0.259 0.237 1.017 0.022 0.714 1,410 0.451 0.324 1.096 0.127 0.052 1,410
Value Firms 0.427 0.668 0.856 -0.240 0.000 538 0.448 0.694 0.855 -0.246 0.000 538

44
Table II.cThree-Year Mean Buy-and-Hold Abnormal Returns (BHARs) for Equity Repurchasers (7/61 - 12/93)
Equal-Weight Value-WeightSample Bench W.R. BHAR p-value n Sample Bench W.R. BHAR p-value n
Post-Event 0.787 0.642 1.088 0.145 0.000 2,292 0.541 0.475 1.044 0.066 0.227 2,292
Pre-Event 0.558 0.529 1.019 0.029 0.346 1,919 0.458 0.428 1.021 0.030 0.459 1,919
Open Market 0.776 0.620 1.096 0.156 0.000 1,942 0.559 0.480 1.053 0.079 0.112 1,942
Tender Offer 0.854 0.767 1.049 0.087 0.228 350 0.442 0.449 0.995 -0.007 0.482 350
Growth Firms 0.590 0.491 1.067 0.099 0.021 503 0.382 0.353 1.021 0.028 0.460 503
Value Firms 1.096 0.852 1.132 0.244 0.030 369 0.824 0.641 1.111 0.183 0.134 369
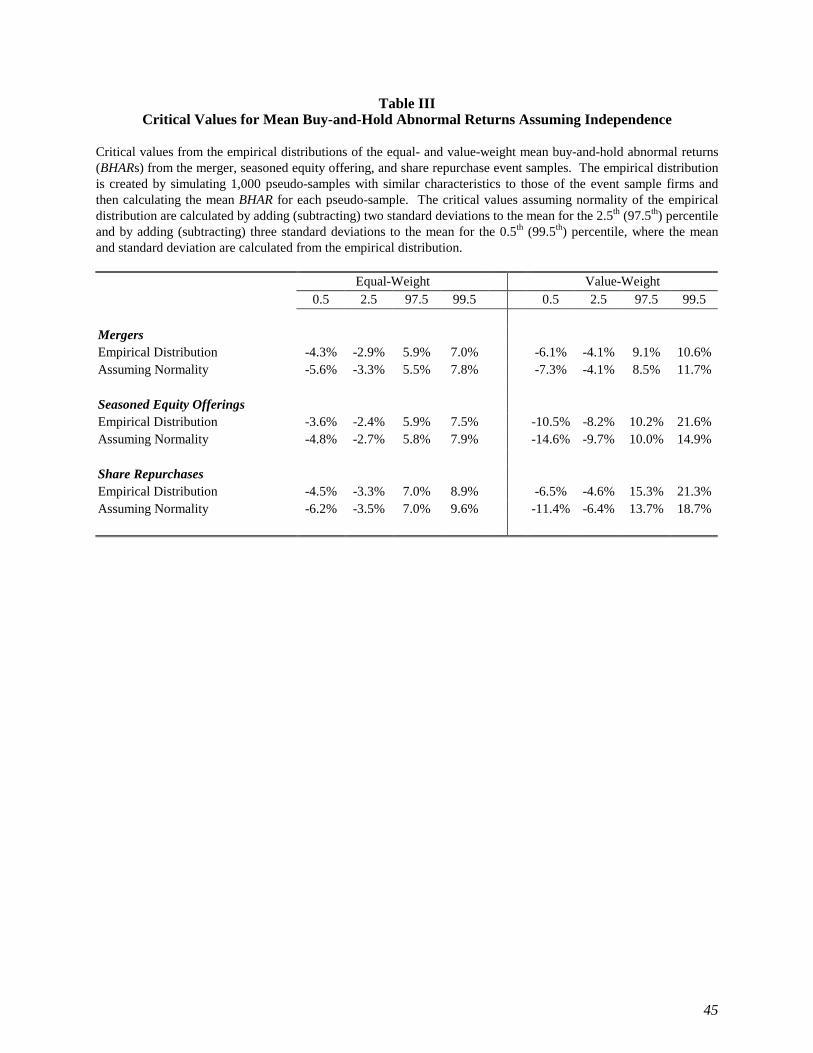
45
Table IIICritical Values for Mean Buy-and-Hold Abnormal Returns Assuming Independence
Critical values from the empirical distributions of the equal- and value-weight mean buy-and-hold abnormal returns(BHARs) from the merger, seasoned equity offering, and share repurchase event samples. The empirical distributionis created by simulating 1,000 pseudo-samples with similar characteristics to those of the event sample firms andthen calculating the mean BHAR for each pseudo-sample. The critical values assuming normality of the empiricaldistribution are calculated by adding (subtracting) two standard deviations to the mean for the 2.5th (97.5th) percentileand by adding (subtracting) three standard deviations to the mean for the 0.5th (99.5th) percentile, where the meanand standard deviation are calculated from the empirical distribution.
Equal-Weight Value-Weight0.5 2.5 97.5 99.5 0.5 2.5 97.5 99.5
MergersEmpirical Distribution -4.3% -2.9% 5.9% 7.0% -6.1% -4.1% 9.1% 10.6%Assuming Normality -5.6% -3.3% 5.5% 7.8% -7.3% -4.1% 8.5% 11.7%
Seasoned Equity OfferingsEmpirical Distribution -3.6% -2.4% 5.9% 7.5% -10.5% -8.2% 10.2% 21.6%Assuming Normality -4.8% -2.7% 5.8% 7.9% -14.6% -9.7% 10.0% 14.9%
Share RepurchasesEmpirical Distribution -4.5% -3.3% 7.0% 8.9% -6.5% -4.6% 15.3% 21.3%Assuming Normality -6.2% -3.5% 7.0% 9.6% -11.4% -6.4% 13.7% 18.7%

46
Table IVCorrected t-Statistics for Average Three-Year Buy and Hold Abnormal Returns (BHARs)
The “corrected” t-statistics are adjusted to account for cross-correlation of individual BHARs using the correlationstructure described in Appendix A. Average BHARs are calculated as the difference between the equal-weightaverage three-year return for the sample of event firms and the benchmark portfolios. Three-year returns begin themonth following completion of the event. The benchmark portfolios are 25 value-weight non-rebalanced portfoliosformed on size and book-to-market equity based on NYSE breakpoints. The empirical distribution is created bysimulating 1,000 pseudo-samples with similar characteristics to those of the event sample firms and then calculatingthe mean BHAR for each pseudo-sample. The t-statistic that assumes independence is calculated as the averageBHAR minus the mean of the empirical distribution, all divided by the standard deviation of the empiricaldistribution. The “corrected” t-statistics are adjusted using the following approximation:
jiBHAR
BHAR
NDependenceceIndependen
,)1(1
1)()(
ρσσ
−+≈
Descriptive Statistics Mergers SEOs RepurchasesAverage BHAR -0.010 -0.102 0.145Mean of Empirical Distribution 0.0111 0.0111 0.0172Standard Deviation of Empirical Distribution 0.0222 0.0187 0.0263Average Correlation of Annual BHARs with Complete Overlap 0.0175 0.0258 0.0175
t-statisticsAssuming Independence -0.95 -6.05 4.86Using Average Correlation of Annual BHARs -0.42 -1.49 1.91Using Average Correlation of Annual BHARs + 25% -0.38 -1.34 1.73Assuming Average Correlation = 0.01 -0.52 -2.28 2.39Assuming Average Correlation = 0.02 -0.40 -1.67 1.80Assuming Average Correlation = 0.03 -0.34 -1.38 1.51

47
Table VIntercepts from Excess Stock Return Regressions of 25 Size and Book-to-Market Equity Portfolios
on the Fama and French 3-Factor Model (July 1963 – December 1993)
Dependent variables are 25 size and book-to-market equity portfolio returns, Rp, in excess of the one-monthTreasury bill rate, Rf, observed at the beginning of the month. The 25 size and book-to-market equity portfolios areformed on NYSE size and book-to-market equity quintiles. The three factors in the Fama and French model arezero-investment portfolios representing the excess return of the market, Rm - Rf; the difference between a portfolioof “small” stocks and “big” stocks, SMB; and the difference between a portfolio of “high” book-to-market stocksand “low” book-to-market stocks, HML. See Fama and French (1993) for details on the construction of the factors.
Rpt - Rft = a + b(Rmt – Rft) + sSMBt + hHMLt + et
Panel A: Intercepts
Equal-Weight Portfolios Value-Weight PortfoliosLow 2 3 4 High Low 2 3 4 High
Small -0.37 0.02 0.06 0.23 0.26 -0.49 -0.09 -0.05 0.06 0.012 -0.21 -0.01 0.11 0.11 -0.04 -0.09 0.03 0.13 0.14 0.033 -0.14 0.07 -0.01 0.14 -0.03 -0.06 0.10 0.02 0.12 -0.044 0.09 -0.14 0.02 0.01 0.03 0.14 -0.15 0.02 0.01 0.01
Large 0.10 0.00 -0.02 -0.07 -0.09 0.15 -0.01 -0.02 -0.04 -0.24
Panel B: t-statistics
Equal-Weight Portfolios Value-Weight PortfoliosLow 2 3 4 High Low 2 3 4 High
Small -2.65 0.21 0.67 2.75 2.52 -4.80 -1.22 -0.76 1.09 0.182 -2.54 -0.09 1.61 1.79 -0.60 -1.02 0.43 1.94 2.29 0.463 -1.85 1.00 -0.13 2.18 -0.41 -0.88 1.34 0.33 1.82 -0.454 1.15 -1.69 0.26 0.19 0.33 1.94 -1.93 0.29 0.16 0.12
Large 1.67 -0.02 -0.29 -1.05 -0.87 2.37 -0.08 -0.27 -0.61 -2.13

48
Table VI.aCalendar-Time Fama and French Three-Factor Model
Portfolio Regressions of Acquirers (7/61-12/93)
Dependent variables are event portfolio returns, Rp, in excess of the one-month Treasury bill rate, Rf, observed atthe beginning of the month. Each month we form equal and value-weight portfolios of all sample firms that havecompleted the event within the previous three years. The event portfolio is rebalanced monthly to drop allcompanies that reach the end of their three-year period and add all companies that have just executed a transaction.The three factors are zero-investment portfolios representing the excess return of the market, Rm - Rf; the differencebetween a portfolio of “small” stocks and “big” stocks, SMB; and the difference between a portfolio of “high” book-to-market stocks and “low” book-to-market stocks, HML. See Fama and French (1993) for details on theconstruction of the factors. The intercept, a, measures the average monthly abnormal return, given the model. Theadjusted intercept measures the difference between the intercept estimated using the event portfolio and the averageintercept estimated from 1,000 random samples of otherwise similar (based on size and book-to-market) non-eventfirms. A minimum of 10 firms in the event portfolio is required. The number of monthly observations, N, isreported in square brackets, and t-statistics are in parenthesis.
Rpt - Rft = a + b(Rmt - Rft) + sSMBt + hHMLt + et
Equal-Weight Value-Weighta Adj. a Adj. R2 a Adj. a Adj. R2
(t-stat) (t-stat) [N] (t-stat) (t-stat) [N]
Full sample (Post-Event) -0.20 -0.14 0.97 -0.03 -0.04 0.95(-3.70) (-2.61) [390] (-0.48) (-0.68) [390]
Full sample (Pre-Event) 0.49 0.52 0.97 0.19 0.15 0.94(9.49) (10.09) [378] (3.05) (2.48) [378]
Financed with Stock -0.33 -0.25 0.95 -0.14 -0.12 0.93(-4.64) (-3.59) [390] (-2.00) (-1.81) [390]
Financed without Stock -0.09 -0.04 0.94 0.14 0.10 0.89(-1.14) (-0.54) [388] (1.68) (1.19) [388]
Growth Firms -0.37 -0.18 0.90 -0.13 -0.20 0.87(-3.64) (-1.76) [373] (-1.23) (-1.95) [373]
Value Firms 0.00 -0.08 0.85 0.06 0.03 0.73(0.01) (-0.51) [355] (0.32) (0.14) [355]
Hot Market 0.00 0.04 0.97 -0.12 -0.13 0.95(0.01) (0.08) [390] (-0.89) (-0.93) [390]
Cold Market 0.11 0.14 0.97 0.19 0.19 0.95(0.85) (1.12) [390] (1.42) (1.40) [390]

49
Table VI.bCalendar-Time Fama and French Three-Factor Model
Portfolio Regressions of Seasoned Equity Issuers (7/61 - 12/93)
Equal-Weight Value-Weighta Adj. a Adj. R2 a Adj. a Adj. R2
(t-stat) (t-stat) [N] (t-stat) (t-stat) [N]
Full sample (Post-Event) -0.33 -0.22 0.96 -0.03 0.00 0.90(-5.19) (-3.51) [390] (-0.44) (-0.02) [390]
Full sample (Pre-Event) 1.28 1.30 0.95 0.19 0.17 0.90(17.39) (17.62) [378] (2.55) (2.30) [378]
Excluding Utilities -0.37 -0.26 0.97 0.06 0.09 0.91(-5.58) (-3.86) [390] (0.77) (1.08) [390]
Growth Firms -0.32 -0.07 0.94 0.19 0.16 0.88(-3.45) (-0.76) [390] (1.62) (1.39) [390]
Value Firms -0.31 -0.34 0.86 -0.24 -0.15 0.66(-2.24) (-2.52) [314] (-1.36) (-0.87) [314]
Hot Market -0.12 0.02 0.96 0.07 0.07 0.90(-0.81) (0.15) [390] (0.40) (0.41) [390]
Cold Market 0.07 -0.05 0.96 0.32 0.42 0.90(0.45) (-0.31) [390] (1.79) (2.34) [390]

50
Table VI.cCalendar-Time Fama and French Three-Factor Model
Portfolio Regressions of Equity Repurchasers (7/61 - 12/93)
Equal-Weight Value-Weighta Adj. a Adj. R2 a Adj. a Adj. R2
(t-stat) (t-stat) [N] (t-stat) (t-stat) [N]
Full sample (Post-Event) 0.08 0.08 0.96 -0.01 -0.04 0.90(1.24) (1.17) [374] (-0.11) (-0.43) [374]
Full sample (Pre-Event) -0.07 -0.05 0.95 -0.05 -0.08 0.90(-0.91) (-0.72) [378] (-0.57) (-0.94) [378]
Open Market 0.14 0.18 0.95 0.04 0.01 0.90(1.82) (2.39) [334] (0.42) (0.06) [334]
Tender Offer 0.14 0.01 0.87 -0.02 -0.09 0.73(1.14) (0.07) [323] (-0.12) (-0.50) [323]
Growth Firms -0.20 0.03 0.87 -0.08 -0.13 0.79(-1.35) (0.20) [286] (-0.50) (-0.80) [286]
Value Firms 0.65 0.48 0.86 0.29 0.17 0.75(4.99) (3.72) [306] (1.65) (0.96) [306]
Hot Market 0.14 0.04 0.96 0.22 0.17 0.90(0.92) (0.26) [374] (1.16) (0.88) [374]
Cold Market -0.13 -0.20 0.96 0.27 0.06 0.90(-0.86) (-1.31) [374] (1.37) (0.31) [374]

51
Table VII.aMean Calendar-Time Portfolio Abnormal Returns (CTARs) for Acquirers (7/61 - 12/93)
CTARs are calculated each month as the difference between the event portfolio return and the expected return on theportfolio, standardized by the portfolio residual standard deviation. Each month we form equal and value-weightevent portfolios containing all sample firms that have completed the event within the previous three years. The eventportfolio is rebalanced monthly to drop all companies that reach the end of their three-year period and add allcompanies that have just executed a transaction. The portfolio expected returns are proxied by both 25 value-weightportfolios formed on size and book-to-market equity based on NYSE breakpoints (25 Size-BE/ME), and the Famaand French three-factor model (FF 3-Factor), which amounts to estimating individual firm factor loadings over afive-year post-event estimation period (requiring at least 36 months of valid returns), and then averaging these toform the monthly portfolio factor loadings. We calculate event portfolio residual variances using 60 months ofresiduals. Residuals are calculated from portfolio regressions on the FF three-factor model and as monthlydifferences of event portfolio returns and size-BE/ME portfolio returns. Mean CTARs and standard errors arecalculated from the time-series of monthly CTARs. The number of monthly observations are reported in squarebrackets, and t-statistics are in parenthesis.
Equal-Weight Value-WeightFF 3-Factor 25 Size-BE/ME FF 3-Factor 25 Size-BE/ME
Full sample (post-event) -0.14 -0.04 -0.07 -0.03(-2.70) (0.78) (-1.75) (-0.58)[366] [389] [366] [389]
Full sample (pre-event) 0.43 0.50 0.17 0.14(8.77) (9.59) (3.33) (2.95)[364] [389] [364] [389]
Financed with Stock -0.23 -0.16 -0.13 -0.15(-3.59) (-1.22) (-2.51) (-2.27)[366] [388] [366] [388]
Financed without Stock -0.07 0.07 0.04 0.09(-0.80) (1.86) (0.34) (0.98)[366] [371] [366] [371]
Growth Firms -0.19 -0.16 -0.05 -0.14(-2.05) (-1.06) (-0.57) (-1.23)[338] [338] [338] [338]
Value Firms 0.01 0.01 -0.08 -0.17(-0.24) (0.48) (-0.76) (-1.40)[346] [346] [346] [346]

52
Table VII.bMean Calendar-Time Portfolio Abnormal Returns (CTARs)
for Seasoned Equity Issuers (7/61 - 12/93)
Equal-Weight Value-WeightFF 3-Factor 25 Size-BE/ME FF 3-Factor 25 Size-BE/ME
Full sample (post-event) -0.25 -0.21 -0.01 -0.08(-4.62) (-3.38) (-1.01) (-1.36)[366] [390] [366] [390]
Full sample (pre-event) 1.09 1.33 0.19 0.19(17.34) (21.84) (2.62) (2.62)[365] [389] [365] [389]
Excluding Utilities -0.28 -0.20 0.03 -0.02(-4.65) (-2.68) (-0.52) (-0.62)[366] [390] [366] [390]
Growth Firms -0.14 -0.02 0.04 0.00(-1.41) (-0.24) (0.07) (-0.13)[301] [301] [301] [301]
Value Firms -0.13 -0.03 -0.06 -0.06(-1.22) (-0.07) (-0.75) (-0.57)[257] [257] [257] [257]

53
Table VII.cMean Calendar-Time Portfolio Abnormal Returns (CTARs) for Equity Repurchasers (7/61 - 12/93)
Equal-Weight Value-WeightFF 3-Factor 25 Size-BE/ME FF 3-Factor 25 Size-BE/ME
Full sample (post-event) 0.09 0.16 -0.04 0.02(2.06) (3.65) (-0.14) (0.68)[366] [373] [366] [373]
Full sample (pre-event) 0.08 0.04 0.03 -0.13(1.94) (2.21) (0.78) (-1.35)[363] [379] [363] [379]
Open Market 0.14 0.25 0.02 0.05(2.20) (4.26) (0.44) (1.01)[332] [334] [332] [334]
Tender Offer 0.03 0.11 -0.15 0.09(0.21) (1.06) (-1.15) (0.67)[315] [320] [315] [320]
Growth Firms 0.13 0.26 0.01 0.01(1.09) (2.19) (0.15) (0.00)[249] [250] [249] [250]
Value Firms 0.24 0.12 -0.02 -0.04(1.78) (1.20) (0.02) (-0.28)[244] [244] [244] [244]

54
Table VIII.aSimulated Power of EW and VW Calendar-Time Portfolio Regressions Test Statistics
The percentage of 1,000 random samples of 2,000 firms rejecting the null hypothesis of no abnormal performance atvarious induced levels of abnormal returns.
0.0
0.1
0.2
0.3
0.4
0.5
0.6
0.7
0.8
0.9
1.0
-20 -16 -12 -8 -4 0 4 8 12 16 20
Induced Level of Abnormal Returns (%)
Perc
enta
ge o
f Sam
ples
Rej
ectin
g N
ull
EW VW
Percentage of Samples Rejecting the Null Based on Calendar-Time Portfolio Regressions
Induced Level of Abnormal Return (%) over Three Years-20 -15 -10 -5 0 5 10 15 20
EW 1.00 1.00 1.00 0.60 0.02 0.13 0.89 1.00 1.00VW 1.00 0.99 0.81 0.33 0.07 0.36 0.83 0.99 1.00
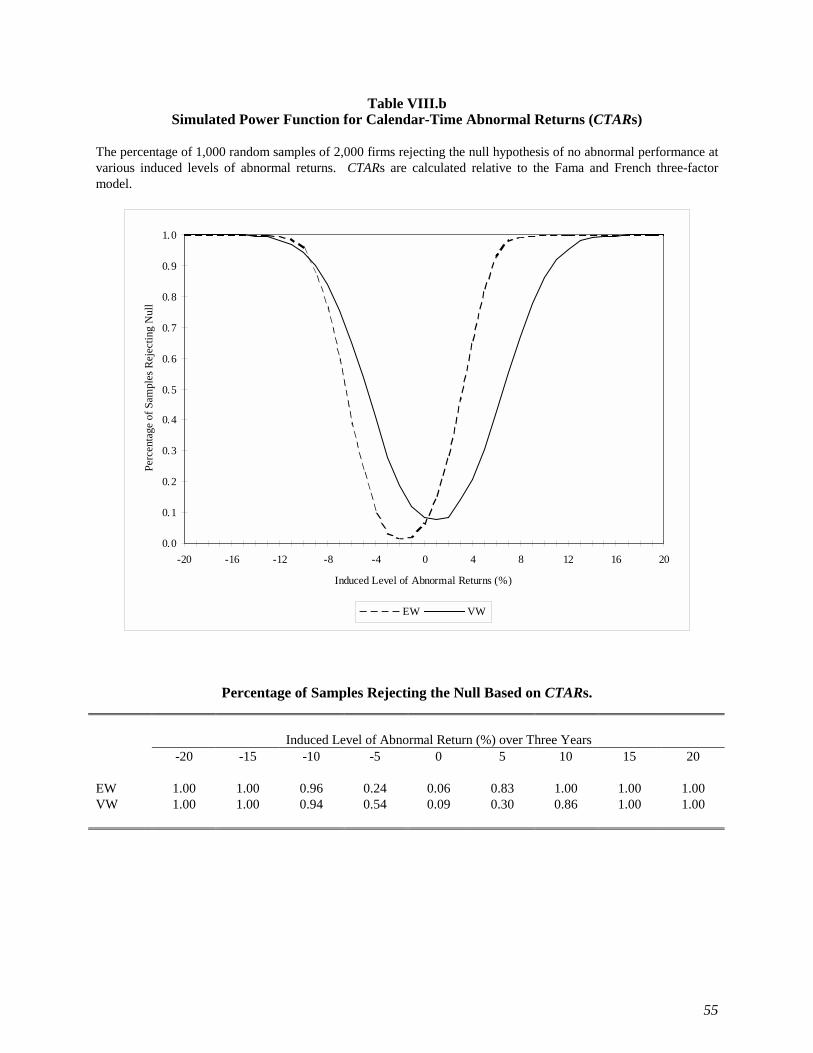
55
Table VIII.bSimulated Power Function for Calendar-Time Abnormal Returns (CTARs)
The percentage of 1,000 random samples of 2,000 firms rejecting the null hypothesis of no abnormal performance atvarious induced levels of abnormal returns. CTARs are calculated relative to the Fama and French three-factormodel.
0.0
0.1
0.2
0.3
0.4
0.5
0.6
0.7
0.8
0.9
1.0
-20 -16 -12 -8 -4 0 4 8 12 16 20
Induced Level of Abnormal Returns (%)
Perc
enta
ge o
f Sam
ples
Rej
ectin
g N
ull
EW VW
Percentage of Samples Rejecting the Null Based on CTARs.
Induced Level of Abnormal Return (%) over Three Years-20 -15 -10 -5 0 5 10 15 20
EW 1.00 1.00 0.96 0.24 0.06 0.83 1.00 1.00 1.00VW 1.00 1.00 0.94 0.54 0.09 0.30 0.86 1.00 1.00
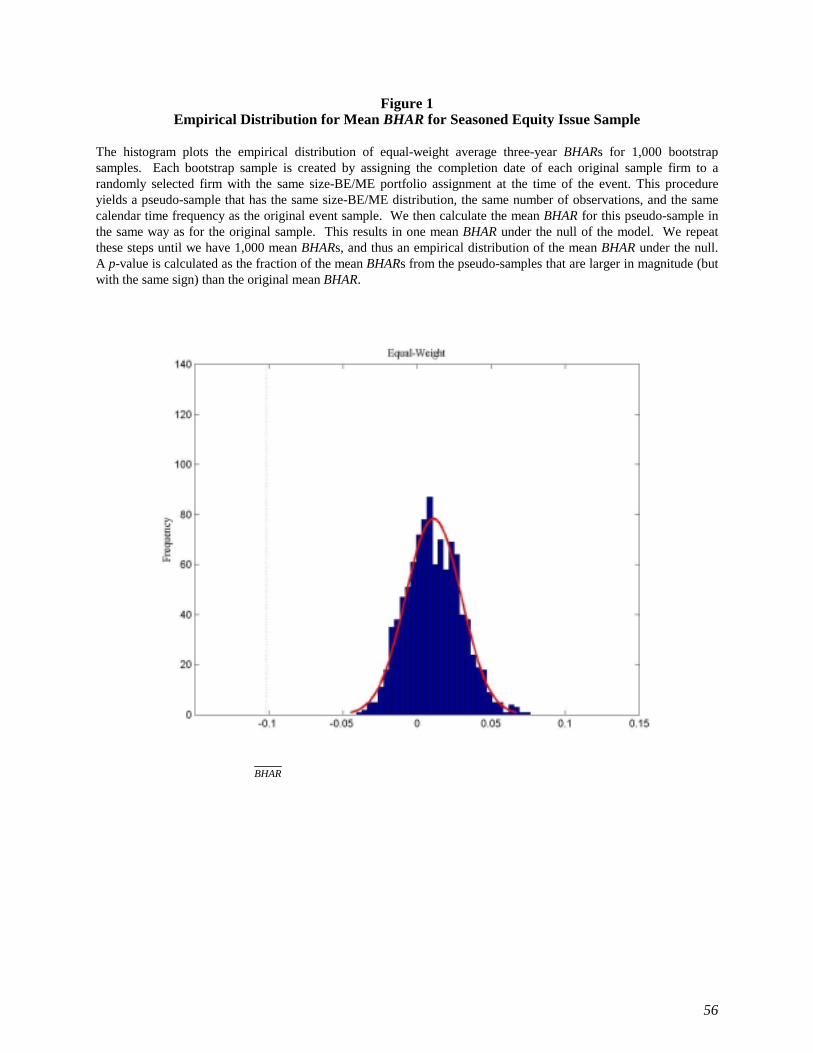
56
Figure 1Empirical Distribution for Mean BHAR for Seasoned Equity Issue Sample
The histogram plots the empirical distribution of equal-weight average three-year BHARs for 1,000 bootstrapsamples. Each bootstrap sample is created by assigning the completion date of each original sample firm to arandomly selected firm with the same size-BE/ME portfolio assignment at the time of the event. This procedureyields a pseudo-sample that has the same size-BE/ME distribution, the same number of observations, and the samecalendar time frequency as the original event sample. We then calculate the mean BHAR for this pseudo-sample inthe same way as for the original sample. This results in one mean BHAR under the null of the model. We repeatthese steps until we have 1,000 mean BHARs, and thus an empirical distribution of the mean BHAR under the null.A p-value is calculated as the fraction of the mean BHARs from the pseudo-samples that are larger in magnitude (butwith the same sign) than the original mean BHAR.
BHAR