Embed Size (px)
Citation preview
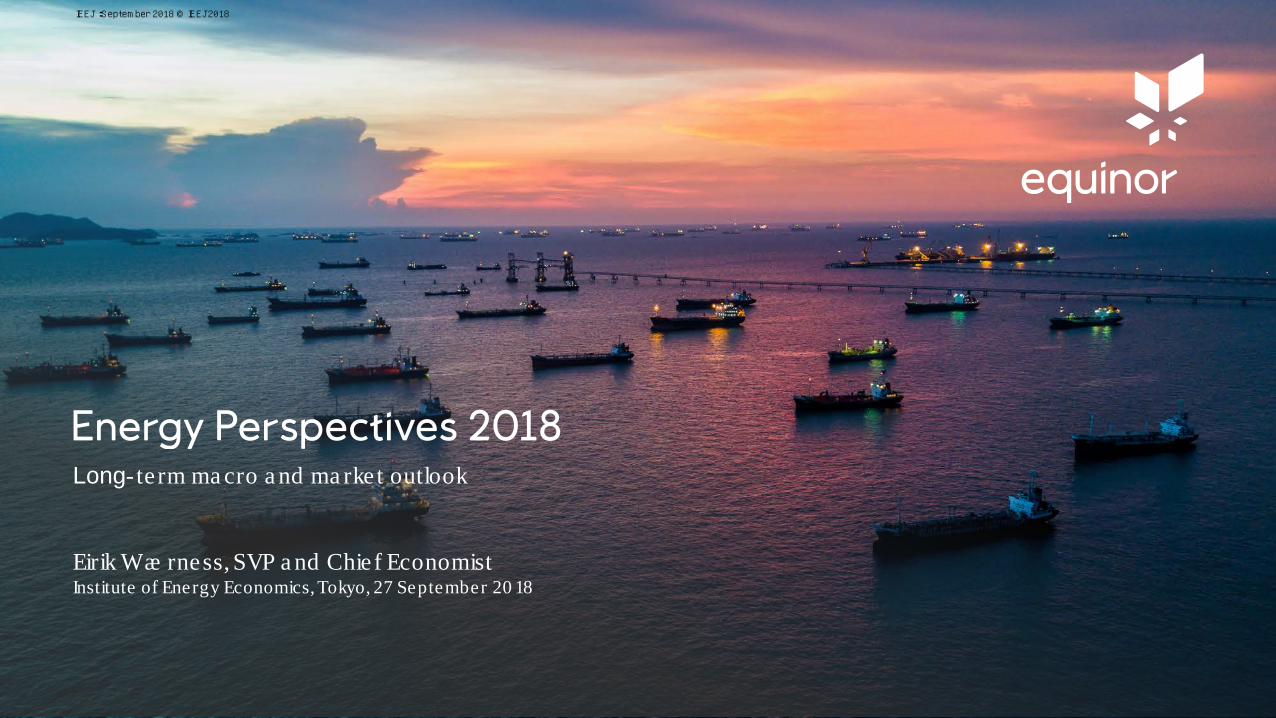
Long- te rm ma cro a nd ma rket outlook
Eirik Wæ rness, SVP a nd Chief EconomistInstitute of Energy Economics, Tokyo, 27 September 20 18
IEEJ:September 2018 © IEEJ2018

Open 27 September 20 18
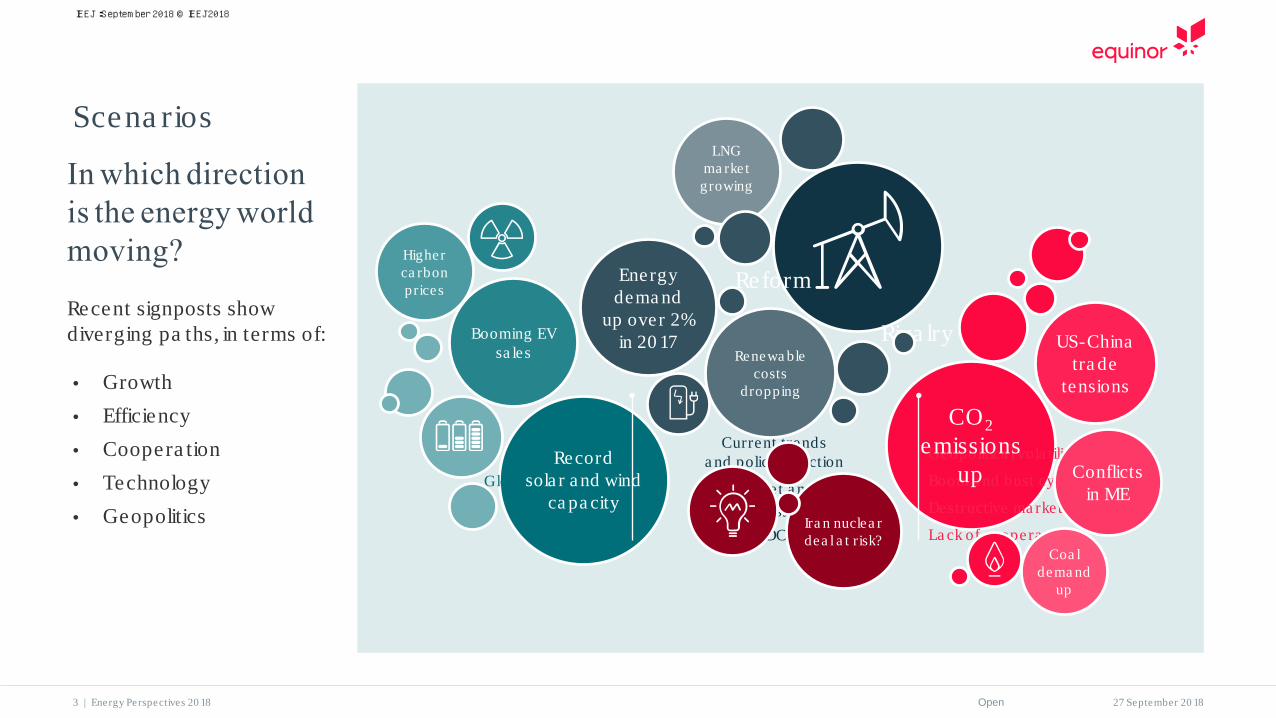
Recent signposts show diverging pa ths, in terms of:
• Growth• Efficiency• Coopera tion• Technology• Geopolitics
In which direction is the energy world moving?
Higher ca rbon prices
Energy dema nd
up over 2% in 20 17
Renewa ble costs
dropping
LNG ma rke t
growing
US-Chinatra de
tensions
Ira n nuclea r dea l a t risk?
Coa l dema nd
up
Booming EV sa les
Conflicts in ME
CO2emissions
upRecord
sola r a nd windca pa city
2 | Energy Perspectives 20 18
IEEJ:September 2018 © IEEJ2018
Open 27 September 20 18
• Growth• Efficiency• Coopera tion• Technology• Geopolitics
Scena rios
In which direction is the energy world moving?
Recent signposts show diverging pa ths, in terms of:
Current trends a nd policy direction
Ma rket a nd Technology driven
NDCs
Geopolitica l vola tility
Boom a nd bust cycles
Destructive ma rket rule
La ck of coopera tion
Policy driven
Globa l coopera tion
Fa st tra nsition
2° ta rget
Riva lry
Reform
Renewa l
Higher ca rbon prices
Energy dema nd
up over 2% in 20 17
Renewa ble costs
dropping
LNG ma rke t
growing
US-Chinatra de
tensions
Ira n nuclea r dea l a t risk?
Coa l dema nd
up
Booming EV sa les
Conflicts in ME
CO2emissions
upRecord
sola r a nd windca pa city
3 | Energy Perspectives 20 18
IEEJ:September 2018 © IEEJ2018
Open 27 September 20 18
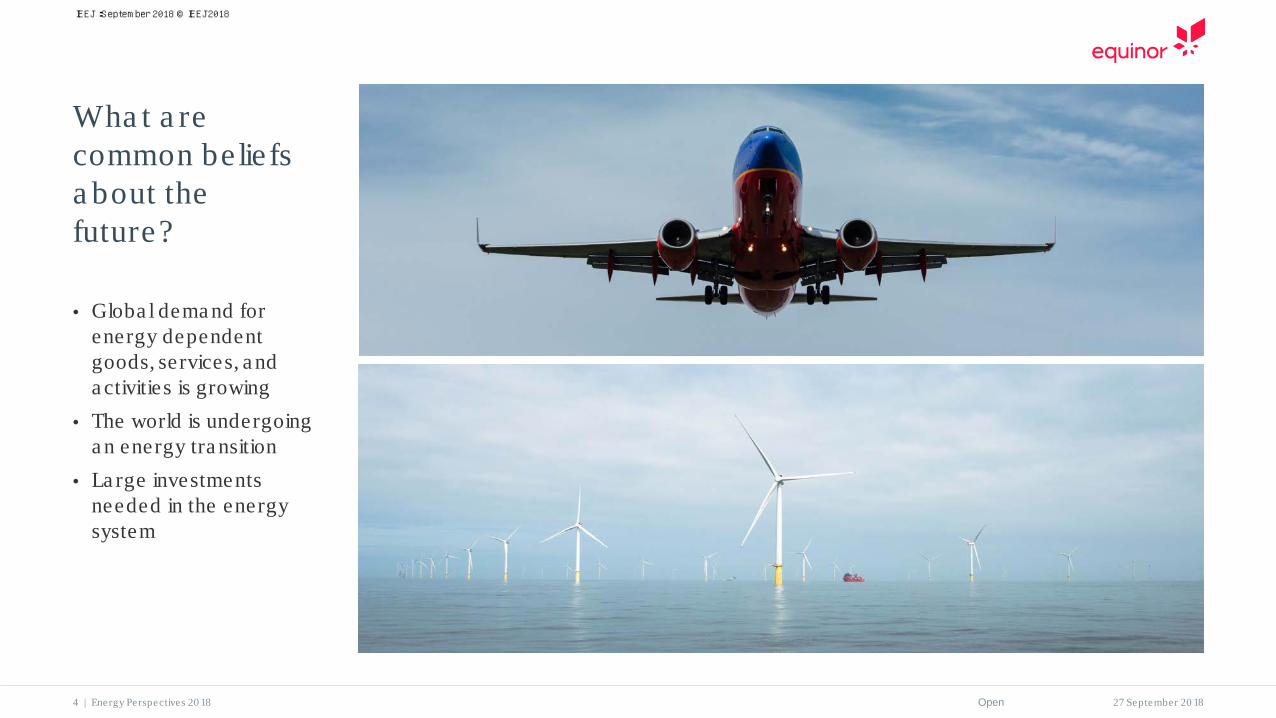
• Globa l dema nd forenergy dependentgoods, services, a nda ctivities is growing
• The world is undergoinga n energy tra nsition
• La rge investmentsneeded in the energysystem
Wha t a re common be lie fs a bout the future?
4 | Energy Perspectives 20 18
IEEJ:September 2018 © IEEJ2018
Open 27 September 20 18
0
20
40
60
80
100
1990
2000
2010
2020
2030
2040
2050
Re form Re ne wa l Riva lry
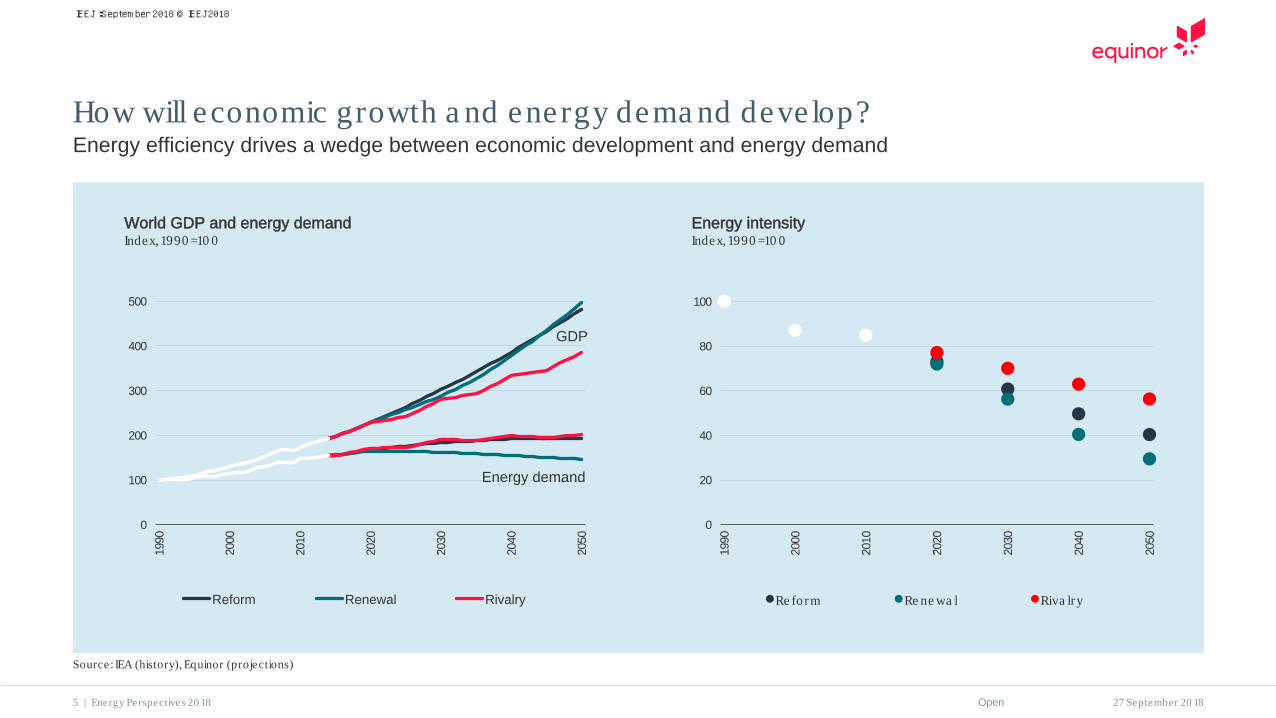
How will economic growth a nd energy dema nd deve lop?Energy efficiency drives a wedge between economic development and energy demand
0
100
200
300
400
500
1990
2000
2010
2020
2030
2040
2050
Reform Renewal Rivalry
Energy demand
GDP
World GDP and energy demandIndex, 1990 =10 0
Energy intensityIndex, 1990 =10 0
Source: IEA (history), Equinor (projections)
5 | Energy Perspectives 20 18
IEEJ:September 2018 © IEEJ2018
Open 27 September 20 18
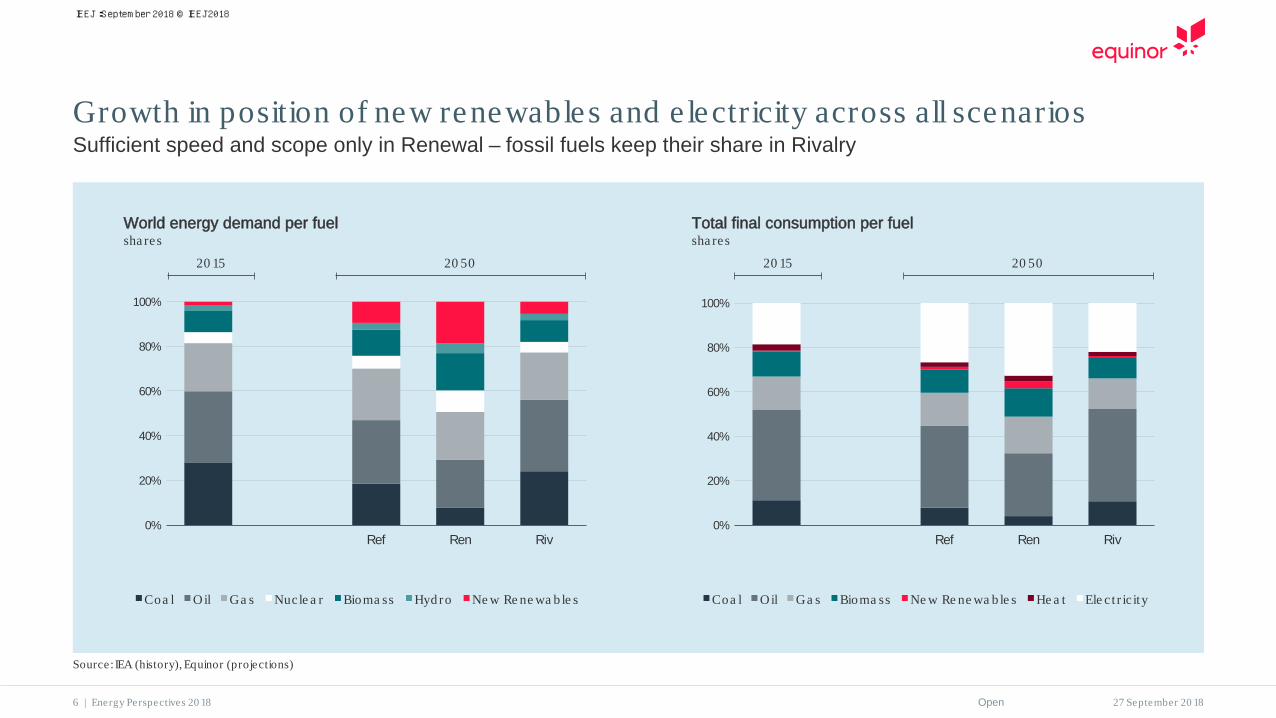
Growth in position of new renewa bles a nd e lectricity a cross a ll scena riosSufficient speed and scope only in Renewal – fossil fuels keep their share in Rivalry
0%
20%
40%
60%
80%
100%
Ref Ren Riv
Coa l Oil Ga s Nucle a r Bioma ss Hyd ro Ne w Re ne wa b le s
20 15 20 50
World energy demand per fuelsha res
20 15 20 50
Total final consumption per fuelsha res
0%
20%
40%
60%
80%
100%
Ref Ren Riv
Coa l Oil Ga s Bioma ss Ne w Re ne wa b le s He a t Ele c t r ic ity
Source: IEA (history), Equinor (projections)
6 | Energy Perspectives 20 18
IEEJ:September 2018 © IEEJ2018
Open 27 September 20 18
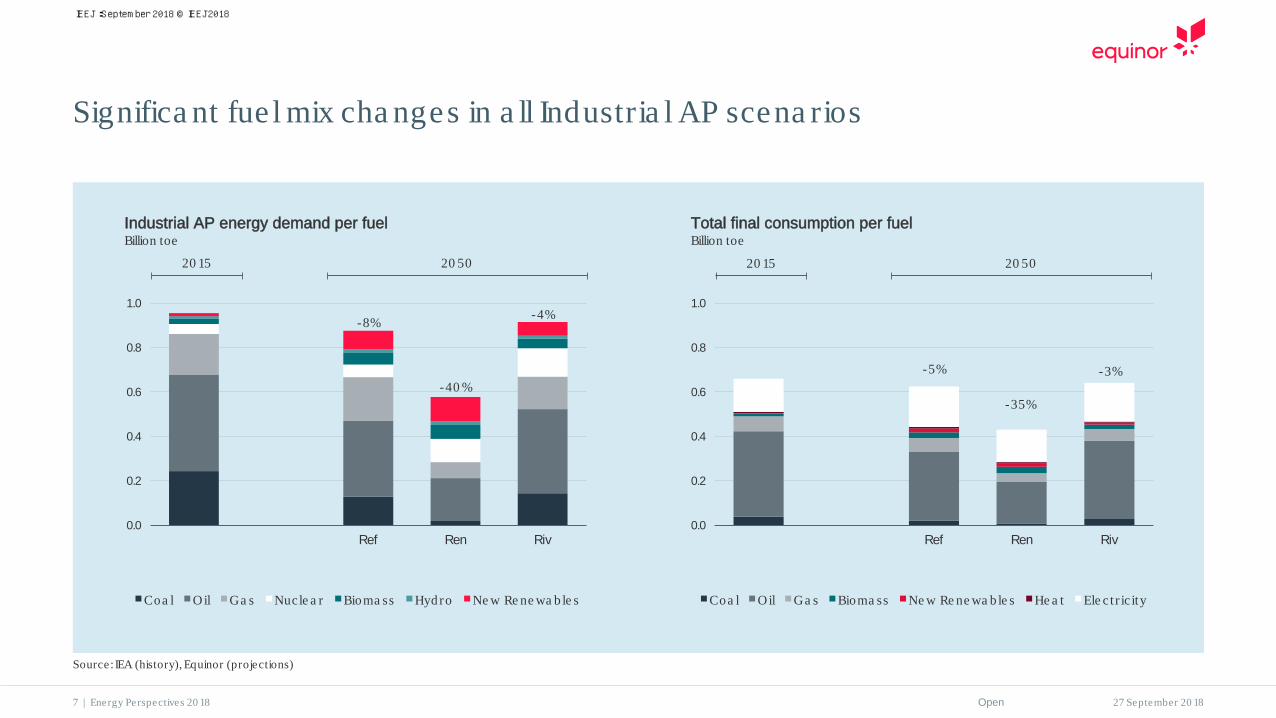
Significa nt fue l mix cha nges in a ll Industria l AP scena rios
Source: IEA (history), Equinor (projections)
7 | Energy Perspectives 20 18
-8%
-40 %
-4%
0.0
0.2
0.4
0.6
0.8
1.0
Ref Ren Riv
Coa l Oil Ga s Nucle a r Bioma ss Hyd ro Ne w Re ne wa b le s
20 15 20 50
Industrial AP energy demand per fuelBillion toe
-5%
-35%
-3%
0.0
0.2
0.4
0.6
0.8
1.0
Ref Ren Riv
Coa l Oil Ga s Bioma ss Ne w Re ne wa b le s He a t Ele c t r ic ity
20 15 20 50
Total final consumption per fuelBillion toe
IEEJ:September 2018 © IEEJ2018
Open 27 September 20 188 | Energy Perspectives 20 18
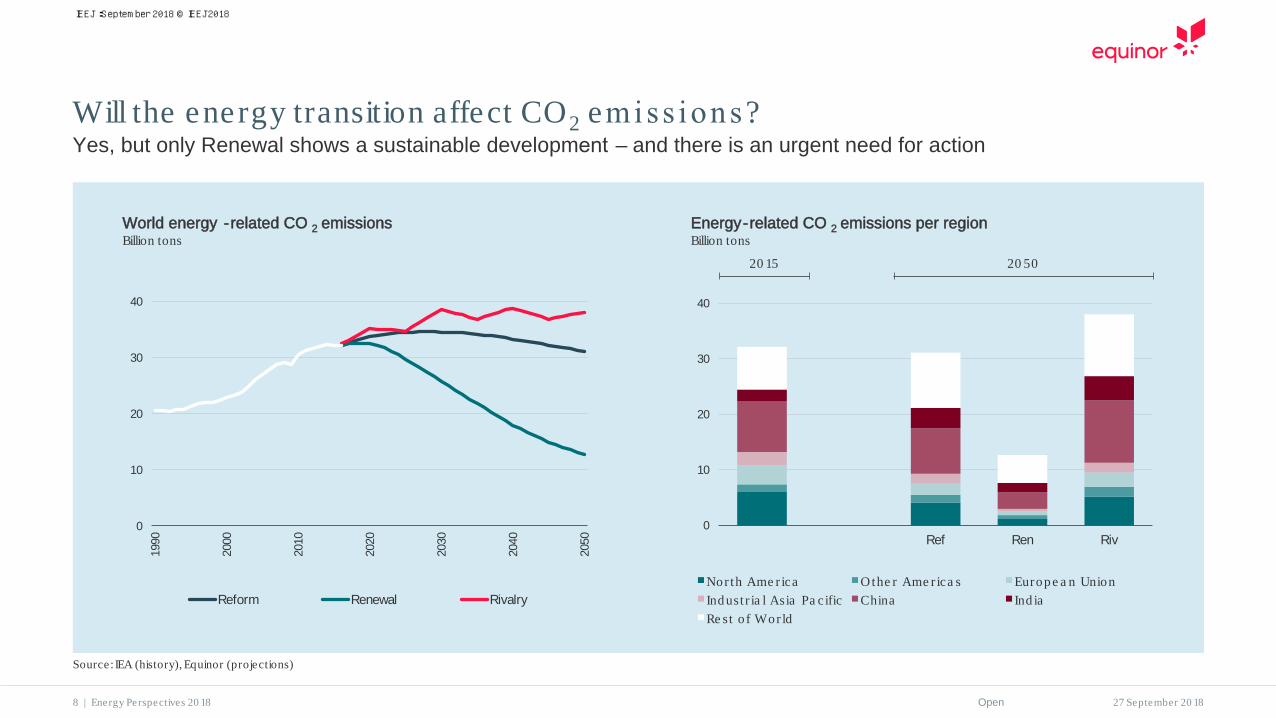
Will the energy tra nsition a ffect CO2 emiss ions?Yes, but only Renewal shows a sustainable development – and there is an urgent need for action
0
10
20
30
40
1990
2000
2010
2020
2030
2040
2050
Reform Renewal Rivalry
World energy -related CO 2 emissionsBillion tons
Source: IEA (history), Equinor (projections)
0
10
20
30
40
Ref Ren Riv
Nor th Ame r ica Othe r Ame r ica s Europ e a n UnionInd ust r ia l Asia Pa c ific China Ind iaRe st o f Wor ld
20 15 20 50
Energy-related CO 2 emissions per regionBillion tons
IEEJ:September 2018 © IEEJ2018
Open 27 September 20 18
0
10
20
30
40
50
Ref Ren Riv
Industrial Residential Commercial
Transport Other
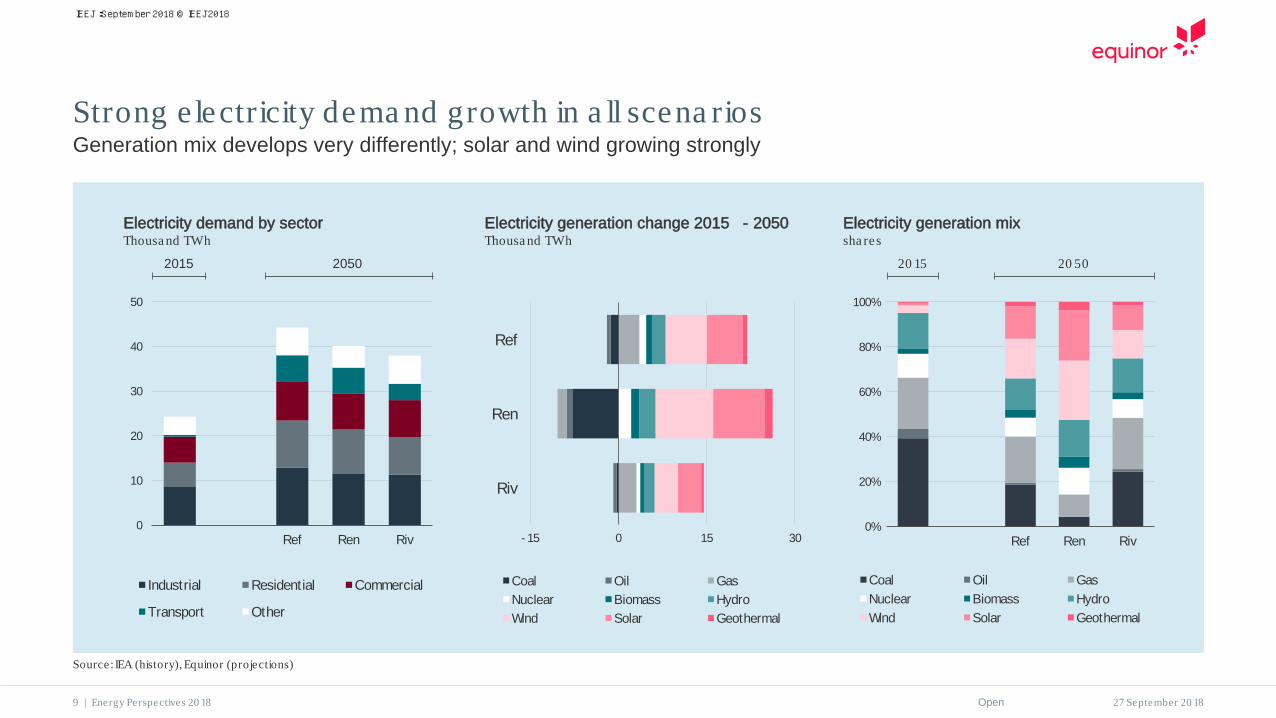
Strong e lectricity dema nd growth in a ll scena riosGeneration mix develops very differently; solar and wind growing strongly
2015 2050
Electricity demand by sectorThousa nd TWh
Electricity generation change 2015 - 2050 Thousa nd TWh
- 15 0 15 30
Riv
Ren
Ref
Coal Oil GasNuclear Biomass HydroWind Solar Geothermal
0%
20%
40%
60%
80%
100%
Ref Ren Riv
Coal Oil GasNuclear Biomass HydroWind Solar Geothermal
Electricity generation mixsha res
20 15 20 50
Source: IEA (history), Equinor (projections)
9 | Energy Perspectives 20 18
IEEJ:September 2018 © IEEJ2018
Open 27 September 20 18
0.0
0.5
1.0
1.5
2.0
2.5
Ref Ren Riv
Industrial Residential Commercial
Transport Other
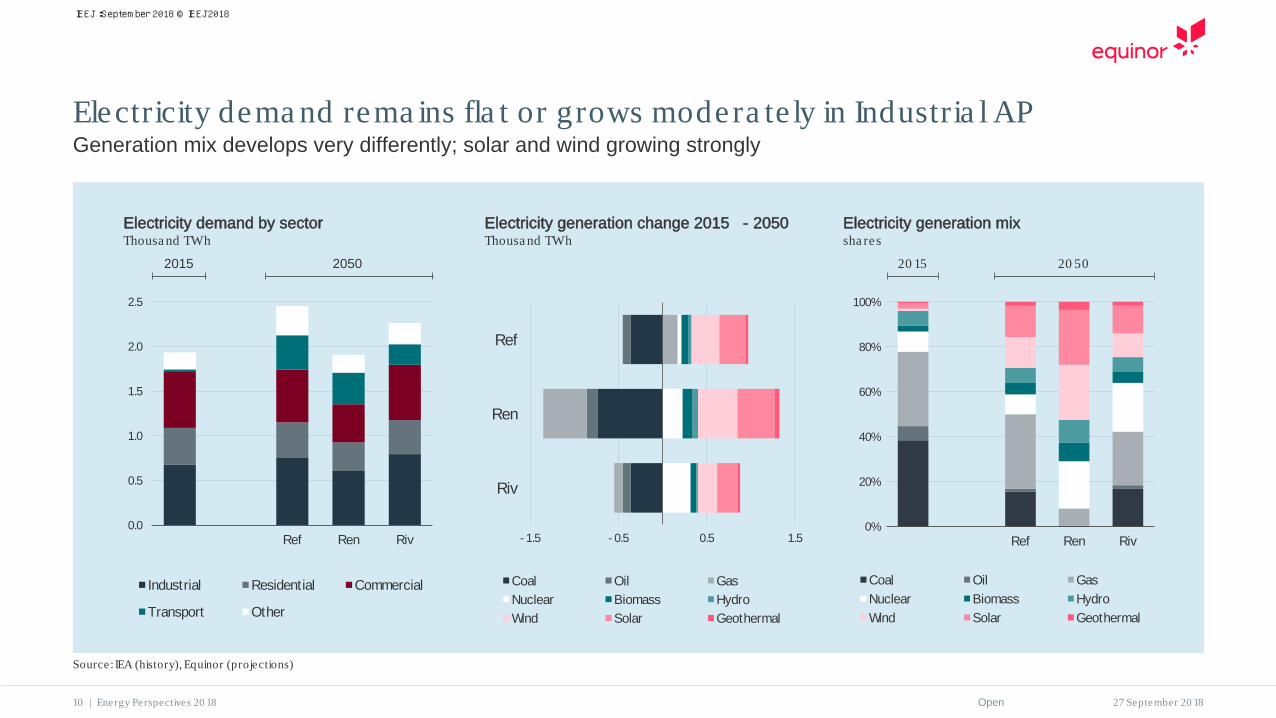
Electricity dema nd rema ins fla t or grows modera te ly in Industria l APGeneration mix develops very differently; solar and wind growing strongly
2015 2050
Electricity demand by sectorThousa nd TWh
Electricity generation change 2015 - 2050 Thousa nd TWh
0%
20%
40%
60%
80%
100%
Ref Ren Riv
Coal Oil GasNuclear Biomass HydroWind Solar Geothermal
Electricity generation mixsha res
20 15 20 50
Source: IEA (history), Equinor (projections)
10 | Energy Perspectives 20 18
- 1.5 - 0.5 0.5 1.5
Riv
Ren
Ref
Coal Oil GasNuclear Biomass HydroWind Solar Geothermal
IEEJ:September 2018 © IEEJ2018
Open 27 September 20 18
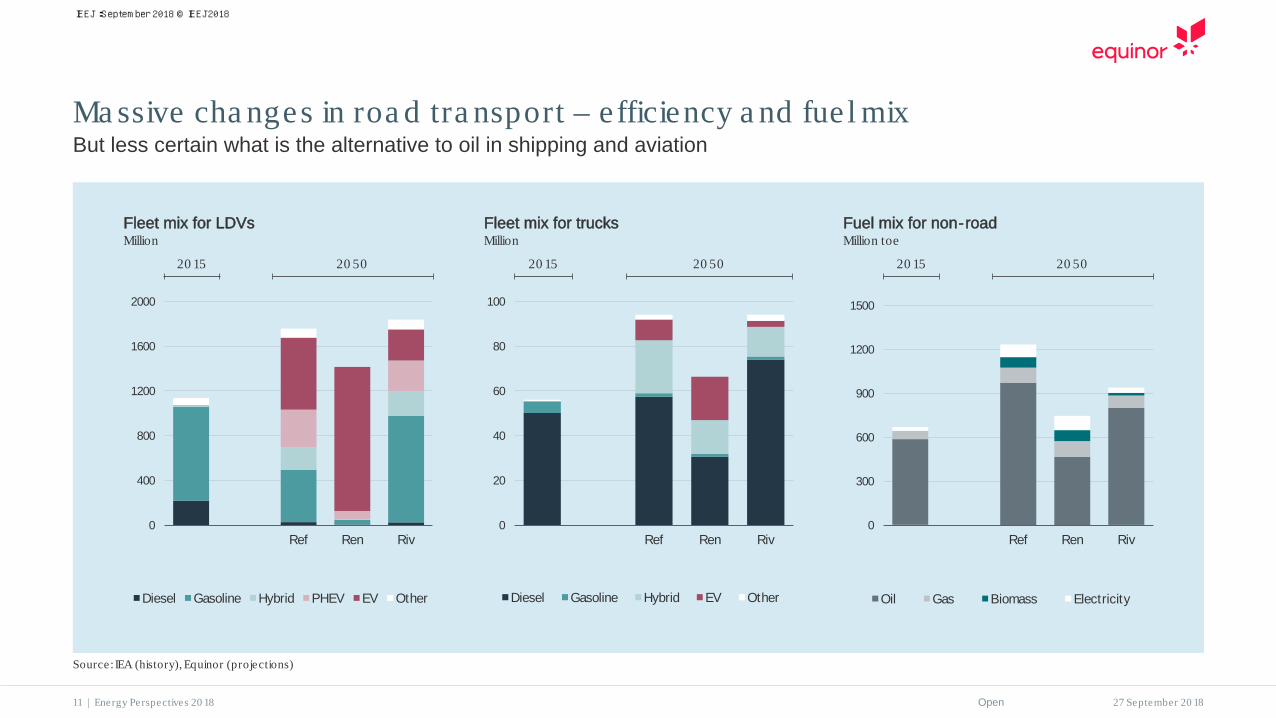
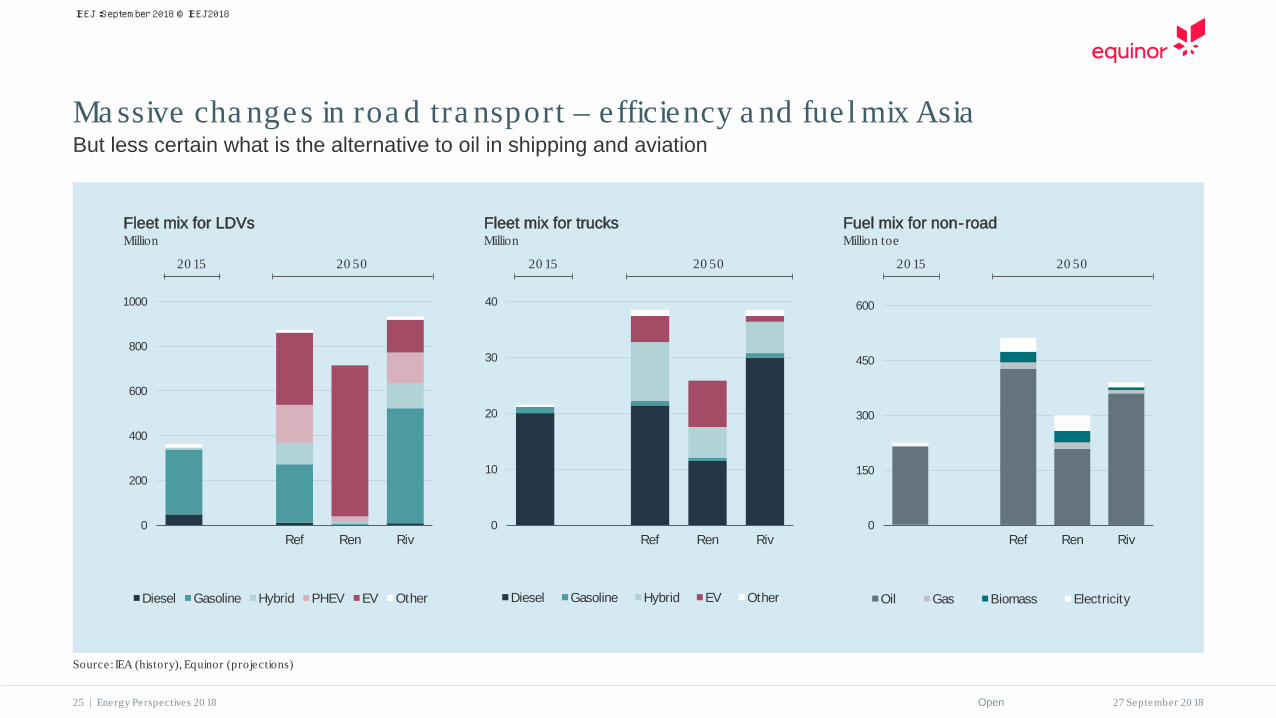
Ma ssive cha nges in roa d tra nsport – efficiency a nd fue l mixBut less certain what is the alternative to oil in shipping and aviation
Fleet mix for LDVsMillion
Fuel mix for non-roadMillion toe
Fleet mix for trucksMillion
0
400
800
1200
1600
2000
Ref Ren Riv
Diesel Gasoline Hybrid PHEV EV Other
0
20
40
60
80
100
Ref Ren Riv
Diesel Gasoline Hybrid EV Other
0
300
600
900
1200
1500
Ref Ren Riv
Oil Gas Biomass Electricity
20 15 20 50 20 15 20 50 20 15 20 50
Source: IEA (history), Equinor (projections)
11 | Energy Perspectives 20 18
IEEJ:September 2018 © IEEJ2018
Open 27 September 20 18
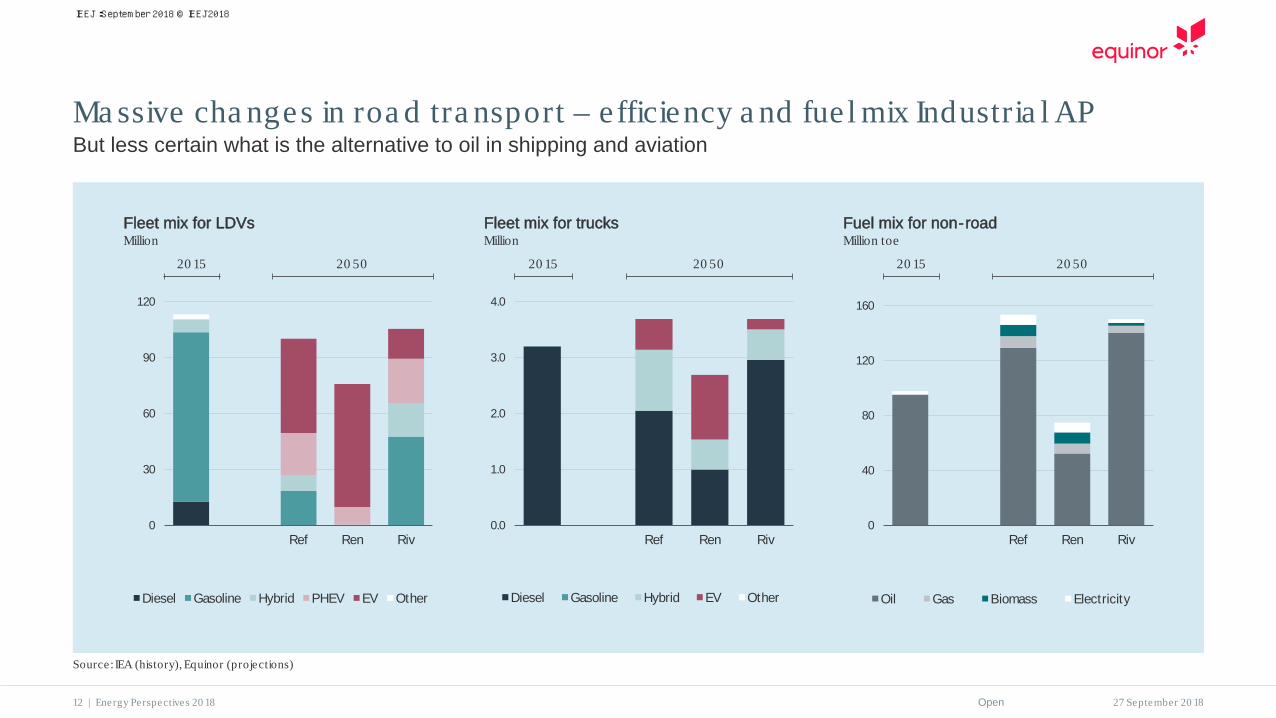
Ma ssive cha nges in roa d tra nsport – efficiency a nd fue l mix Industria l APBut less certain what is the alternative to oil in shipping and aviation
Fleet mix for LDVsMillion
Fuel mix for non-roadMillion toe
Fleet mix for trucksMillion
0
30
60
90
120
Ref Ren Riv
Diesel Gasoline Hybrid PHEV EV Other
0.0
1.0
2.0
3.0
4.0
Ref Ren Riv
Diesel Gasoline Hybrid EV Other
0
40
80
120
160
Ref Ren Riv
Oil Gas Biomass Electricity
20 15 20 50 20 15 20 50 20 15 20 50
Source: IEA (history), Equinor (projections)
12 | Energy Perspectives 20 18
IEEJ:September 2018 © IEEJ2018
Open 27 September 20 18
0
300
600
900
1200
1500
Ref Ren Riv
Coal Oil Gas
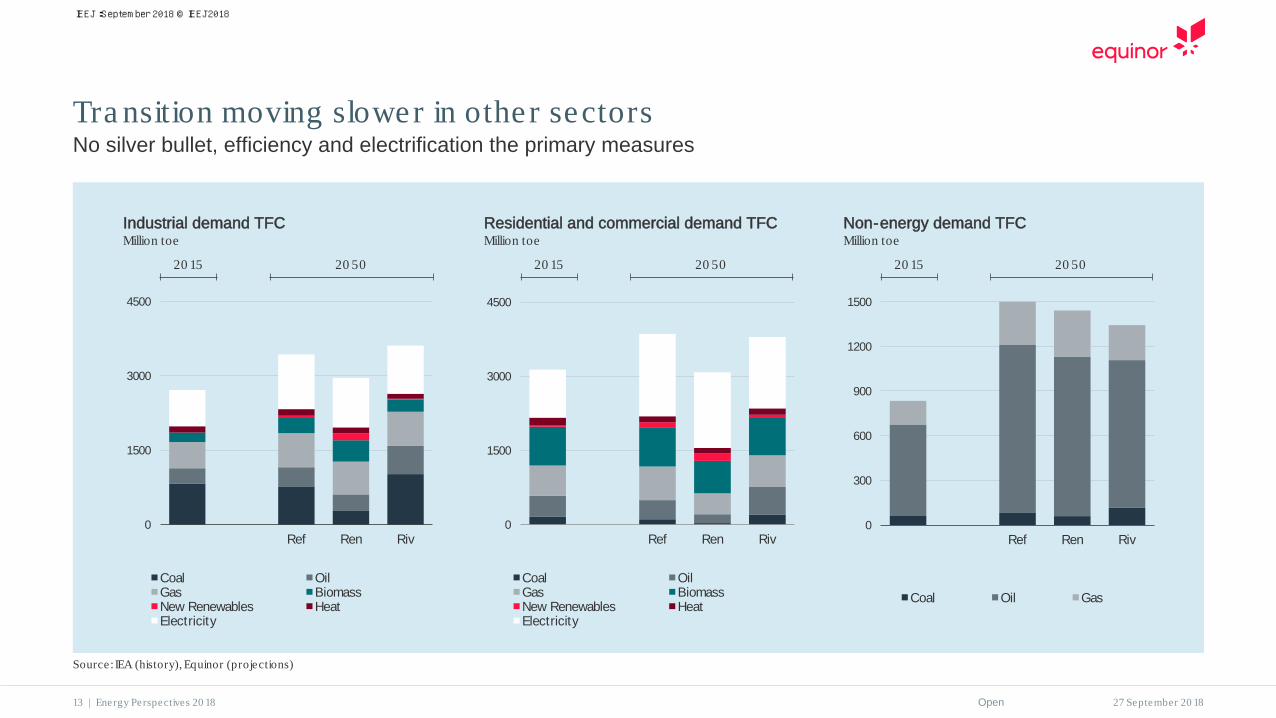
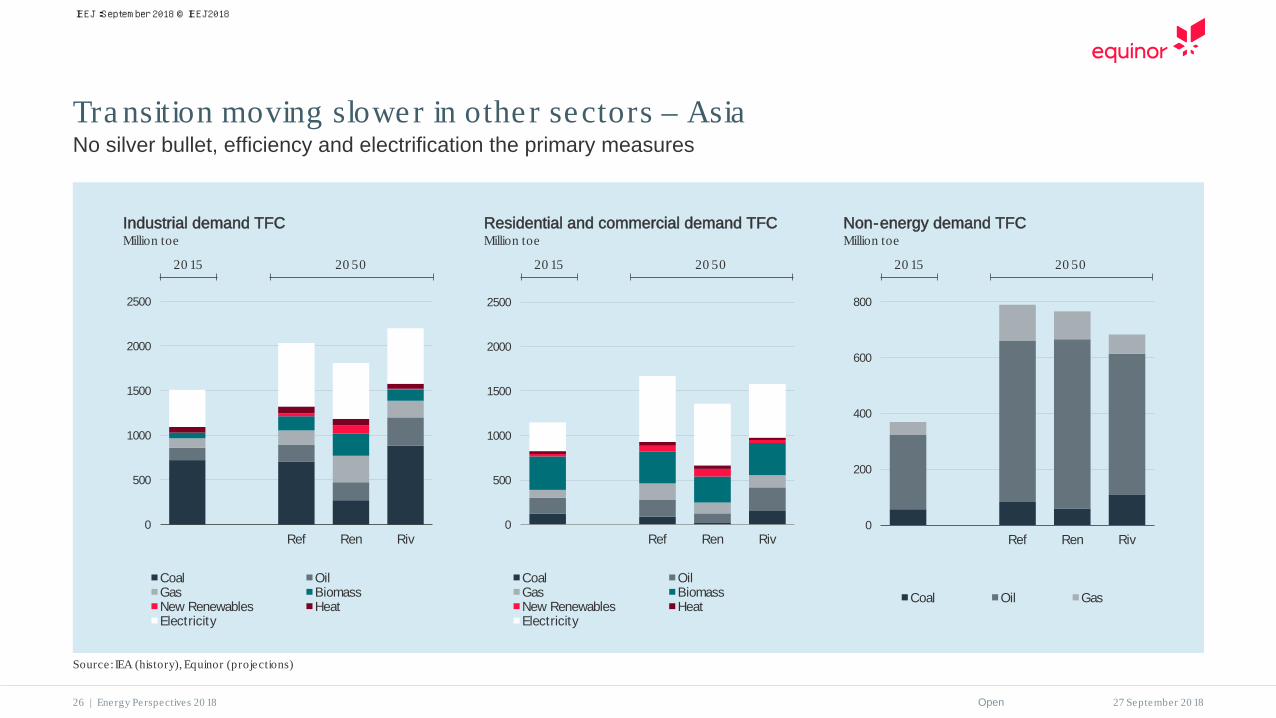
Tra nsition moving slower in other sectorsNo silver bullet, efficiency and electrification the primary measures
0
1500
3000
4500
Ref Ren Riv
Coal OilGas BiomassNew Renewables HeatElectricity
0
1500
3000
4500
Ref Ren Riv
Coal OilGas BiomassNew Renewables HeatElectricity
Industrial demand TFCMillion toe
Non-energy demand TFCMillion toe
Residential and commercial demand TFCMillion toe
20 15 20 50 20 15 20 5020 15 20 50
Source: IEA (history), Equinor (projections)
13 | Energy Perspectives 20 18
IEEJ:September 2018 © IEEJ2018
Open 27 September 20 18
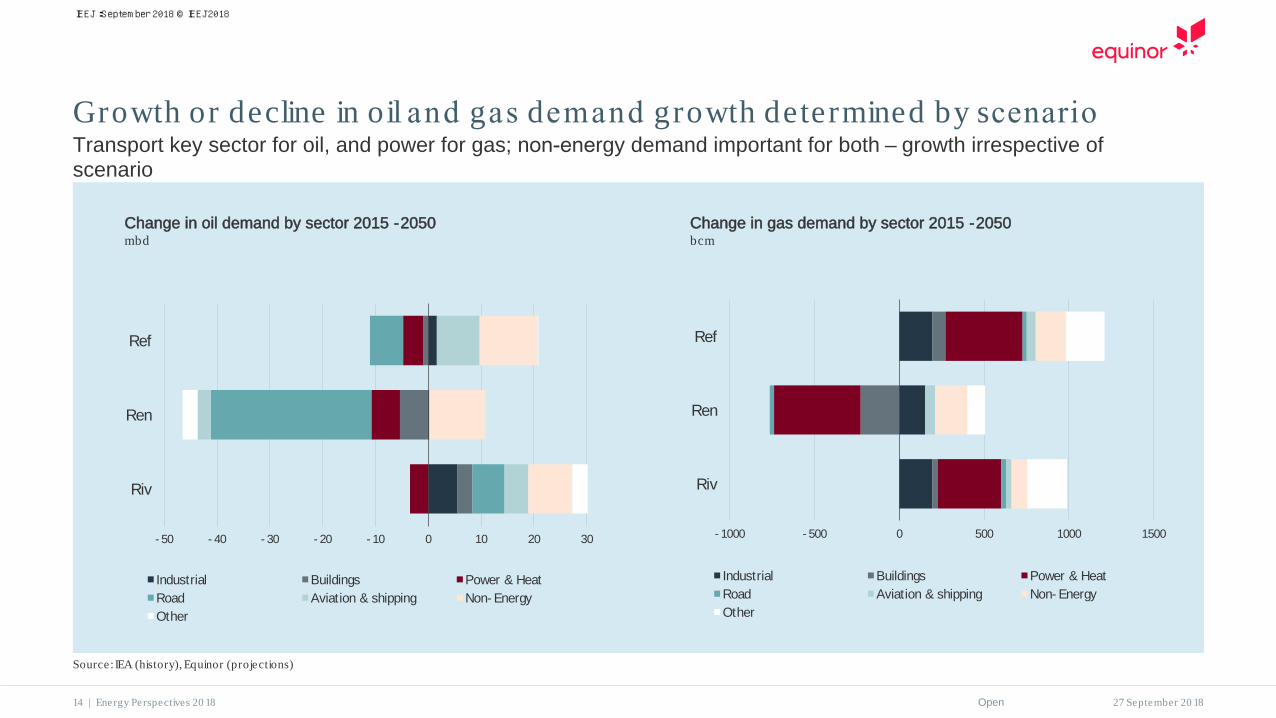
Growth or decline in oil and gas demand growth determined by scenarioTransport key sector for oil, and power for gas; non-energy demand important for both – growth irrespective of scenario
Change in oil demand by sector 2015 -2050mbd
Change in gas demand by sector 2015 -2050bcm
- 50 - 40 - 30 - 20 - 10 0 10 20 30
Riv
Ren
Ref
Industrial Buildings Power & HeatRoad Aviation & shipping Non- EnergyOther
- 1000 - 500 0 500 1000 1500
Riv
Ren
Ref
Industrial Buildings Power & HeatRoad Aviation & shipping Non- EnergyOther
Source: IEA (history), Equinor (projections)
14 | Energy Perspectives 20 18
IEEJ:September 2018 © IEEJ2018
Open 27 September 20 18
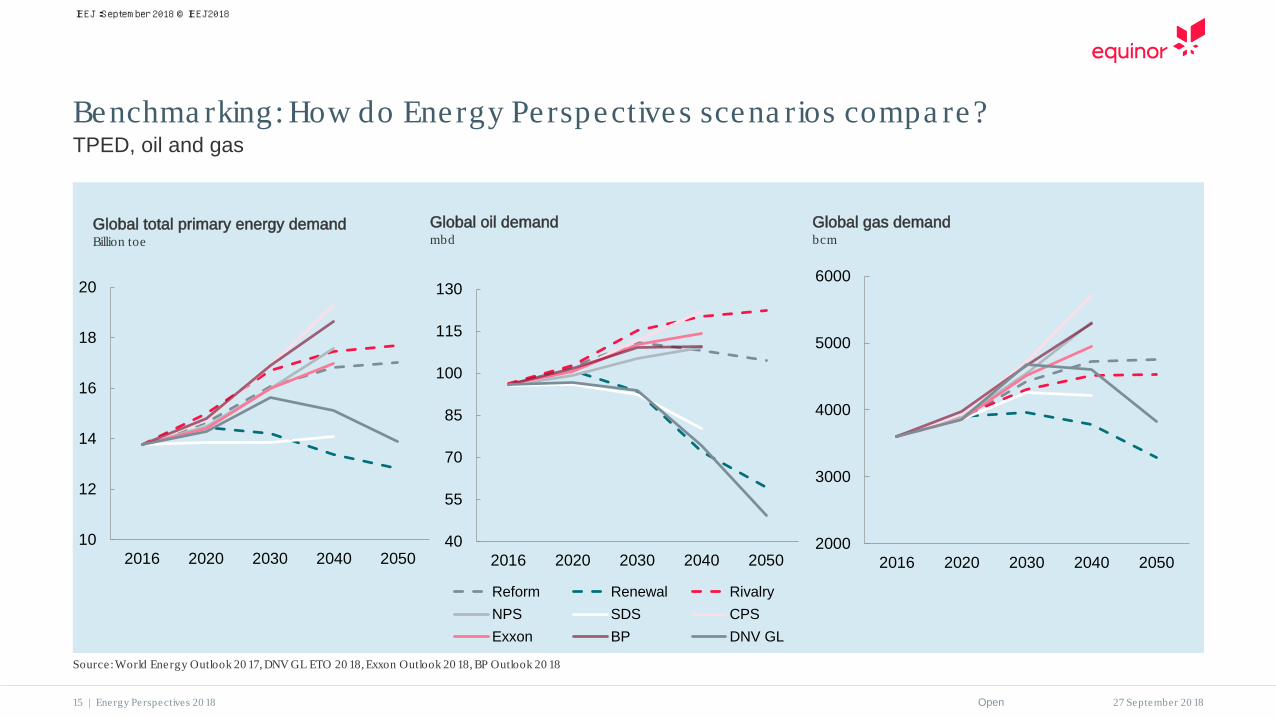
Benchma rking: How do Energy Perspectives scena rios compa re?TPED, oil and gas
Global total primary energy demandBillion toe
15 | Energy Perspectives 20 18
Global oil demandmbd
Global gas demandbcm
Source: World Energy Outlook 20 17, DNV GL ETO 20 18, Exxon Outlook 20 18, BP Outlook 20 18
10
12
14
16
18
20
2016 2020 2030 2040 205040
55
70
85
100
115
130
2016 2020 2030 2040 2050
Reform Renewal RivalryNPS SDS CPSExxon BP DNV GL
2000
3000
4000
5000
6000
2016 2020 2030 2040 2050
IEEJ:September 2018 © IEEJ2018
Open 27 September 20 18
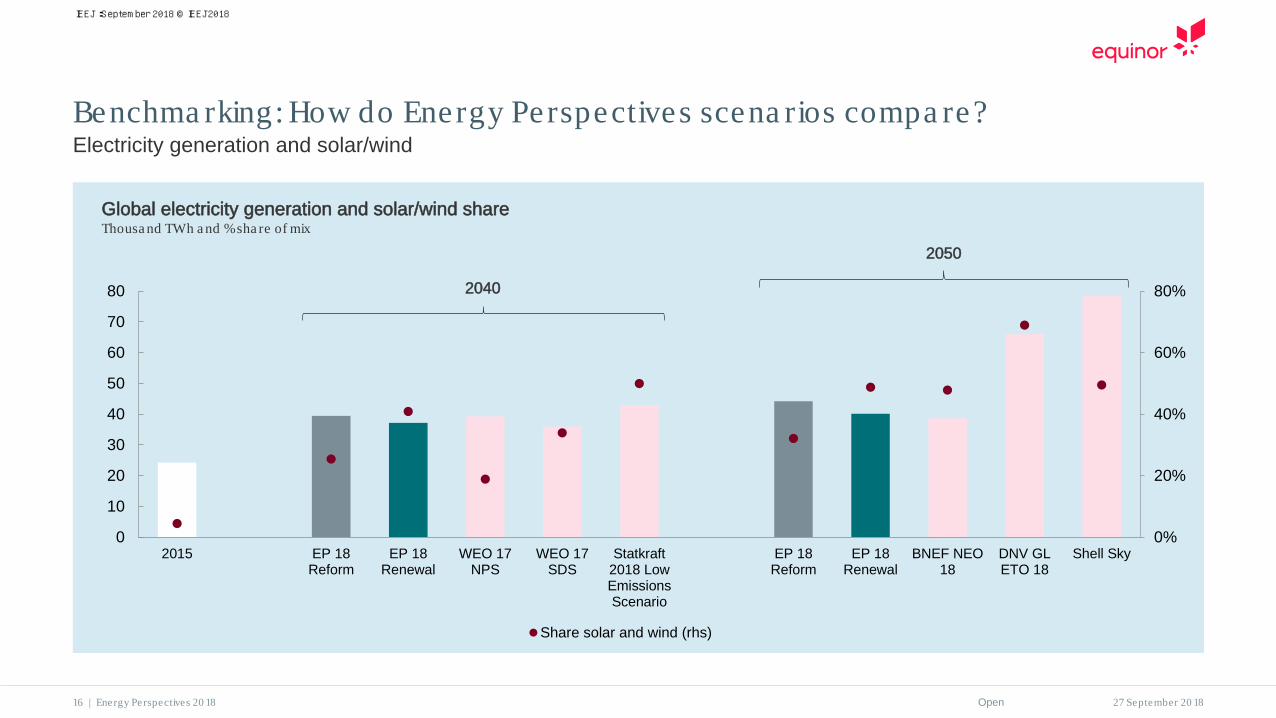
Benchma rking: How do Energy Perspectives scena rios compa re?Electricity generation and solar/wind
Global electricity generation and solar/wind shareThousa nd TWh a nd % sha re of mix
16 | Energy Perspectives 20 18
2040
2050
0%
20%
40%
60%
80%
0
10
20
30
40
50
60
70
80
2015 EP 18Reform
EP 18Renewal
WEO 17NPS
WEO 17SDS
Statkraft2018 LowEmissionsScenario
EP 18Reform
EP 18Renewal
BNEF NEO18
DNV GLETO 18
Shell Sky
Share solar and wind (rhs)
IEEJ:September 2018 © IEEJ2018
Open 27 September 20 18
0
200
400
600
800
1000
USA Opec
Rivalry add- onReform add- onRenewal add- onPotential legacy supply
Dema nd ra nge
Decline ra nge
Lega cy supply0
25
50
75
100
125
2015
2020
2030
2040
2050
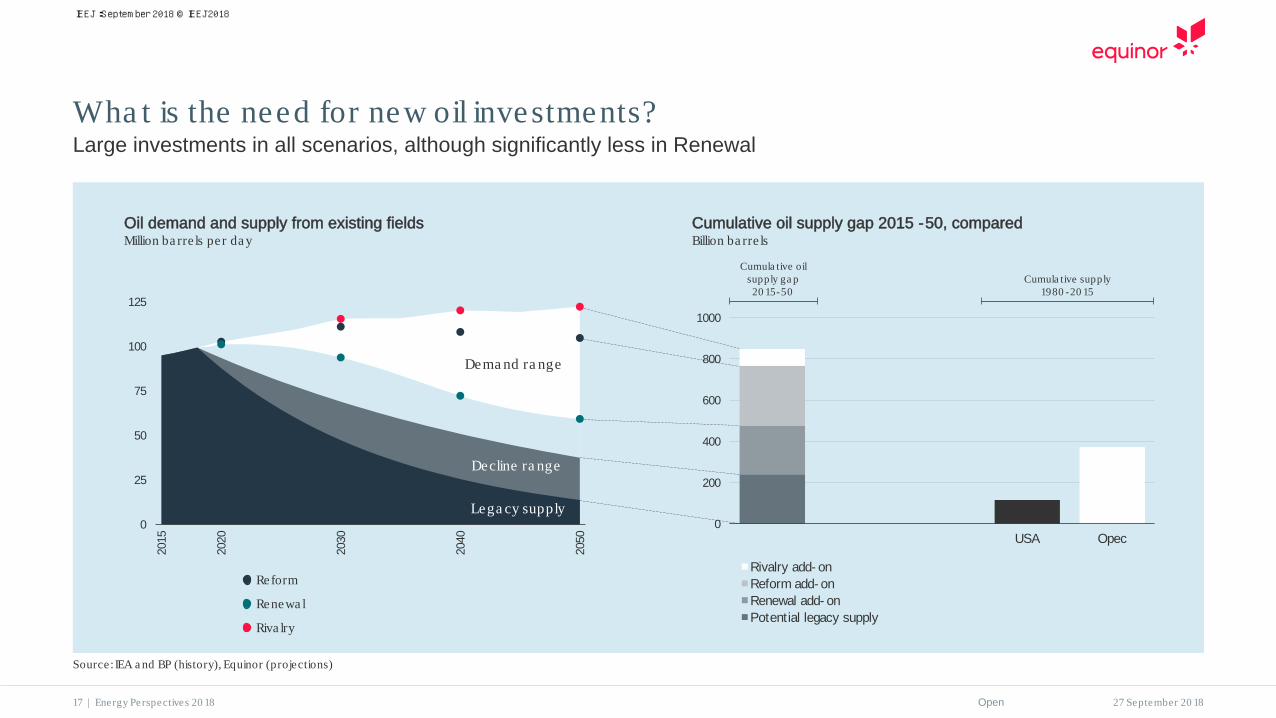
Wha t is the need for new oil investments?Large investments in all scenarios, although significantly less in Renewal
Oil demand and supply from existing fieldsMillion ba rre ls per da y
Cumulative oil supply gap 2015 -50, compared Billion ba rre ls
Cumula tive oilsupply ga p20 15-50
Cumula tive supply1980 -20 15
Source: IEA a nd BP (history), Equinor (projections)
17 | Energy Perspectives 20 18
Reform
Renewa l
Riva lry
IEEJ:September 2018 © IEEJ2018
Open 27 September 20 18
Dema nd ra nge
Decline ra nge
Lega cy supply0
1000
2000
3000
4000
5000
2015
2020
2030
2040
2050
0
20
40
60
80
100
USA Russia Middle East
Reform add- onRivalry add- onRenewal add- onPotential legacy supply
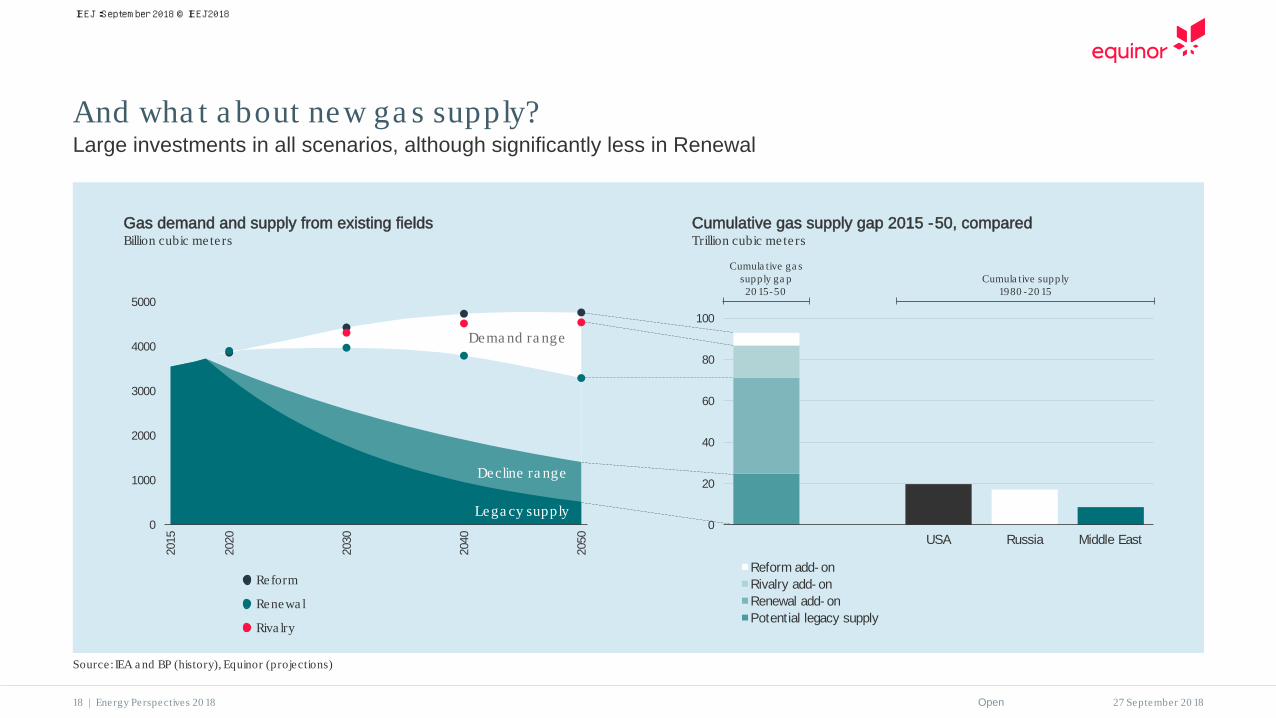
And wha t a bout new ga s supply?Large investments in all scenarios, although significantly less in Renewal
Gas demand and supply from existing fields Billion cubic meters
Cumulative gas supply gap 2015 -50, compared Trillion cubic meters
Cumula tive ga s supply ga p 20 15-50
Cumula tive supply1980 -20 15
Source: IEA a nd BP (history), Equinor (projections)
18 | Energy Perspectives 20 18
Reform
Renewa l
Riva lry
IEEJ:September 2018 © IEEJ2018
Open 27 September 20 18
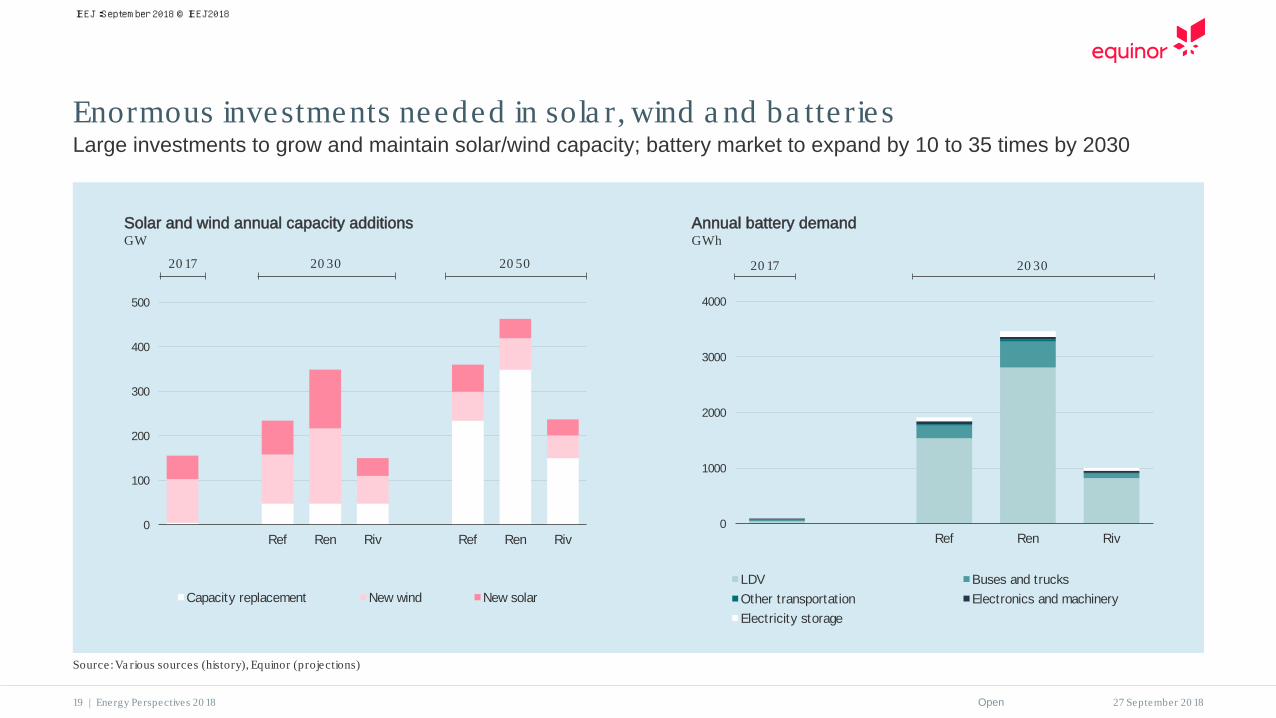
Enormous investments needed in sola r, wind a nd ba tte riesLarge investments to grow and maintain solar/wind capacity; battery market to expand by 10 to 35 times by 2030
Solar and wind annual capacity additionsGW
Annual battery demandGWh
0
100
200
300
400
500
Ref Ren Riv Ref Ren Riv
Capacity replacement New wind New solar
20 17 20 30 20 50
0
1000
2000
3000
4000
Ref Ren Riv
LDV Buses and trucksOther transportation Electronics and machineryElectricity storage
20 17 20 30
Source: Va rious sources (history), Equinor (projections)
19 | Energy Perspectives 20 18
IEEJ:September 2018 © IEEJ2018
© Equinor ASAThis presentation, including the contents and arrangement of the contents of each individual page or the collection of the pages, is owned by Equinor. Copyright to a ll ma teria l including, but not limited to, written ma teria l, photogra phs, dra wings, ima ges, ta bles a nd da ta rema ins the property of Equinor. All rights reserved. Any other use , reproduction, tra nsla tion, a da ption, a rra ngement, a lte ra tion, distribution or stora ge of this presenta tion, in whole or in pa rt, without the prior written permission of Equinor is prohibited. The informa tion conta ined in this presenta tion ma y not be a ccura te , up to da te or a pplica ble to the circumsta nces of a ny pa rticula r ca se , despite our e fforts. Equinor ca nnot a ccept a ny lia bility for a ny ina ccura cies or omissions.
Eirik Wæ rnessSenior vice president a nd Chief economist
IEEJ:September 2018 © IEEJ2018
Open 27 September 20 18
0
30
60
90
120
Ref Ren Riv
Coal Oil Gas
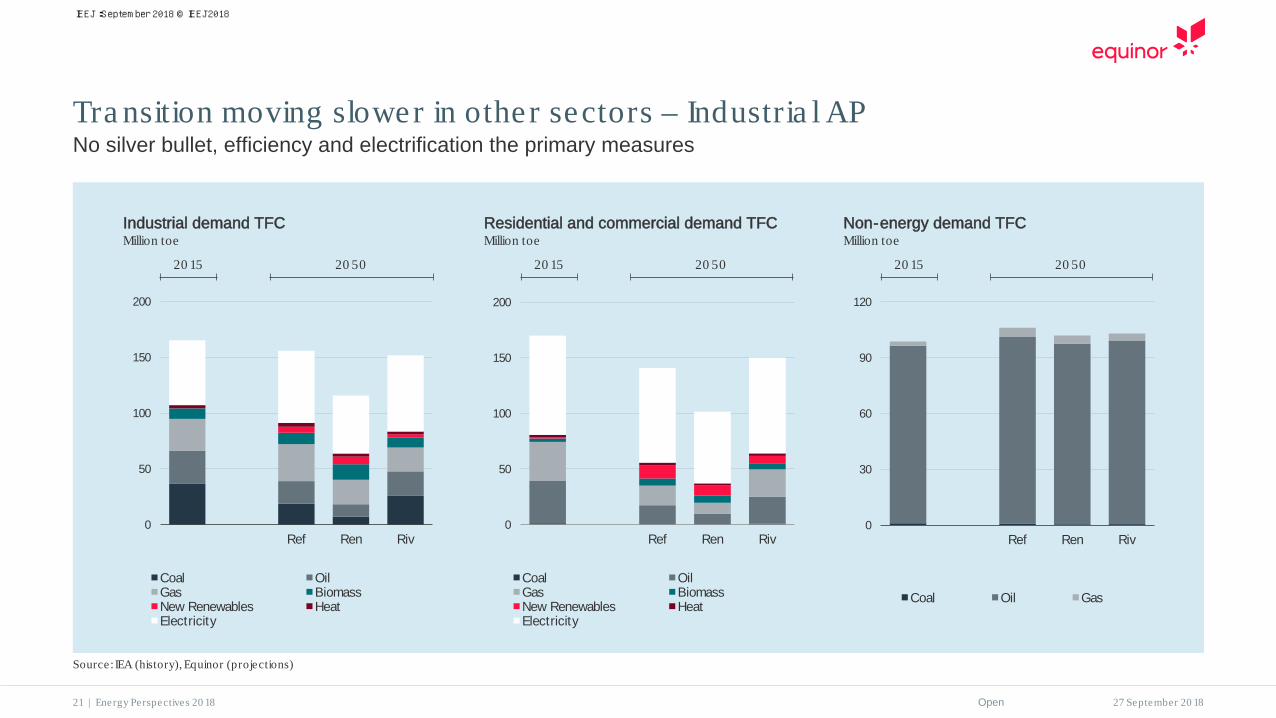
Tra nsition moving slower in other sectors – Industria l APNo silver bullet, efficiency and electrification the primary measures
0
50
100
150
200
Ref Ren Riv
Coal OilGas BiomassNew Renewables HeatElectricity
0
50
100
150
200
Ref Ren Riv
Coal OilGas BiomassNew Renewables HeatElectricity
Industrial demand TFCMillion toe
Non-energy demand TFCMillion toe
Residential and commercial demand TFCMillion toe
20 15 20 50 20 15 20 5020 15 20 50
Source: IEA (history), Equinor (projections)
21 | Energy Perspectives 20 18
IEEJ:September 2018 © IEEJ2018
Open 27 September 20 18
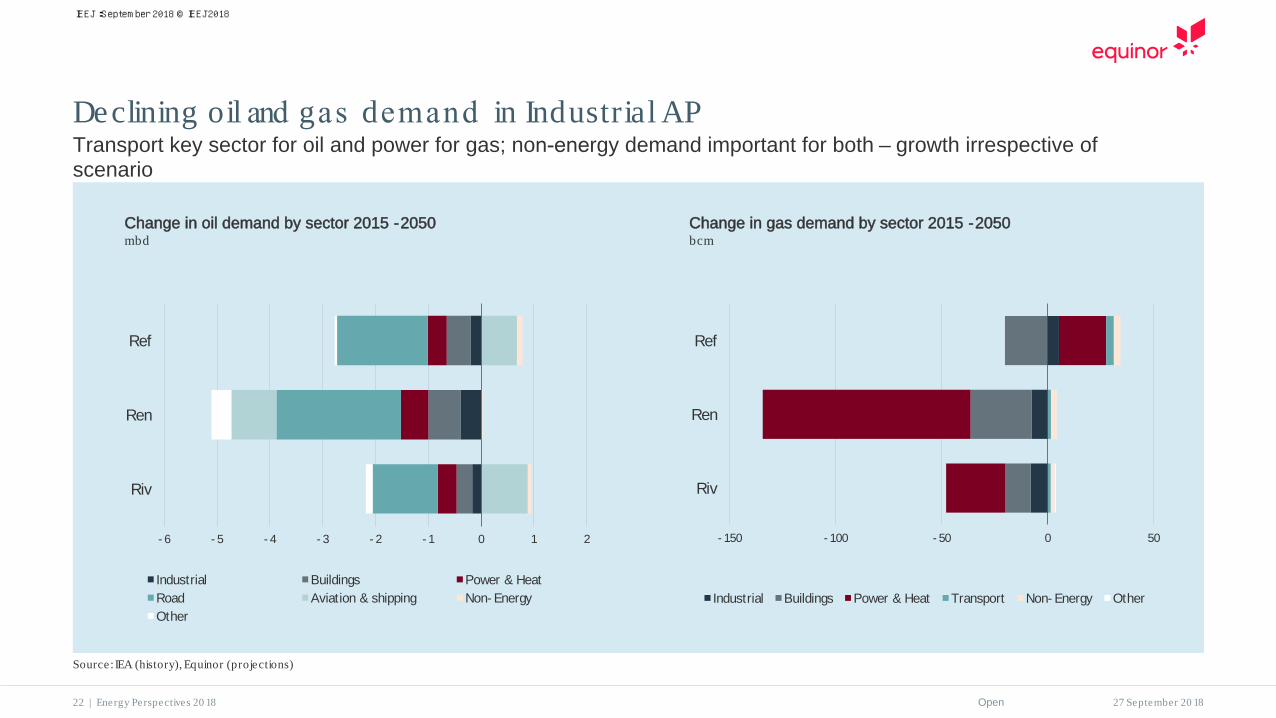
Declining oil and gas demand in Industria l APTransport key sector for oil and power for gas; non-energy demand important for both – growth irrespective of scenario
Change in oil demand by sector 2015 -2050mbd
- 6 - 5 - 4 - 3 - 2 - 1 0 1 2
Riv
Ren
Ref
Industrial Buildings Power & HeatRoad Aviation & shipping Non- EnergyOther
- 150 - 100 - 50 0 50
Riv
Ren
Ref
Industrial Buildings Power & Heat Transport Non- Energy Other
Source: IEA (history), Equinor (projections)
22 | Energy Perspectives 20 18
Change in gas demand by sector 2015 -2050bcm
IEEJ:September 2018 © IEEJ2018
Open 27 September 20 18
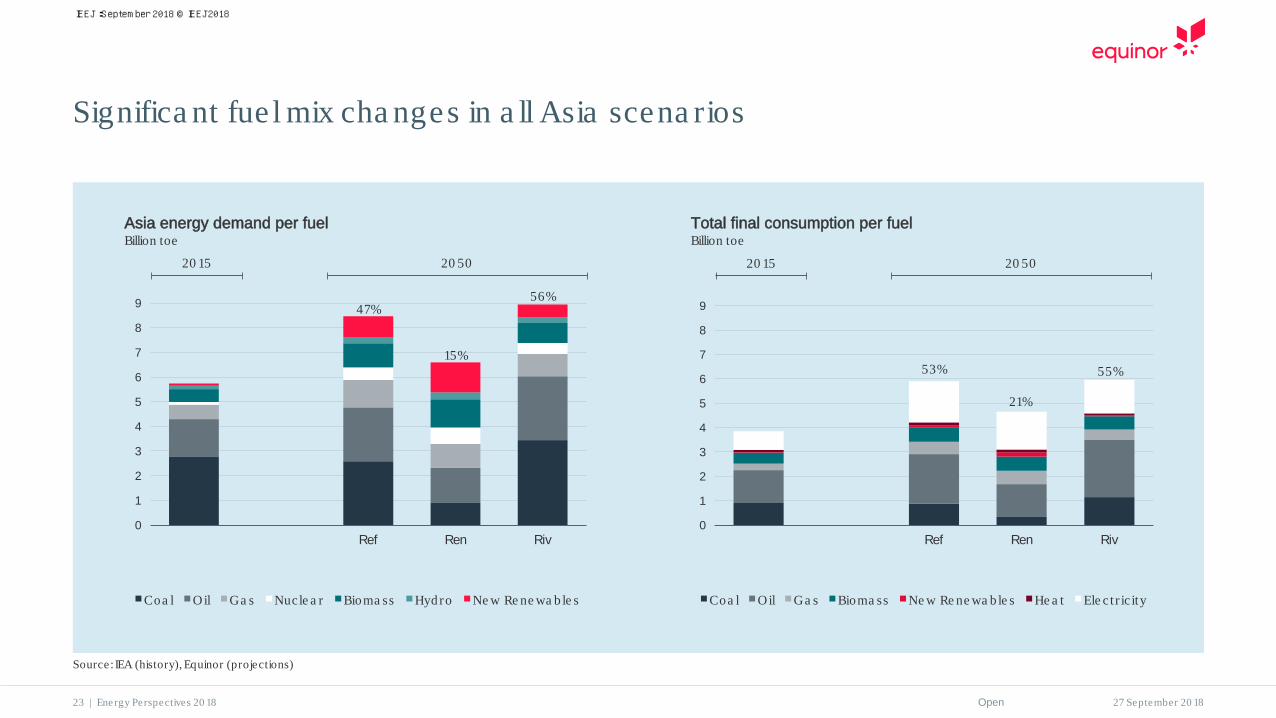
Significa nt fue l mix cha nges in a ll Asia scena rios
Source: IEA (history), Equinor (projections)
23 | Energy Perspectives 20 18
47%
15%
56%
0
1
2
3
4
5
6
7
8
9
Ref Ren Riv
Coa l Oil Ga s Nucle a r Bioma ss Hyd ro Ne w Re ne wa b le s
20 15 20 50
Asia energy demand per fuelBillion toe
53%
21%
55%
0
1
2
3
4
5
6
7
8
9
Ref Ren Riv
Coa l Oil Ga s Bioma ss Ne w Re ne wa b le s He a t Ele c t r ic ity
20 15 20 50
Total final consumption per fuelBillion toe
IEEJ:September 2018 © IEEJ2018
Open 27 September 20 18
0
5
10
15
20
25
Ref Ren Riv
Industrial Residential Commercial
Transport Other
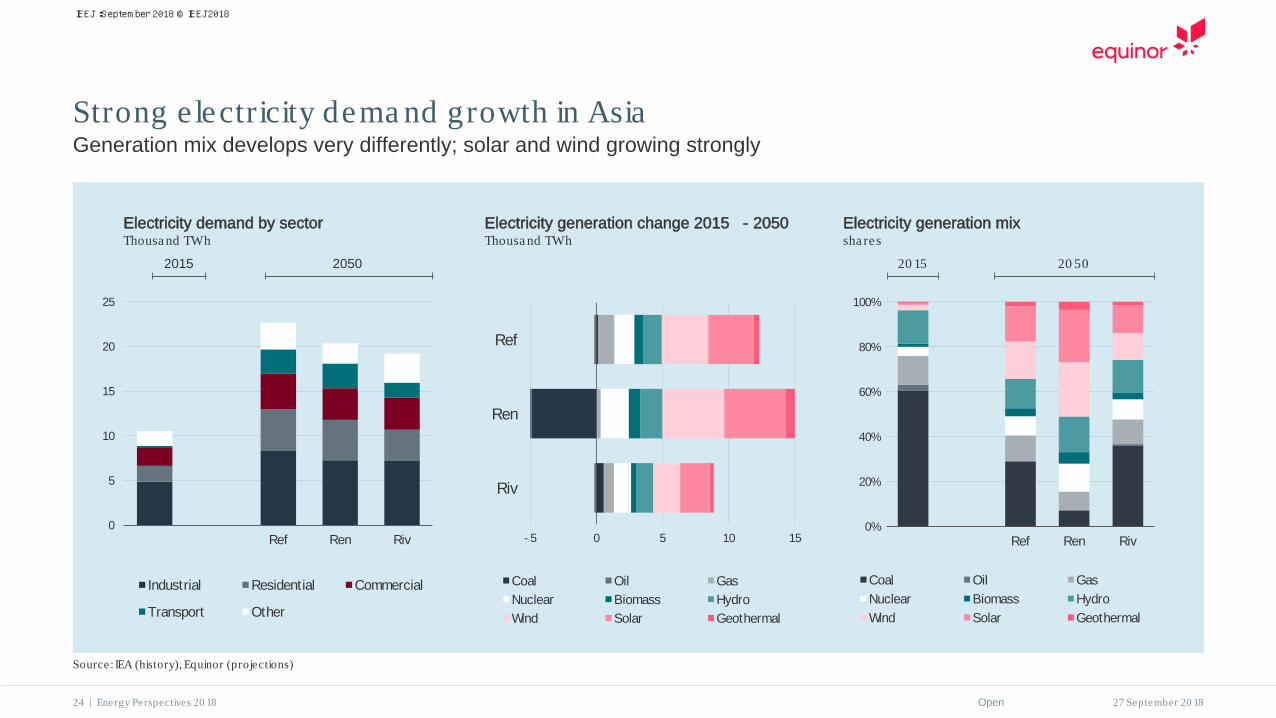
Strong e lectricity dema nd growth in AsiaGeneration mix develops very differently; solar and wind growing strongly
2015 2050
Electricity demand by sectorThousa nd TWh
Electricity generation change 2015 - 2050 Thousa nd TWh
0%
20%
40%
60%
80%
100%
Ref Ren Riv
Coal Oil GasNuclear Biomass HydroWind Solar Geothermal
Electricity generation mixsha res
20 15 20 50
Source: IEA (history), Equinor (projections)
24 | Energy Perspectives 20 18
- 5 0 5 10 15
Riv
Ren
Ref
Coal Oil GasNuclear Biomass HydroWind Solar Geothermal
IEEJ:September 2018 © IEEJ2018
Open 27 September 20 18
Ma ssive cha nges in roa d tra nsport – efficiency a nd fue l mix AsiaBut less certain what is the alternative to oil in shipping and aviation
Fleet mix for LDVsMillion
Fuel mix for non-roadMillion toe
Fleet mix for trucksMillion
0
200
400
600
800
1000
Ref Ren Riv
Diesel Gasoline Hybrid PHEV EV Other
0
10
20
30
40
Ref Ren Riv
Diesel Gasoline Hybrid EV Other
0
150
300
450
600
Ref Ren Riv
Oil Gas Biomass Electricity
20 15 20 50 20 15 20 50 20 15 20 50
Source: IEA (history), Equinor (projections)
25 | Energy Perspectives 20 18
IEEJ:September 2018 © IEEJ2018
Open 27 September 20 18
0
200
400
600
800
Ref Ren Riv
Coal Oil Gas
Tra nsition moving slower in other sectors – AsiaNo silver bullet, efficiency and electrification the primary measures
0
500
1000
1500
2000
2500
Ref Ren Riv
Coal OilGas BiomassNew Renewables HeatElectricity
0
500
1000
1500
2000
2500
Ref Ren Riv
Coal OilGas BiomassNew Renewables HeatElectricity
Industrial demand TFCMillion toe
Non-energy demand TFCMillion toe
Residential and commercial demand TFCMillion toe
20 15 20 50 20 15 20 5020 15 20 50
Source: IEA (history), Equinor (projections)
26 | Energy Perspectives 20 18
IEEJ:September 2018 © IEEJ2018
Open 27 September 20 18
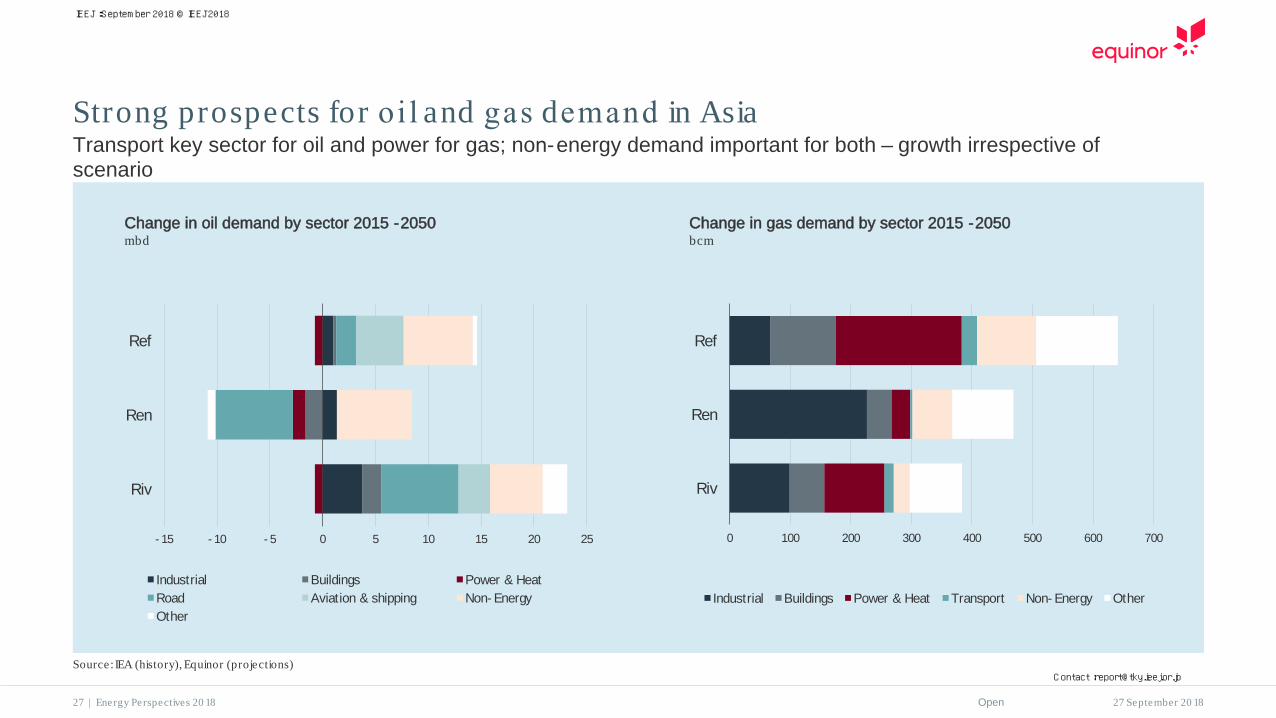
Strong prospects for oil and gas demand in AsiaTransport key sector for oil and power for gas; non-energy demand important for both – growth irrespective of scenario
Change in oil demand by sector 2015 -2050mbd
- 15 - 10 - 5 0 5 10 15 20 25
Riv
Ren
Ref
Industrial Buildings Power & HeatRoad Aviation & shipping Non- EnergyOther
0 100 200 300 400 500 600 700
Riv
Ren
Ref
Industrial Buildings Power & Heat Transport Non- Energy Other
Source: IEA (history), Equinor (projections)
27 | Energy Perspectives 20 18
Change in gas demand by sector 2015 -2050bcm
IEEJ:September 2018 © IEEJ2018
Contact :[email protected]


![Min.era] urces of t'he Plain »and East Cact s Plain Wild rness … · 2011-12-08 · 6. Aeromagnetic anomaly map of Cactus Plain and East Cactus Plain Wilderness Study Areas, La](https://img.pdfslide.us/doc/110x75/5f1175291bc649787879dfc3/minera-urces-of-the-plain-and-east-cact-s-plain-wild-rness-2011-12-08-6.jpg)