Embed Size (px)
Citation preview
Long-term hydrogeological and geochemical response to flooding of an abandonedbelow-drainage Pittsburgh coal mine
Joseph J. Donovan West Virginia University, Morgantown, WV, 26506Bruce Leavitt Consol Inc., Pittsburgh PAEberhard Werner West Virginia University, Morgantown, WV, 26506Eric Perry West Virginia University and Office of Surface Mining, Pittsburgh PAKurt McCoy West Virginia University, Morgantown, WV, 26506
ABSTRACT
Below-drainage mines in the Pittsburgh coal flood after closure, forming mine aquifers separated bycoal barriers. Such aquifers have deep confined and shallow dry zones, separated by a phreatic (watertable) zone. The mine aquifer consists of the extracted mine void plus ca. 15-50 feet of caved overburdenand often has extremely high hydraulic conductivity (K). Mine flooding occurs both by recharge to the dryand phreatic zones and by leakage to the confined zone. The magnitude of inflow is thought to dependstrongly on thickness of overlying overburden. In some cases, mine hydrogeology may be influencedstrongly by horizontal leakage across vertical coal barriers, either into or out from adjacent mines.
Chemistry of raw flooded mine water pumped from Pittsburgh coal was examined over 15 yearsfollowing initial flooding. In the first four years, it was substantially more acidic, with Fe up to 1100 mg/Land pH as low as 3.0. This acidity rapidly declines, and water was net alkaline by year 7. The long-termdischarge is net alkaline (>200 mg/L) with <70 mg/L Fe, pH 6.5-7.0. Equilibria suggest that gypsum is atsaturation in the first 4-5 years, giving way to calcite equilibrium control by year 7. This minedemonstrated 3 geochemical phases: early gypsum control; a transition interval; and late calcite control.Comparison to the chemical history of a nearby flooded Pittsburgh mine of much lower initial aciditiessuggests that similar net-alkaline water chemistry are attained within 15 years irrespective of initial waterchemistry. While long term water chemistry from such mines will become net alkaline, it may for manyyears remain above discharge standards for iron due to a strongly reducing geochemical environment.
INTRODUCTION
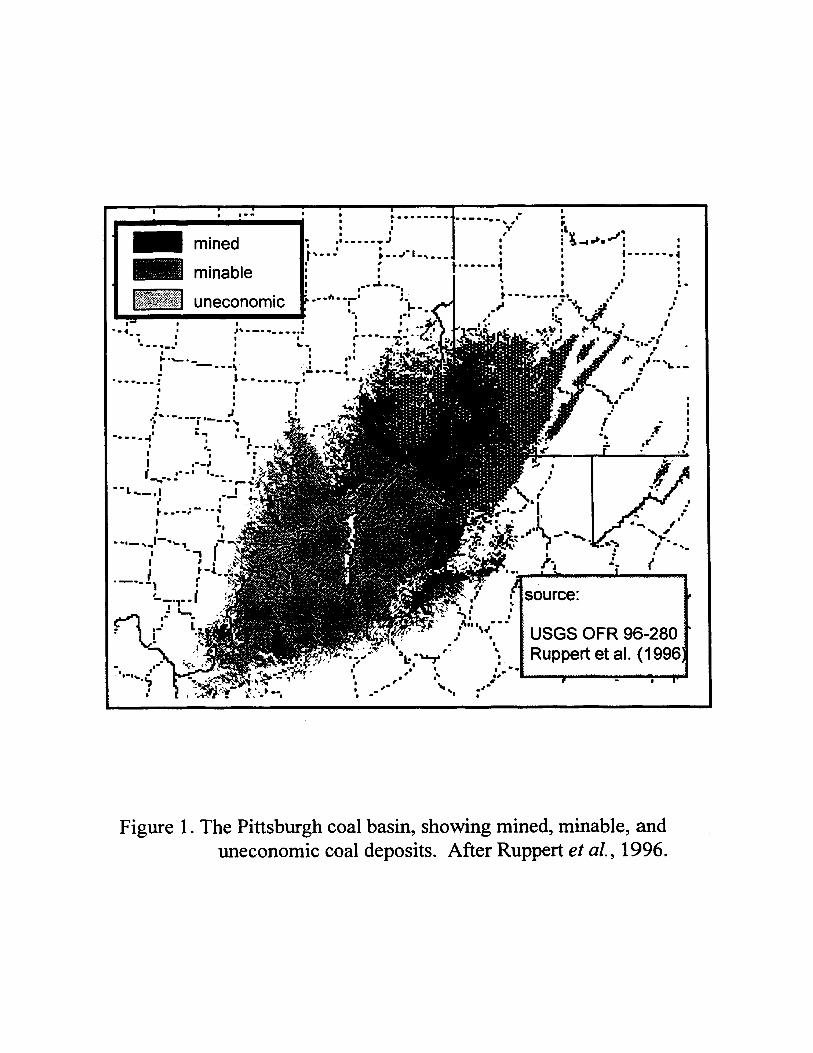
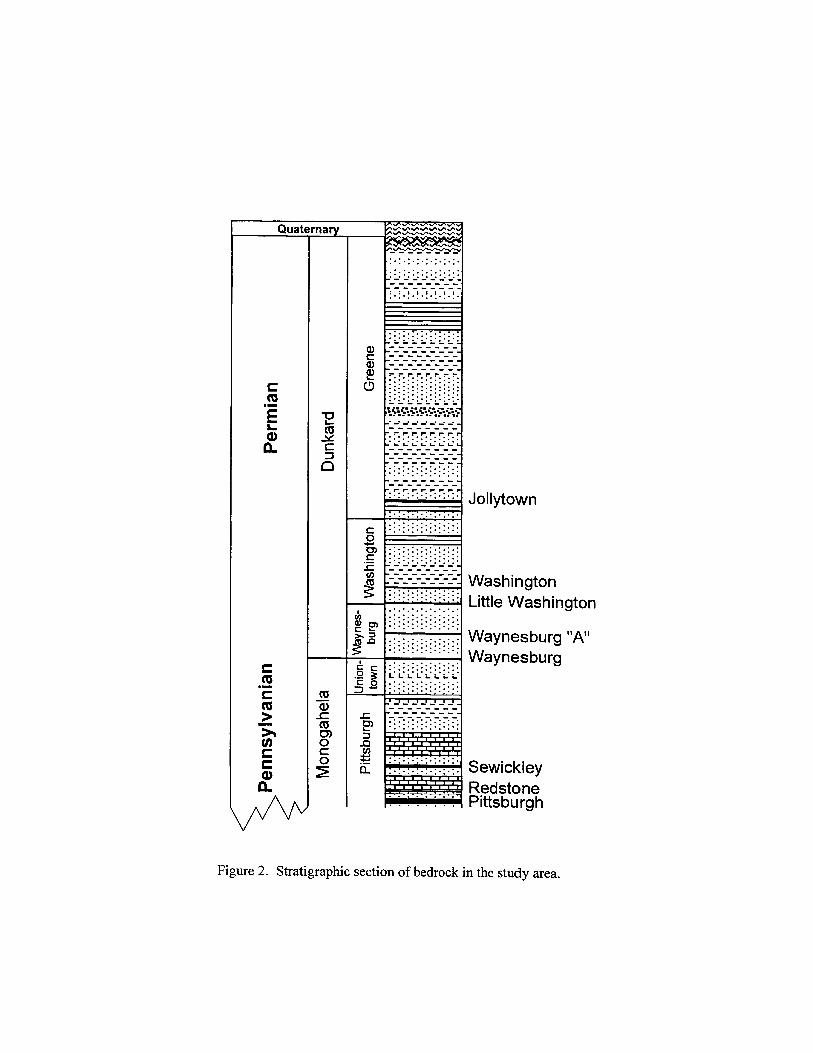
The Pittsburgh coal basin occupies a large (80 x 40 miles) syncline trending north-northeast,underlying portions of SW Pennsylvania, NW West Virginia, and SE Ohio (Figure 1). Bedrock of thisarea is composed of coal measures of the Upper Pennsylvanian to Lower Permian Monongahela andDunkard Groups (Figure 2). Prominent coals in this sequence include the Pittsburgh seam as well asyounger overlying coals (the Redstone, Sewickley, Waynesburg, Little Washington, Washington, andJollytown coals). In this stratigraphic interval, the Pittsburgh coal is the thickest (typically 5-7 feet in thisarea), most continuous, and most extensively mined coal seam. Production comes from both undergroundand surface mines, but in the Pittsburgh coal basin, underground mine acreage constitutes 80% of reserves.
The dominant structure where Pittsburgh coal is mined underground is a large SW-NE trendingsyncline, generally bounded by the Monongahela River on the east, the West Fork River on the south, andthe Ohio River on the west and north (Figures 1, 2; Ruppert et al., 1996). On the perimeter of and justbeyond this syncline, isolated blocks of Pittsburgh coal lie above surface drainage and are dissected
- page 2 -
Long-term hydrogeological and geochemical response…. Donovan et al., 2000
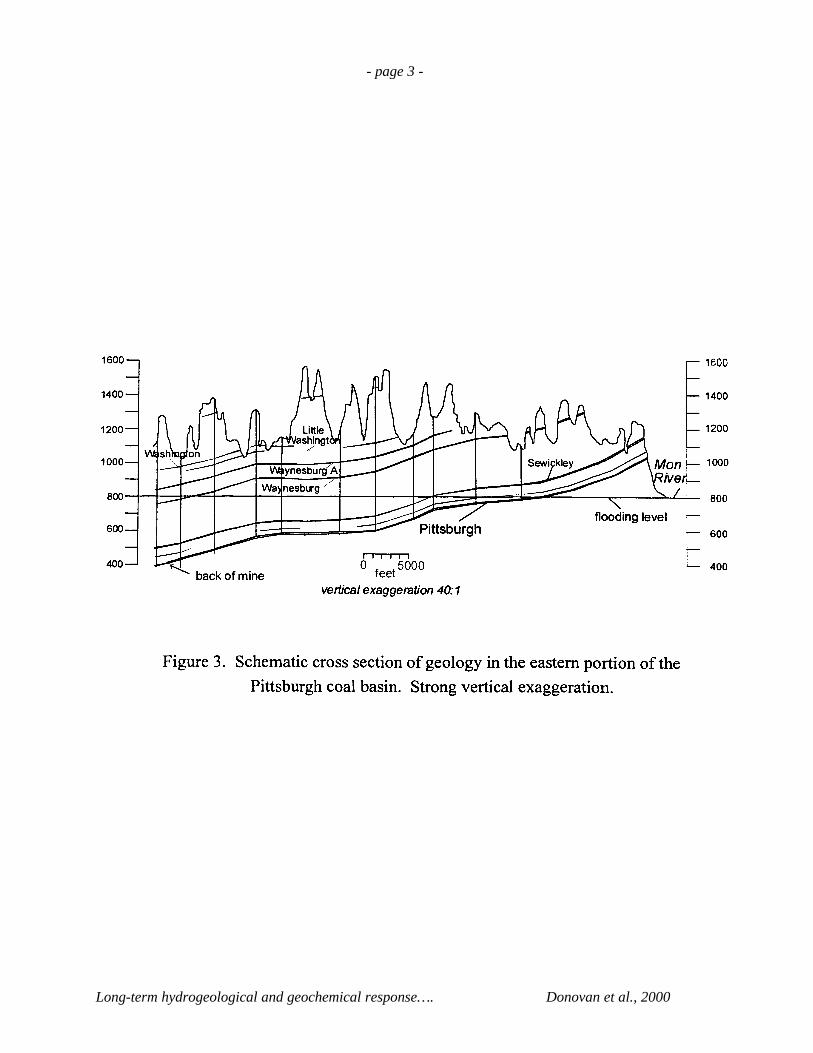
by erosion. Here the Pittsburgh coal has been extensively mined at depths within 200 feet of the surface.However, in most of the basin, the coal seam lies well below surface drainage elevation and is minedstrictly by underground methods. In West Virginia, west of the Monongahela River, the coal dips steeplynorthwestward, and within about 2 miles of the river it lies within 500 feet of the surface (Figure 3).Modern mining is in general confined to >200 feet above sea level surface.
Most underground Pittsburgh mines are advanced from shallow to deep cover and lie below regionaldrainage elevations. As mining progresses, groundwater can infiltrate into the mine, as a result the mine isprogressively dewatered to allow mining to progress. As deeper mines are commonly separated fromshallower updip mines by thick barriers of unmined coal, shallow abandoned mines may be flooded whiledeeper mining continues. One of several regulatory issues regarding closure of such mines is long-termdischarge of water after they have fully flooded. Both the quantity of ultimate mine discharge and thechemistry of groundwater that may evolve are not well known.
Following mine abandonment, pumping from the active mine is terminated and mine voids areallowed to re-saturate. Flooding of abandoned mines will generally continue until groundwater achieves anew equilibrium, either by surface discharge of mine water or by controlled pumping and treatment. Wherethe mined coal is high in sulfur, as in the Pittsburgh basin, mine water discharged following abandonmentmay be acidic and/or high in dissolved metals, thus requiring active or passive treatment. While it has longbeen known that Pittsburgh coal discharges in this region may be acidic, it is less clear how this chemistrywill change following flooding and establishment of a new hydrologic equilibrium.
Purpose
The purpose of this study is to examine a long-term (>decadal) dataset describing flooding andchanges in chemistry of groundwater from a Pittsburgh coal mine. Datasets of this type are sparse but maybe very relevant to projecting the chemistry of future discharges from the basin. There are both fluid flowand chemical aspects of the mine-flooding problem. We will therefore examine:
• hydrogeological framework of flooding mines,
• the chemistry evolved in mines immediately post-flooding.
Background: Hydrogeological Framework of Mines and Mine pools
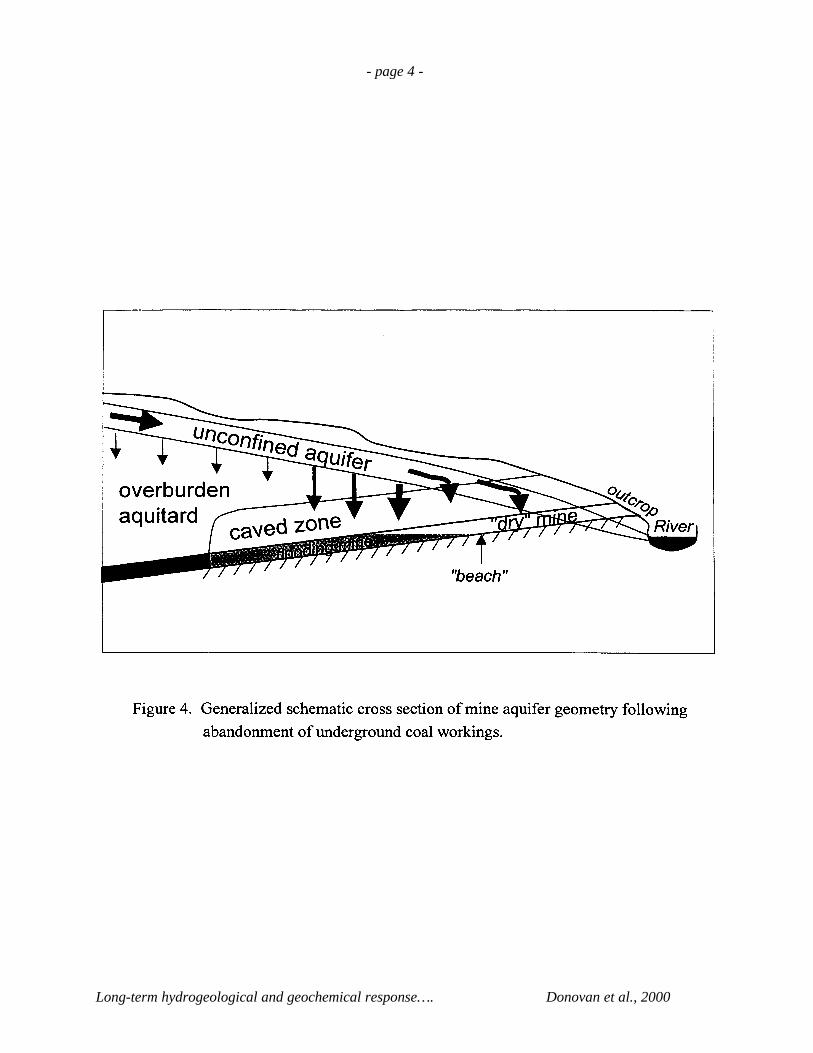
Figure 4 shows a generalized schematic of the hydrogeology of a below-drainage mined out coalseam near its outcrop adjacent to a major river such as the Monongahela or Ohio. Only the coal seambelow the “caved zone” in overburden is mined. There is an extensive body of literature on minesubsidence effects (Hobba, 1981; Peng, 1992) and on the hydrogeology of fractured sedimentary stratasuch as these (Schubert, 1980, Stoner, 1983); it is generally regarded that overburden above the mined coalwill collapse to a height of several times the extraction thickness (Singh and Kendorski, 1981; Parizek andRamani, 1996). The “mine aquifer” therefore occupies zones of high porosity and hydraulic conductivity(K) both within the former coal seam (full of subsided rubble) as well as within overlying collapsedoverburden. K values of mine aquifers may be extremely high, and frequently the hydraulic gradient(change in water level per unit distance) across mine aquifers are very small. The aquifer receives rechargein its dry portions and leakage through overburden where it is flooded. The spatial inflow rates of water tothe mine are thought to be greatest where overburden thickness is minimal, as indicated on Figure 4. Theflooding mine will, if the beds are dipping, develop a “beach”, a phreatic zone where the water table lieswithin the mine aquifer itself. Downdip of the beach, groundwater extends to the roof of the mine aquifer,and groundwater is therefore confined (artesian).
- page 3 -
Long-term hydrogeological and geochemical response…. Donovan et al., 2000
- page 4 -
Long-term hydrogeological and geochemical response…. Donovan et al., 2000
- page 5 -
Long-term hydrogeological and geochemical response…. Donovan et al., 2000
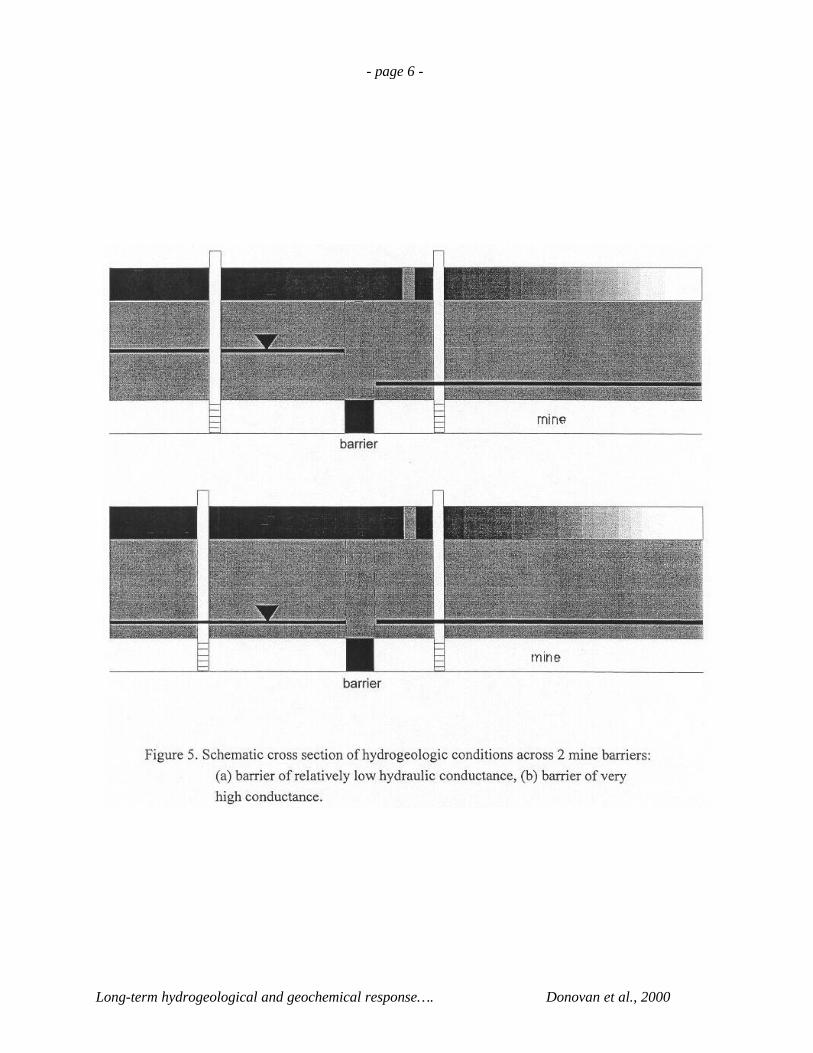
The hydraulic boundaries of an individual mine are the perimeter formed by its outcrop plus all fully-continuous perimeter coal barrier section. The mine aquifer will commonly display a nearly uniformhydraulic head within its barriers, due to its high K. As K of barriers is generally much lower, individualmine aquifers have the potential to differ in hydraulic head from each other and to respond individually tochanges in water budget (Figure 5). Perimeter barriers may leak water either into or out of any given mine,provided there is a difference in hydraulic head (Figure 5a). However, adjacent mines may also display nohead difference, which may mean either that there is no head gradient (and hence no flow) or that theconnection between the two mines is so conductive that no head difference can be sustained.
Figure 6 shows a cartoon of a mine and its barriers in plan (top) and profile (bottom). While rarelyobserved or sampled, the phreatic zone is likely to occur as a narrow strip where the water table lies withinthe mine. The vadose (unsaturated) zone of the mine extends to the outcrop. The confined zone extendsfrom the phreatic zone to the back of the mine. A water budget may be defined for either a mine pool or foran individual mine by considering fluxes across its boundaries, either vertical (barriers, outcrops) orhorizontal (the overlying aquitard).
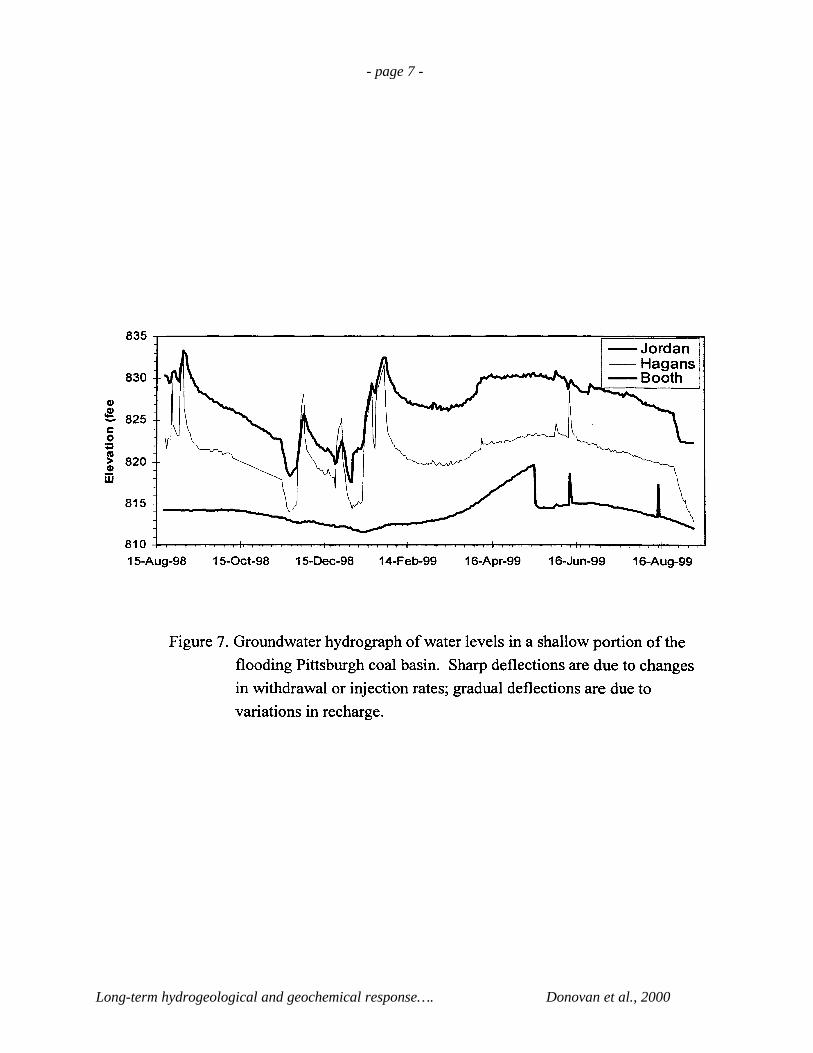
In some cases, water levels in two or more adjacent mines will fluctuate in unison in response toseasonal or man-induced stresses (Figure 7). Such mines may be either (a) nearly identical in hydraulichead, or (b) at constant difference in hydraulic head. A set of mines which clearly exhibit close hydraulicconnection are sometimes referred to as a mine pool. It may be inferred that there are no barriers betweensuch mines or that the barriers between such mines are of relatively high conductance (i.e., very leaky). Ifinflow rate is greater than outflow rate at any time, water storage -- and hydraulic head in the saturatedportion of the mine -- will increase. If outflows are greater than inflows, then hydraulic head will decline.Common aquifer fluxes include:
INFLOWS OUTFLOWSrecharge evapotranspirationleakage (downward) leakage (upward)barrier leakage barrier leakagewell injection well pumping, siphonage, or artesian flowstream leakage baseflow discharge to streams
mine discharge (at outcrop)
Potential inflows to the mine may include:
• recharge: infiltration from the surface to the water table and/or to the unsaturated (updip) portion of themine
• leakage: flow from shallow water tables or flooded mines through overburden aquitards to the confinedportion of the mine
• barrier leakage: horizontal flow across barriers from mine(s) at higher hydraulic head• well or siphon injection of water or sludge from treatment facilities or other mines
Outflows may include:• horizontal flow (leakage) across barriers to adjacent mines at lower hydraulic head• pump or siphon withdrawal of water for water-level control and/or treatment• leakage through boreholes into overlying flooded or dry mines at lower hydraulic head• discharge to streams, shallower aquifers, or crop-line springs
- page 6 -
Long-term hydrogeological and geochemical response…. Donovan et al., 2000
- page 7 -
Long-term hydrogeological and geochemical response…. Donovan et al., 2000
- page 8 -
Long-term hydrogeological and geochemical response…. Donovan et al., 2000
Pre-mining and post-mining hydrology compared
It is useful to compare hypothetical groundwater conditions during flooding and after flooding iscomplete and pumping controls mine water levels. Early in flooding, assuming uniform vertical leakage,the mine will be largely dry except for isolated impoundments (“sub-pools”) within the mine updip ofinternal coal blocks. The sub-pools may exist at various locations and elevations within the mine, andwells installed at this time will be either dry or yield water levels that may not be typical of extensive areasof the mine. Most of the mine will be unsaturated and at approximately atmospheric pressure. Thegreatest abundance of sub-pools will tend to be at the back of the mine, where recharge and leakage willcollect. These sub-pools at the back of the mine will tend to coalesce and form a main pool, which will risefrom the back of the mine in an up-dip direction.
As flooding progresses, subpools will tend to coalesce into a single main pool. As water levelsapproach overlying stream elevations or the lowest of surface outcrop elevations, the possibility forbreakout develops and the groundwater level must be stabilized before discharge to the surface occurs.Such pumping to control rising mine water yields a long-term control elevation that is below both overlyingstream drainage and outcrop elevations.
A flooding or flooded mine may be divided into three hydrogeologic zones: the saturated portion ofthe mine (the artesian, or confined, zone), where the potentiometric level is above the mine and its overlyingcaved zone; the dry-bottomed vadose (or unsaturated) zone; and the partially flooded, or phreatic (watertable) zone, formed due to the non-zero dip of the coal. The principal difference between pre- and post-flooding is the location of the phreatic zone. Early in flooding, the phreatic zone is quite discontinuous, andconcentrated mainly deep in the mine (Figure 6). After flooding is complete, the phreatic zone will be muchmore continuous and lie in shallow portions of the mine, perhaps close to the outcrop, or may only exist inthe overlying bedrock if the mine is completely flooded. However, the main pool may stabilize at a lowerelevation, if water-control measures are implemented or if the mine spills into an adjacent mine. Thephreatic zone may consist of a number of disconnected pools early in flooding, but, later in mining, it isgenerally a single continuous saturated area, having formed from coalescence of isolated phreatic zones dueto flooding.
The flooding situation is a transient scenario, while the flooded (post-flooding) case is a steady stateone. In transient groundwater flow systems, hydraulic head is continuously changing with time. Steady-state flow systems show no temporal change in hydraulic head except for minor fluctuations of a seasonalor annual nature. At hydraulic steady state, the sum of inflows is exactly equal to the sum of outflows, andmine flooding is complete.
RESULTS
Flooding history
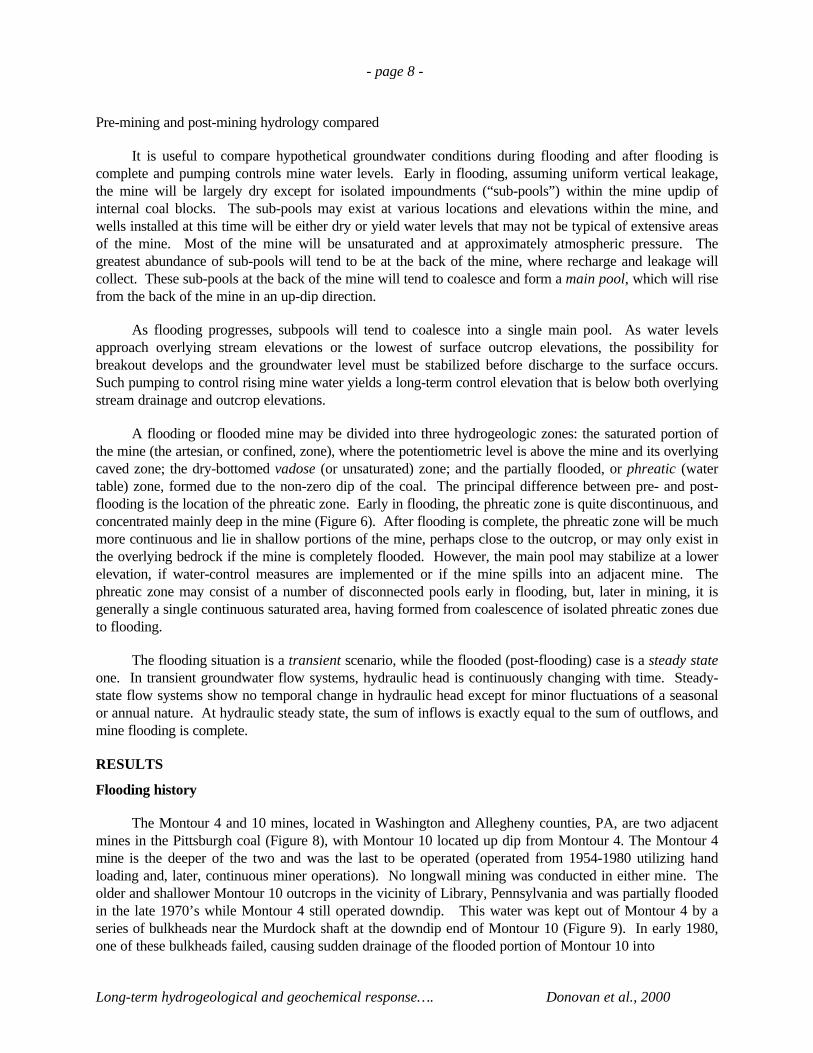
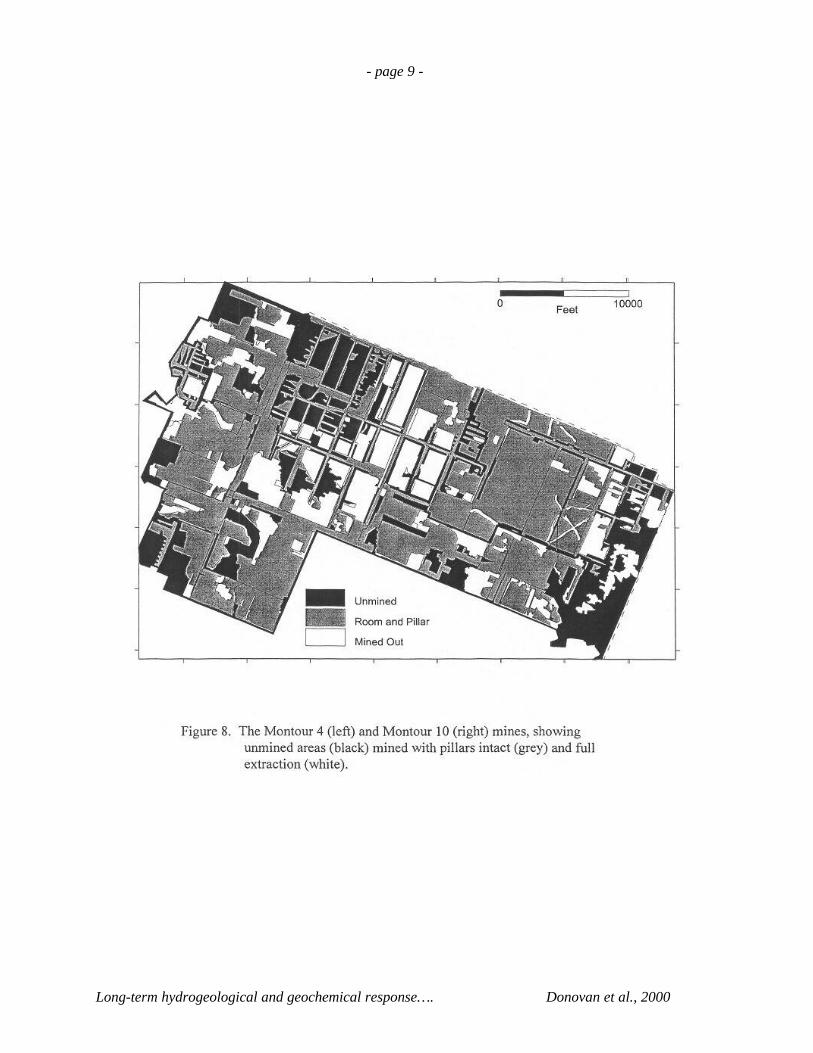
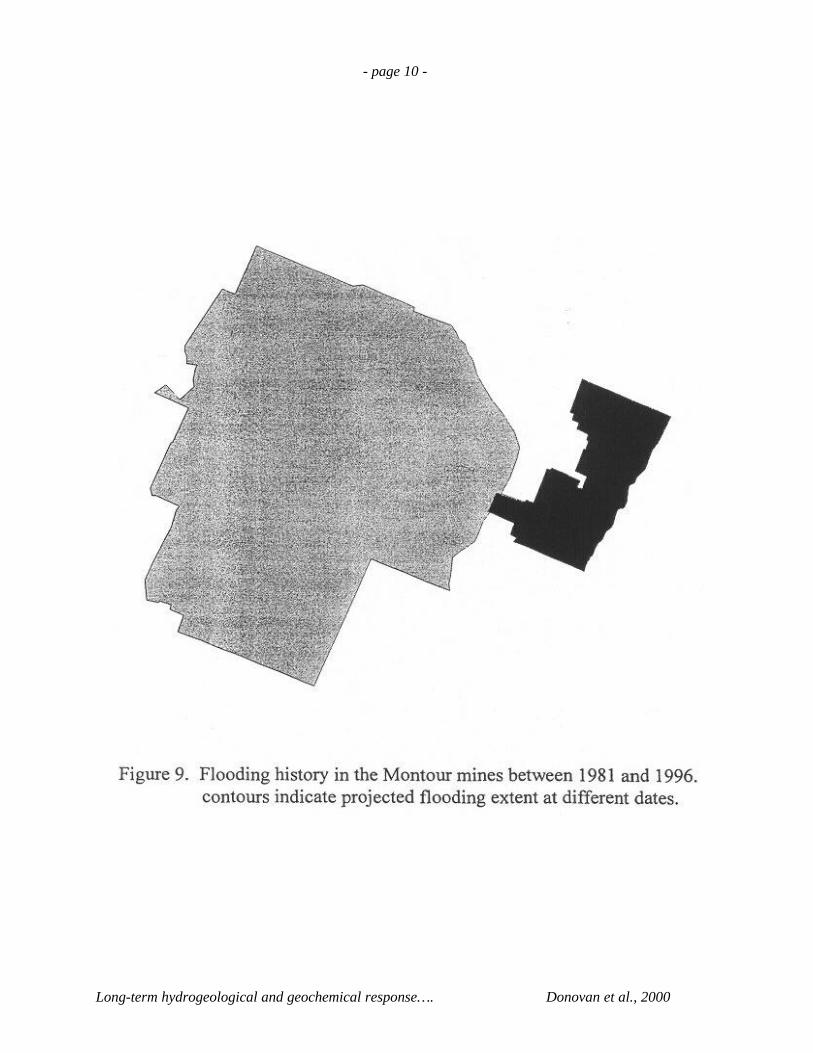
The Montour 4 and 10 mines, located in Washington and Allegheny counties, PA, are two adjacentmines in the Pittsburgh coal (Figure 8), with Montour 10 located up dip from Montour 4. The Montour 4mine is the deeper of the two and was the last to be operated (operated from 1954-1980 utilizing handloading and, later, continuous miner operations). No longwall mining was conducted in either mine. Theolder and shallower Montour 10 outcrops in the vicinity of Library, Pennsylvania and was partially floodedin the late 1970’s while Montour 4 still operated downdip. This water was kept out of Montour 4 by aseries of bulkheads near the Murdock shaft at the downdip end of Montour 10 (Figure 9). In early 1980,one of these bulkheads failed, causing sudden drainage of the flooded portion of Montour 10 into
- page 9 -
Long-term hydrogeological and geochemical response…. Donovan et al., 2000
- page 10 -
Long-term hydrogeological and geochemical response…. Donovan et al., 2000
- page 11 -
Long-term hydrogeological and geochemical response…. Donovan et al., 2000
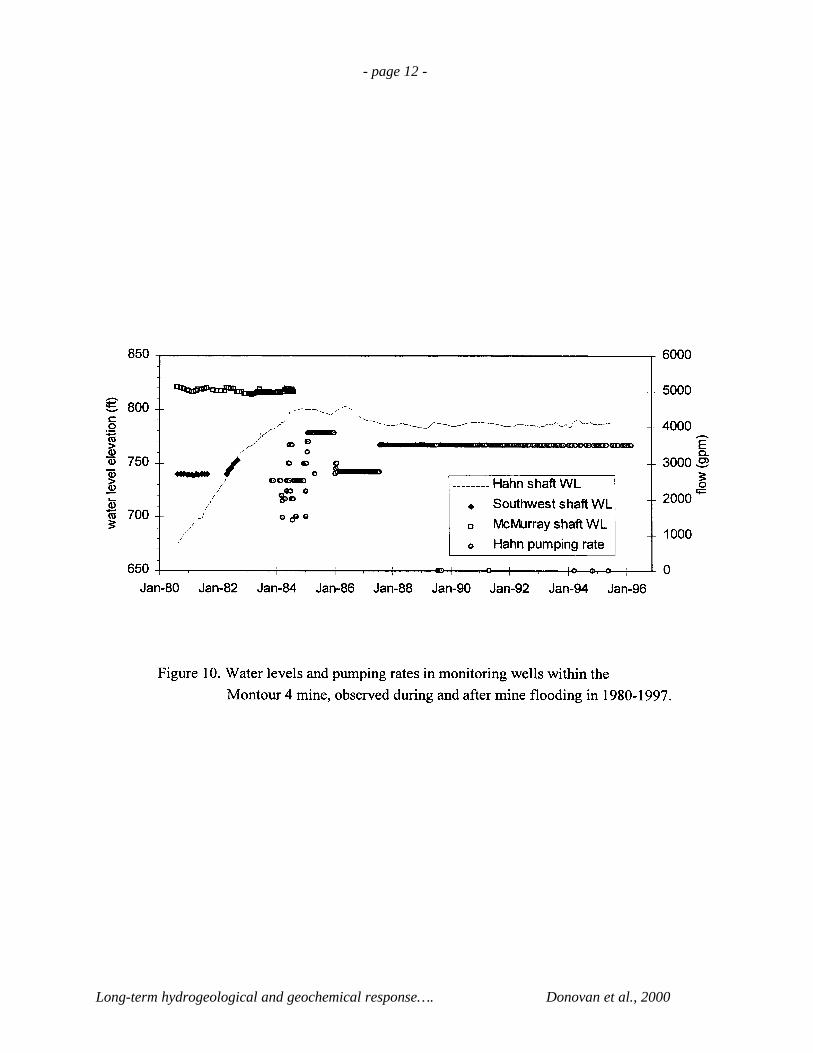
the back of Montour 4. As a result, after an unsuccessful attempt to stop the inflow, Montour 4 wasclosed and allowed to flood without pumping from 1980-84 (Figure 10). Flooding proceeded, with floodinglevels as indicated on Figure 9, until the water level in Montour 4 reached a control elevation of about 790feet in late 1984, 45 feet below Chartiers Creek, the lowest surface elevation above the mine. At this point,the mine (including both Montour 4 and 10) was about 60 percent flooded. Mine groundwater has been atall times kept below 820 feet elevation to prevent its discharge to the surface. Pumping was undertakenfrom the lowest mine elevation in Montour 4, at the Hahn shaft, at a rate from 1400-3850 gallons/minute inthe first 3 years, ultimately stabilizing at 3500 gpm. Figure 10 shows the history of water levels andpumping rates in the Montour 10 (McMurray shaft) and Montour 4 (Hahn, Southwest shafts) mines.
Since closure, these two mines have been hydrologically open to each other, with water drainingthrough #10 into #4. The Hahn shaft and Southwest well in Montour 4 initially tapped separate pools, butthese pools merged in mid 1982 and continued to rise together thereafter (Figure 8, 9). The McMurrayshaft in Montour 10 remained at about 815-820 feet while and after Montour 4 flooded, suggesting thatthis higher sub-pool level was controlled by a spill level. Total discharge has ranged from 1200 to 4300gpm, with a stable 3550 gpm average controlling water levels effectively since late 1987.
Water levels were collected frequently in the Hahn shaft, as well as the Southwest and McMurrayshafts in Montour 10, from 1980 to the present (Figure 10). Measurements of all shafts, except for Hahn,were discontinued by 1985 when it was determined that Hahn water levels reflected that of the main pool inMontour 4. Pumping rates are approximately known (circles on Figure 10, right hand axis).
The Montour 4 mine underlies approximately 14,700 mined acres, of which 10,500 acres, or 71%,are flooded. Montour 10 underlies approximately 6450 acres, of which 1250 acres, or 19% are flooded.Combined, the mines underlie approximately 17,000 acres (33 square miles). Montour 4 is abuttedlaterally on the south by the Mathies mine, which is closed and flooding; on the east by Montour 10; on thenorth by the Cloverdale mine, which is closed and fully flooded; and on the west by unmined coal. Theflows across barriers into Mathies and Cloverdale are thought to be minor.
The flooded portions of Montour 4 (flooded to 790 feet) plus Montour 10 (flooded to 820 feet) totalapproximately 1.75 x 108 ft2. This value does not include blocks of unmined coal. The mined portionswere mapped as either room-and-pillar (50% average extraction) or full extraction (80% extraction). Theflooded volume in both mines, using 6 feet average unsubsided thickness, 15% subsidence reduction, 50%average extraction for room-and-pillar, and 80% extraction for robbed pillar sections, is about 9.83 x 10⁸
ft3. At 3500 gpm, the average residence time of water in the mine is 4.37 years, assuming that all waterdrains to the pump and there is neither short-circuiting nor stagnation of water in sub-pools.
Mine-water chemistry
By November 1983, flooding was near completion and water treatment began at the Hahn acid minedrainage treatment plant, over the lowest elevation in Montour 4. Samples for water chemistry werecollected from the post-flooding mine discharge, at intervals from weekly to monthly, from about 1983 tothe present. Raw water was generally clear, oxygen-and sediment-free, so filtration was not performed.The sample was split soon after sampling in the lab for anion and cation analysis by conventional methods.Analysis was performed for Fe, Al, Mn, Ca, Mg, Na, K, SO4, and Cl, as well as pH and alkalinity.Acidities were calculated from metal concentrations assuming metals were all in reduced form; thiscalculation was used because of apparent inconsistencies between metals
- page 12 -
Long-term hydrogeological and geochemical response…. Donovan et al., 2000
- page 13 -
Long-term hydrogeological and geochemical response…. Donovan et al., 2000
concentrations and titration acidities early in the dataset. Reported alkalinities were subtracted fromcalculated acidities to yield a net acidity, that which would be obtained if all metal acidity was converted tohydrogen-ion acidity and allowed to convert all carbonate alkalinity to carbonic acid. A positive value ofnet acidity indicates that acidity exceeds alkalinity; a negative value indicates the converse.
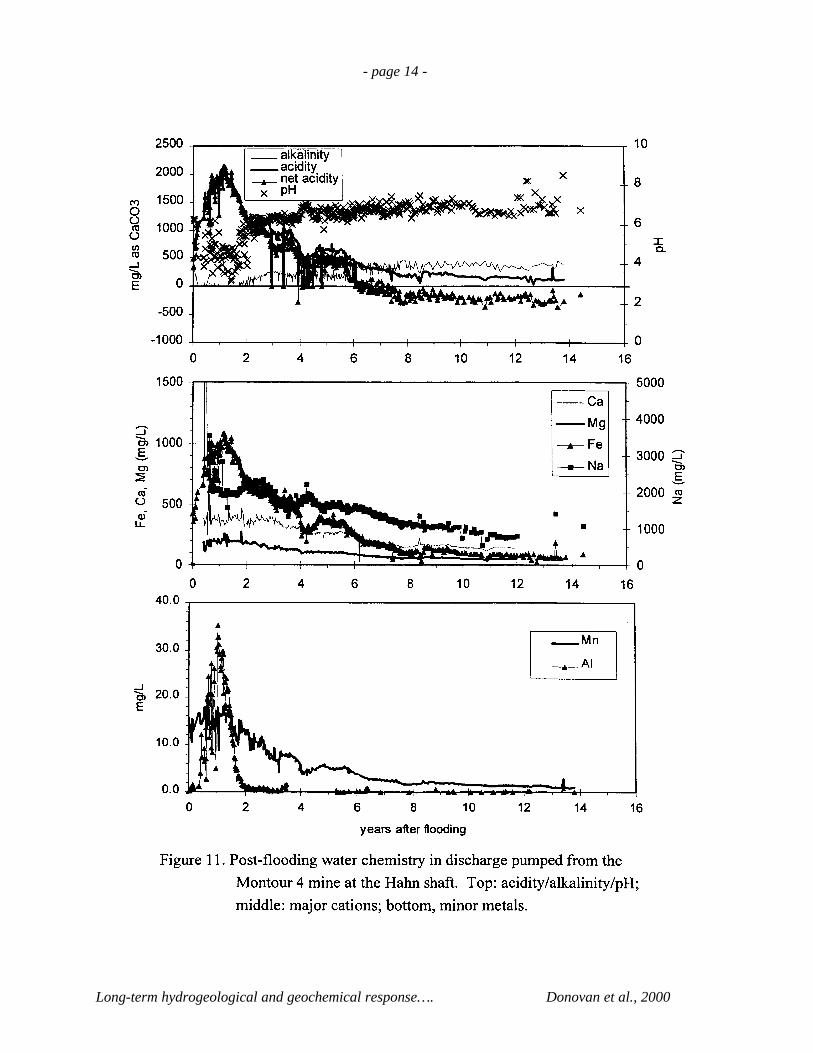
Figure 11 shows water chemistry for untreated discharge from the Hahn plant for the 15 year periodfrom 1983 to 1998. These time series are plotted with respect to time (in years) after 10/20/83, the date atwhich water level in Hahn shaft reached 780 feet and pumping began. There were two different pumpsinstalled on the intake and return sides of the Hahn shaft. This resulted in some chemical variability in thetime series, as the two pumps appeared to have induced flow from different directions into the shaft.
Figure 11 (top) shows pH (symbols), alkalinity and acidity (lines), and net acidity (triangles) forMontour. Conditions in thee first two years were strongly acidic, with pH as low as 3.0 and acidity as highas 2200 mg/L. Mine discharge increased in acidity for the first year until it reached 2000 mg/l (Fe 1000mg/l) in 12/84, 1.2 years into pumping. Following this time, however, there was an approximatelyexponential decline in acidity and, starting late in year 2, the onset of some measurable alkalinity in thedischarge. Within five years of the peak acidity, the mine water had become net alkaline. The quantity ofalkalinity fluctuated considerably between years 2 and 8, fluctuating between zero and 350 mg/L, butfollowing year 8.7, it stabilized somewhat between 330-430 mg/L. Iron levels decreased by the end of year8 (1991) from 1000 mg/l to about 100 mg/l. Today, Fe concentrations are from 60-80 mg/L.
After remaining below 4.5 for the first 2 years, pH rose to 5.5 and higher after year 1.8, and by themiddle of year 3 had stabilized at pH 6.2-6.5. pH slowly rose to between 6.5 and 7.0 after year 8. By theend of year 6, the water had become net alkaline, reaching a stable range of from 150 to 350 mg/L excessalkalinity following year 8.
The water is Fe dominant. Concentrations are very low for aluminum (Al) and manganese (Mn),except in the first two years (Figure 3-3, bottom). Al becomes <1 mg/L after 4 years, and Mn stabilizes atca. 2 mg/L after 8 years. In contrast, Fe concentrations were very high, especially in years 0-2, brieflyexceeding 1000 mg/L. The decline of Fe parallels that of acidity, reaching a range of 50 to 100 mg/L after10 years.
The dominant cation in mass, as well as equivalent, concentration following the first two years is, byfar, sodium (Na) (Figure 10, middle, which uses the right-hand axis). Although not analyzed at the end ofthe study period, its concentration was still >750 mg/L at the end of year 12. Also contributing were Caand Mg, which occurred in the molar ratio Ca/Mg of 1.2 (early) to 1.6 (late) during evolution of the minewater.
Mineral equilibria
Analysis of mineral equilibria for reactions of interest possibly influencing mine chemistry wasundertaken using PHREEQC and the aqueous thermodynamic database of WATEQ4F (Ball andNordstrom, 1991). Field water chemistries and temperature were used for calculations. Activities werecalculated using a modified Debye-Huckel model.
Neither redox potential nor redox couples were measured in the field. However, it was qualitativelyreported that aqueous H2S was present in Montour discharge throughout the pumping period. Therefore,an estimate of Eh was made assuming approximate equilibrium between aqueous H2S or HS- (depending onpH) and SO4. This yields values in the range of –200 to –250 millivolts.
- page 14 -
Long-term hydrogeological and geochemical response…. Donovan et al., 2000
- page 15 -
Long-term hydrogeological and geochemical response…. Donovan et al., 2000
This is consistent with field measurements from six wells in Marion County, WV in the mined Pittsburghcoal; measured Eh values were taken with a saturated calomel and platinum electrode pair within a flow-through cell used to exclude atmospheric gases. These electrode values ranged from about +220 to -180millivolts. A small number of samples have been analyzed for field-measured dissolved sulfide and sulfatethen used to calculate a Nernst Eh based on the sulfide/sulfate couple. Amounts of dissolved sulfide haveranged from <0.001 mg/l to a maximum of 0.63 mg/l. Eh calculated from sulfide-sulfate couple is alwaysless than the measured electrode value, by from 20 to 118 mv. The differences may result from measuringa system containing two redox couples, sulfide/sulfate and ferrous/ferric iron, yielding a mixed potentialmeasurement, nonequilibrium between components, or analytical limits of detection. There is thereforesome uncertainty in estimation of Eh in the mine water environment at this time, that may influencecalculations involving either reduced or oxidized iron minerals.
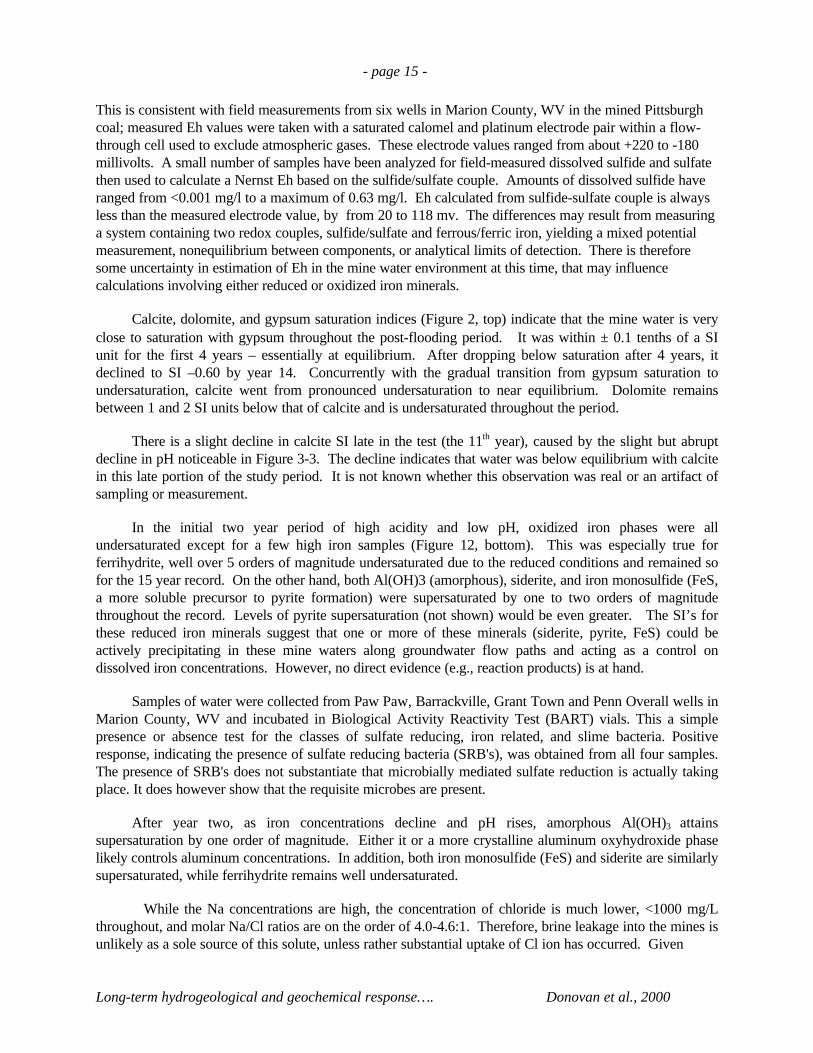
Calcite, dolomite, and gypsum saturation indices (Figure 2, top) indicate that the mine water is veryclose to saturation with gypsum throughout the post-flooding period. It was within ± 0.1 tenths of a SIunit for the first 4 years – essentially at equilibrium. After dropping below saturation after 4 years, itdeclined to SI –0.60 by year 14. Concurrently with the gradual transition from gypsum saturation toundersaturation, calcite went from pronounced undersaturation to near equilibrium. Dolomite remainsbetween 1 and 2 SI units below that of calcite and is undersaturated throughout the period.
There is a slight decline in calcite SI late in the test (the 11th year), caused by the slight but abruptdecline in pH noticeable in Figure 3-3. The decline indicates that water was below equilibrium with calcitein this late portion of the study period. It is not known whether this observation was real or an artifact ofsampling or measurement.
In the initial two year period of high acidity and low pH, oxidized iron phases were allundersaturated except for a few high iron samples (Figure 12, bottom). This was especially true forferrihydrite, well over 5 orders of magnitude undersaturated due to the reduced conditions and remained sofor the 15 year record. On the other hand, both Al(OH)3 (amorphous), siderite, and iron monosulfide (FeS,a more soluble precursor to pyrite formation) were supersaturated by one to two orders of magnitudethroughout the record. Levels of pyrite supersaturation (not shown) would be even greater. The SI’s forthese reduced iron minerals suggest that one or more of these minerals (siderite, pyrite, FeS) could beactively precipitating in these mine waters along groundwater flow paths and acting as a control ondissolved iron concentrations. However, no direct evidence (e.g., reaction products) is at hand.
Samples of water were collected from Paw Paw, Barrackville, Grant Town and Penn Overall wells inMarion County, WV and incubated in Biological Activity Reactivity Test (BART) vials. This a simplepresence or absence test for the classes of sulfate reducing, iron related, and slime bacteria. Positiveresponse, indicating the presence of sulfate reducing bacteria (SRB's), was obtained from all four samples.The presence of SRB's does not substantiate that microbially mediated sulfate reduction is actually takingplace. It does however show that the requisite microbes are present.
After year two, as iron concentrations decline and pH rises, amorphous Al(OH)3 attainssupersaturation by one order of magnitude. Either it or a more crystalline aluminum oxyhydroxide phaselikely controls aluminum concentrations. In addition, both iron monosulfide (FeS) and siderite are similarlysupersaturated, while ferrihydrite remains well undersaturated.
While the Na concentrations are high, the concentration of chloride is much lower, <1000 mg/Lthroughout, and molar Na/Cl ratios are on the order of 4.0-4.6:1. Therefore, brine leakage into the mines isunlikely as a sole source of this solute, unless rather substantial uptake of Cl ion has occurred. Given
- page 16 -
Long-term hydrogeological and geochemical response…. Donovan et al., 2000
- page 17 -
Long-term hydrogeological and geochemical response…. Donovan et al., 2000
the conservative nature of Cl, this is considered less likely than derivation of additional Na from othersources than halite dissolution or brine dilution. A speculated source for sodium is some combination ofion exchange and alteration of sodic clays within the Pennsylvanian coal or overburden strataDisplacement of Na from surfaces could well be caused by either Ca, Mg, or Fe, all which are divalent andhave a tendency to displace sodium on surfaces (e.g., “natural softening”).
Comparison of Montour chemistry to that of a similar mine discharge
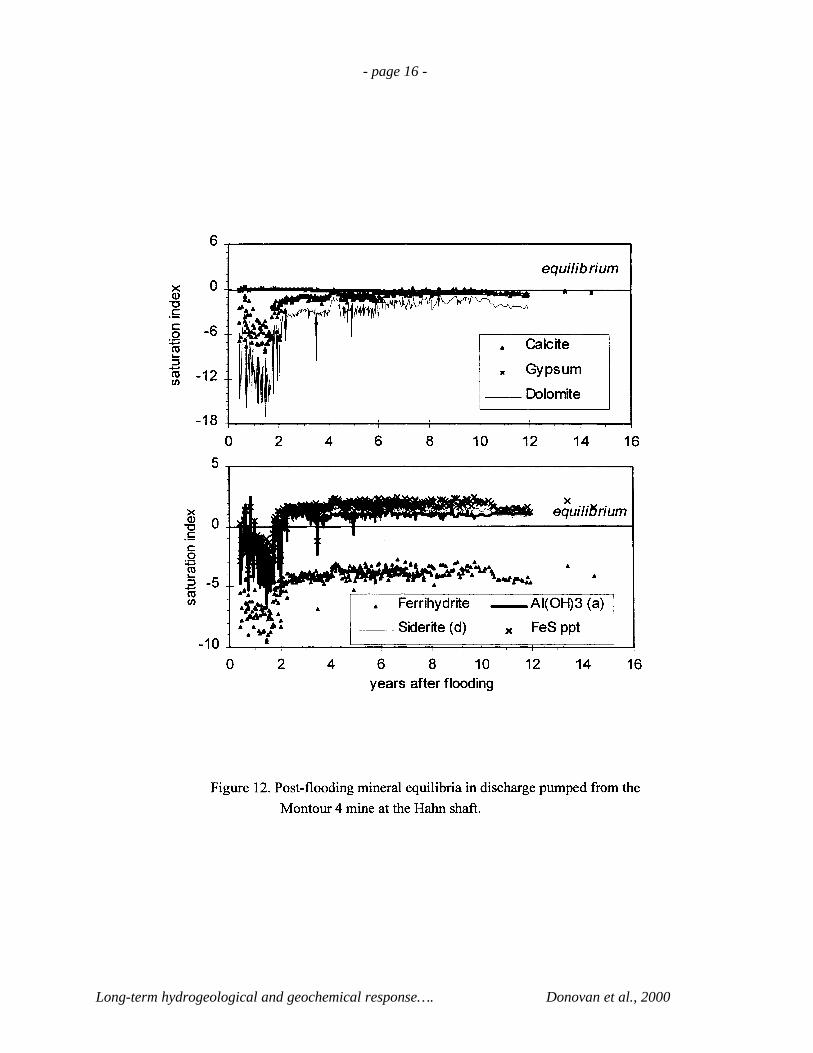
Figure 13 shows a comparison between the Montour discharge and that from Westland, a nearbyflooded Pittsburgh mine that was sampled from 1986-98. Westland is similar in geology, but a somewhatsmaller and shallower mine. It too was flooded to within 50 feet of overlying land surface. The plotcompares Fe, SO4, and TDS for the two mines.
The two mines are of very different salinities and acid-production rates, for reasons that are beyondthe scope of this paper. The observation may be made, however, that even though Fe and acidity aresubstantially different between the two otherwise similar mines, continued pumped discharge for 12-15years has induced virtually identical acidities and iron concentrations in these two discharges. Thisobservation suggests that there may be a long-term near-equilibrium state with respect to chemistry ofgroundwater discharge from below drainage mines. While the mechanisms for this observation are stillunder study, the implications would be that flooded below-drainage coal mines in the Pittsburgh coal –irrespective of early water chemistry – may all approach a similar state of net-alkaline, but iron-containing(<100 mg/L) chemistry, within one to two decades of continued discharge.
SUMMARY AND CONCLUSIONS
Flooding of below-drainage Pittsburgh coal mines is thought to occur in similar fashion for manymines. Influential factors are the geometry of the base of the coal, the depth below surface, and perimeterbarrier characteristics. The mine aquifer is extremely conductive, while barriers form vertical aquitards.The time frame for flooding in the Montour example was about 4 years. Many underground mines willrequire subsurface control to prevent surface discharge, as for Montour.
Water chemical time series of the Montour mine indicate that the first pore volume “flushed” fromthe mine was acidic and of low pH. Groundwater was under equilibrium control of gypsum solubility.However, by year 4, gypsum became undersaturated and a net alkaline groundwater at equilibrium withcalcite had evolved by year 7. Within 15 years, a strongly net-alkaline water, pH 6.5 to 7.0, had evolved,with Fe<70 mg/L.
Chemical evolution of mine discharge after flooding in Montour 4 displayed three distinct phases:
• PHASE I: an early low-pH phase of high acidity and iron, in which gypsum is at saturation and likelyprecipitating in the mine (years 0-3)
• PHASE II: a transitional period between Phase I and III (years 4-6)
• PHASE III: a late high-pH phase, in which gypsum becomes undersaturated, calcite approachesequilibrium from undersaturation (years 7-15) and most constituents gradually decline in concentration,including Fe and acidity
The residence time of the flooded mine (approximately 4.4 years) is slightly more than the durationof Phase I. By the time two residence times have elapsed, Phase III is underway and Fe
- page 18 -
Long-term hydrogeological and geochemical response…. Donovan et al., 2000
- page 19 -
Long-term hydrogeological and geochemical response…. Donovan et al., 2000
concentrations have attenuated to about 10-15% of their initial maximum concentrations. The rate ofdecline of iron is rather greater than that of Na, Mg, and Ca; the latter three are highly intercorrelated inconcentration.
The undersaturation of ferrihydrite suggests (within the limitations of the Eh assumption) that itsprecipitation is not a dominant iron removal process, due to oxygen limitations. Fe may, however, belimited in concentration by either siderite or iron sulfide precipitation; the kinetics of these reactions areuncertain and, in the presence of reducing bacteria, may be controlled by biological reactions. Theseconcentrations are quite low (<60 mg/L) after 15 years at Montour, but even under control of theseminerals, iron concentrations of >10 mg/L may continue for some long period.
Comparison to a similar nearby flooded mine that had not reached such high acidities suggests thatlong-term water chemistry may be relatively independent of the chemistry of early acidic groundwaterflushed from the mine during initial flooding.
ACKNOWLEDGMENTS
Chemical analyses were performed by Consol, Inc. This research was conducted under a grant from theUSEPA to the senior author.
REFERENCES CITED
Ball, J.W., and Nordstrom, D.K., 1991. User's manual for WATEQ4F, with revised thermodynamic database and test cases for calculating speciation of major, trace, and redox elements in natural waters.U.S. Geological Survey Open-File Report 91-0183, 193 pp.
Hobba, W. A., 1981, Effects of underground mining and mine collapse on hydrology of selected basins inWest Virginia. U.S. Geol. Survey RI-33, 72 p.
Parizek, R.R., and Ramani, R.V., 1996. Longwall coal mines: pre-mine monitoring and water supplyreplacement alternatives. Penn State Environmental Resources Research Institute, Final Report onLegislative Initiative Program 181-90-2658, 194 pp.
Peng, S. S., 1992, Surface Subsidence Engineering. Society for Mining, Metallurgy and Exploration,Littleton, Colorado, 161 pp.
Ruppert, L., Tewalt, S., and Bragg, L., 1997. Map showing areal extent of the Pittsburgh coal bed andhorizon and mined areas of the Pittsburgh coal bed in Pennsylvania, Ohio, West Virginia, andMaryland. U. S. Geological Survey Open File Report OFR96-280.
Schubert, J.P., 1980. Fracture-flow of groundwater in coal-bearing strata. In: Proceedings of theSymposium on Surface Mining Hydrology, Sedimentology and Reclamation (December 1-5, 1980),University of Kentucky, Lexington, KY, pp. 61-73.
Singh, M. M., and Kendorski, F. S., 1981, Strata Disturbance Prediction for Mining Beneath SurfaceWater and Waste Impoundments. Proceedings 1st Conference on Ground Control in Mining, WestVirginia University, Morgantown, WV, pp. 76-89.
Stoner, J.D., 1983, Probable hydrologic effects of subsurface mining. Ground Water Monitoring Review,Winter, v. 3, No. 1, pp. 128-137.