Embed Size (px)
Citation preview
Long-Term Contracts and Repeated Interaction:
Evidence from the Costa Rican Coffee Market
Kenneth S. Corts
Rotman School of Management
University of Toronto
Octavio Martinez
INCAE Business School
September 2017
Abstract: We use contract-level data from the Costa Rican coffee industry to explore the
relationship between formal and relational contracts—in particular, the relationship between
long-term contracting and repeated interaction. Long-term contracts may be useful in this
industry for many reasons, including price hedging, assurance of supply, and—especially in
the case of differentiated beans (those with a designation regarding sustainability or place of
origin)—to protect against hold-up when an exporter makes specific investments in
developing and marketing a blend of differentiated beans provided by a limited number of
mills. However, long-term contracts in this setting may be costly and difficult to enforce. As
a result, long-term contracts may be more effective and more attractive on balance (given that
they do come with costs of inflexibility) when employed between frequently contracting
parties who can use the power of relational contracting to improve the enforceability of the
long-term formal contract. The empirical analysis demonstrates that in fact more frequently
contracting firms are more likely—other things equal—to employ long-term contracts than
are infrequently contracting firms; this is especially so for differentiated beans. The result
persists when we address identification problems such as unobservable heterogeneity and
endogenous matching through fixed effects and instrumenting strategies. We interpret this as
evidence that relational contracting acts as a complement to formal contracting by improving
the enforceability of formal contracts.
Acknowledgements: We thank seminar participants at INSEAD, University of Paris I-Sorbonne, UC-
Davis, the 2016 International Industrial Organization Conference, and the 2016 Canadian Economics
Association Annual Meetings for helpful comments.
2
I. Introduction
Scholars in contract and organizational economics have long sought to understand the
relationship between explicit and implicit contracts. Both theoretical and empirical contributions
demonstrate that there can be an interactive effect—that is, that the frequency of contracting and
the power of implicit contracting supported by repeated game considerations may have
consequences for the formal contracts chosen by contracting parties. This literature explores a
variety of mechanisms, explicit contract features, and settings, and shows that the devil is in the
details. Implicit and explicit contracts are neither always complements (where repeated
interaction supports use of stronger formal contracting practices) nor always substitutes (where
repeated interaction obviates the need for stronger formal contracting and instead replaces it).
The effect can go either way, depending on the mechanism, the contracting hazards, and the
particulars of the setting. A subsequent draft will expand significantly on both the theoretical and
empirical literatures that address these questions.
We explore this classic question specifically with respect to the choice of length of the
formal contract: does implicit contracting lead to longer or shorter explicit contracts? We provide
a theoretical model that shows why we might reasonably expect a relationship of complements in
this case, especially when formal contract enforceability is imperfect: implicit contracting can
help to mitigate the temptation to renege on a long-term contract, thereby making it worthwhile
to go to the expense of writing formal long-term contracts. We also present empirical evidence
from the Costa Rican coffee market to show that this pattern is in fact present in this market.
Moreover, the empirical results withstand a variety of empirical strategies for addressing omitted
variable bias, endogenous matching of buyers and sellers, and other empirical challenges.
This paper contributes to the literature on the interaction between implicit and explicit
contracting by focusing specifically on contract length, an aspect of formal contracts not
previously highlighted in this literature, and by bringing to these questions a novel dataset that
has many compelling features. These include the granularity of the observations; the large
number of players and incidence of multi-transaction and multi-partner players (allowing robust
use of fixed effects); and the existence of parallel, related markets in which the same players
contract, allowing an exploration of economic linkages across markets.
II. Theoretical Considerations
3
Long-term contracts may have a variety of benefits for the trading partners. They may
allow the contracting firms to ensure supply of a raw material for a buyer, ensure demand for an
output for a seller, enable economizing on various logistics and transportation costs by creating
predictability in volumes, serve to hedge price risk, and so on. They may also encourage the
firms to make specific investments in a joint output that would not be made absent the contract
because of concerns of ex post hold-up.
Whatever the benefits provided, a long-term contract also imposes a variety of costs on
the firms. These include the ex ante forecasting, planning, negotiating, legal, and other costs
incurred at the outset in writing the contract. In addition, abiding by the long-term contract may
have ex post costs in periods when more favorable trading opportunities arise, which must be
foregone in order to honor the long-term contract. To be meaningful, a long-term contract must
provide some incentive to forego these opportunities to increase profits by reneging on the long-
term contract. These incentives may arise from breach penalties when contracts are enforceable
by formal means or from loss of future gains from trade when the contract is enforced through
the logic of repeated contracting or implicit contracts.
The benefits of the formal long-term contract are realized exclusively when and if the
contract is honored. The costs, in contrast, are to a large extent incurred up front in the writing
and negotiating of the contract. As a result, two important intertemporal linkages arise. First, a
long-term contract is likely to be attractive today only if it is expected to be honored in a future
period. Second, absent strong, low-cost contract enforcement, such a long-term contract is likely
to be honored in that future period only if the promise of additional gains in periods still further
in the future are sufficient reward for abiding by the contract in periods when reneging is short-
term profitable. Thus, repeated interaction in this case may sustain through an implicit contract
mechanism the reliability or enforceability of an explicit long-term contract, allowing the
advantageous long-term contract to be written with confidence that it will be honored. This is
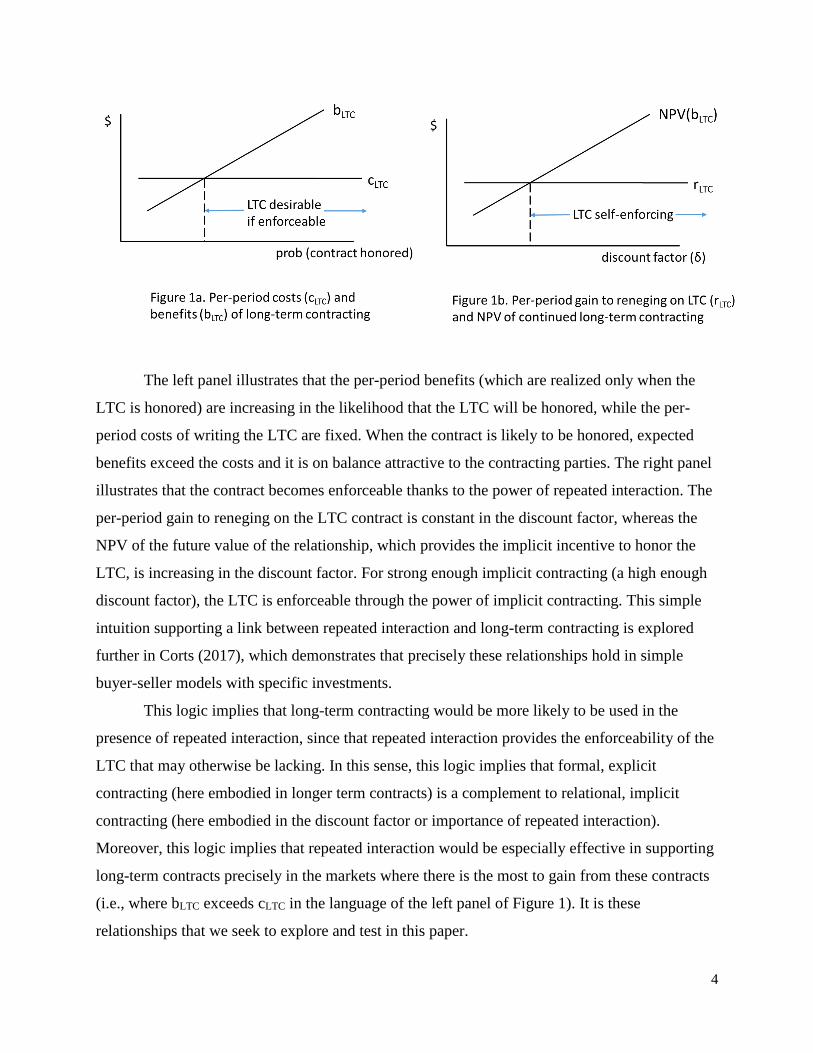
portrayed intuitively in Figure 1.
4
The left panel illustrates that the per-period benefits (which are realized only when the
LTC is honored) are increasing in the likelihood that the LTC will be honored, while the per-
period costs of writing the LTC are fixed. When the contract is likely to be honored, expected
benefits exceed the costs and it is on balance attractive to the contracting parties. The right panel
illustrates that the contract becomes enforceable thanks to the power of repeated interaction. The
per-period gain to reneging on the LTC contract is constant in the discount factor, whereas the
NPV of the future value of the relationship, which provides the implicit incentive to honor the
LTC, is increasing in the discount factor. For strong enough implicit contracting (a high enough
discount factor), the LTC is enforceable through the power of implicit contracting. This simple
intuition supporting a link between repeated interaction and long-term contracting is explored
further in Corts (2017), which demonstrates that precisely these relationships hold in simple
buyer-seller models with specific investments.
This logic implies that long-term contracting would be more likely to be used in the
presence of repeated interaction, since that repeated interaction provides the enforceability of the
LTC that may otherwise be lacking. In this sense, this logic implies that formal, explicit
contracting (here embodied in longer term contracts) is a complement to relational, implicit
contracting (here embodied in the discount factor or importance of repeated interaction).
Moreover, this logic implies that repeated interaction would be especially effective in supporting
long-term contracts precisely in the markets where there is the most to gain from these contracts
(i.e., where bLTC exceeds cLTC in the language of the left panel of Figure 1). It is these
relationships that we seek to explore and test in this paper.
5
III. Institutional Setting
The coffee bean industry in Costa Rica is comprised of three sets of vertically-related
players: growers (more than 50,000), mills (more than 200), and exporters (more than 50).
Growers are the producers of the raw agricultural output, coffee cherries. Coffee cherries are
delivered to mills, which remove the pulp of the cherries and wash and dry the coffee beans;
these minimally processed beans are then sold as inputs to exporters. The exporters are
specialized intermediaries between the local industry and international buyers, which are
primarily coffee roasters and coffee traders in importing nations. The exporters purchase coffee
beans from different mills to create both branded and non-branded blends that they sell to
international buyers.1
The “Instituto de Café” (ICAFE), the coffee industry supervisory board in Costa Rica,
was established to monitor the relationship between actors in the industry in order to verify that
upstream actors receive a “fair share” of the value created in the value chain. While mills and
exporters negotiate the conditions for each transaction bilaterally without the intervention of
ICAFE, they must submit their contracts to the ICAFE in a standardized form for final approval.
The transacting parties typically negotiate a unit price in terms of a basis plus a
differential. The Intercontinental Exchange (ICE) Futures U.S. Coffee “C” Contract provides the
price basis, which constitutes the greatest portion of the unit price. The differential is a positive
or negative value negotiated bilaterally depending on the attributes of the coffee under exchange.
The role of ICAFE is to verify that the price negotiated in each contract meets a reasonable
minimum level according to the prevailing market conditions to prevent excessive shifting of
rents downstream. In practice, the rejection of a proposed contract is an extraordinarily rare
occurrence.
Until 2001, all coffee produced in Costa Rica was treated as a homogeneous input. This
model did not provide strong incentives for industry participants to invest in the quality attributes
and sustainability standards that an emerging and rapidly growing segment of the developing
coffee market was starting to demand. In 2002, facing the “Coffee Crisis” with coffee beans at
their lowest real prices in 100 years, and with the opportunity to tap into this new market
1 This institutional setting and dataset are described and developed more fully in a previous paper
by one of the authors (Martinez, 2015).
6
segment, ICAFE established a new program to stimulate the production of coffee with
differentiated attributes. The program entailed significant changes in the operation of both
growers and mills. To participate in the market for “differentiated” beans, growers had to meet
strict quality standards, adhere to sustainable farming practices, and/or come from defined and
protected geographic origins. Mills also had to invest in new production lines dedicated
exclusively to the processing of the differentiated coffee cherries. Finally, pricing for
“differentiated” coffee diverged from that of the “standard” product, reflecting the differing
values of these inputs to the downstream actors, and creating a mechanism by which growers and
mills could recoup investments in meeting the strict standards for differentiated beans.
ICAFE almost implements a standardized quality classification scheme across both
standard and differentiated beans. This quality classification scheme classifies coffee beans along
three dimensions: bean type, quality grade, and preparation. Bean type encompasses eight
categories based on a grower’s geographic location and agro-climatic conditions. Quality grade
identifies seven different grade levels, based on the density of parchment coffee. Finally,
preparation comprises six different sub-categories based on the tolerance of physical defects for
the coffee beans ready for sale.
Exporters may procure coffee beans through some combination of spot market
transactions, forward contracts, ongoing (multi-delivery) long-term contracts, and vertical
integration with investment in milling facilities of their own. The selection of sourcing strategy is
a crucial decision, especially in the case of differentiated beans since these beans are specialized
and scarce, with the aggregate of these fragmented segments together accounting for only 22%
of sales in the market. Exporters need to be able to ensure a supply of beans of appropriate types
in order to meet their ongoing obligations to their customers, to meet market demand, and to
protect their specific investments in developing and marketing differentiated blends against hold-
up.
However, each sourcing strategy is imperfect and comes with costs. Long-term contracts
and vertical integration can seemingly stabilize supply, but these strategies come with
inflexibility and costs of their own. Long-term contracts may not be perfectly or costlessly
enforceable when shocks in coffee demand and supply create incentives to renege. Moreover,
ICAFE allows mills to cancel contracts when they do not have enough coffee to honor their
agreement and for exceptional causes assessed by the board. While vertical integration
7
presumably involves fewer contracting hazards, vertically integrated exporters may face
inflexible supply with insufficient processing capacity in the face of high demand realizations.
Moreover, they may find it difficult to develop and sustain long-term relations with independent
mills precisely because the mills know that integrated exporters will prefer the certainty of their
internal supply in the future (Macchiavello & Miquel-Florensa, 2016).
IV. Data
Our data come from the “Instituto de Café (ICAFE),” the industry supervisory board in
Costa Rica. The board compiles this information to monitor the transactions between industry
participants. The dataset contains the universe of forward and term contracts negotiated between
all mills and exporters between October 1st, 2007, and September 30th, 2012, comprising five
“crop years” extending from October 1 of one year to September 30 of the following year. The
dataset excludes contracts between processing mills and local roasters, which represent about 10
percent of the total volume produced in the country. There are 12,769 contracts in the dataset,
between 114 exporters and 197 processing mills, governing the trade of 379,000 metric tons
(MT) of coffee beans with a total contract value of US$1.47 billion over the 5-year period. Out
of these, 2,811 contracts concern beans in the differentiated market (72,000 MT worth US$0.29
billion).
Our interest is in the arm’s length transactions between independent mills and exporters.
For a host of reasons, the contracting practices of partially vertically integrated firms may be
complex and subject to different considerations from those that determine the choices made by
independent firms engaged in arm’s length contracting. In order to be conservative with respect
to the influence of such firms on our results, we eliminate from our dataset every transaction
involving either a buyer or seller who is partially vertically integrated (that is, engages in a
transaction, even once during our sample period, in which the buyer and seller have common
ownership). Thus, the dataset we employ contains only contracts in which both firms are truly
independent arm’s length contractors for all of their demand or supply. The resulting dataset
contains 8083 contracts between 70 buyers (exporters) and 179 sellers (mills).
The unit of analysis of this study is the contract, as the fundamental question we ask is
whether contract duration is influenced by relational contracting (i.e., repeated interaction
between pairs of buyers and sellers). A contract in this industry is a standardized document that
8
specifies the transacting parties; price; quantity; market (standard or differentiated); bean type,
quality, and preparation; signing date; and date of delivery (date of final delivery if the contract
involves multiple deliveries). From this, it is straightforward to construct the variables of interest.
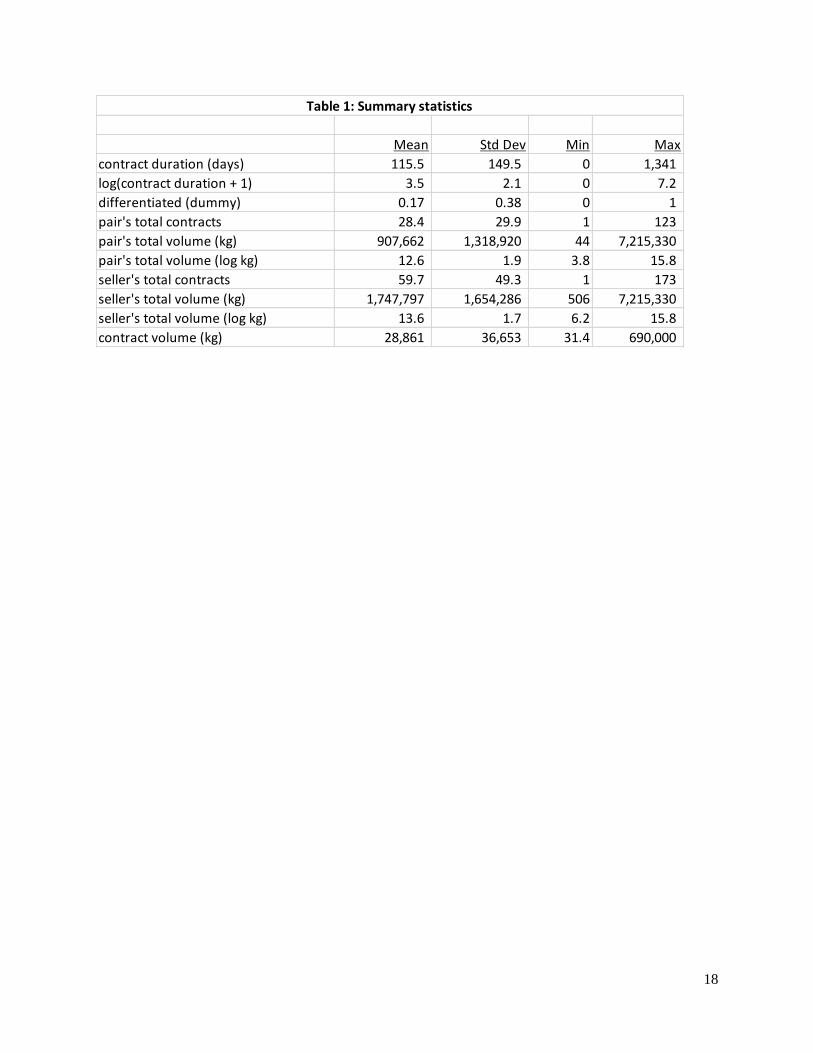
Summary statistics for these variables are presented in Table 1.
The average duration of a contract is 115 days (median 65 days). The vast majority of
contracts (95%) are a year or shorter, and a 25% of the contracts are essentially spot contracts
with a week or less elapsing between signing and delivery. The average number of contracts
between parties that make at least one transaction with each other in a crop season is 6.1
contracts (median 2 contracts). One third of contracts are one-off contracts—that is, situations in
which the contracting pair engages in only that one contract in a given crop year (these firms
typically have other contracts in that same crop year, but no other contracts with the same
counterparty).
To give a sense of the relative size of the players in the industry, it is useful to consider
some summary statistics (these and all subsequent statistics refer only to our set of firms that do
not engage in vertically integrated transactions). It may be tempting, especially given the
historical motivations for the creation of ICAFE, to think of this market as characterized by very
large exporters that one might reasonably expect to be more powerful and more sophisticated
than very small mills. However, it is important to remember that mills are not the growers, but
rather are cooperative or commercial enterprises of some scale. In addition, once one excludes
the vertically integrated exporters, the remaining independent exporters are for the most part not
enormous multinational agribusiness enterprises.
Exporters are on average less numerous and larger than mills. However, the differences
are not overwhelming. Each year, there are between 36 and 44 exporters buying from between
114 and 136 mills. Exporters average 42 contracts a year, totalling 1,200,000 MT and $4.6m,
while mills average 18 contracts a year, totalling 519,000 MT and $1.4m.
In addition, it is important to get a sense of the extent to which buyers and sellers interact
in a larger marketplace. In our sample (excluding transactions involving vertically integrated
firms), a mill on average contracts with 3.3 different exporters to move its product in a given
crop year, while an exporter on average contracts with 24.9 mills to procure its raw materials in a
given crop year.
9
V. Econometric Approach
As described in section II, the central empirical question we seek to answer is whether
repeated interaction affects the use of explicit long-term contracts. We posit that repeated
interaction will have this affect, as predicted by the model of section II. Such a model makes two
main, related predictions. First, repeated interaction will lead to greater use of long-term
contracts. Second, this should be especially true for classes of transactions (in our setting, those
involving differentiated beans) that we expect to reap especially large benefits from long-term
contracts when enforceable.
In order to answer these questions, we will first assess correlations of contract length and
contracting frequency and explore how this varies by bean type. However, we identify a number
of reasons that this correlation might arise spuriously, as result of measurement concerns or as a
result of endogenous matching of contracting parties. We explore a variety of techniques to
attempt address these concerns and identify the effect of interest based on underlying exogenous
variation.
Regression model structure
All our regression models share a basic structure. In all cases the unit of observation is
the contract, and the dependent variable is log(contract duration). In addition, all models include
as regressors a measure of contracting frequency, a measure of seller scale, contract volume, and
fixed effects for buyer-year, bean quality, bean preparation, and bean type. Contracting
frequency is measured in two ways: (1) as the count of contracts between a buyer-seller pair in a
given year, and (2) as the log of the aggregate volume of all contracts between the pair in a given
year. When the “count” measure is used, the measure of seller scale is the corresponding count
measure (seller # contracts). When the “aggregate volume” measurement of contracting
frequency is used, the measure of seller scale is the corresponding seller volume measure. Both
the pair’s aggregate contract volume and the seller’s annual contract volume are logged.
For reasons described below, we also include specifications in which the contracting
frequency measure (in both its count and volume versions) is separated into two components. In
this case the count (or volume) of standard bean contracts is measured and included as a
regressor separately from the count (or volume) of differentiated bean contracts.
Measurement concerns
10
Simple variable definitions and measurement concerns could induce spurious correlations
in contracting frequency and contract length in several ways. Perhaps the simplest problem is
that unobserved buyer or seller characteristics could affect both variables of interest, inducing
spurious correlation as a result of omitted variable bias. For example, it is possible that the
largest buyers both sign the most contracts and deal in the bean types most at risk from hold-up
related to specific investments, leading them to have more contracts with all sellers and to use
longer-term contracts to address contracting hazards (thereby inducing a spurious positive
correlation between contracting frequency and contract length). To address this, all specifications
include fixed effects for buyers (or alternative, more granular fixed effects that subsume these)
and a measure of seller scale (or, in some cases, seller fixed effects).
A second concern is that there exists a mechanical connection between contract
frequency and contract length. For example if for some unobservable reason a firm chooses to
use only short contracts (and holding contract volume fixed), the firm will certainly need to
engage in more contracts to achieve any given level of aggregate volume—that is, if one uses
only short-term contracts (of a given size), one will need to use more of them (to reach a given
aggregate volume). This in general would create a mechanical and spurious negative correlation
between contracting frequency and contract length. Note that this would bias the results against
our hypothesized finding. We employ two strategies for addressing this. First, we conduct all our
analysis using two separate measures of contracting frequency. One is based on the number of
contracts (which could be subject to the problems just described); the other is based on the
aggregate volume of contracts, which would not be subject to this spurious mechanical linkage.
Second, we examine the linkage of contracting frequency and contract length across bean types.
That is, we assess in the data whether a pair’s increased contracting frequency in standard beans
affects that pair’s contract length in contracts governing differentiated beans. The increased
contracting frequency in a different bean type should affect the strength of the implicit contract
and affect enforceability of contract’s in the other bean type, but it should not affect contract
length in the other bean type in the mechanical way just described.
Endogenous matching
The empirical contracting literature pays special attention to the spurious correlation
between contacting party characteristics and contract form that can arise as a result of
endogenous matching. In a seminal paper on the subject, Ackerberg and Botticini (2002) study
11
an example in which riskier crops appear to be grown under contract forms that leave growers
more exposed to risk and less insured by wealthy landowners in Renaissance Italy. They show
that this can be explained as the result of the riskier crops being matched with wealthier growers
who were less in need of insurance from landowners. That is, the problematic transaction is
endogenously matched both to particular agents and to particular contract forms. They
demonstrate a technique for addressing this problem, which was later also employed by Corts
and Singh (2004) in the context of offshore drilling contracts, in which instrumental variables
techniques are used to identify exogenous variation in agent characteristics at the contract level
(subject to endogenous matching) based on the characteristics of potential agents at a more
aggregate level (not subject to exogenous matching). This is also the technique we employ in this
paper. Since the approach is well-established, we review it only briefly here.
The problem in our context would arise if, for example, a buyer who worked with a
particular type of differentiated bean decided that to address the inherent contracting hazards it
needed both to use a long-term contract and to buy its beans primarily (and frequently) from the
most reputable seller. In this case, the contracting frequency with this seller is not exogenous
variation at all. Rather, it is correlated with unobserved contract characteristics that led to the use
of the long-term contract; the correlation between contracting frequency and contract length is
again spurious, in effect as a result of omitted variables correlated with both buyer characteristics
and contract length.
The solution presented by the Ackerberg and Botticini (2002) paper is to instrument for
contracting frequency of a realized buyer-seller pair with the characteristics of the pool of
alternative sellers that the buyer could plausibly have considered. In Ackerberg and Botticini’s
(2002) and Corts and Singh’s (2004) implementations of this technique, geographical proximity
is used to identify potential trading partners. In the present paper, we use proximity in product
space (that is, sellers also offering beans that are similar in quality, type, and preparation) to
construct the variables representing characteristics of potential trading partners that are used to
instrument for the contracting frequency of the realized trading pair. Specifically, for each
contract, we identify as potential sellers all sellers who are party to at least one contract in this
bean category (same type, quality, preparation, differentiation). For the specific buyer involved
in this contract, we then compute the number of contracts (or aggregate volume of contracts)
between each of these potential sellers. This measure of contracting intensity is then averaged
12
across these potential sellers to create the instrumental variable reflecting the average
relationship characteristics of the potential sellers, which is then used to instrument for the
characteristics of the observed buyer-seller pair.
One can think of this endogenous matching problem in the following way. Consider a
contract between buyer i and seller j of bean type k in period t. The contract length for this
transaction (Lijkt) depends on characteristics of the buyer, seller, bean type, and the buyer-seller
pair (specifically, their contracting frequency or the power of the implicit contract between
them—call this Rijkt), as well as an error that contains factors such as unobservable transaction
characteristics. At the same time, Rijkt (the contracting frequency with the chosen trading partner)
is determined by characteristics of the transaction, the buyer, and the contract length, as well as
an error that contains factors such as unobservable transaction characteristics (eijkt). The goal of
this approach is to instrument for Rijkt with variables that do not contain that error eijkt. There are
several logical possibilities. The one already described focuses on the “j” (the identity of the
seller); the IV strategy described uses characteristics of other sellers (“-j”) that would help to
determine Rijkt but not because of anything specifically to do with seller “j”.
There are two other ways that we (more partially) address this endogenous matching
concern. One approach is to focus on the “k”—that is, the bean type, standard or differentiated.
The frequency of pairwise contracting in one bean type (“-k”) may have an effect on choice of
contract length for bean type “k” while at the same time being unlikely to reflect unobserved
characteristics of the transaction in another bean type “k” (it may still of course reflect
unobservable seller or buyer-seller pair characteristics). We explore these cross-effects in which
contracting frequency in one bean type may affect the contract length for the other bean type.
The other approach is to focus on the “t”—that is, the time period. The logic in this case
is that the frequency of pairwise contracting in one period (“-t”) may have an effect on contract
choice in period “t” while at the same time being unlikely to reflect unobserved characteristics of
transactions in that period “t” (though it could still reflect unobservable seller or buyer-seller pair
characteristics).
These latter two alternatives may seem to be weaker solutions than the IV strategy
relying on characteristics of potential trading partners. However, both of these latter two
approaches push the concern back onto buyer and seller (rather than transaction-level)
13
unobservables, which are more easily addressed through the more stringent fixed-effects
specifications presented in the results section.
VI. Results
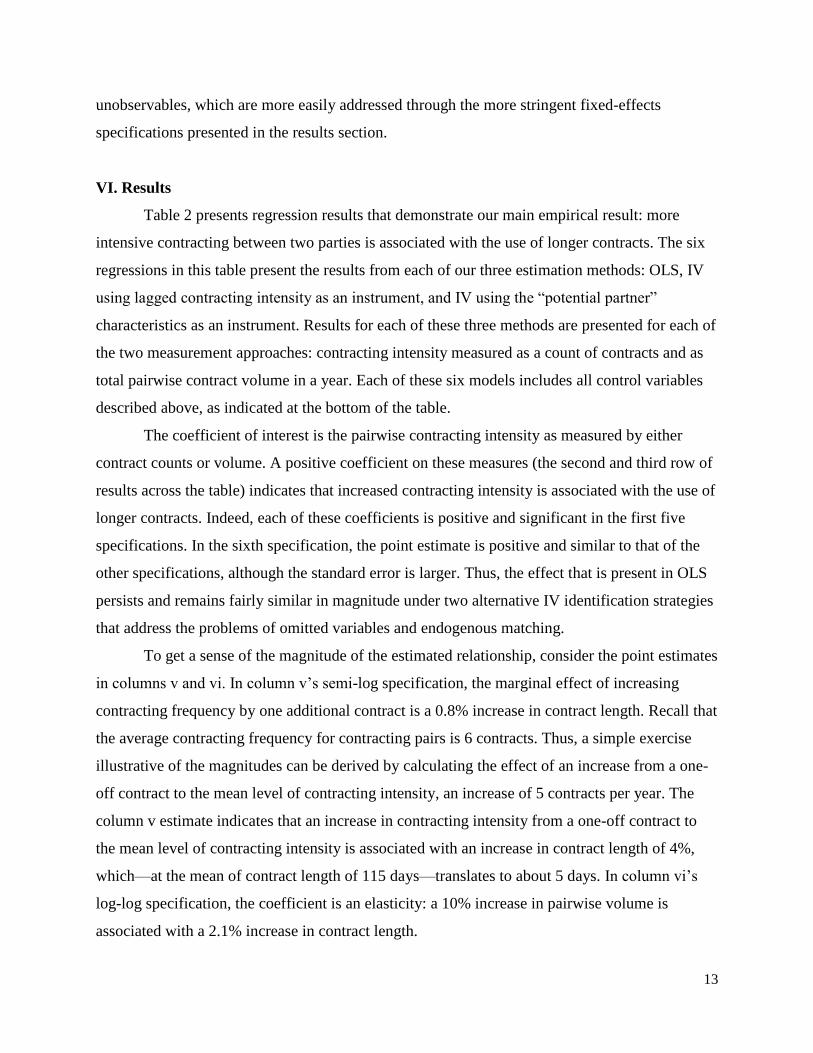
Table 2 presents regression results that demonstrate our main empirical result: more
intensive contracting between two parties is associated with the use of longer contracts. The six
regressions in this table present the results from each of our three estimation methods: OLS, IV
using lagged contracting intensity as an instrument, and IV using the “potential partner”
characteristics as an instrument. Results for each of these three methods are presented for each of
the two measurement approaches: contracting intensity measured as a count of contracts and as
total pairwise contract volume in a year. Each of these six models includes all control variables
described above, as indicated at the bottom of the table.
The coefficient of interest is the pairwise contracting intensity as measured by either
contract counts or volume. A positive coefficient on these measures (the second and third row of
results across the table) indicates that increased contracting intensity is associated with the use of
longer contracts. Indeed, each of these coefficients is positive and significant in the first five
specifications. In the sixth specification, the point estimate is positive and similar to that of the
other specifications, although the standard error is larger. Thus, the effect that is present in OLS
persists and remains fairly similar in magnitude under two alternative IV identification strategies
that address the problems of omitted variables and endogenous matching.
To get a sense of the magnitude of the estimated relationship, consider the point estimates
in columns v and vi. In column v’s semi-log specification, the marginal effect of increasing
contracting frequency by one additional contract is a 0.8% increase in contract length. Recall that
the average contracting frequency for contracting pairs is 6 contracts. Thus, a simple exercise
illustrative of the magnitudes can be derived by calculating the effect of an increase from a one-
off contract to the mean level of contracting intensity, an increase of 5 contracts per year. The
column v estimate indicates that an increase in contracting intensity from a one-off contract to
the mean level of contracting intensity is associated with an increase in contract length of 4%,
which—at the mean of contract length of 115 days—translates to about 5 days. In column vi’s
log-log specification, the coefficient is an elasticity: a 10% increase in pairwise volume is
associated with a 2.1% increase in contract length.
14
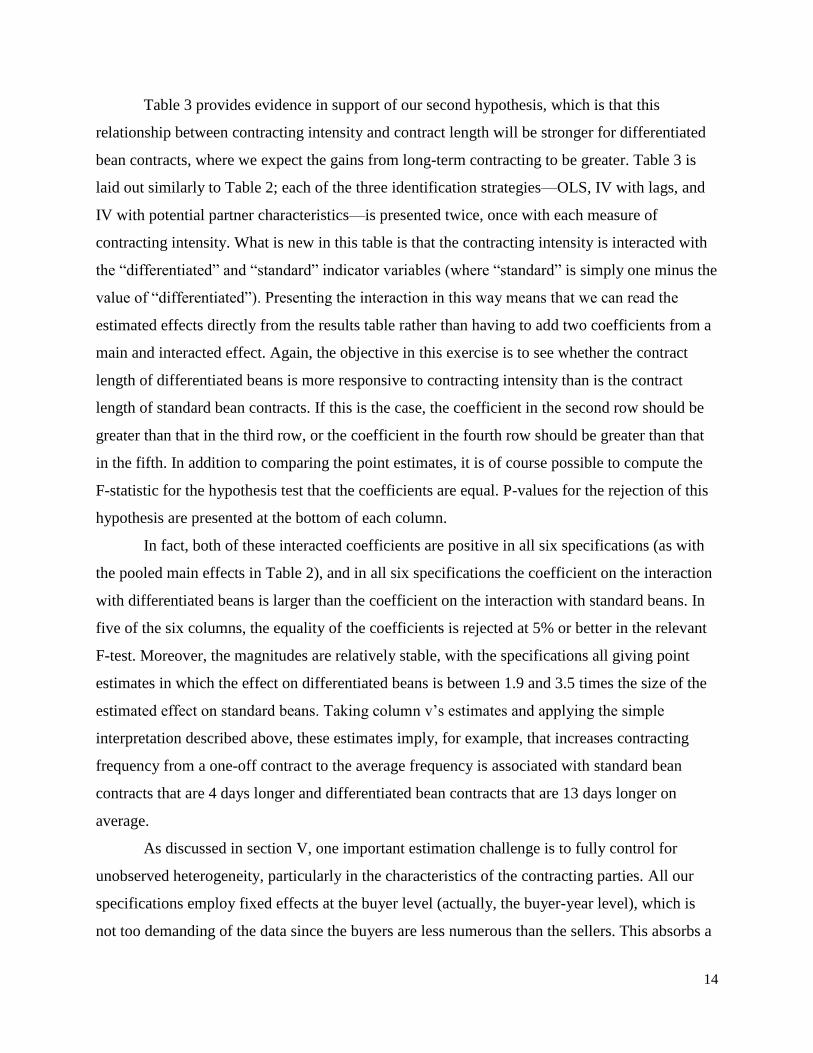
Table 3 provides evidence in support of our second hypothesis, which is that this
relationship between contracting intensity and contract length will be stronger for differentiated
bean contracts, where we expect the gains from long-term contracting to be greater. Table 3 is
laid out similarly to Table 2; each of the three identification strategies—OLS, IV with lags, and
IV with potential partner characteristics—is presented twice, once with each measure of
contracting intensity. What is new in this table is that the contracting intensity is interacted with
the “differentiated” and “standard” indicator variables (where “standard” is simply one minus the
value of “differentiated”). Presenting the interaction in this way means that we can read the
estimated effects directly from the results table rather than having to add two coefficients from a
main and interacted effect. Again, the objective in this exercise is to see whether the contract
length of differentiated beans is more responsive to contracting intensity than is the contract
length of standard bean contracts. If this is the case, the coefficient in the second row should be
greater than that in the third row, or the coefficient in the fourth row should be greater than that
in the fifth. In addition to comparing the point estimates, it is of course possible to compute the
F-statistic for the hypothesis test that the coefficients are equal. P-values for the rejection of this
hypothesis are presented at the bottom of each column.
In fact, both of these interacted coefficients are positive in all six specifications (as with
the pooled main effects in Table 2), and in all six specifications the coefficient on the interaction
with differentiated beans is larger than the coefficient on the interaction with standard beans. In
five of the six columns, the equality of the coefficients is rejected at 5% or better in the relevant
F-test. Moreover, the magnitudes are relatively stable, with the specifications all giving point
estimates in which the effect on differentiated beans is between 1.9 and 3.5 times the size of the
estimated effect on standard beans. Taking column v’s estimates and applying the simple
interpretation described above, these estimates imply, for example, that increases contracting
frequency from a one-off contract to the average frequency is associated with standard bean
contracts that are 4 days longer and differentiated bean contracts that are 13 days longer on
average.
As discussed in section V, one important estimation challenge is to fully control for
unobserved heterogeneity, particularly in the characteristics of the contracting parties. All our
specifications employ fixed effects at the buyer level (actually, the buyer-year level), which is
not too demanding of the data since the buyers are less numerous than the sellers. This absorbs a
15
great deal of unobserved buyer heterogeneity. While all specifications also include some kind of
control for seller scale, this is a much coarser control for seller characteristics, and one might
reasonably worry that unobserved seller heterogeneity remains an important concern.
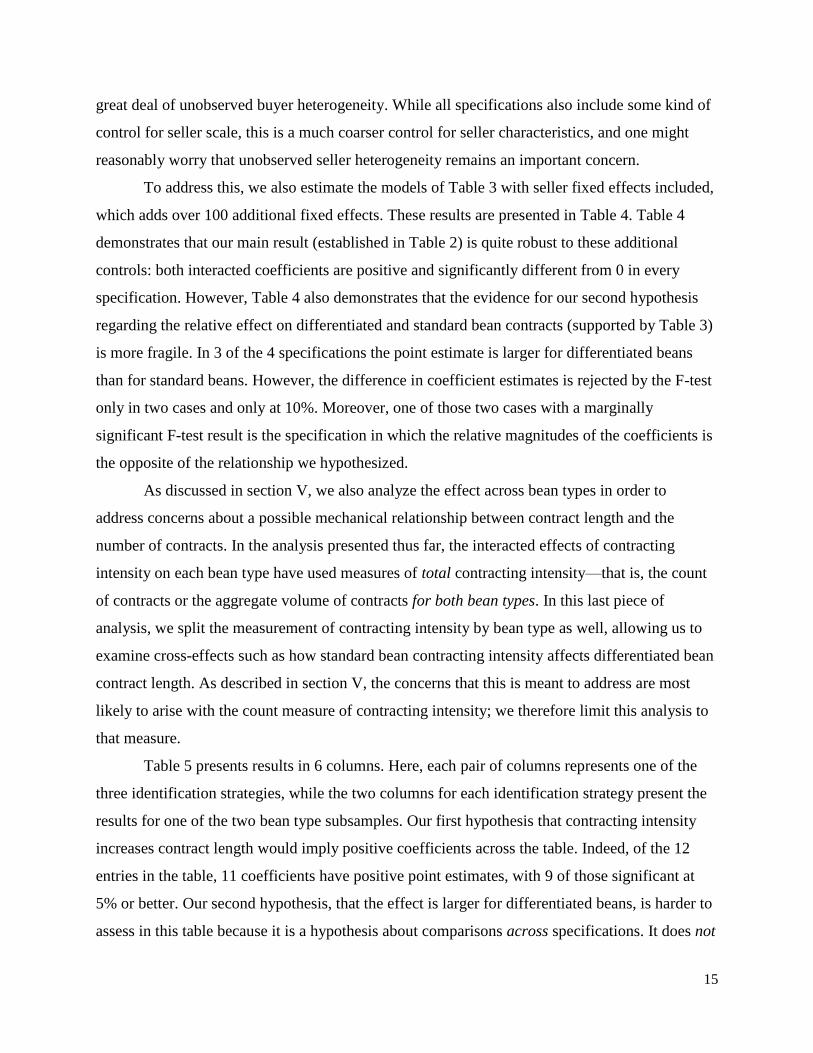
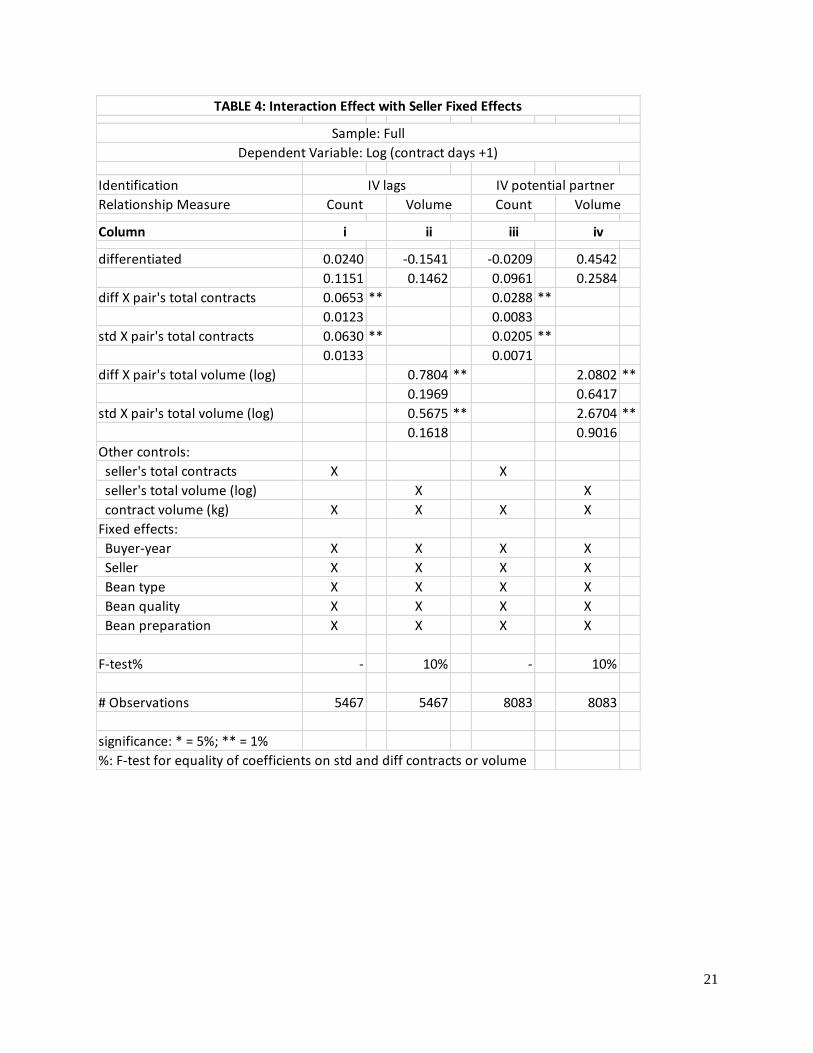
To address this, we also estimate the models of Table 3 with seller fixed effects included,
which adds over 100 additional fixed effects. These results are presented in Table 4. Table 4
demonstrates that our main result (established in Table 2) is quite robust to these additional
controls: both interacted coefficients are positive and significantly different from 0 in every
specification. However, Table 4 also demonstrates that the evidence for our second hypothesis
regarding the relative effect on differentiated and standard bean contracts (supported by Table 3)
is more fragile. In 3 of the 4 specifications the point estimate is larger for differentiated beans
than for standard beans. However, the difference in coefficient estimates is rejected by the F-test
only in two cases and only at 10%. Moreover, one of those two cases with a marginally
significant F-test result is the specification in which the relative magnitudes of the coefficients is
the opposite of the relationship we hypothesized.
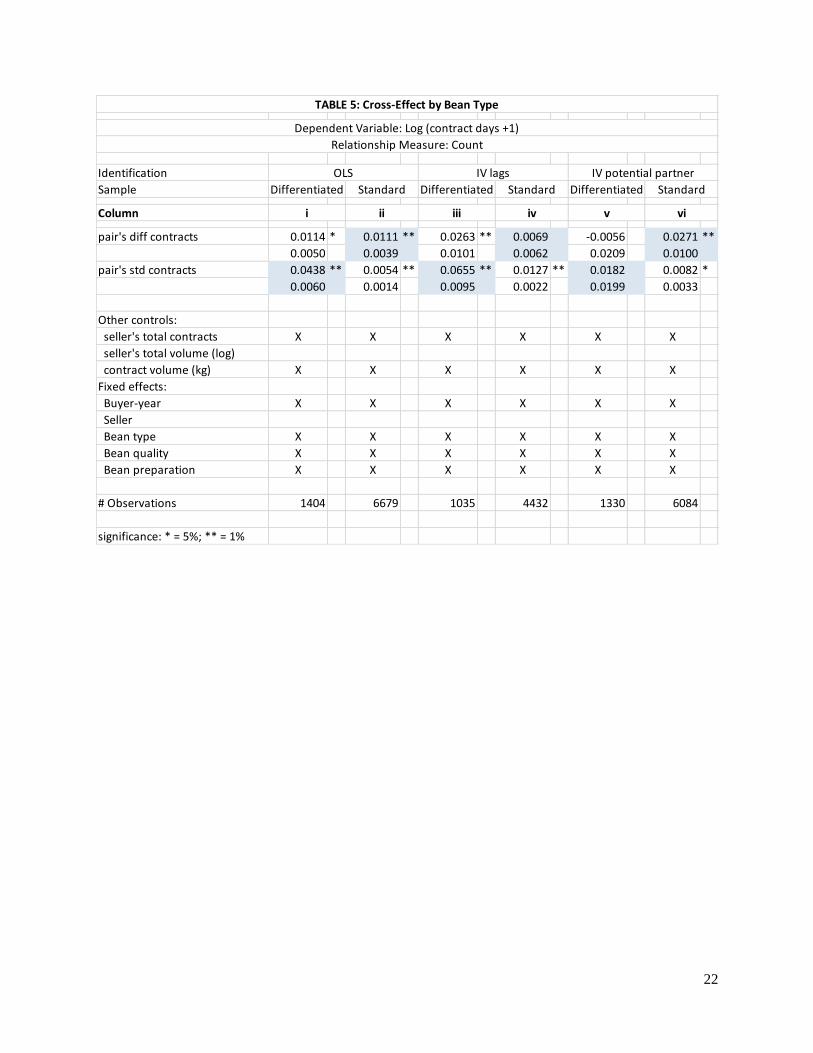
As discussed in section V, we also analyze the effect across bean types in order to
address concerns about a possible mechanical relationship between contract length and the
number of contracts. In the analysis presented thus far, the interacted effects of contracting
intensity on each bean type have used measures of total contracting intensity—that is, the count
of contracts or the aggregate volume of contracts for both bean types. In this last piece of
analysis, we split the measurement of contracting intensity by bean type as well, allowing us to
examine cross-effects such as how standard bean contracting intensity affects differentiated bean
contract length. As described in section V, the concerns that this is meant to address are most
likely to arise with the count measure of contracting intensity; we therefore limit this analysis to
that measure.
Table 5 presents results in 6 columns. Here, each pair of columns represents one of the
three identification strategies, while the two columns for each identification strategy present the
results for one of the two bean type subsamples. Our first hypothesis that contracting intensity
increases contract length would imply positive coefficients across the table. Indeed, of the 12
entries in the table, 11 coefficients have positive point estimates, with 9 of those significant at
5% or better. Our second hypothesis, that the effect is larger for differentiated beans, is harder to
assess in this table because it is a hypothesis about comparisons across specifications. It does not
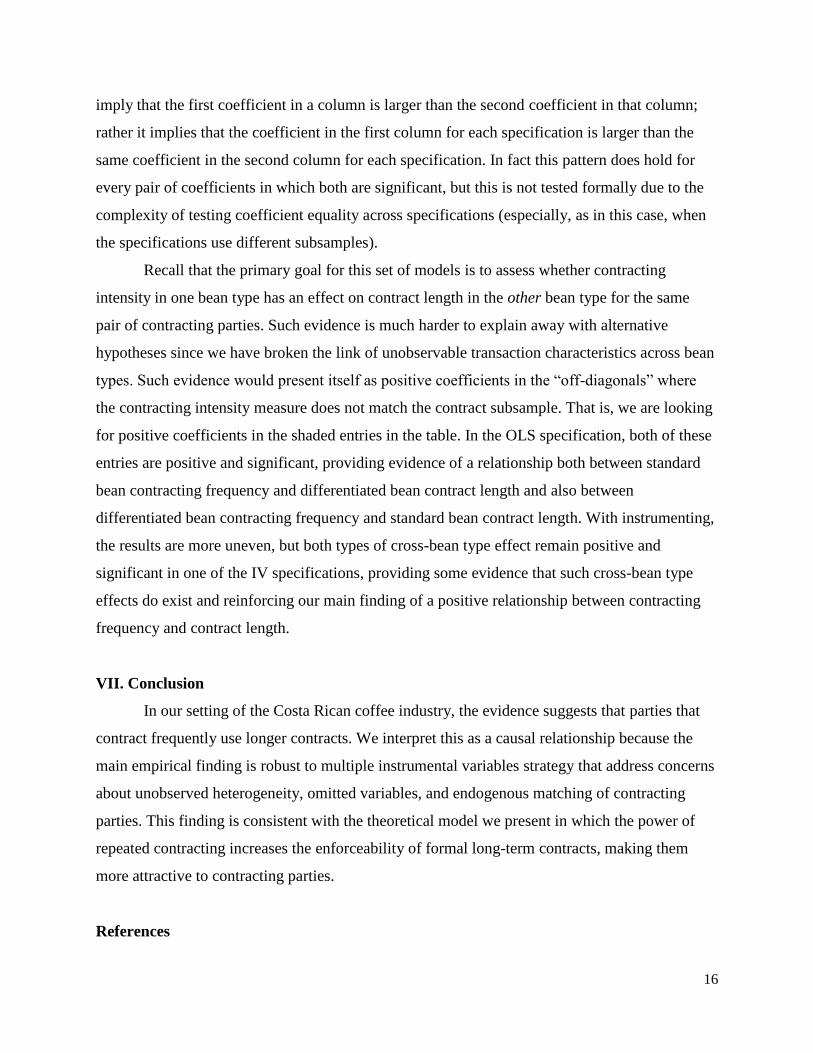
16
imply that the first coefficient in a column is larger than the second coefficient in that column;
rather it implies that the coefficient in the first column for each specification is larger than the
same coefficient in the second column for each specification. In fact this pattern does hold for
every pair of coefficients in which both are significant, but this is not tested formally due to the
complexity of testing coefficient equality across specifications (especially, as in this case, when
the specifications use different subsamples).
Recall that the primary goal for this set of models is to assess whether contracting
intensity in one bean type has an effect on contract length in the other bean type for the same
pair of contracting parties. Such evidence is much harder to explain away with alternative
hypotheses since we have broken the link of unobservable transaction characteristics across bean
types. Such evidence would present itself as positive coefficients in the “off-diagonals” where
the contracting intensity measure does not match the contract subsample. That is, we are looking
for positive coefficients in the shaded entries in the table. In the OLS specification, both of these
entries are positive and significant, providing evidence of a relationship both between standard
bean contracting frequency and differentiated bean contract length and also between
differentiated bean contracting frequency and standard bean contract length. With instrumenting,
the results are more uneven, but both types of cross-bean type effect remain positive and
significant in one of the IV specifications, providing some evidence that such cross-bean type
effects do exist and reinforcing our main finding of a positive relationship between contracting
frequency and contract length.
VII. Conclusion
In our setting of the Costa Rican coffee industry, the evidence suggests that parties that
contract frequently use longer contracts. We interpret this as a causal relationship because the
main empirical finding is robust to multiple instrumental variables strategy that address concerns
about unobserved heterogeneity, omitted variables, and endogenous matching of contracting
parties. This finding is consistent with the theoretical model we present in which the power of
repeated contracting increases the enforceability of formal long-term contracts, making them
more attractive to contracting parties.
References
17
Ackerberg, D. and M. Botticini, 2002, “Endogenous Matching and the Empirical Determinants
of Contract Form,” Journal of Political Economy 110, 564-591.
Corts, K., 2017, “The Interaction of Repeated and Long-Term Contracting,” working paper.
Corts, K. and J. Singh, 2004, “The Effect of Repeated Interaction on Contract Choice: Evidence
from Offshore Drilling,” Journal of Law, Economics, and Organization 20, 230-260.
Macchiavello, R, and Miquel-Florensa, F., 2016, “Vertical Integration and Relational Contracts:
Evidence from the Costa Rica Coffee Chain,” Working Paper.
Martinez, O., 2015, “Market Competition and Vertical Contracting: Evidence from the Trade of
Coffee Beans,” Academy of Management Proceedings (Meeting Abstract Supplement).
Osorio, N., 2002, “The global coffee crisis: A threat to sustainable development,” World Summit
on Sustainable Development, Johannesburg.
18
Mean Std Dev Min Max
contract duration (days) 115.5 149.5 0 1,341
log(contract duration + 1) 3.5 2.1 0 7.2
differentiated (dummy) 0.17 0.38 0 1
pair's total contracts 28.4 29.9 1 123
pair's total volume (kg) 907,662 1,318,920 44 7,215,330
pair's total volume (log kg) 12.6 1.9 3.8 15.8
seller's total contracts 59.7 49.3 1 173
seller's total volume (kg) 1,747,797 1,654,286 506 7,215,330
seller's total volume (log kg) 13.6 1.7 6.2 15.8
contract volume (kg) 28,861 36,653 31.4 690,000
Table 1: Summary statistics
19
Identification
Relationship Measure
Column
differentiated 0.0062 0.0385 -0.0734 -0.0396 -0.0023 0.0212
0.0572 0.0572 0.0688 0.0693 0.0592 0.0676
pair's total contracts 0.0079 ** 0.0131 ** 0.0079 **
0.0012 0.0021 0.0028
pair's total volume (log) 0.2780 ** 0.2838 ** 0.2122
0.0248 0.0605 0.2062
Other controls:
seller's total contracts X X X
seller's total volume (log) X X X
contract volume (kg) X X X X X X
Fixed effects:
Buyer-year X X X X X X
Seller
Bean type X X X X X X
Bean quality X X X X X X
Bean preparation X X X X X X
# Observations 8083 8083 5467 5467 7414 7414
significance: * = 5%; ** = 1%
IV potential partner
Sample: Full
Count Volume
i ii iii iv v vi
Count Volume Count Volume
OLS IV lags
TABLE 2: Main Effect
Dependent Variable: Log (contract days +1)
20
Identification
Relationship Measure
Column
differentiated -0.0317 -0.0905 0.1499 -0.4492 ** -0.0423 -0.2034
0.0578 0.0644 0.1032 0.1070 0.0611 0.1053
diff X pair's total contracts 0.0159 ** 0.0264 ** 0.0224 **
0.0022 0.0035 0.0061
std X pair's total contracts 0.0063 ** 0.0115 ** 0.0066 *
0.0012 0.0021 0.0029
diff X pair's total volume (log) 0.4658 ** 0.7778 ** 0.6989 **
0.0497 0.1241 0.2155
std X pair's total volume (log) 0.2463 ** 0.2306 ** 0.1994
0.0258 0.0598 0.2074
Other controls:
seller's total contracts X X X
seller's total volume (log) X X X
contract volume (kg) X X X X X X
Fixed effects:
Buyer-year X X X X X X
Seller
Bean type X X X X X X
Bean quality X X X X X X
Bean preparation X X X X X X
F-test% 1% 1% 1% 1% 10% 5%
# Observations 8083 8083 5467 5467 7414 7414
significance: * = 5%; ** = 1%
%: F-test for equality of coefficients on std and diff contracts or volume
i ii iii iv v vi
Dependent Variable: Log (contract days +1)
OLS IV lags IV potential partner
Count Volume Count Volume Count Volume
TABLE 3: Interaction Effect
Sample: Full
21
Identification
Relationship Measure
Column
differentiated 0.0240 -0.1541 -0.0209 0.4542
0.1151 0.1462 0.0961 0.2584
diff X pair's total contracts 0.0653 ** 0.0288 **
0.0123 0.0083
std X pair's total contracts 0.0630 ** 0.0205 **
0.0133 0.0071
diff X pair's total volume (log) 0.7804 ** 2.0802 **
0.1969 0.6417
std X pair's total volume (log) 0.5675 ** 2.6704 **
0.1618 0.9016
Other controls:
seller's total contracts X X
seller's total volume (log) X X
contract volume (kg) X X X X
Fixed effects:
Buyer-year X X X X
Seller X X X X
Bean type X X X X
Bean quality X X X X
Bean preparation X X X X
F-test% - 10% - 10%
# Observations 5467 5467 8083 8083
significance: * = 5%; ** = 1%
%: F-test for equality of coefficients on std and diff contracts or volume
i ii iii iv
Dependent Variable: Log (contract days +1)
IV lags IV potential partner
Count Volume Count Volume
TABLE 4: Interaction Effect with Seller Fixed Effects
Sample: Full
22
Identification
Sample Differentiated Differentiated Differentiated
Column
pair's diff contracts 0.0114 * 0.0111 ** 0.0263 ** 0.0069 -0.0056 0.0271 **
0.0050 0.0039 0.0101 0.0062 0.0209 0.0100
pair's std contracts 0.0438 ** 0.0054 ** 0.0655 ** 0.0127 ** 0.0182 0.0082 *
0.0060 0.0014 0.0095 0.0022 0.0199 0.0033
Other controls:
seller's total contracts X X X X X X
seller's total volume (log)
contract volume (kg) X X X X X X
Fixed effects:
Buyer-year X X X X X X
Seller
Bean type X X X X X X
Bean quality X X X X X X
Bean preparation X X X X X X
# Observations 1404 6679 1035 4432 1330 6084
significance: * = 5%; ** = 1%
Relationship Measure: Count
IV lags IV potential partner
Standard
v vi
TABLE 5: Cross-Effect by Bean Type
Dependent Variable: Log (contract days +1)
i ii iii iv
Standard Standard
OLS