Embed Size (px)
Citation preview

Long-term Cardiovascular Effects of 4.9 Years of Intensive Blood Pressure Control in
Type 2 Diabetes Mellitus: The Action to Control Cardiovascular Risk in Diabetes Follow-On Blood Pressure Study
(ACCORDION)
William C. Cushman, MD, FACP, FAHA Veterans Affairs Medical Center, Memphis, TNGregory W. Evans, MA Wake Forest School of Medicine, Winston-Salem, NCJeffrey A. Cutler, MD, MPH, National Heart, Lung and Blood Institute, Bethesda, MD
For The ACCORD/ACCORDION Study Group

Disclosure
William C. Cushman, MD, reports receiving institutional grant support from NHLBI/NIH, Eli Lilly, and Merck, and participating in uncompensated consulting for Takeda.
Gregory W. Evans, MA, and Jeffrey A. Cutler, MD, MPH, report no conflicts to disclose.

ACCORD Study Design
• Independently tested 3 strategies to reduce CVD in diabetic patients
• BP question: does a therapeutic strategy targeting systolic blood pressure (SBP) <120 mm Hg reduce CVD events compared to a strategy targeting SBP <140 mm Hg in patients with Type 2 diabetes mellitus (T2DM) at elevated risk for CVD events?
• Primary outcome was a composite of CVD death, non-fatal MI and non-fatal stroke adjudicated by a blinded M&M committee
• BP Trial randomized 4733 participants at 77 sites in US & Canada
Cushman WC et al. Am J Cardiol. (2007)

ACCORD BP Trial Eligibility
• Stable Type 2 Diabetes >3 months
• HbA1c 7.5% to 11% (or <9% if on more meds)• High CVD risk = clinical or subclinical disease or >2 risk factors • Age (limited to <80 years after Vanguard)
≥ 40 yrs with history of clinical CVD (secondary prevention)≥ 55 yrs otherwise
• Systolic blood pressure130 to 160 mm Hg (if on 0-3 meds)161 to 170 mm Hg (if on 0-2 meds)171 to 180 mm Hg (if on 0-1 meds)
• Urine protein <1.0 gm/24 hours or equivalent • Serum Creatinine <1.5 mg/dl
Cushman WC et al. Am J Cardiol. (2007)

ACCORD Double 2 x 2 Factorial Design

ACCORD BP Trial Results
• With an average follow-up of 4.7 years, the ACCORD BP Trial found a non-significant reduction in major CVD events (HR=0.88, p=0.20, 95% CI 0.73-1.06).
• Two pre-specified secondary outcomes, non-fatal stroke (HR=0.63, p=0.03, 95% CI 0.41-0.96) and total stroke (HR=0.59, p=0.01, 95% CI 0.39-0.89), showed significant reductions that were consistent with other BP treatment trials.
• Post-hoc analysis suggested that intensive BP or intensive glycemiatreatment alone improved major CVD outcomes by 26% compared with combined standard treatment. There was, however, no additional benefit from combining the two intensive therapies.
Cushman et al, NEJM (2010) Margolis et al, Diabetes Care (2014)

ACCORDION BP
• 3957 (87%) surviving ACCORD BP Participants consented to post-trial follow-up of up to 60 months
• Phone or clinic contacts every 6 months for CVD event follow-up
• 3 clinic visits 24-30 months, 36-48 months, and 54-60 months after trial close-out
• Event classification based on clinician interpretation of medical records, without adjudication
• Analyses used intent to treat approach that included all randomized participants.
• Time until first event after randomization
• Participants who declined or died of non-CVD causes were censored as of the last date data were available.

ACCORD BP Baseline Characteristics vs. Participation in Post-trial Follow-up
ACCORD(N=4733)
Not ContributingPost-trial(N=776)
ContributingPost-trial(N=3957) P-value
Age (yrs) 62 + 7 64 + 8 62 + 7 <0.001
Female (%) 48 49 47 0.40
Non-Hispanic White (%) 59 53 60 <0.001
Secondary Prevention (%) 34 45 31 <0.001
Systolic BP (mm Hg) 139 + 16 140 + 17 139 + 16 0.03
Diastolic BP (mm Hg 76 + 10 75 + 11 76 + 10 0.03
HbA1c (%) 8.3 + 1.1 8.5 + 1.2 8.3 + 1.1 <0.001
Values are % or Mean + SD

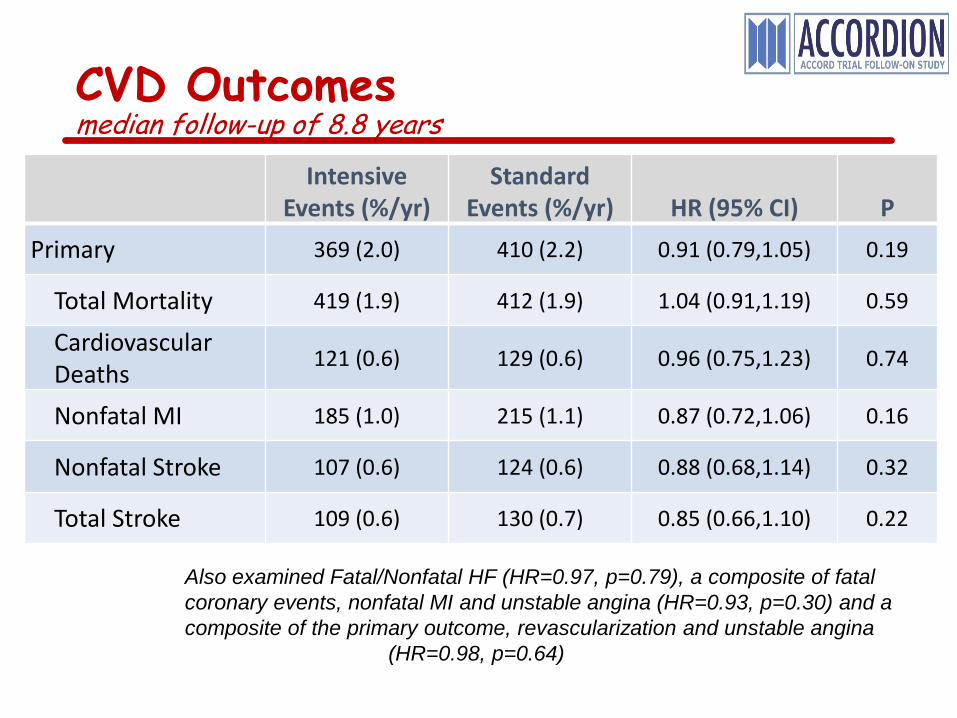
CVD Outcomesmedian follow-up of 8.8 years
Intensive Events (%/yr)
StandardEvents (%/yr) HR (95% CI) P
Primary 369 (2.0) 410 (2.2) 0.91 (0.79,1.05) 0.19
Total Mortality 419 (1.9) 412 (1.9) 1.04 (0.91,1.19) 0.59
CardiovascularDeaths 121 (0.6) 129 (0.6) 0.96 (0.75,1.23) 0.74
Nonfatal MI 185 (1.0) 215 (1.1) 0.87 (0.72,1.06) 0.16
Nonfatal Stroke 107 (0.6) 124 (0.6) 0.88 (0.68,1.14) 0.32
Total Stroke 109 (0.6) 130 (0.7) 0.85 (0.66,1.10) 0.22
Also examined Fatal/Nonfatal HF (HR=0.97, p=0.79), a composite of fatal coronary events, nonfatal MI and unstable angina (HR=0.93, p=0.30) and a composite of the primary outcome, revascularization and unstable angina
(HR=0.98, p=0.64)


Primary Outcome by Pre-defined Subgroups
Also examined DBP tertiles (p=0.16), HbA1c (p=21) and number of screening meds (p=0.31)

ACCORDION BP Conclusions
• In patients with T2DM at increased CV risk, 4.9 years of intensive BP lowering did not reduce the rate of a composite of fatal and non-fatal major CV events or mortality over a median follow-up of 8.8 years.
• However, with long term follow-up, a significant interaction between BP and glycemia interventions was observed, with evidence of benefit for intensive BP lowering in participants randomized to standard glycemia therapy (HR=0.79, 95% CI 0.65 – 0.96).
• The stroke benefit observed during the active intervention did not persist after BP differences waned. This finding adds evidence that the BP-stroke relationship observed during ACCORD was real.

Primary Outcome: Non-fatal MI, non-fatal Stroke or CVD Death
HR=0.91 (0.79, 1.05)P=0.19

Stroke: Fatal or Non-fatal
HR=0.85 (0.68, 1.10)P=0.22

Comparison of ACCORD vs. ACCORDION Results
Outcome
Trial(4.9 years follow-up)
Trial + Post-trial (8.8 years follow-up)
Intensive Rate
(%/year)
StandardRate
(%/year)
Hazard Ratio
(95% CI)
Intensive Rate
(%/year)
StandardRate
(%/year)
Hazard Ratio
(95% CI)
Primary 2.00 2.230.90
(0.75,1.07) 2.03 2.220.91
(0.79,1.05)
Total Mortality 1.30 1.21
1.09 (0.87,1.37) 1.94 1.88
1.04 (0.91,1.19)
CVD Mortality 0.51 0.42
1.23 (0.84,1.80) 0.56 0.59
0.96(0.75,1.23)
Nonfatal MI 1.15 1.34
0.84 (0.67,1.07) 1.01 1.14
0.87 (0.72,1.06)
Total Stroke 0.47 0.67
0.70 (0.49,0.99) 0.58 0.67
0.85 (0.66,1.10)

Trial vs. Post-trial Periods Fit as Time Dependent Covariates
Outcome Trial Post Trial InteractionP-value
Intensive Events
StandardEvents
HR(95% CI)
Intensive Events
StandardEvents
HR(95% CI)
Primary 222 2520.90
(0.75, 1.08) 147 1580.94
(0.75, 1.17) 0.78
Total Mortality 150 1441.11
(0.88, 1.38) 270 2691.00
(0.84,1.18) 0.47
CardiovascularDeaths 59 50
1.22 (0.84,1.78) 62 79
0.80 (0.57,1.11) 0.09
Nonfatal MI 128 1530.84
(0.67,1.07) 58 620.94
(0.66,1.34) 0.64
Nonfatal Stroke 52 730.73
(0.51,1.04) 55 511.08
(0.74,1.59) 0.14
Total Stroke 53 780.70
(0.84,1.13) 56 521.03
(0.87,1.22) 0.09