Embed Size (px)
DESCRIPTION
Long term calorie restriction in humans. John O. Holloszy. MD Division of Geriatrics and Nutritional Sciences. Primary Aging – The inevitable deterioration in structure and function of cells and tissues with advancing age. - PowerPoint PPT Presentation
Citation preview

Long term calorie restriction in humans
John O. Holloszy. MD
Division of Geriatrics and Nutritional Sciences
Primary Aging – The inevitable deterioration in structure and function of
cells and tissues with advancing age.
Secondary Aging – The deterioration in structure and function of cells and tissues caused by diseases, trauma and lifestyle factors and, therefore, at least partially
preventable.

Life-expectancy
vs.
Life Span
Primary aging rate determines life span.
Life span and rate of primary aging are determined by genetics but can,
to some extent, be modified.
Acute diseases and secondary aging determine life expectancy.
Genetic make up plays a major role in determining rate of secondary aging and
life expectancy.
However, it is possible to powerfully protect against secondary aging and extend life expectancy by means of
healthy life-style, changes in environment, and medical interventions.
Aging is the result of: a) failure of maintenance/repair mechanisms to completely protect against damage b) failure of repair mechanisms to completely repair damage
leading to
accumulation of cell/tissue damage and a progressive decline in structure and function with eventually, failure/death.
The rate of aging is determined by the balance between accumulating damage and maintenance/repair mechanisms. (There are more than 100 genes that
regulate detection and repair of damage to DNA.)
Factors involved in mediating cell/tissue damage
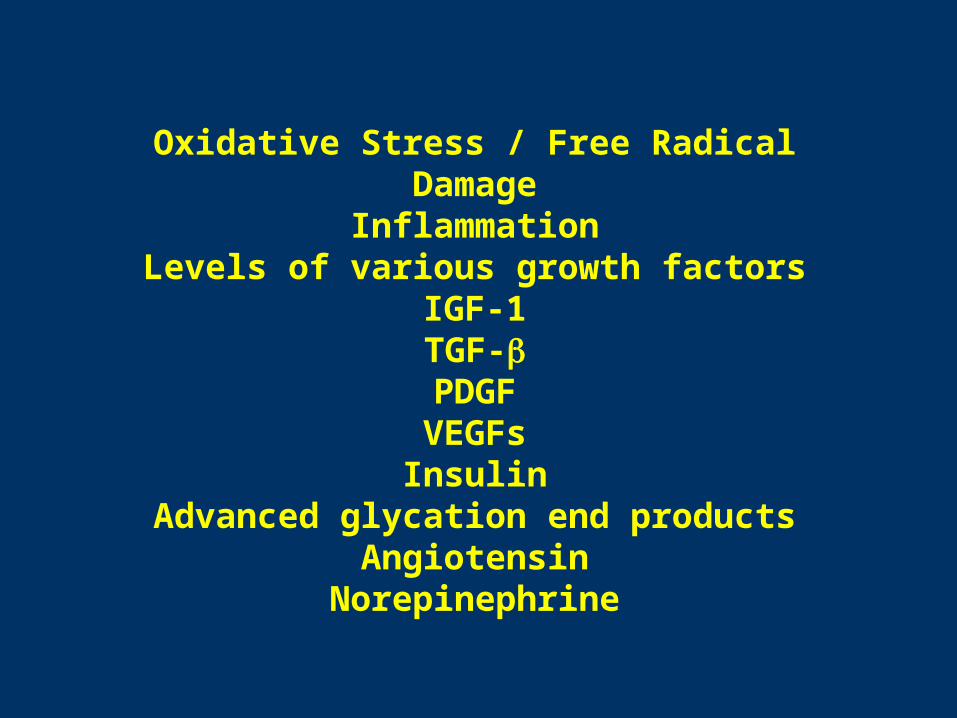
Oxidative Stress / Free Radical DamageInflammation
Levels of various growth factorsIGF-1TGF-PDGFVEGFsInsulin
Advanced glycation end productsAngiotensin
Norepinephrine
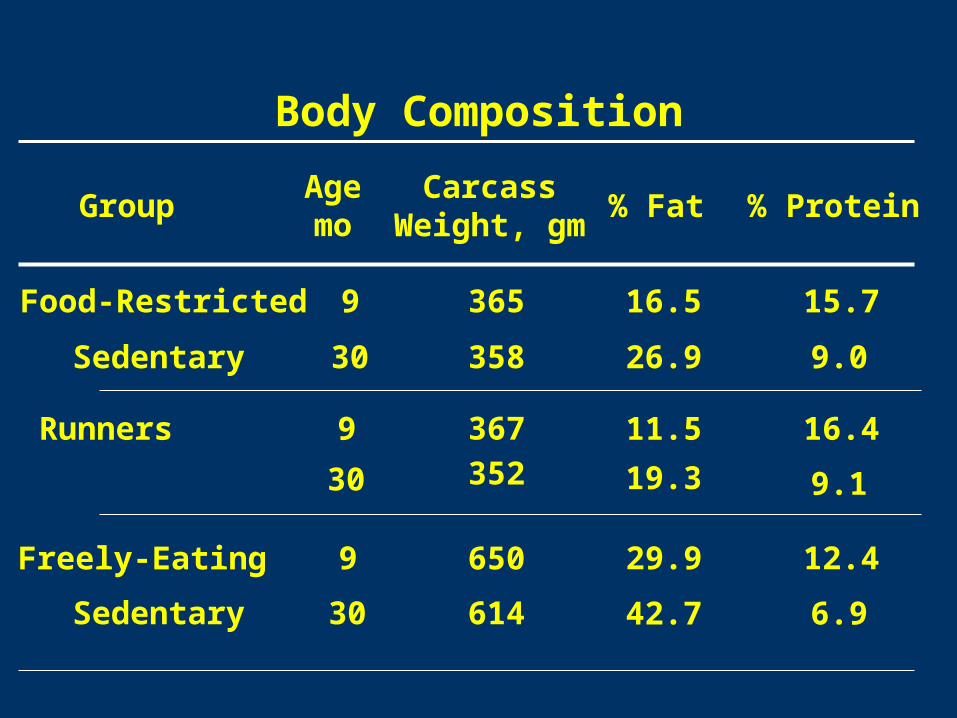
Body Composition
GroupAgemo
CarcassWeight, gm
% Fat % Protein
Food-Restricted
Sedentary
Runners
Freely-Eating
Sedentary
9
30
9
30
9
30
365
358
16.5
26.9
15.7
9.0
367
352
11.5
19.3
16.4
9.1
650
614
29.9
42.7
12.4
6.9

Food intake of male wheel runners
Age Periodmo
FESedentary
Runners PWSedentary
PFSedentary
Food intake, g
19-28
9-18
29-32
26.7 25.0 17.8 24.0
23.7 22.6 17.6 22.0
20.6 21.3 17.2 20.3
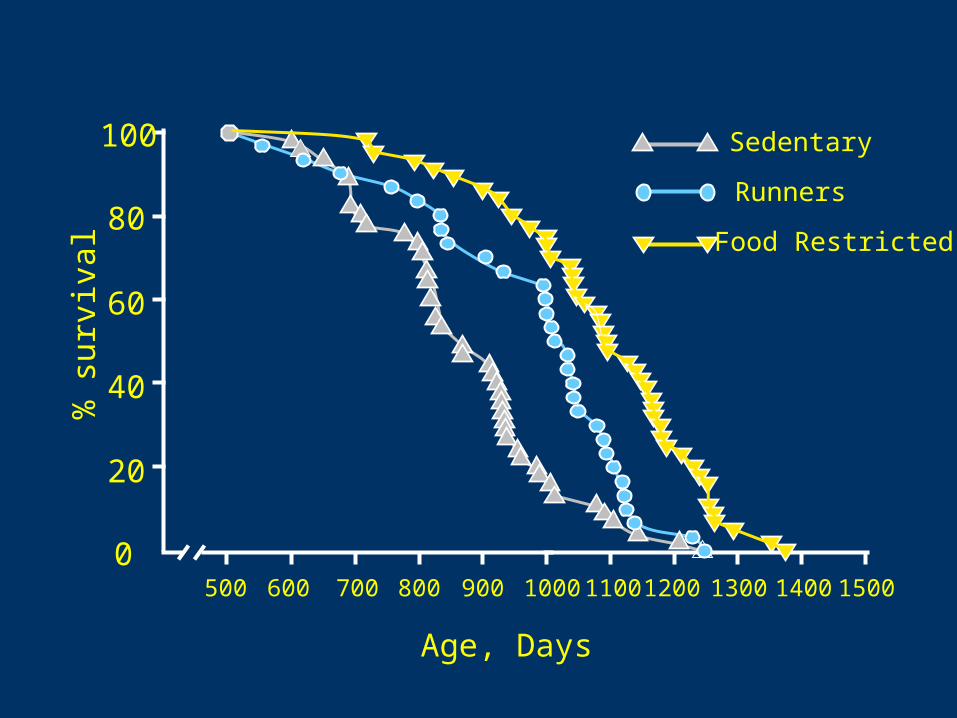
500
% s
urvi
val
100
20
60
Age, Days
80
40
600 700 800 900 1000 1100 1200 1300 1400 15000
Sedentary
Runners
Food Restricted
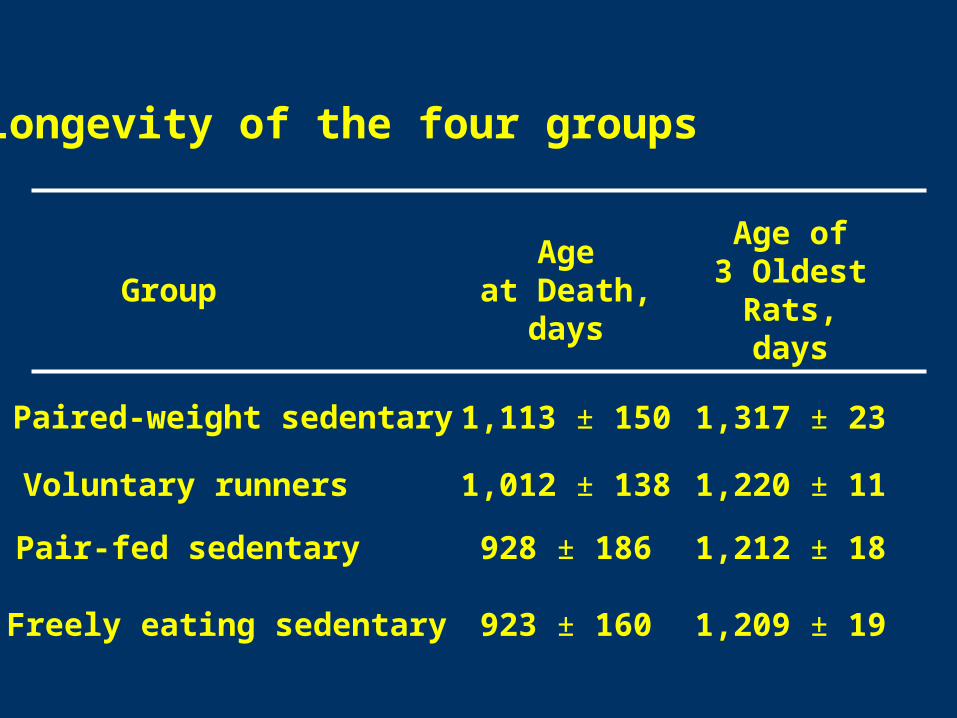
Longevity of the four groups
GroupAge
at Death,days
Age of3 Oldest
Rats,days
Paired-weight sedentary
Voluntary runners
Pair-fed sedentary
Freely eating sedentary
1,113 ± 150
1,012 ± 138
928 ± 186
923 ± 160
1,317 ± 23
1,220 ± 11
1,212 ± 18
1,209 ± 19
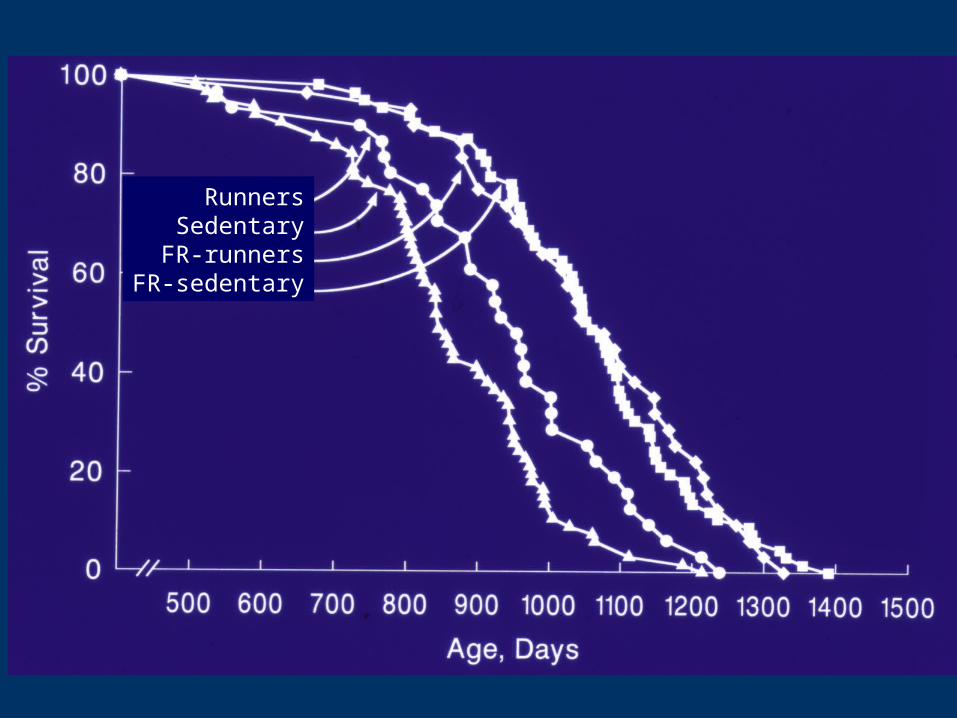
RunnersSedentaryFR-runners
FR-sedentary

Diastolic blood pressure (mmHg)
Systolic blood pressure (mmHg)
Truncal fat (%)
Total body fat (%)
Body mass index (kg/m2)
Male:female
63 ± 7†81 ± 9
103 ± 12†130 ± 13
4.6 ± 5.7†23.4 ± 9.7
8.4 ± 7†23.1 ± 1 7
19.6 ± 1.6†24.8 ± 3.2
29:429:4
51.4 ± 1252.3 ± 10Age (y)
Caloric RestrictionWestern Diet
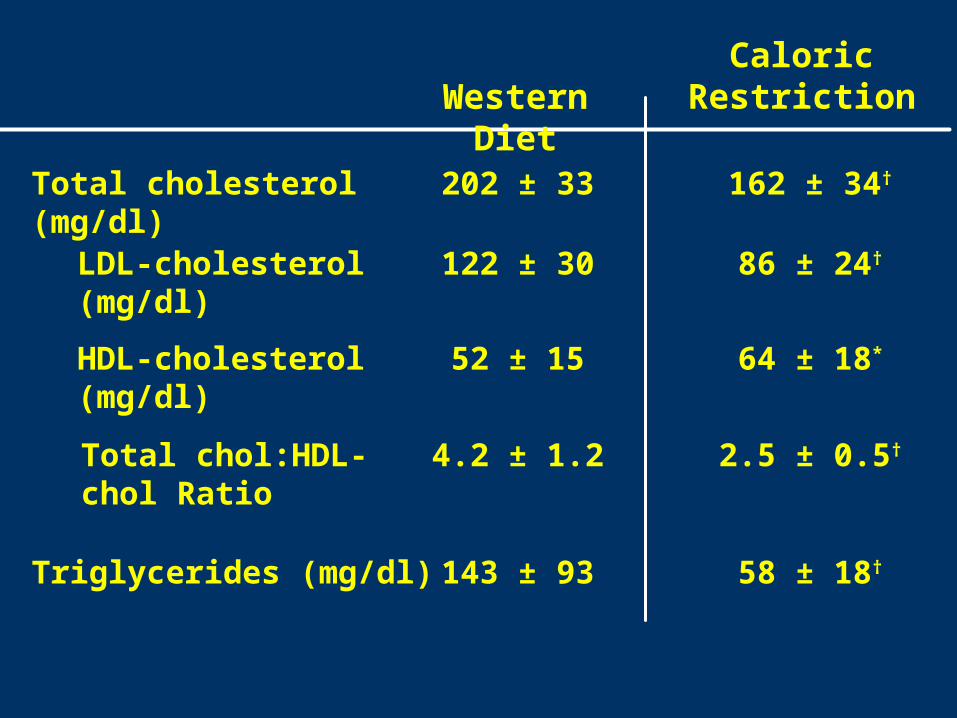
58 ± 18†143 ± 93Triglycerides (mg/dl)
2.5 ± 0.5†4.2 ± 1.2
64 ± 18*52 ± 15HDL-cholesterol (mg/dl)
86 ± 24†122 ± 30LDL-cholesterol (mg/dl)
162 ± 34†202 ± 33Total cholesterol (mg/dl)
Total chol:HDL-chol Ratio
Caloric RestrictionWestern Diet

74 ± 22†91 ± 13Triiodothyronine (ng/dl)
14.9 ± 3.1†22.1 ± 6.6TGFβ1 (ng/ml)
0.2 ± 0.3†1.1 ± 1.2C-reactive protein (mg/L)
0.7 ± 0.5*1.5 ± 0.9TNFα (pg/ml)
1.5 ± 0.9†7.4 ± 6Insulin (µU/ml)
84 ± 8†95 ± 9Glucose (mg/dl)
Caloric RestrictionWestern Diet

Growth Factors (serum)
CR EX U.S. Diet
ng/ml
IGF-1 180 ± 50 171 ± 45 218 ± 46
PDGF-AB 12.2 ± 4.9 14.8 ± 4.9 17.5 ± 5.5
TGF--1 14.9 ± 3.1 19.0 ± 3.7 22.1 ± 6.6
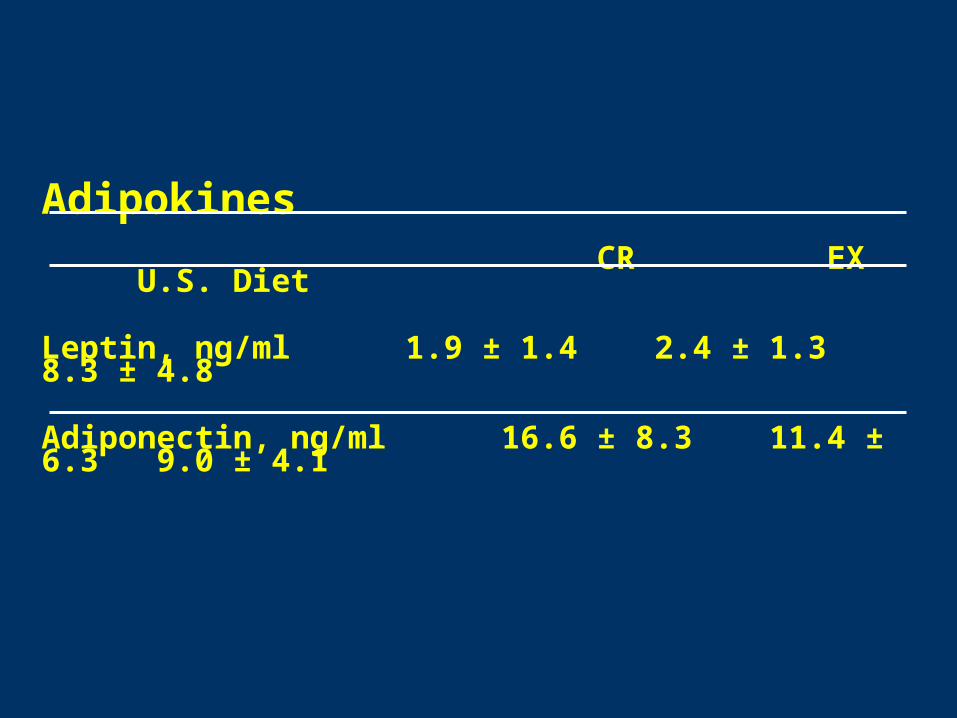
Adipokines CR EX U.S.
Diet
Leptin, ng/ml 1.9 ± 1.4 2.4 ± 1.3 8.3 ± 4.8
Adiponectin, ng/ml 16.6 ± 8.3 11.4 ± 6.3 9.0 ± 4.1
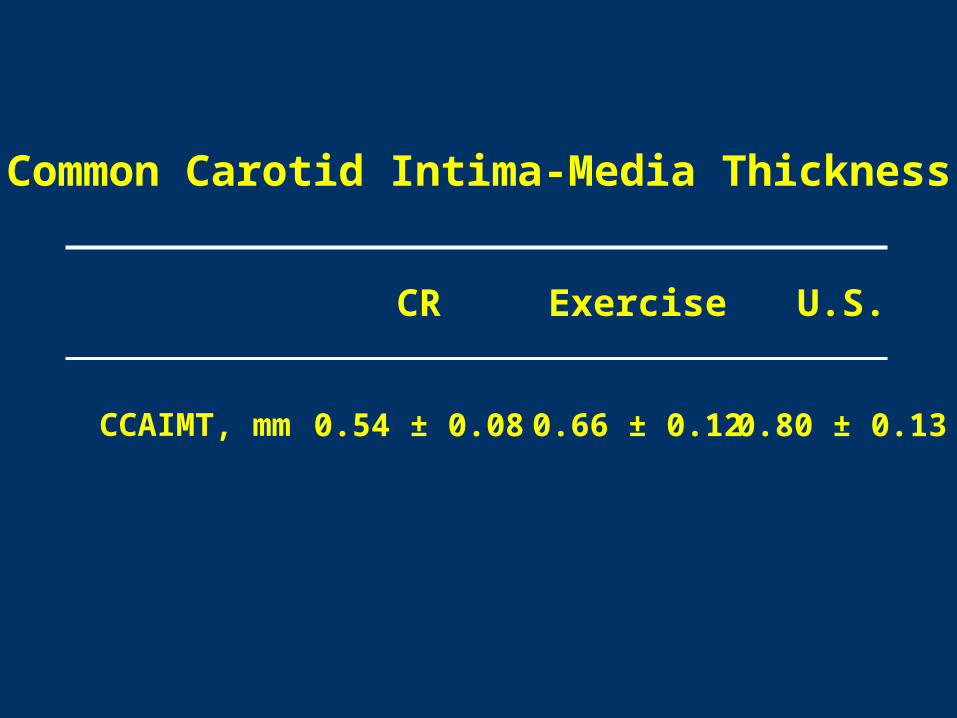
Common Carotid Intima-Media Thickness
CR Exercise U.S.
CCAIMT, mm 0.54 ± 0.08 0.66 ± 0.12 0.80 ± 0.13

2.5 ± 0.52.9 ± 0.64.5 ± 1.1Total chol:HDL-chol
64 ± 2159 ± 1347 ± 8HDL-cholesterol (mg/dl)
89 ± 3094 ± 21124 ± 37LDL-cholesterol (mg/dl)
159 ± 36165 ± 33211 ± 36Total cholesterol (mg/dl)
19.6±1.620.3 ± 2.023.7 ± 2.6Body mass index (kg/m2)
7 ± 4.8 yr1.0 ± 0.3 yrBefore CR
Atherosclerosis risk factors in CR Society members before and after starting CR
Caloric Restriction
49 ± 1468 ± 22134 ± 81Triglycerides (mg/dl)

61 ± 771 ± 782 ± 9Diastolic blood pressure (mmHg)
101 ± 9112 ± 12131 ± 15Systolic blood pressure (mmHg)
7 ± 4.8 yr1.0 ± 0.3 yrBefore CR
Atherosclerosis risk factors in CR Society members before and after starting CR
Caloric Restriction
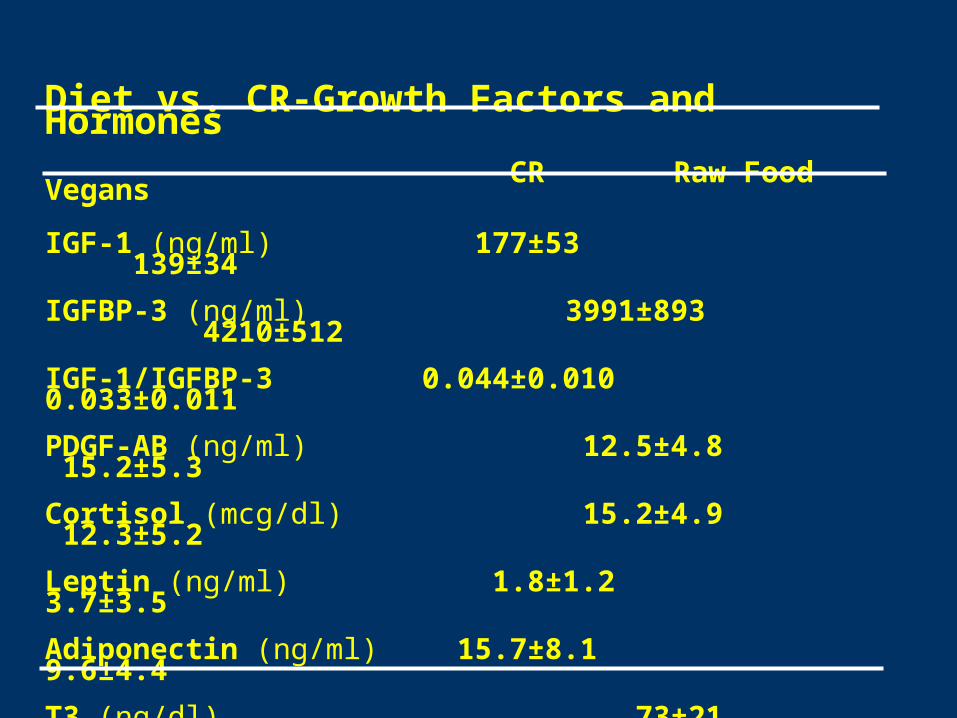
Diet vs. CR-Growth Factors and Hormones CR Raw Food
Vegans
IGF-1 (ng/ml) 177±53 139±34
IGFBP-3 (ng/ml) 3991±893 4210±512
IGF-1/IGFBP-3 0.044±0.010 0.033±0.011
PDGF-AB (ng/ml) 12.5±4.8 15.2±5.3
Cortisol (mcg/dl) 15.2±4.9 12.3±5.2
Leptin (ng/ml) 1.8±1.2 3.7±3.5
Adiponectin (ng/ml) 15.7±8.1 9.6±4.4
T3 (ng/dl) 73±21 89±15
Testosterone (nmol/L) 12.3±6.7 12.4±8.8
Free Androgen (nmol/L) 5.2±3.4 5.1±4.2
Values are means ± SD
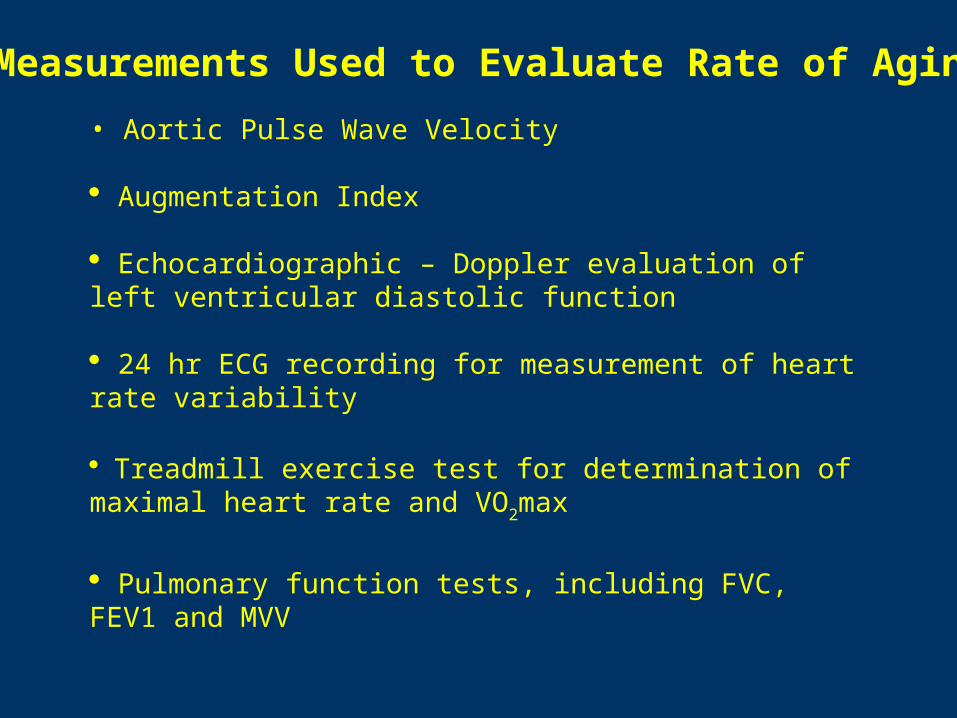
Measurements Used to Evaluate Rate of Aging
Pulmonary function tests, including FVC, FEV1 and MVV
Treadmill exercise test for determination of maximal heart rate and VO2max
• Aortic Pulse Wave Velocity
Augmentation Index
Echocardiographic – Doppler evaluation of left ventricular diastolic function
24 hr ECG recording for measurement of heart rate variability

CR: y = -0.20x + 51.9
R2 = 0.15
Sed: y = -0.40x + 54.2
R2 = 0.77
Trained: y = -0.46x + 77.2
R2 = 0.69
10
20
30
40
50
60
70
80
30 40 50 60 70 80Age (years)
VO
2max
(m
L/k
g/m
in)
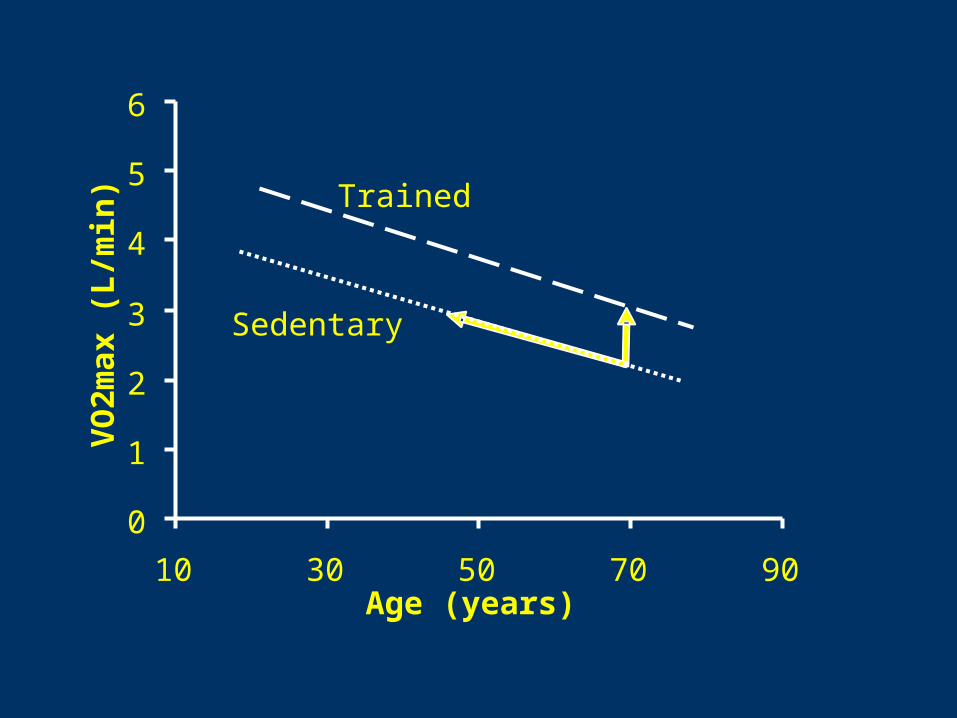
Sedentary
Trained
0
1
2
3
4
5
6
10 30 50 70 90Age (years)
VO
2max
(L
/min
)