Embed Size (px)
Citation preview


03
05
Since its creation in December 2006, Marsa Maroc participates actively in the development of
logistics’ competitiveness in Morocco by offering a range of diversified services for importers,
exporters and maritime companies.
Thanks to its specialized facilities, its outstanding equipments and its highly skilled human re-
sources, Marsa Maroc always strives to provide its partners with a superior service quality that
measures up to its position as the first national ports’ operator.
Operating in a sector whose liberalization opened the path to several development opportunities,
Marsa Maroc looks toward the future as a global logistics operator.
Corporate profile
ANNUAL REPORT 2009
Marsa Maroc in brief
Corporate name: Société d’exploitation des ports
Brand name: Marsa Maroc
Date of Establishment: December 1st, 2006
Legal status: Public Limited Company with Board of Directors and Supervisory Board
Registered capital: MAD 733,956,000
Head Office: 175, Bd. Zerktouni - 20100 Casablanca - Maroc
President of the Executive Board: Mohammed ABDELJALIL
Business area: Terminals and ports operating within the framework of concessions
Turnover: MAD 2, 373 million
Staff: 2,259
Global traffic: 35.6 million tons
Operated ports: Nador, Al Hoceima, Tangier, Mohammedia, Casablanca,
Jorf Lasfar, Safi, Agadir, Laayoune, Dakhla
ANNUAL REPORT 2009
07
President’s word 8
Marsa Maroc Presentation Management Structures 10Marsa Maroc organization chart 11
Vision and Strategy 12A strategic plan called CAP 15 14A customer-driven culture 16Human resources at the heart of the strategy 20Marsa Maroc, commitment to citizenship 24
2009 activity 262009 highlights 28Traffic achievements 30Financial performance 36
Financial statements 42
Contacts 51
TABLE OF CONTENTS
The year 2009 has been marked by a far-
reaching event which is the signature of
the concession contract of the Container
Terminal 4 in the port of Tanger Med II. By
signing this contract, a new phase in our
corporate life started, the way is open in front
of us to achieve the major objective of our
strategic plan. Indeed, thanks to this project,
Marsa Maroc will make its entrance on the
international scene of the world’s container
operators, relying on its leading position in
the national port business. To take up this new
challenge, we will get all our forces involved
in making the starting of this new terminal in
the year 2014 a real success, both at the level
of equipments and infrastructure quality and at
the level of Human Resources qualification.
At the same time, we continue our projects of
service quality improvement started in 2008,
with already-satisfactory results, especially
in the container segment. At the port of
Casablanca where more than one third of our
activity is concentrated, our efforts have been
crowned by the implementation of the unified
handling within all our terminals, and this since
September 2009. With the unique handling
process, the handling chain is controlled from
beginning to end enabling us, as show the
operating indexes registered at the end of the
year, achieving a service quality in line with
the international best standards. Furthermore,
we do our utmost to extend our service offer
to meet the expectations of our customers,
especially in the ports of Nador, Safi and Jorf-
Lasfar.
In terms of achievements, we remain the
leading company with a market share of 56 %
of the national port traffic. On the other hand,
our financial results, exceptionally high in
2008, have began to return to their normal
levels under the combined effect of the entry
of new operators and the partial transfer of
the RIT traffic to the port of Tanger Med. In
addition, the drop of exchanges because of
The year 2009 has been marked
by a far-reaching event which
is the signature of the concession
contract of the Container
Terminal 4 in the port of Tanger Med II.
By signing this contract,
a new phase in our corporate
life started, the way is open
in front of us to achieve
the major objective
of our strategic plan.
In an increasingly
competitive market,
awe continue
considering future with
much more optimism
and determination,
given our achievements
and the development
opportunities offered to
our company.
the international crisis impacted the achieved turnover (MAD 2,373
million) which decreased by 20 % in comparison to the previous
financial year, as expected previously.
In an increasingly competitive market, we continue considering future
with much more optimism and determination, given our achievements
and the development opportunities offered to our company. After
three years of activity, marked by the successful implementation of
the port business reform and the adaptation of corporate structures to
the company’s environment, Marsa Maroc has firmly entered into the
development process, being in phase with the dynamics the logistics
sector in our country comes within.
09
ANNUAL REPORT 2009
Word ofthe President
11
ANNUAL REPORT 2009
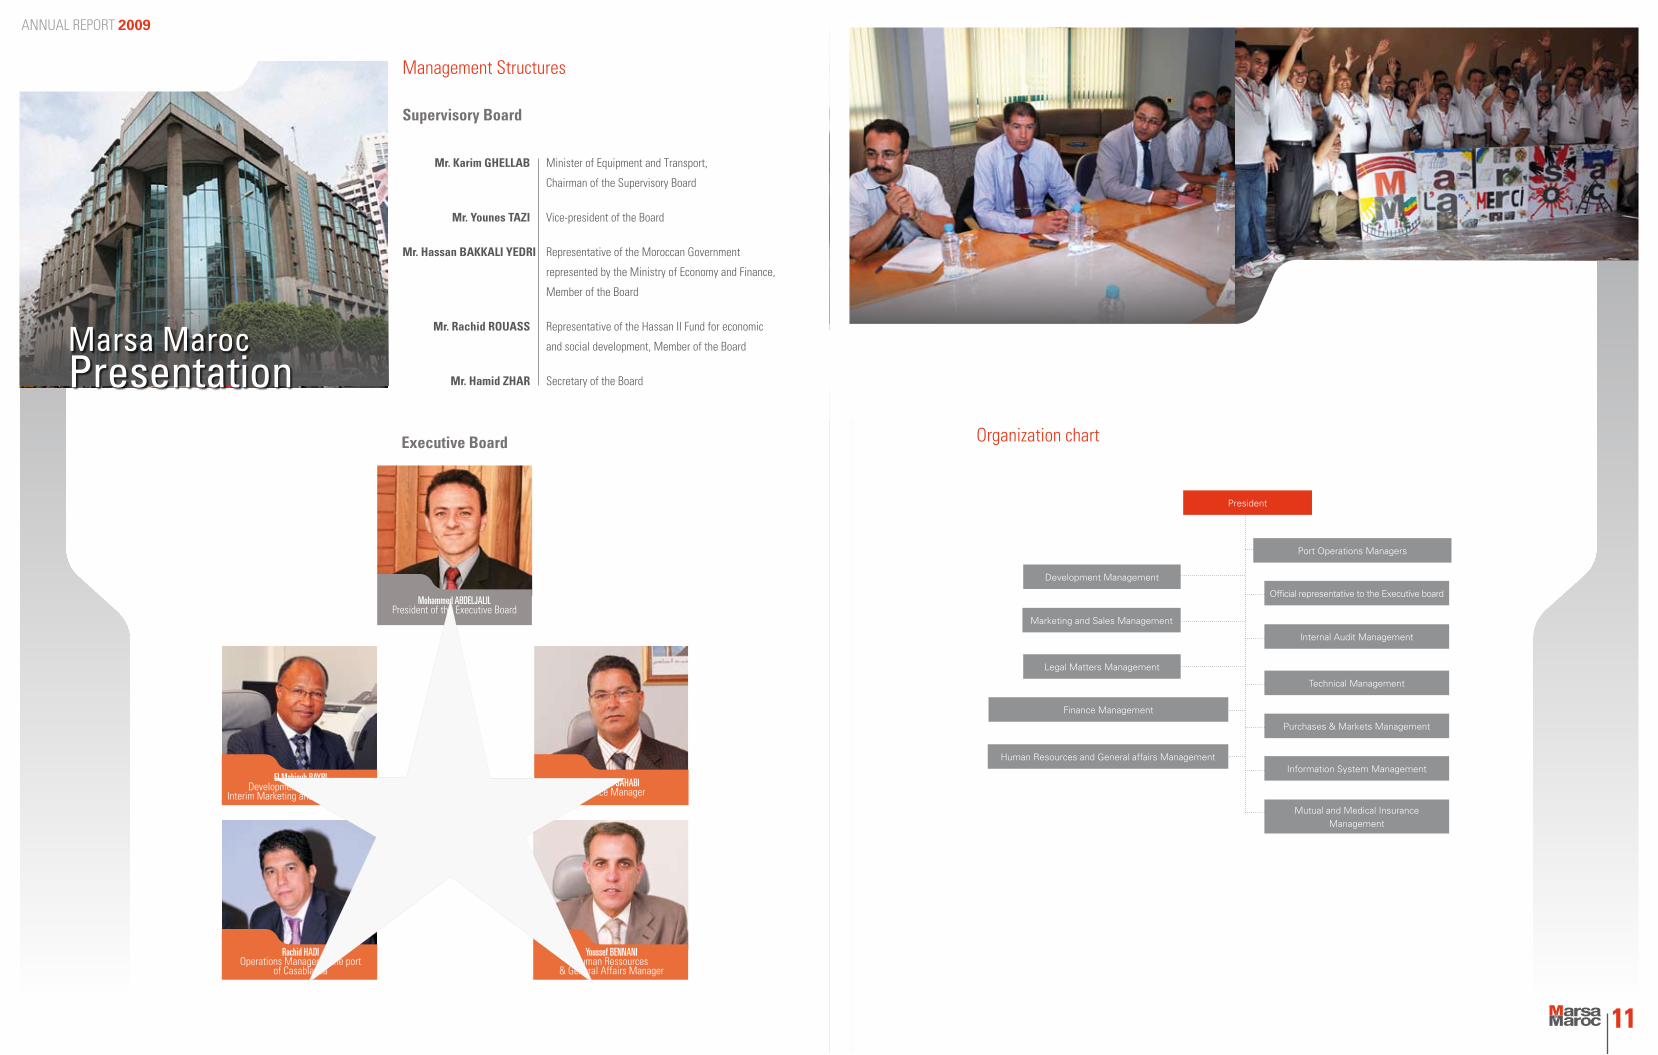
Marsa Maroc Presentation
Management Structures
Supervisory Board
Mr. Karim GHELLAB Minister of Equipment and Transport,
Chairman of the Supervisory Board
Mr. Younes TAZI Vice-president of the Board
Mr. Hassan BAKKALI YEDRI Representative of the Moroccan Government
represented by the Ministry of Economy and Finance,
Member of the Board
Mr. Rachid ROUASS Representative of the Hassan II Fund for economic
and social development, Member of the Board
Mr. Hamid ZHAR Secretary of the Board
Mohammed ABDELJALILPresident of the Executive Board
El Mahjoub BAYRIDevelopment Manager and
Interim Marketing and Sales Manager Mustapha SAHABI
Finance Manager
Rachid HADIOperations Manager in the port
of Casablanca
Youssef BENNANIHuman Ressources
& General Affairs Manager
Organization chart
President
Port Operations Managers
Official representative to the Executive board
Development Management
Internal Audit Management
Marketing and Sales Management
Technical Management
Legal Matters Management
Purchases & Markets Management
Finance Management
Information System ManagementHuman Resources and General affairs Management
Mutual and Medical Insurance Management
Executive Board
Vision
and Strategy
ANNUAL REPORT 2009
A Strategic plan called CAP 15
A customer-driven culture
HR at the heart of the strategy
Marsa Maroc, commitment
to citizenship
ANNUAL REPORT 2009
A Strategic plan called CAP 15In 2008, Marsa Maroc started implementing its strategic plan, aiming at sustaining
the development of the Company within an increasingly competitive environment.
This plan, called CAP 15, defines the company’s development axes relating mainly
to the obtaining of new terminals operating concessions, diversifying in surface
logistics activities as for containers traffic, and development of partnerships with
industrialists as for the processing of bulks and Hydrocarbons traffics. The CAP
15 plan has also as strategic objectives the modernization of the existing activities
especially regarding vehicles’ handling and conventional traffic. This plan also aims
at consolidating the company’s basic functions through the setting up of an adapted
human resources management; restructuring and procedural improvement; and
implementation of an effective management control, communication, etc.
In 2009, there were outstanding progresses as regards the launched projects, it is
particularly the case for management control which begins to be implemented in
ports, the development of partnerships with customers of the conventional traffic
and especially the obtaining of the concession of container terminal 4 in the port of
Tanger Med II.
Vision and Strategy
15
1. Marsa Maroc has recently obtained
the concession of the container
terminal 4 in the future port of Tanger
Med II. What does this mean for the
company in terms of investment and
human resources ?
The project will require an initial
investment (except renewal) of € 200 M, which will be
spread over a 9-year period as from 2013; two-thirds
of which will be invested during the period 2013-2017.
These investments are on studies, superstructure
works (road systems, networks, buildings, etc) and
acquisition of the equipments necessary to terminal
operations (Gantry cranes, trac-
tors, RTG, etc).
As far as human resources are
concerned, the manpower requi-
red in the long run will be of 900
persons. Approximately 300 em-
ployees are required in the initial
phase. It should be noted that Marsa Maroc will heavily
invest in the training of these resources.
2. Could you please specify the sources of financing of all
these investments ?
With a low indebtedness rate not exceeding 6 %; the
company’s financial situation will allow us to partially
self-finance the project, self-financing can go up to
50 %.
Moreover, the most important national banks have
already expressed their interest and support for the
financing of this important project, but we do not ex-
clude borrowing from foreign banks.
3. Operating in the port of Tanger Med means for Marsa Ma-
roc competition on the regional level and the exercise of a
new activity which is transhipment of containers. How does
the Company intend to proceed ?
Indeed, it is a new activity for us. It is known that the
transhipment activity imposes rude competition and
customer volatility. In addition to quality of service, a
large commercial know-how is required since we will
be in direct competition with
the ports of the region. To be
successful, Marsa Maroc must
have new skills available on the
one hand and form alliances with
partners, as international port
operators of reference or ship-
owners so that it can guarantee the use of the terminal
by shipping companies, and thus bring traffic. This is
what our company will deal with. I point out, in addi-
tion, that we are present in the port of Casablanca, and
we intend to benefit from this advantage by exploiting
at the maximum the synergy between the two ports.
InterviewMr. El Mahjoub BAYRI
The Development Manager in Marsa Maroc explains the stakes
of this change of direction in the development of the Company
ANNUAL REPORT 2009
Customer-driven culture Quality of service: record indicators for containers
In general, the indicators on the quality of service have definitely improved in
2009.
As regards the container activity, record achievements were made at the port
of Casablanca, with a productivity level reaching 26 containers unloaded per
hour, instead of 20 in 2008 and, therefore, a decrease in the waiting time of
ships from 30 hours to 8 hours on average. This clearly improved quality of
service has been made possible thanks to the taking up of the unification of
the handling chain during 2009, allowing a better control of the production
process. Also, the improvement was the result of a large action plan that
concerns among others the reorganization of the Eastern Container terminal
in Casablanca and the reinforcement of its equipments.
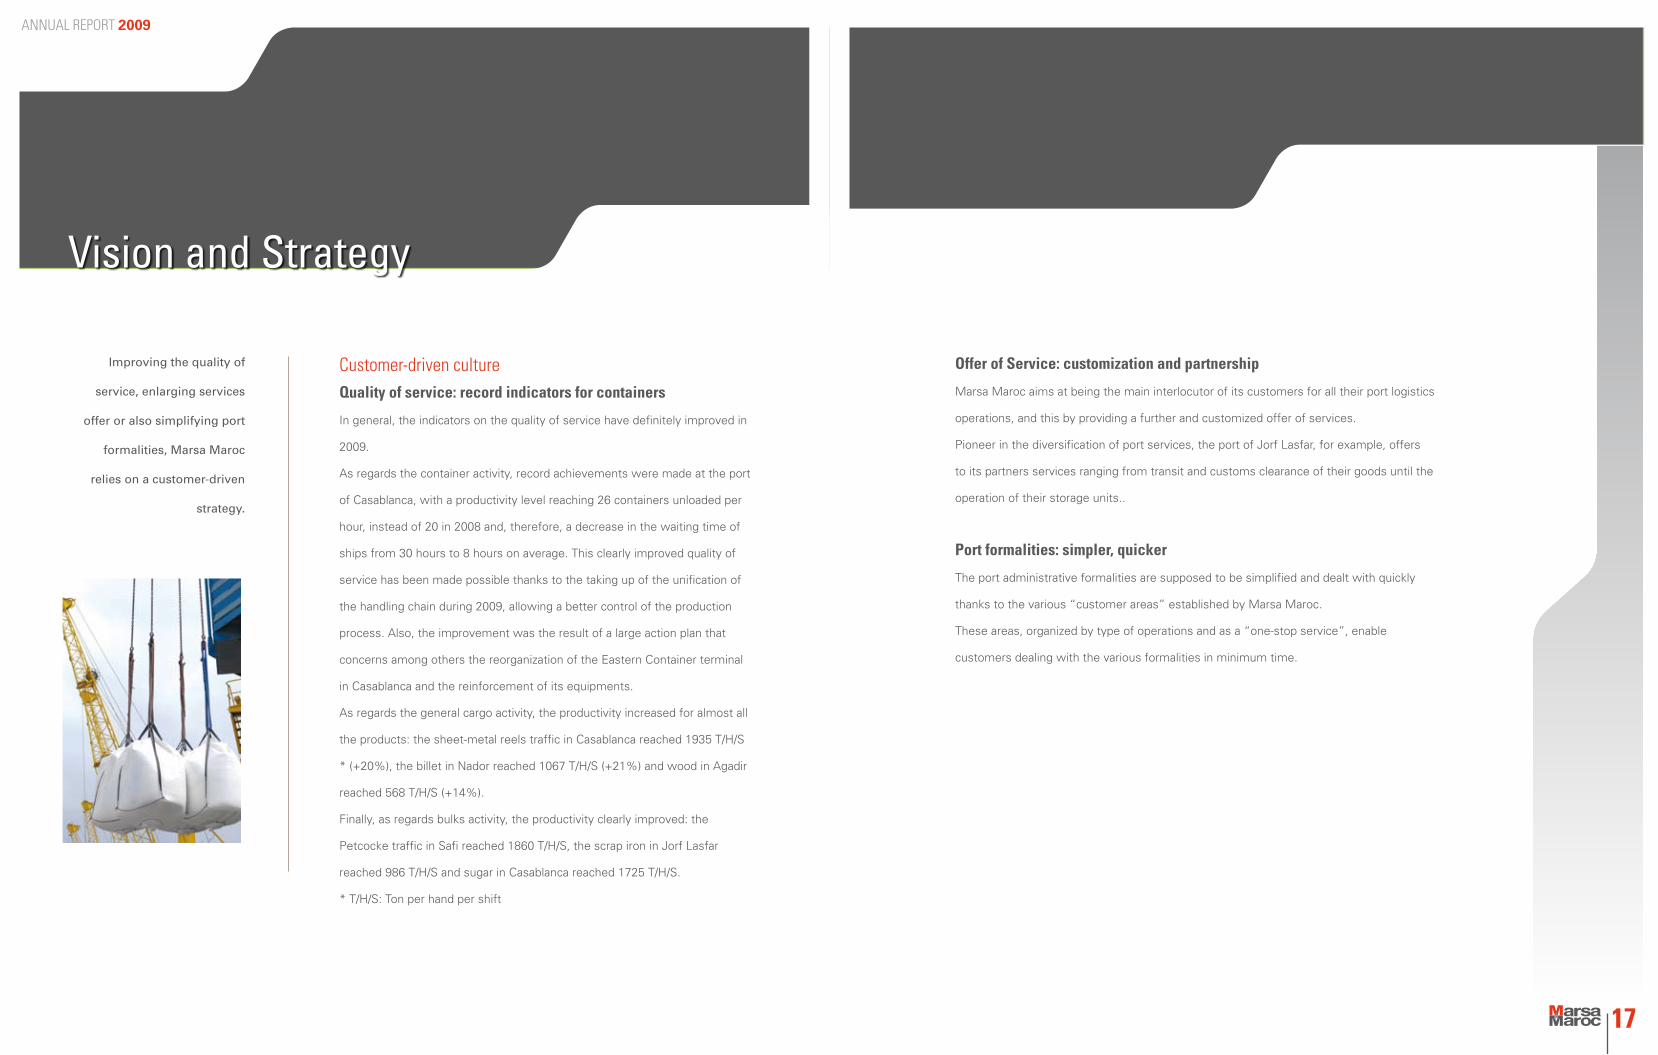
As regards the general cargo activity, the productivity increased for almost all
the products: the sheet-metal reels traffic in Casablanca reached 1935 T/H/S
* (+20%), the billet in Nador reached 1067 T/H/S (+21%) and wood in Agadir
reached 568 T/H/S (+14%).
Finally, as regards bulks activity, the productivity clearly improved: the
Petcocke traffic in Safi reached 1860 T/H/S, the scrap iron in Jorf Lasfar
reached 986 T/H/S and sugar in Casablanca reached 1725 T/H/S.
* T/H/S: Ton per hand per shift
Offer of Service: customization and partnership
Marsa Maroc aims at being the main interlocutor of its customers for all their port logistics
operations, and this by providing a further and customized offer of services.
Pioneer in the diversification of port services, the port of Jorf Lasfar, for example, offers
to its partners services ranging from transit and customs clearance of their goods until the
operation of their storage units..
Port formalities: simpler, quicker
The port administrative formalities are supposed to be simplified and dealt with quickly
thanks to the various “customer areas” established by Marsa Maroc.
These areas, organized by type of operations and as a “one-stop service”, enable
customers dealing with the various formalities in minimum time.
Improving the quality of
service, enlarging services
offer or also simplifying port
formalities, Marsa Maroc
relies on a customer-driven
strategy.
Vision and Strategy
17
ANNUAL REPORT 2009
A customer-driven culture34% of Marsa Maroc’s activity is concentrated in the port of
Casablanca; this latter knew in 2009 the entry into service of a
second operator. Quality of service was
thus at the core of your action plan for
the year 2009.
How do you define a quality service and
what are the objectives Marsa Maroc
fixed?
A quality service is a service that meets the customer’s
expectations. In our case, the port service quality may
be summarized in two levels:
- As for a properly - speaking service, namely the
handling of goods and this, from its unloading from the
ship until its delivery to the customer and vice versa;
- And as for the customer relationship, namely as
regards reception, access to information and assistance.
Thus, our objective is to provide the customer with a
low-cost, reliable and fast service while enabling him
to carry out port formalities quickly and comfortably.
This can be reached by having recourse to NICT for the
information exchanges and the setting up of multi-
services customer areas.
What are the axes of the service quality improvement
plan as regards the container activity and what were the
achievements?
Our definition of the service quality improvement plan
is based on the zoning of our value chain so as to
identify the improvement levers at for each link. Thus,
we defined as regards the value chain three main
axes, which are the improvement of productivity, the
optimization of storage areas and the reduction of ships’
waiting time, with a fourth transversal axis concerning
the reorganization of the terminal, and this without
forgetting the support actions relating to resources and
security.
So among the achieved objectives, we can mention
the installation of new equipments, the terminal
securing via the physical closing of the operation area
and via the control of accesses, the separation of the
customs inspection area from the operation area,
the reorganization of the container storage areas and
the improvement of the storage mode, etc. Human
resources were also emphasized via continuous training
and via the accountability of the supervisory staff
thanks to the implementation of the management by
objectives and the reinforcement of staff in the strategic
professional bodies.
These actions allowed us to get very encouraging
results in 2009 with the improvement of productivity by
30%, the reduction of ships’ waiting time by 57%, the
improvement of the storage capacity of
the containers on ground by 63% and the
reduction of the loading time of trucks by
26%.
We have seen that the results were very good. How do you
intend to keep this level of quality of service ?
First of all, by maintaining the daily and weekly follow-
ups of our performance indicators, accompanied by the
implementation of formalized procedures. In addition,
I shall highlight the importance of human capital in our
company.
Indeed, since we provide services, the role of the
human element remains crucial in
the quality of the provided service.
Thus, we are committed to ensure to
collaborators a secured environment and
as comfortable as possible. We have also undertaken
actions in order to motivate and raise constantly
awareness among our staff through the setting up
of a fair compensation system, which admits the
individual contribution, reinforcement of the proximity
management and continuous training.
InterviewMr. Rachid HADI
Operations Manager in the Port of Casablanca
Vision and Strategy
19
ANNUAL REPORT 2009
Interview
Mr. Youssef BENNANIHuman Resources & General Affairs
Manager outlines the new Human Resources policy and the 2009 achievements.
1-Could you please tell us the philoso-
phy and the objectives of the new Hu-
man Resources policy being deployed ?
Marsa Maroc has launched, shortly
after the ports business reform, a
founding and structuring project
focused on the reshaping of the HR
policy. This new policy relies on
guidelines; I will mention the
most important of them:
- Developing a fair HR manage-
ment system
- Making every employee
accountable for his professional
development so that he could be the main actor of his
career development process.
- Changing the conventional hierarchical management
mode into an objective-based management mode
“MBO” based on consultation and support, while defi-
ning clear and shared objectives.
Thus, we intend to optimize the performance mana-
gement system by the implementation of the “MBO”
system, to anticipate the evolution of jobs and trades
through setting a previsional HR management process
(GPEC), to encourage the development of skills by res-
haping the training policy, etc.
2- What is your MBO system assess-
ment for the year 2009 ?
The successful implementation
of the “MBO” performance
management system in Marsa
Maroc resulted from the combi-
ned efforts of all our executive
officers.
Indeed, all the executive officers take part in the
reinforcement of the system. This approach is the only
guarantee to establish a real modern and participative
management of the performance management.
It should also be noted that the “MBO” system has
been easily integrated in our Human Resources Mana-
gement arsenal of tools thanks to the strong involve-
ment of the Top Management, to training and follow-
up, as well as because of the process animation quality
from its launching to its final outcome.
3- What does training represent in this new policy?
Training at Marsa Maroc is deemed to be the base on
which the reinforcement of our human capital relies;
with as final objective to constantly improve profes-
sional skills of our collaborators. Thus, a new training
policy was deployed.
To successfully achieve this policy, we carried out a trai-
ning engineering study, extended to all Marsa Maroc’s
staff, executive officers and agents. This study enabled
us, once the needs are collected, defining a triennial
training plan throughout the period 2010 - 2012.
4- In 2009, Marsa Maroc has undertaken the activity of on-
board handling in all its terminals of the port of Casablanca.
How did Marsa Maroc prepare for this as far as Human
Resources are concerned?
he Staff Optimization and sizing to meet the evolution
of port trades is not something new for Marsa Maroc.
This prospective management mechanism has many
effects on jobs: some are developed, others come up,
are transferred, and others are likely to disappear.
With the advent of unified handling at the port of
Casablanca, a study, aiming at providing the new trades
with qualified labour was carried out. Several manage-
rial levers have been powered in order to successfully
achieve this operation:
- Training;
- Redeployment and recruitment of narrowly-specialized
profiles;
- Raising the awareness of social partners about the
importance of their role as social supervisors.
Vision and Strategy
21
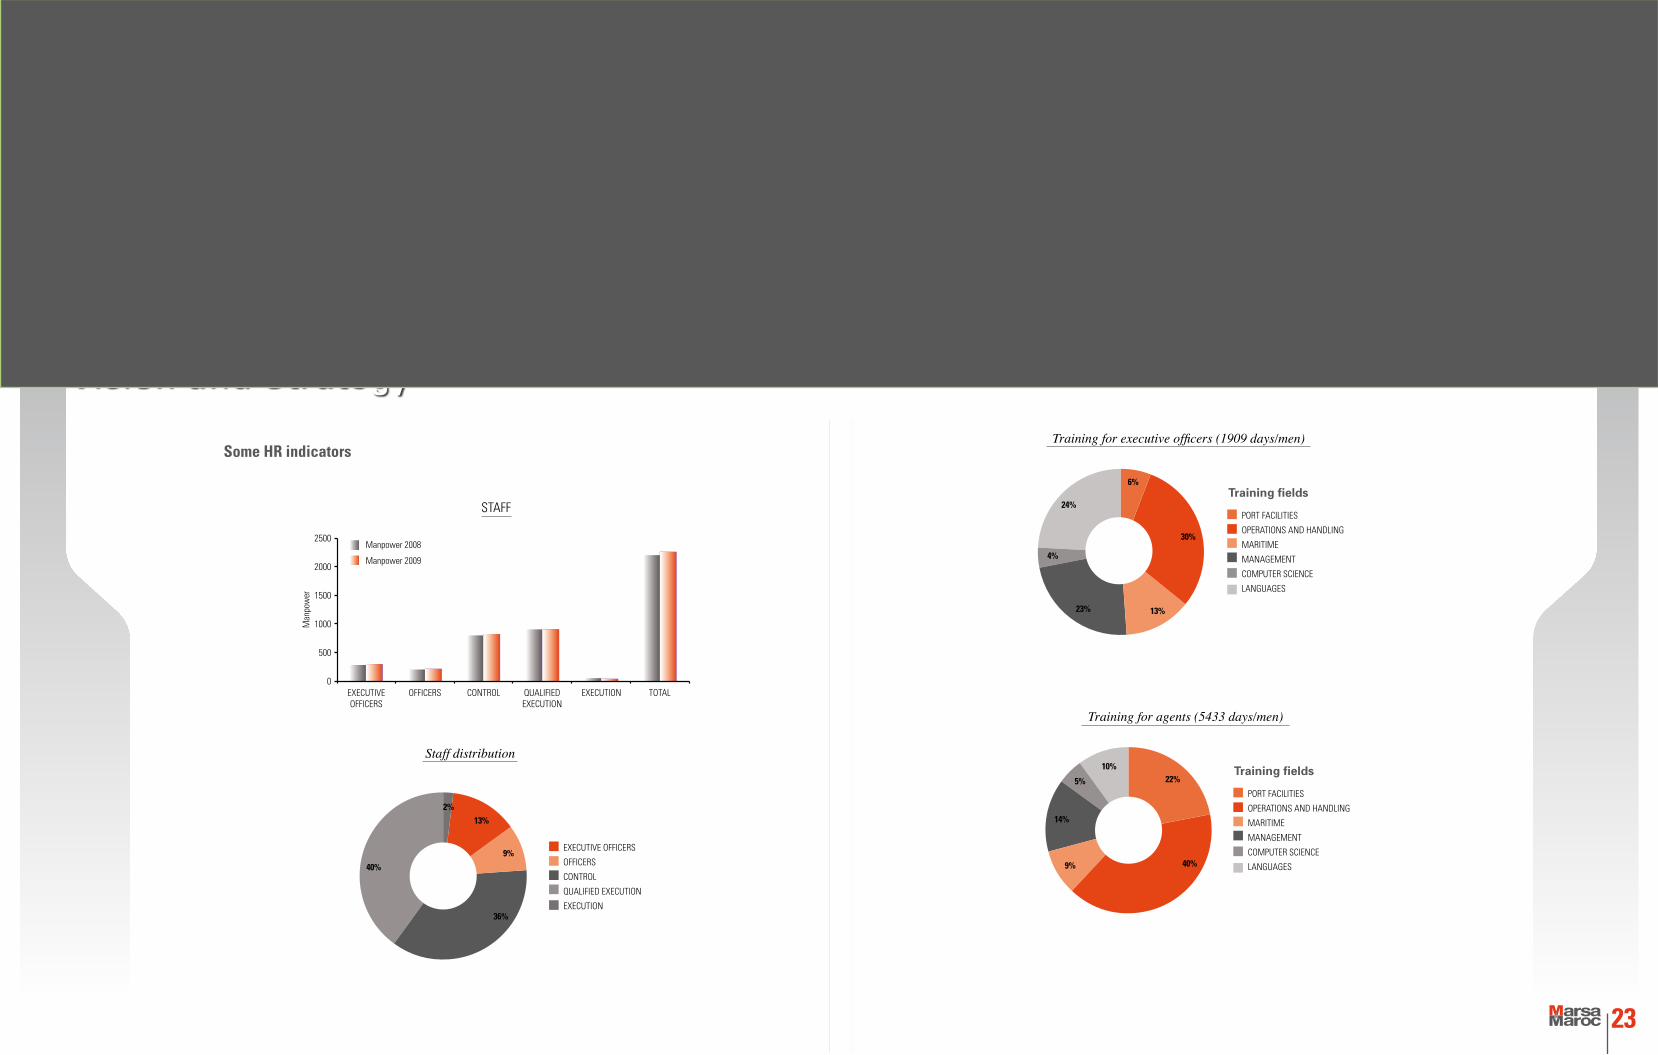
Les Ressources Humaines au centreMarsa Maroc has deployed a human resources new policy aiming at mobilizing all its sharp forces on the company’s
strategy, and this by endowing the human resources management with innovative tools for a fairer and more
dynamic management that recognizes more the contribution of the human capital.
ANNUAL REPORT 2009
STAFF
Staff distribution
Some HR indicators
EXECUTIVE OFFICERS
Man
pow
er
Manpower 2008
Manpower 2009
OFFICERS
EXECUTIVE OFFICERS
OFFICERS
CONTROL
QUALIFIED EXECUTION
EXECUTION
CONTROL QUALIFIED EXECUTION
EXECUTION TOTAL
Vision and StrategyTraining for executive officers (1909 days/men)
PORT FACILITIES
OPERATIONS AND HANDLING
MARITIME
MANAGEMENT
COMPUTER SCIENCE
LANGUAGES
Training fields
Training for agents (5433 days/men)
PORT FACILITIES
OPERATIONS AND HANDLING
MARITIME
MANAGEMENT
COMPUTER SCIENCE
LANGUAGES
Training fields
23
ANNUAL REPORT 2009
Marsa Maroc, commitment to citizenshipMoroccan sport sponsor
Marsa Maroc is one of the main sponsors of the Casablanca Raja club
throughout 2 sports seasons.
This partnership reflects many common values: Leadership, Performance and
Excellence.
Marsa Maroc is also committed to actively promote national tennis through
sponsoring the greatest national and regional competitions, going from the
Grand Prix Hassan II of Tennis, to youth national tennis tournaments, etc.
Other sports are also supported by Marsa Maroc throughout the year, namely
equestrian sports and athletics.
Presence in the national cultural events
Marsa Maroc is also committed to promote the Moroccan culture and art; by
providing support to many events, namely:
- Mawazine Festival- Rhythms of the World, since 2 years
- Moroccan philharmonic orchestra concerts
- Festival of children Theatre in Nador
- Some regional festivals (Nador, Dakhla, Laayoune, etc), which are actively in
line with Marsa Maroc’s will to develop the regions where it is present.
Social commitment
is a priority for
Marsa Maroc.
Thus, various sport,
cultural, environmental
and social events
and actions are
promoted
by Marsa Maroc.
Vision and Strategy
25
Commitment to Green Morocco
Marsa Maroc is committed, each year and within the framework of the “Clean Beaches” operation, to improve
security, well-being and comfort of vacationers in the “Ain Diab Extension” beach known as “Mme Chouale”.
Thus, several actions are carried out to make levelling of infrastructures for vacationers, to endow the beach
with lifesaving and security equipment, to raise awareness about the protection of environment, and to make
animation for children.
The Mohammed VI Foundation for the Protection of Environment has awarded the “Mme Chouale” beach
with the blue label, crowning thus the efforts of Marsa Maroc.
The granting of this label to a beach is dependent on the respect of a list of criteria classified in 4 categories,
namely, information, awareness-raising and education to the environment; quality of the bathing water;
hygiene and safety; development and management.
Moreover, considering its activity in the port of Mohammedia, Marsa Maroc has appropriate facilities, which
include namely a deballasting station. This latter is continuously processing hydrocarbon polluted water
coming from ships and oil depots.
Actor of Social development
Today, Marsa Maroc is committed to a weighty impact action on the social development of our country. This
social action consists in improving the schooling conditions for the pupils in rural areas.
Within this action, Marsa Maroc has launched the “for a better schooling” operation in partnership with the
association “Amis des écoles” (School friends).
The first project carried out within this partnership for the year 2009 regards an operation called “Water in
Tata”. This operation aims at building 40 drinking water fountains and the restoration of toilet blocks in nearly
30 schools in the Tata area.
Thanks to this project, more than 3,000 children were able to have drinking water in their schools.

Activity 2009
2009 highlights
Traffic achievements
Financial performance
ANNUAL REPORT 2009
ANNUAL REPORT 2009
On Wednesday June 17th, 2009, His Majesty King
Mohammed VI, May God assist him, chaired the
ceremony of signature of the concession contract of
the Container Terminal 4 of the port of Tanger Med
II between Marsa Maroc and TMSA (Tanger Med
Special Agency).
Within the framework of its corporate development
strategy, Marsa Maroc aims to be present in the port
of Tanger Med, one of the most important platforms
of containers transhipment in the Mediterranean.
This presence will allow it to extend its portfolio to a
new international activity which is “transhipment”,
and to consolidate its ambitions of development at
the regional level.
In pursuance of the terms of the concession
contract binding Marsa Maroc with TMSA for a
30-year period, Marsa Maroc undertakes to initially
invest approximately 200 million euros (MAD 2.2
billion) for the realization of all superstructures and
the implementation of the equipments and human
means required for the terminal operating.
This multi-user terminal will be open to a wide range
of shipping lines and will have a capacity of 2,250,000
containers TEU and a wharf of 1,200 meters with a
depth of 16 meters. This terminal will be partially put
into service on the 2nd half-year of the year 2014.
The 2009 highlights Procurement of the Container terminal 4 concession in the port of Tanger Med II
Total taking up of on-board handling in the port of Casablanca
Management control: beginning of implementation within ports
Marsa Maroc and Tanger Med Special Agency partnership project
Activity 2009On September 28th, 2009, Marsa Maroc had taken
up completely, using its own human and material
means, the on-board handling in the port of
Casablanca for all segments of traffic:
Container, Roll-on/Roll-off, Bulk products and
Conventional.
After having got over this new phase in deploying
the port reform levers; the transitional period at the
port of Casablanca is brought to an end enabling
Marsa Maroc to control the whole handling chain
so as to offer a still better quality of service to its
customers. Indeed, the operation indicators at
the end of the year 2009 show a level of quality
of service meeting the international standards
with a visible improvement in the productivity of
almost all traffics, namely for the container traffic,
which stepped from 20 to 26 containers per hour.
The management control project, launched within
the framework of the strategic plan CAP 15, begins
to be implemented in the ports of Safi, Jorf Lasfar,
Agadir and Mohammedia. The management
control setting up aims at having at one’s disposal a
genuine tool of corporate piloting.
Marsa Maroc and TMSA have signed a Memorandum
of Understanding (MOU) enabling Marsa Maroc to
carry out, in subcontracting and as from the year 2010,
the handling services in the “Bulks and various goods”
terminal of the port of Tanger Med.
29
ANNUAL REPORT 2009
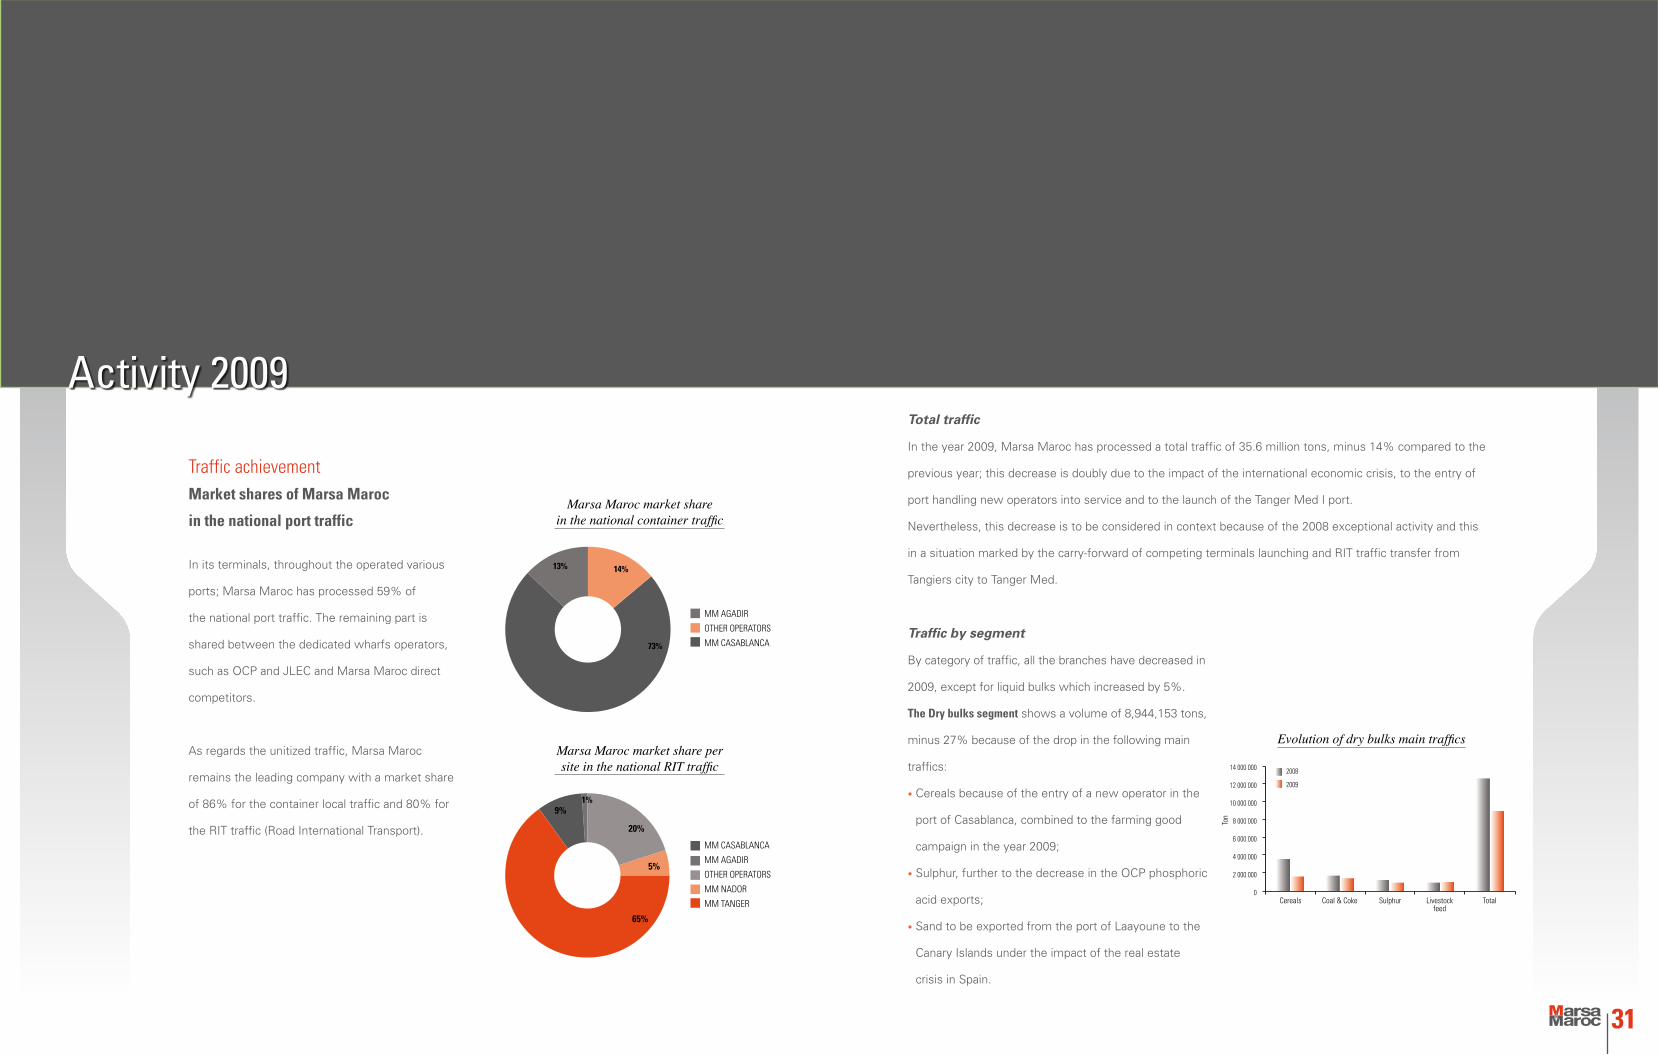
Traffic achievement Market shares of Marsa Maroc
in the national port traffic
In its terminals, throughout the operated various
ports; Marsa Maroc has processed 59% of
the national port traffic. The remaining part is
shared between the dedicated wharfs operators,
such as OCP and JLEC and Marsa Maroc direct
competitors.
As regards the unitized traffic, Marsa Maroc
remains the leading company with a market share
of 86% for the container local traffic and 80% for
the RIT traffic (Road International Transport).
Marsa Maroc –Processed Traffic
Total traffic
In the year 2009, Marsa Maroc has processed a total traffic of 35.6 million tons, minus 14% compared to the
previous year; this decrease is doubly due to the impact of the international economic crisis, to the entry of
port handling new operators into service and to the launch of the Tanger Med I port.
Nevertheless, this decrease is to be considered in context because of the 2008 exceptional activity and this
in a situation marked by the carry-forward of competing terminals launching and RIT traffic transfer from
Tangiers city to Tanger Med.
Traffic by segment
By category of traffic, all the branches have decreased in
2009, except for liquid bulks which increased by 5%.
The Dry bulks segment shows a volume of 8,944,153 tons,
minus 27% because of the drop in the following main
traffics:
• Cereals because of the entry of a new operator in the
port of Casablanca, combined to the farming good
campaign in the year 2009;
• Sulphur, further to the decrease in the OCP phosphoric
acid exports;
• Sand to be exported from the port of Laayoune to the
Canary Islands under the impact of the real estate
crisis in Spain.
Cereals
Evolution of dry bulks main traffics
Ton
Coal & Coke Sulphur Livestock feed
Total
31
Activity 2009
Marsa Maroc market share in the national container traffic
MM AGADIR
OTHER OPERATORS
MM CASABLANCA
Marsa Maroc market share per site in the national RIT traffic
20%
5%
65%
9%
MM CASABLANCA
MM AGADIR
OTHER OPERATORS
MM NADOR
MM TANGER
ANNUAL REPORT 2009ANNUAL REPORT 2009
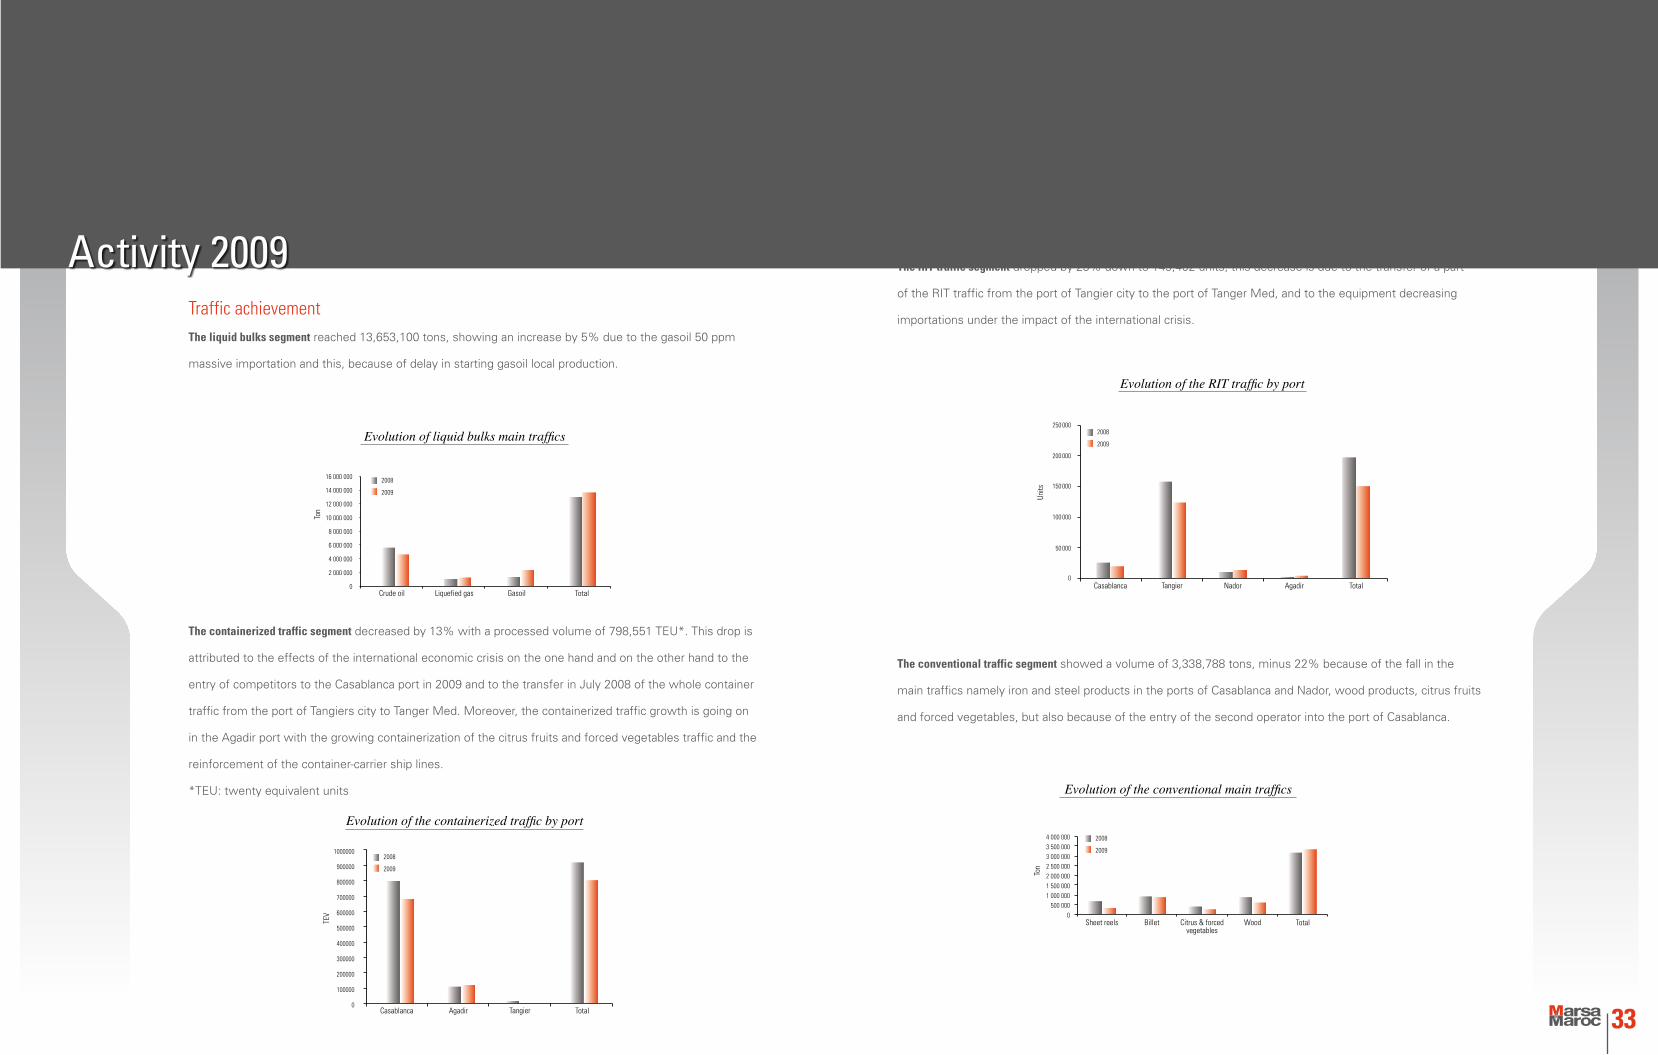
The containerized traffic segment decreased by 13% with a processed volume of 798,551 TEU*. This drop is
attributed to the effects of the international economic crisis on the one hand and on the other hand to the
entry of competitors to the Casablanca port in 2009 and to the transfer in July 2008 of the whole container
traffic from the port of Tangiers city to Tanger Med. Moreover, the containerized traffic growth is going on
in the Agadir port with the growing containerization of the citrus fruits and forced vegetables traffic and the
reinforcement of the container-carrier ship lines.
*TEU: twenty equivalent units
The RIT traffic segment dropped by 23% down to 149,402 units; this decrease is due to the transfer of a part
of the RIT traffic from the port of Tangier city to the port of Tanger Med, and to the equipment decreasing
importations under the impact of the international crisis.
The conventional traffic segment showed a volume of 3,338,788 tons, minus 22% because of the fall in the
main traffics namely iron and steel products in the ports of Casablanca and Nador, wood products, citrus fruits
and forced vegetables, but also because of the entry of the second operator into the port of Casablanca.
Evolution of liquid bulks main traffics
Evolution of the RIT traffic by port
Evolution of the conventional main traffics
Traffic achievement The liquid bulks segment reached 13,653,100 tons, showing an increase by 5% due to the gasoil 50 ppm
massive importation and this, because of delay in starting gasoil local production.
Crude oil
Sheet reels
Liquefied gas
Billet
Gasoil
Citrus & forced vegetables
Wood
Total
Total
Evolution of the containerized traffic by port
Casablanca Agadir Tangier Total
TEV
Ton
Ton
Casablanca
50 000
0
100 000
150 000
200 000
250 000
Nador AgadirTangier Total
Units
33
Activity 2009
ANNUAL REPORT 2009ANNUAL REPORT 2009
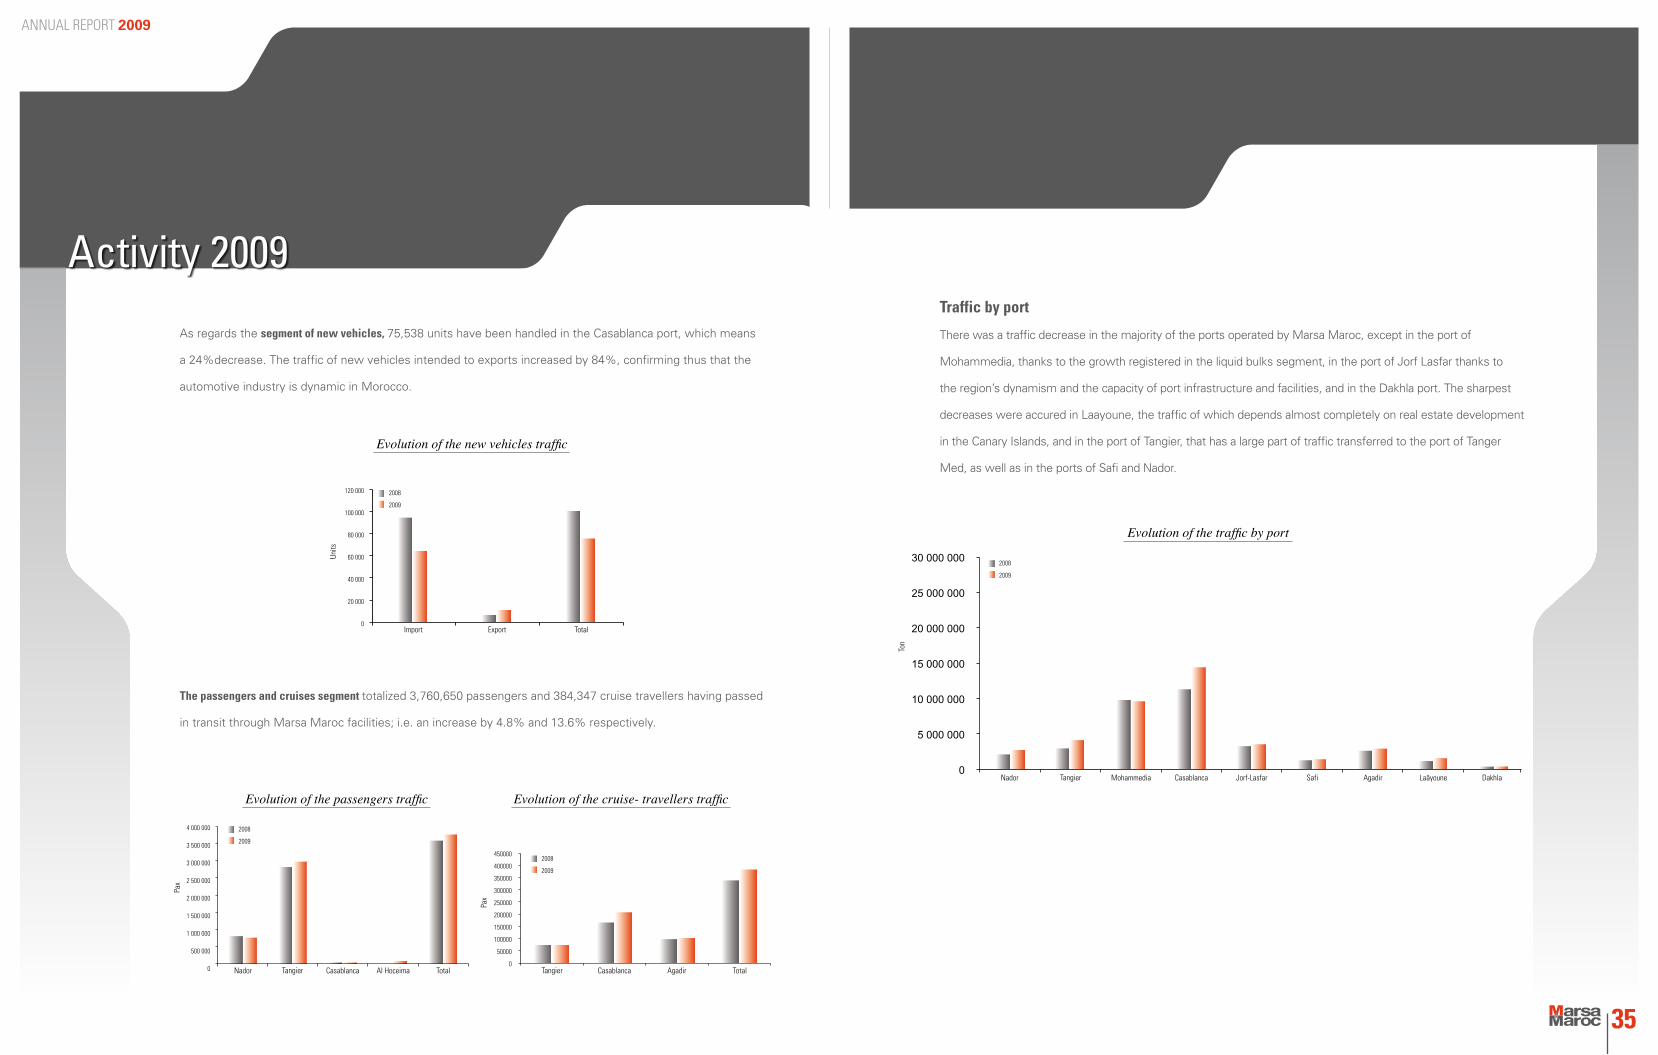
The passengers and cruises segment totalized 3,760,650 passengers and 384,347 cruise travellers having passed
in transit through Marsa Maroc facilities; i.e. an increase by 4.8% and 13.6% respectively.
Traffic by port
There was a traffic decrease in the majority of the ports operated by Marsa Maroc, except in the port of
Mohammedia, thanks to the growth registered in the liquid bulks segment, in the port of Jorf Lasfar thanks to
the region’s dynamism and the capacity of port infrastructure and facilities, and in the Dakhla port. The sharpest
decreases were accured in Laayoune, the traffic of which depends almost completely on real estate development
in the Canary Islands, and in the port of Tangier, that has a large part of traffic transferred to the port of Tanger
Med, as well as in the ports of Safi and Nador.
Evolution of the new vehicles traffic
Evolution of the traffic by port
Evolution of the passengers traffic Evolution of the cruise- travellers traffic
As regards the segment of new vehicles, 75,538 units have been handled in the Casablanca port, which means
a 24%decrease. The traffic of new vehicles intended to exports increased by 84%, confirming thus that the
automotive industry is dynamic in Morocco.
Import
Nador TangierTangier Casablanca CasablancaAl Hoceima AgadirTotal Total
Export Total
Nador Tangier Mohammedia Casablanca Jorf-Lasfar Safi Agadir Laâyoune Dakhla
Ton
Activity 2009
Pax
Pax
Units
35
Les Ressources Humaines au centre
ANNUAL REPORT 2009
Financial performanceThe Marsa Maroc financial performance as for the financial year 2009 started to return to normal levels after the
exceptional but cyclical financial results reached in 2008.
In 2009, the Marsa Maroc financial
performance showed a clear decrease in
comparison with 2008. What are the main
reasons for this, in your opinion?
Being closely linked to international
trade, the national ports business
was one of the first sectors to be af-
fected by the international economic crisis. Indeed, in the
year 2009, the national port traffic
is set at 60 million tons, revealing
a decrease by 9% in comparison
with the year 2008.
Within this context of crisis, to
which is added the entry of new
port operators in the handling
activity, Marsa Maroc sees its activity falling by 14% and
its market share going down from 63% to 60% whereas
the total volume of the traffic processed in 2009 reaches
35.6 million tons.
Considering these two main events marking the year
2009, the turnover made, i.e. MAD 2,373 million DH,
decreased by 20% compared to the year 2008.
However, the activity and the turnover of this financial
year still match our expectations. Indeed, the delay in the
entry of new operators into the port of Casablanca and
the postponing of the transfer of the whole activity from
the port of Tangier city to the port of Tanger Med will
offset the traffic decrease caused by the crisis.
As regards performance, the fiscal year 2009 ended with
a net income of MAD 391M, showing a 7% decrease
in comparison with the expecta-
tions.
The Marsa Maroc financial per-
formance started to return to its
normal levels after the exceptio-
nal results achieved in the years
2007 and 2008, such results were
directly linked to the specific transitional phase of the
ports business reform, during which our company was
authorized to operate on an area wider than that provided
for by the concession contract with the ANP (Agence
Nationale des Ports: National Agency of Ports).
Since 2008, Marsa Maroc entered into a very ambitious
development plan. Given that investments in the port activity
sphere are very capital-intensive, what are the Company’s
sources of financing?
The exceptional financial results achieved by Marsa
Maroc during its first three years of existence helped
to generate a significant cash flow. A part was used
to fully finance the investments made during this
period, assessed at MAD 400M on average per year.
The other part is set aside until being used in the
financing of the development projects within the
strategic plan.
Thanks to its satisfactory and balanced financial si-
tuation and its quasi-null indebtedness level, Marsa
Maroc has major assets enabling it to raise funds
from the financial market and complete the finan-
cing of its development projects while benefiting
from the best conditions.
The implementation of the management control project is
today in the final phase: are the results expected from this
project already visible?
Management control is now implemented in Marsa
Maroc most sites. Before this phase, the project was
mainly about developing a performance measurement
system and defining operational procedures and orga-
nizational schema of the function.
Therefore, we now have a control and piloting tool that
allows us to track the performance of the operational
entities and to undertake more efficiently the neces-
sary improvement actions and measures.
This tool will be further enriched by the results expec-
ted from the setting of a management cost accoun-
ting, under way in the port of Casablanca, which was
chosen as a pilot site, until its generalization to other
Marsa Maroc ports.
InterviewMr. Mostafa SAHABI
Finance Manager, talks about the financial achievements during the financial year 2009
and about the general context behind the decrease of results
37
Activity 2009
ANNUAL REPORT 2009
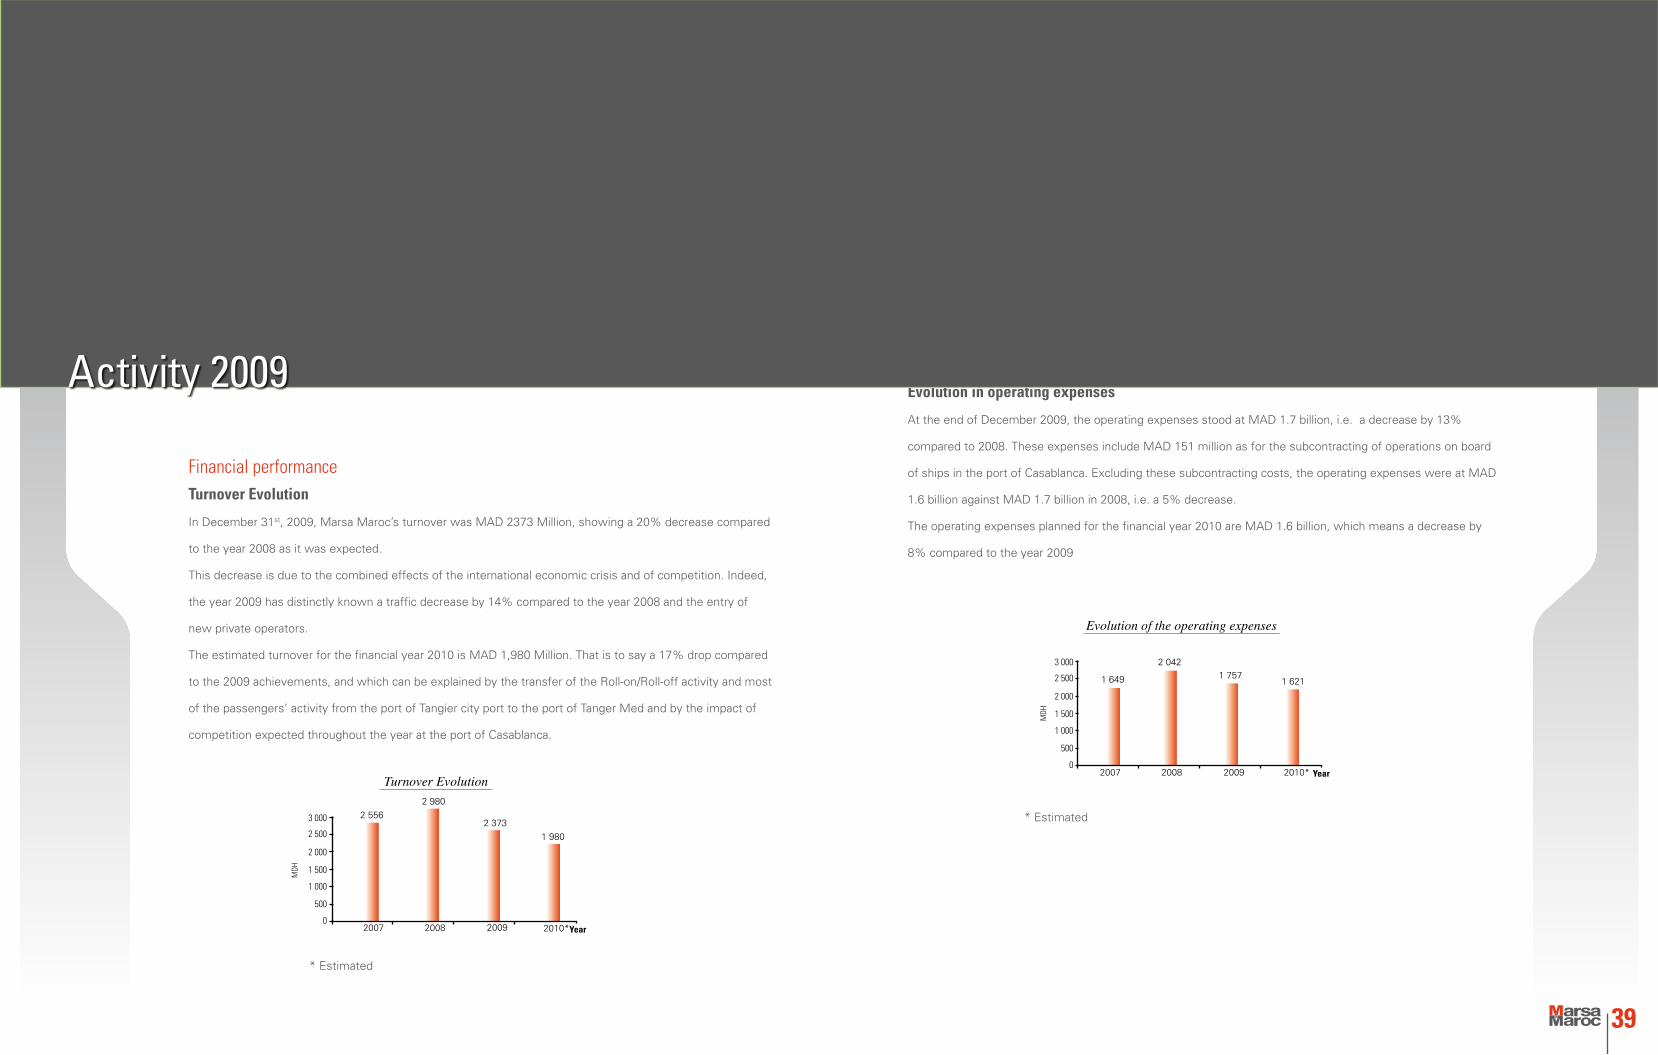
Financial performance Turnover Evolution
In December 31st, 2009, Marsa Maroc’s turnover was MAD 2373 Million, showing a 20% decrease compared
to the year 2008 as it was expected.
This decrease is due to the combined effects of the international economic crisis and of competition. Indeed,
the year 2009 has distinctly known a traffic decrease by 14% compared to the year 2008 and the entry of
new private operators.
The estimated turnover for the financial year 2010 is MAD 1,980 Million. That is to say a 17% drop compared
to the 2009 achievements, and which can be explained by the transfer of the Roll-on/Roll-off activity and most
of the passengers’ activity from the port of Tangier city port to the port of Tanger Med and by the impact of
competition expected throughout the year at the port of Casablanca.
Evolution in operating expenses
At the end of December 2009, the operating expenses stood at MAD 1.7 billion, i.e. a decrease by 13%
compared to 2008. These expenses include MAD 151 million as for the subcontracting of operations on board
of ships in the port of Casablanca. Excluding these subcontracting costs, the operating expenses were at MAD
1.6 billion against MAD 1.7 billion in 2008, i.e. a 5% decrease.
The operating expenses planned for the financial year 2010 are MAD 1.6 billion, which means a decrease by
8% compared to the year 2009
* Estimated
Turnover Evolution
3 000
2 500
2 000
1 500
1 000
500
02007
2 556
2 980
2 373
1 980
2008 2009 2010*Year
MDH
* Estimated
2007 2008 2009
Evolution of the operating expenses
2010* Year
1 649
2 0421 757
1 621
MDH
3 000
2 500
2 000
1 500
1 000
500
0
39
Activity 2009
ANNUAL REPORT 2009ANNUAL REPORT 2009
Evolution of results
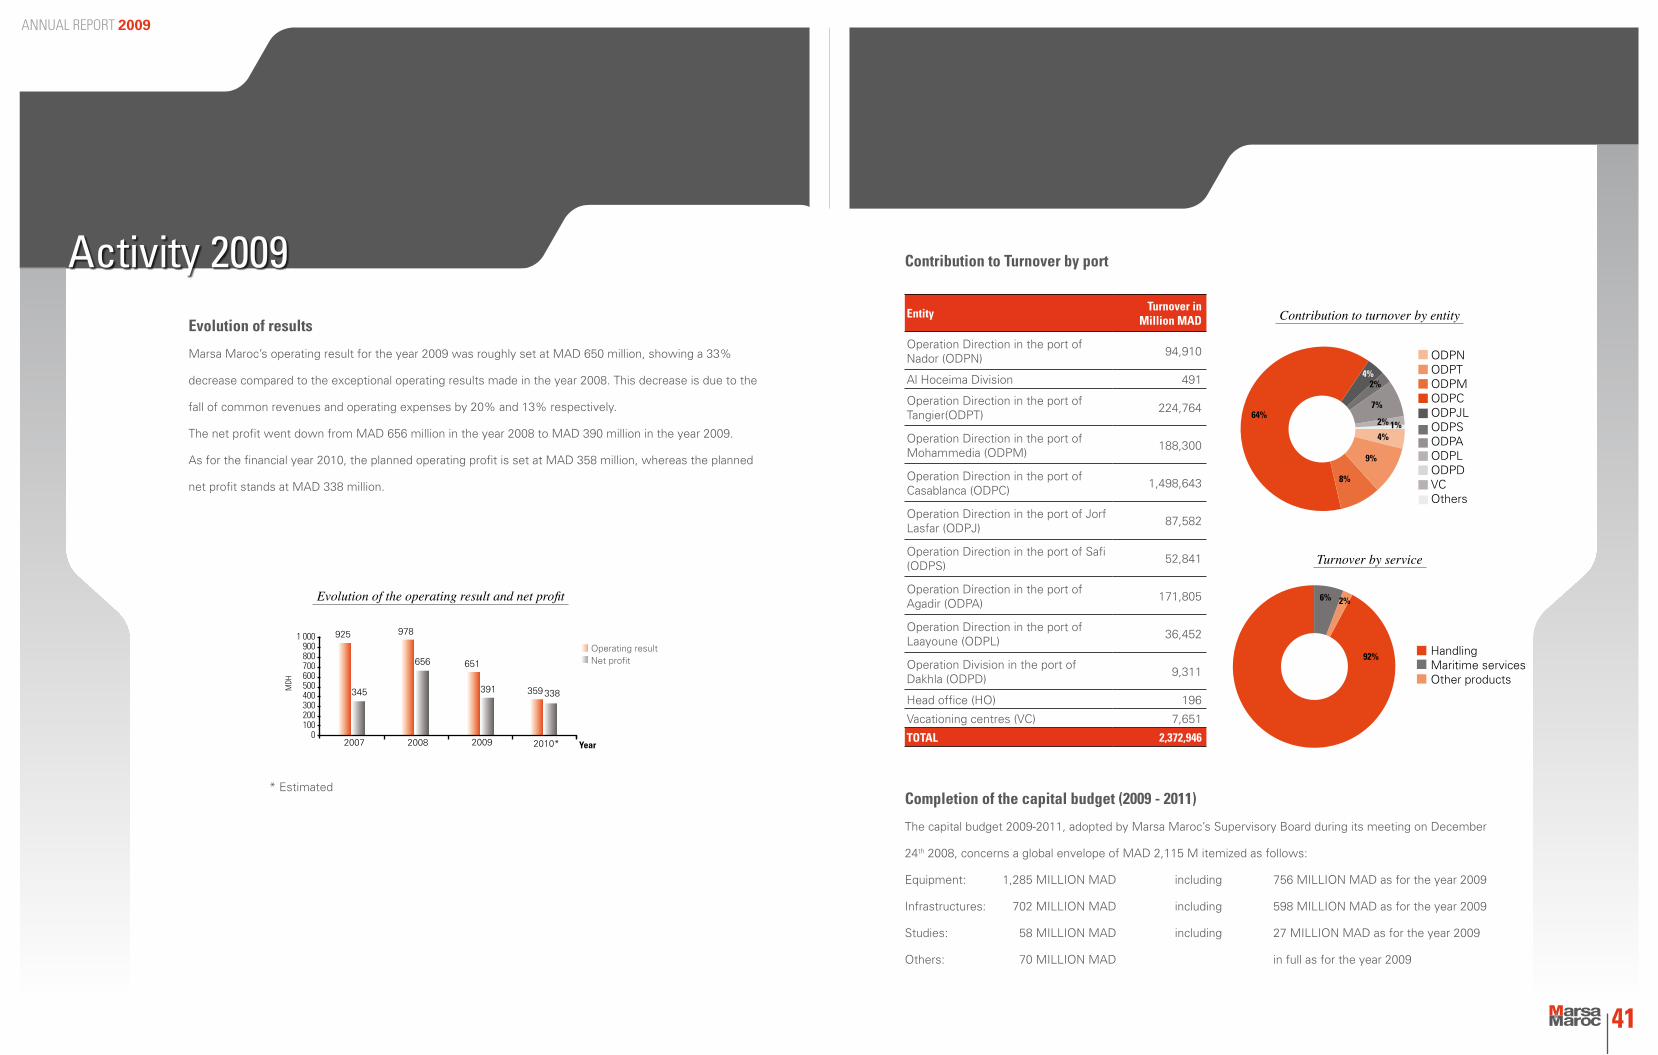
Marsa Maroc’s operating result for the year 2009 was roughly set at MAD 650 million, showing a 33%
decrease compared to the exceptional operating results made in the year 2008. This decrease is due to the
fall of common revenues and operating expenses by 20% and 13% respectively.
The net profit went down from MAD 656 million in the year 2008 to MAD 390 million in the year 2009.
As for the financial year 2010, the planned operating profit is set at MAD 358 million, whereas the planned
net profit stands at MAD 338 million.
Contribution to Turnover by port
Entity Turnover in
Million MAD
Operation Direction in the port of Nador (ODPN)
94,910
Al Hoceima Division 491
Operation Direction in the port of Tangier(ODPT)
224,764
Operation Direction in the port of Mohammedia (ODPM)
188,300
Operation Direction in the port of Casablanca (ODPC)
1,498,643
Operation Direction in the port of Jorf Lasfar (ODPJ)
87,582
Operation Direction in the port of Safi (ODPS)
52,841
Operation Direction in the port of Agadir (ODPA)
171,805
Operation Direction in the port of Laayoune (ODPL)
36,452
Operation Division in the port of Dakhla (ODPD)
9,311
Head office (HO) 196
Vacationing centres (VC) 7,651
TOTAL 2,372,946
Activity 2009Contribution to turnover by entity
ODPNODPTODPMODPCODPJLODPSODPAODPLODPDVCOthers
Turnover by service
2%6%
92% HandlingMaritime services Other products
64%
8%
9%
7%
4%
4%
2% 1%
2%
Completion of the capital budget (2009 - 2011)
The capital budget 2009-2011, adopted by Marsa Maroc’s Supervisory Board during its meeting on December
24th 2008, concerns a global envelope of MAD 2,115 M itemized as follows:
Equipment: 1,285 MILLION MAD including 756 MILLION MAD as for the year 2009
Infrastructures: 702 MILLION MAD including 598 MILLION MAD as for the year 2009
Studies: 58 MILLION MAD including 27 MILLION MAD as for the year 2009
Others: 70 MILLION MAD in full as for the year 2009
Evolution of the operating result and net profit
925
345
978
656 651
391 359 338
1 000900800700600500400300200100
02007 2008 2009 2010*
Operating resultNet profit
Year
* Estimated
MDH
41

Financial Statements
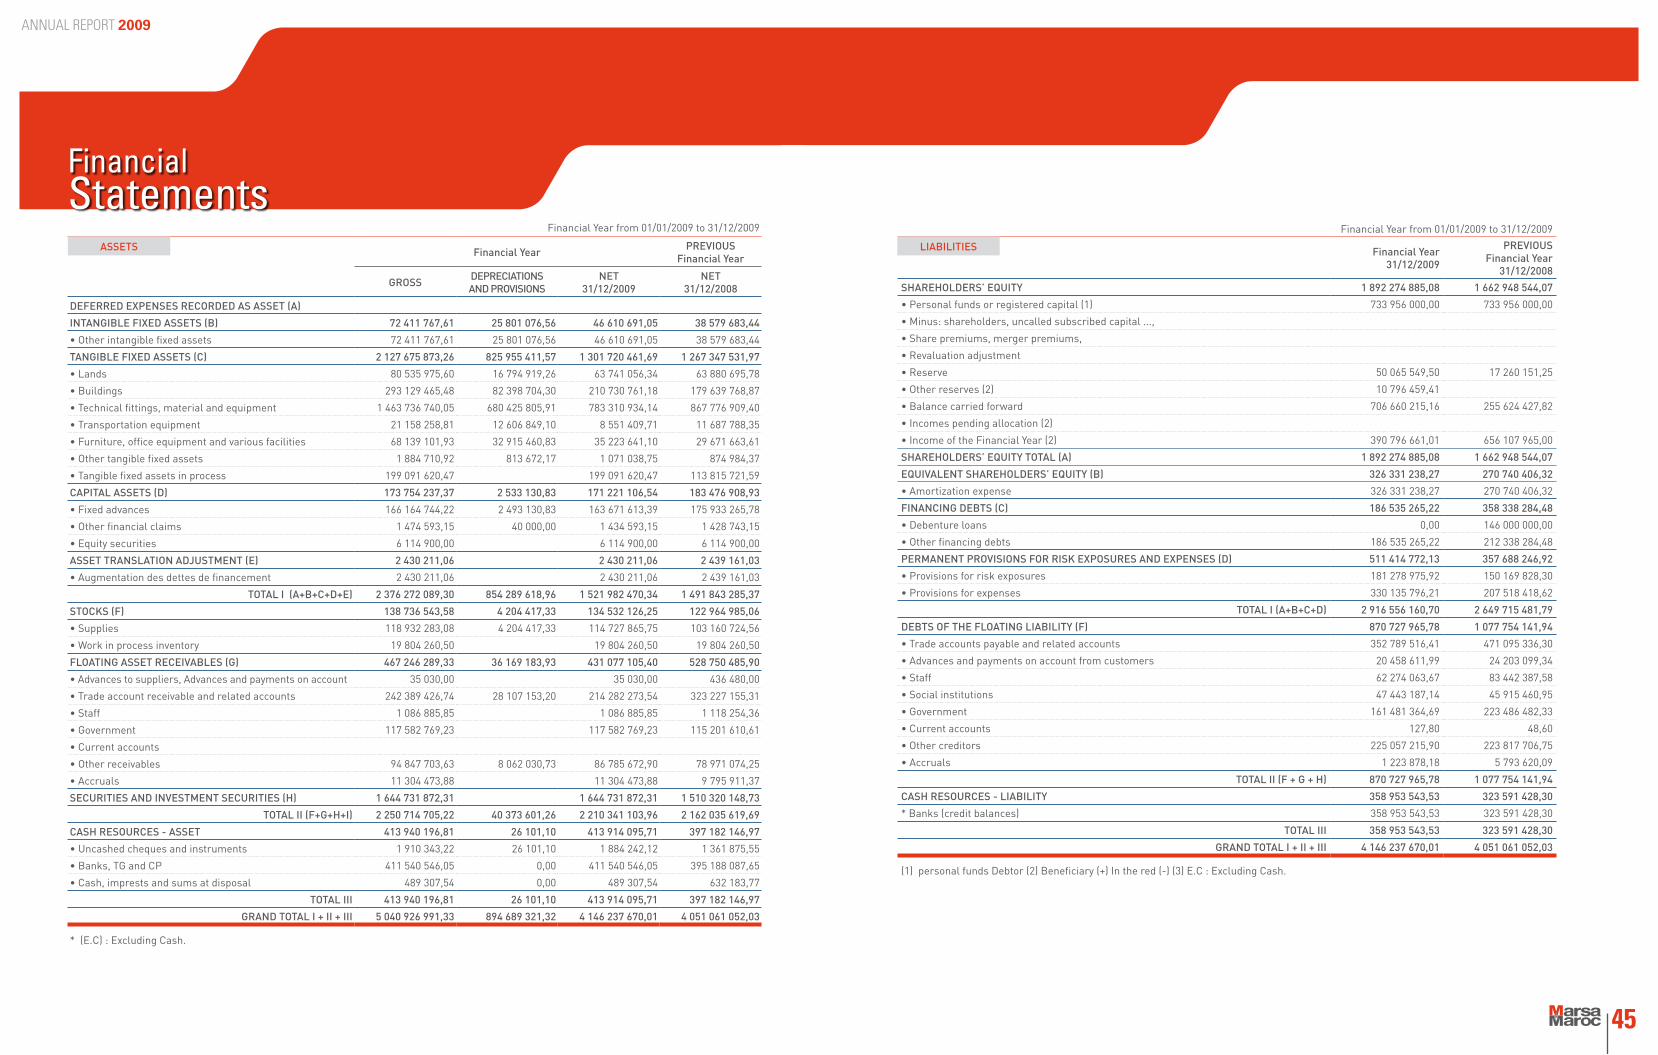
Balance sheet (Assets)
Balance sheet (Liabilities)
Profit and loss account
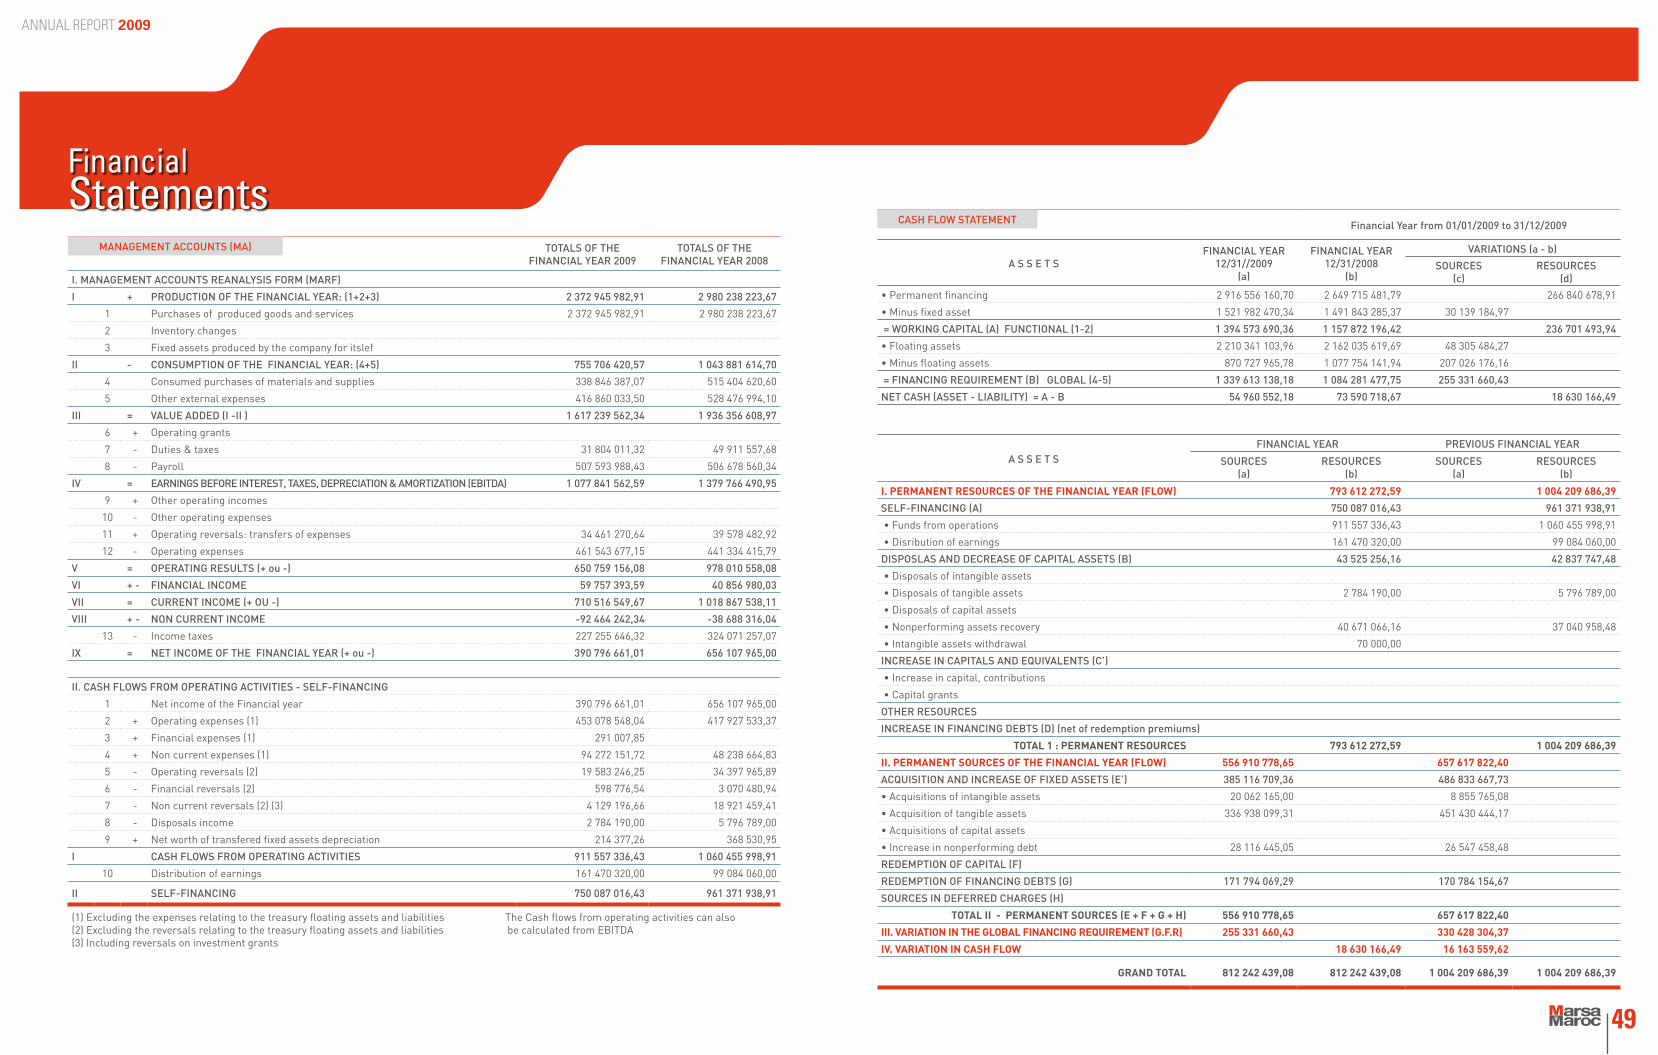
Management balance accounts
Cash flow statement
ANNUAL REPORT 2009
ANNUAL REPORT 2009
Financial Year from 01/01/2009 to 31/12/2009
Financial Year PREVIOUS Financial Year
GROSS DEPRECIATIONSAND PROVISIONS
NET31/12/2009
NET31/12/2008
DEFERRED EXPENSES RECORDED AS ASSET (A)
INTANGIBLE FIXED ASSETS (B) 72 411 767,61 25 801 076,56 46 610 691,05 38 579 683,44
• Other intangible fixed assets 72 411 767,61 25 801 076,56 46 610 691,05 38 579 683,44
TANGIBLE FIXED ASSETS (C) 2 127 675 873,26 825 955 411,57 1 301 720 461,69 1 267 347 531,97
• Lands 80 535 975,60 16 794 919,26 63 741 056,34 63 880 695,78
• Buildings 293 129 465,48 82 398 704,30 210 730 761,18 179 639 768,87
• Technical fittings, material and equipment 1 463 736 740,05 680 425 805,91 783 310 934,14 867 776 909,40
• Transportation equipment 21 158 258,81 12 606 849,10 8 551 409,71 11 687 788,35
• Furniture, office equipment and various facilities 68 139 101,93 32 915 460,83 35 223 641,10 29 671 663,61
• Other tangible fixed assets 1 884 710,92 813 672,17 1 071 038,75 874 984,37
• Tangible fixed assets in process 199 091 620,47 199 091 620,47 113 815 721,59
CAPITAL ASSETS (D) 173 754 237,37 2 533 130,83 171 221 106,54 183 476 908,93
• Fixed advances 166 164 744,22 2 493 130,83 163 671 613,39 175 933 265,78
• Other financial claims 1 474 593,15 40 000,00 1 434 593,15 1 428 743,15
• Equity securities 6 114 900,00 6 114 900,00 6 114 900,00
ASSET TRANSLATION ADJUSTMENT (E) 2 430 211,06 2 430 211,06 2 439 161,03
• Augmentation des dettes de financement 2 430 211,06 2 430 211,06 2 439 161,03
TOTAL I (A+B+C+D+E) 2 376 272 089,30 854 289 618,96 1 521 982 470,34 1 491 843 285,37
STOCKS (F) 138 736 543,58 4 204 417,33 134 532 126,25 122 964 985,06
• Supplies 118 932 283,08 4 204 417,33 114 727 865,75 103 160 724,56
• Work in process inventory 19 804 260,50 19 804 260,50 19 804 260,50
FLOATING ASSET RECEIVABLES (G) 467 246 289,33 36 169 183,93 431 077 105,40 528 750 485,90
• Advances to suppliers, Advances and payments on account 35 030,00 35 030,00 436 480,00
• Trade account receivable and related accounts 242 389 426,74 28 107 153,20 214 282 273,54 323 227 155,31
• Staff 1 086 885,85 1 086 885,85 1 118 254,36
• Government 117 582 769,23 117 582 769,23 115 201 610,61
• Current accounts
• Other receivables 94 847 703,63 8 062 030,73 86 785 672,90 78 971 074,25
• Accruals 11 304 473,88 11 304 473,88 9 795 911,37
SECURITIES AND INVESTMENT SECURITIES (H) 1 644 731 872,31 1 644 731 872,31 1 510 320 148,73
TOTAL II (F+G+H+I) 2 250 714 705,22 40 373 601,26 2 210 341 103,96 2 162 035 619,69
CASH RESOURCES - ASSET 413 940 196,81 26 101,10 413 914 095,71 397 182 146,97
• Uncashed cheques and instruments 1 910 343,22 26 101,10 1 884 242,12 1 361 875,55
• Banks, TG and CP 411 540 546,05 0,00 411 540 546,05 395 188 087,65
• Cash, imprests and sums at disposal 489 307,54 0,00 489 307,54 632 183,77
TOTAL III 413 940 196,81 26 101,10 413 914 095,71 397 182 146,97
GRAND TOTAL I + II + III 5 040 926 991,33 894 689 321,32 4 146 237 670,01 4 051 061 052,03
* (E.C) : Excluding Cash.
Financial Year from 01/01/2009 to 31/12/2009
Financial Year31/12/2009
PREVIOUS Financial Year
31/12/2008
SHAREHOLDERS’ EQUITY 1 892 274 885,08 1 662 948 544,07
• Personal funds or registered capital (1) 733 956 000,00 733 956 000,00
• Minus: shareholders, uncalled subscribed capital ...,
• Share premiums, merger premiums,
• Revaluation adjustment
• Reserve 50 065 549,50 17 260 151,25
• Other reserves (2) 10 796 459,41
• Balance carried forward 706 660 215,16 255 624 427,82
• Incomes pending allocation (2)
• Income of the Financial Year (2) 390 796 661,01 656 107 965,00
SHAREHOLDERS’ EQUITY TOTAL (A) 1 892 274 885,08 1 662 948 544,07
EQUIVALENT SHAREHOLDERS’ EQUITY (B) 326 331 238,27 270 740 406,32
• Amortization expense 326 331 238,27 270 740 406,32
FINANCING DEBTS (C) 186 535 265,22 358 338 284,48
• Debenture loans 0,00 146 000 000,00
• Other financing debts 186 535 265,22 212 338 284,48
PERMANENT PROVISIONS FOR RISK EXPOSURES AND EXPENSES (D) 511 414 772,13 357 688 246,92
• Provisions for risk exposures 181 278 975,92 150 169 828,30
• Provisions for expenses 330 135 796,21 207 518 418,62
TOTAL I (A+B+C+D) 2 916 556 160,70 2 649 715 481,79
DEBTS OF THE FLOATING LIABILITY (F) 870 727 965,78 1 077 754 141,94
• Trade accounts payable and related accounts 352 789 516,41 471 095 336,30
• Advances and payments on account from customers 20 458 611,99 24 203 099,34
• Staff 62 274 063,67 83 442 387,58
• Social institutions 47 443 187,14 45 915 460,95
• Government 161 481 364,69 223 486 482,33
• Current accounts 127,80 48,60
• Other creditors 225 057 215,90 223 817 706,75
• Accruals 1 223 878,18 5 793 620,09
TOTAL II (F + G + H) 870 727 965,78 1 077 754 141,94
CASH RESOURCES - LIABILITY 358 953 543,53 323 591 428,30
* Banks (credit balances) 358 953 543,53 323 591 428,30
TOTAL III 358 953 543,53 323 591 428,30
GRAND TOTAL I + II + III 4 146 237 670,01 4 051 061 052,03
(1) personal funds Debtor (2) Beneficiary (+) In the red (-) (3) E.C : Excluding Cash.
ASSETS LIABILITIES
45
FinancialStatements
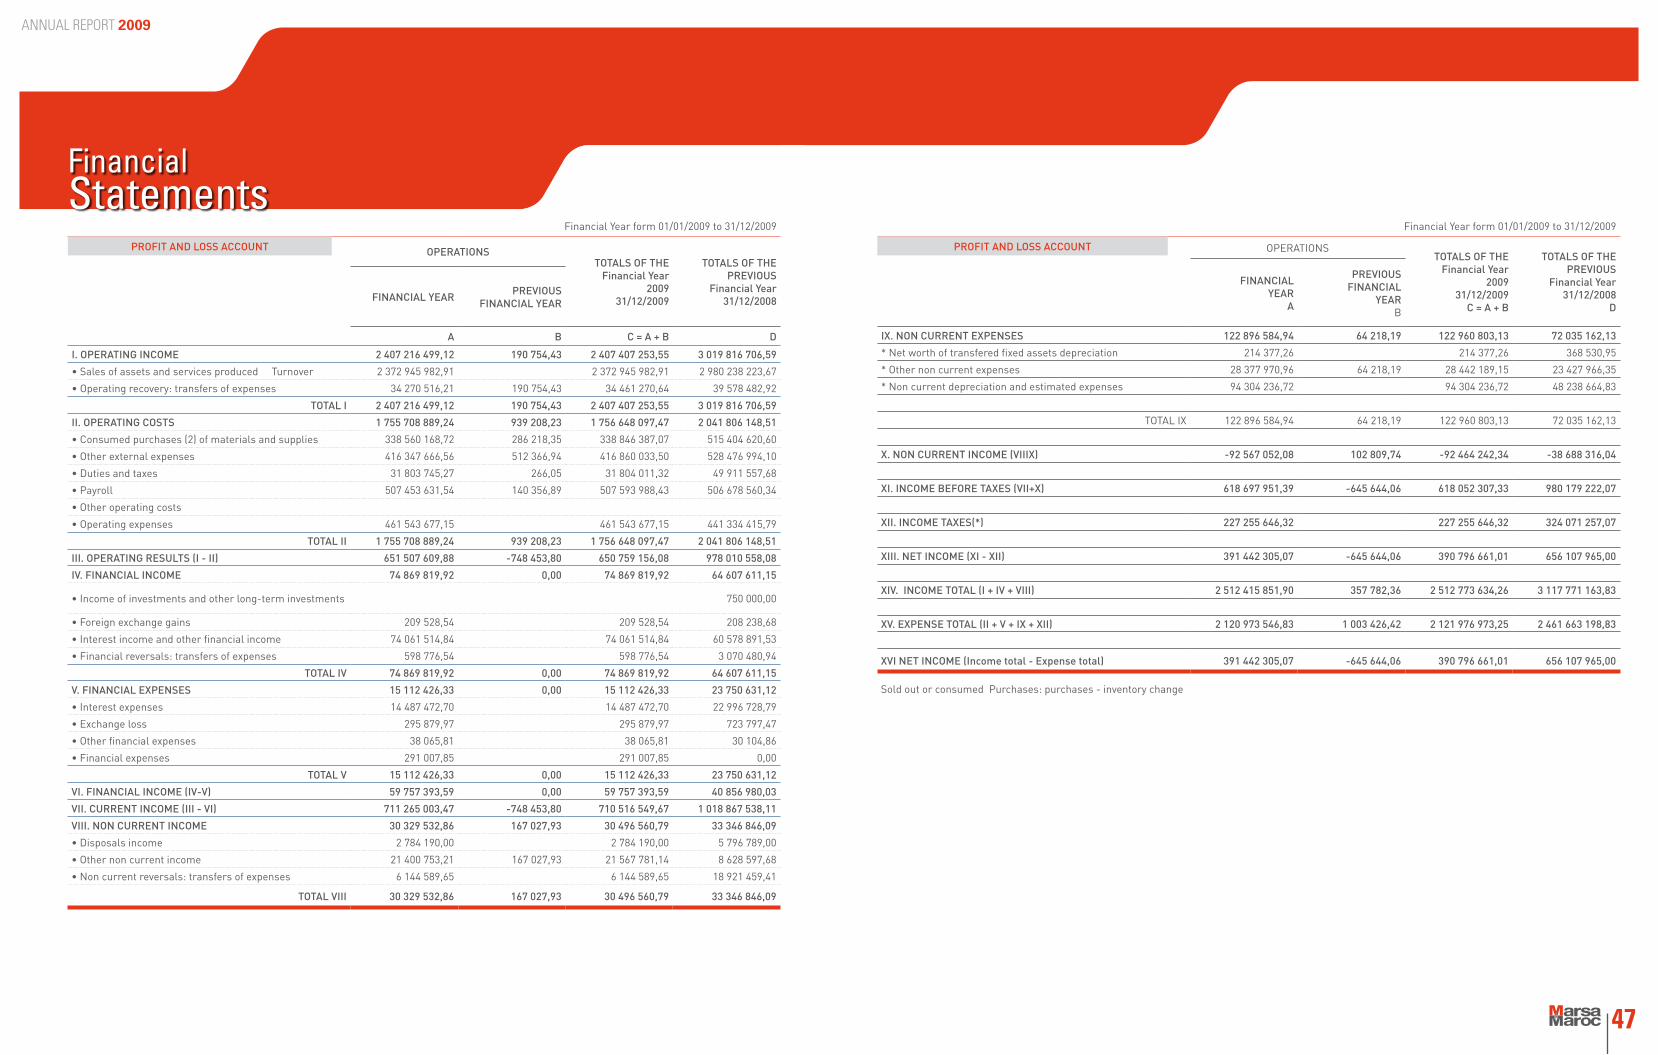
ANNUAL REPORT 2009
Financial Year form 01/01/2009 to 31/12/2009
OPERATIONSTOTALS OF THE
Financial Year2009
31/12/2009
TOTALS OF THE PREVIOUS
Financial Year31/12/2008FINANCIAL YEAR PREVIOUS
FINANCIAL YEAR
A B C = A + B D
I. OPERATING INCOME 2 407 216 499,12 190 754,43 2 407 407 253,55 3 019 816 706,59
• Sales of assets and services produced Turnover 2 372 945 982,91 2 372 945 982,91 2 980 238 223,67
• Operating recovery: transfers of expenses 34 270 516,21 190 754,43 34 461 270,64 39 578 482,92
TOTAL I 2 407 216 499,12 190 754,43 2 407 407 253,55 3 019 816 706,59
II. OPERATING COSTS 1 755 708 889,24 939 208,23 1 756 648 097,47 2 041 806 148,51
• Consumed purchases (2) of materials and supplies 338 560 168,72 286 218,35 338 846 387,07 515 404 620,60
• Other external expenses 416 347 666,56 512 366,94 416 860 033,50 528 476 994,10
• Duties and taxes 31 803 745,27 266,05 31 804 011,32 49 911 557,68
• Payroll 507 453 631,54 140 356,89 507 593 988,43 506 678 560,34
• Other operating costs
• Operating expenses 461 543 677,15 461 543 677,15 441 334 415,79
TOTAL II 1 755 708 889,24 939 208,23 1 756 648 097,47 2 041 806 148,51
III. OPERATING RESULTS (I - II) 651 507 609,88 -748 453,80 650 759 156,08 978 010 558,08
IV. FINANCIAL INCOME 74 869 819,92 0,00 74 869 819,92 64 607 611,15
• Income of investments and other long-term investments 750 000,00
• Foreign exchange gains 209 528,54 209 528,54 208 238,68
• Interest income and other financial income 74 061 514,84 74 061 514,84 60 578 891,53
• Financial reversals: transfers of expenses 598 776,54 598 776,54 3 070 480,94
TOTAL IV 74 869 819,92 0,00 74 869 819,92 64 607 611,15
V. FINANCIAL EXPENSES 15 112 426,33 0,00 15 112 426,33 23 750 631,12
• Interest expenses 14 487 472,70 14 487 472,70 22 996 728,79
• Exchange loss 295 879,97 295 879,97 723 797,47
• Other financial expenses 38 065,81 38 065,81 30 104,86
• Financial expenses 291 007,85 291 007,85 0,00
TOTAL V 15 112 426,33 0,00 15 112 426,33 23 750 631,12
VI. FINANCIAL INCOME (IV-V) 59 757 393,59 0,00 59 757 393,59 40 856 980,03
VII. CURRENT INCOME (III - VI) 711 265 003,47 -748 453,80 710 516 549,67 1 018 867 538,11
VIII. NON CURRENT INCOME 30 329 532,86 167 027,93 30 496 560,79 33 346 846,09
• Disposals income 2 784 190,00 2 784 190,00 5 796 789,00
• Other non current income 21 400 753,21 167 027,93 21 567 781,14 8 628 597,68
• Non current reversals: transfers of expenses 6 144 589,65 6 144 589,65 18 921 459,41
TOTAL VIII 30 329 532,86 167 027,93 30 496 560,79 33 346 846,09
Financial Year form 01/01/2009 to 31/12/2009
OPERATIONSTOTALS OF THE
Financial Year2009
31/12/2009C = A + B
TOTALS OF THE PREVIOUS
Financial Year31/12/2008
D
FINANCIAL YEAR
A
PREVIOUSFINANCIAL
YEARB
IX. NON CURRENT EXPENSES 122 896 584,94 64 218,19 122 960 803,13 72 035 162,13
* Net worth of transfered fixed assets depreciation 214 377,26 214 377,26 368 530,95
* Other non current expenses 28 377 970,96 64 218,19 28 442 189,15 23 427 966,35
* Non current depreciation and estimated expenses 94 304 236,72 94 304 236,72 48 238 664,83
TOTAL IX 122 896 584,94 64 218,19 122 960 803,13 72 035 162,13
X. NON CURRENT INCOME (VIIIX) -92 567 052,08 102 809,74 -92 464 242,34 -38 688 316,04
XI. INCOME BEFORE TAXES (VII+X) 618 697 951,39 -645 644,06 618 052 307,33 980 179 222,07
XII. INCOME TAXES(*) 227 255 646,32 227 255 646,32 324 071 257,07
XIII. NET INCOME (XI - XII) 391 442 305,07 -645 644,06 390 796 661,01 656 107 965,00
XIV. INCOME TOTAL (I + IV + VIII) 2 512 415 851,90 357 782,36 2 512 773 634,26 3 117 771 163,83
XV. EXPENSE TOTAL (II + V + IX + XII) 2 120 973 546,83 1 003 426,42 2 121 976 973,25 2 461 663 198,83
XVI NET INCOME (Income total - Expense total) 391 442 305,07 -645 644,06 390 796 661,01 656 107 965,00
Sold out or consumed Purchases: purchases - inventory change
PROFIT AND LOSS ACCOUNT PROFIT AND LOSS ACCOUNT
47
FinancialStatements
FinancialStatements
ANNUAL REPORT 2009
TOTALS OF THE FINANCIAL YEAR 2009
TOTALS OF THE FINANCIAL YEAR 2008
I. MANAGEMENT ACCOUNTS REANALYSIS FORM (MARF)
I + PRODUCTION OF THE FINANCIAL YEAR: (1+2+3) 2 372 945 982,91 2 980 238 223,67
1 Purchases of produced goods and services 2 372 945 982,91 2 980 238 223,67
2 Inventory changes
3 Fixed assets produced by the company for itslef
II - CONSUMPTION OF THE FINANCIAL YEAR: (4+5) 755 706 420,57 1 043 881 614,70
4 Consumed purchases of materials and supplies 338 846 387,07 515 404 620,60
5 Other external expenses 416 860 033,50 528 476 994,10
III = VALUE ADDED (I -II ) 1 617 239 562,34 1 936 356 608,97
6 + Operating grants
7 - Duties & taxes 31 804 011,32 49 911 557,68
8 - Payroll 507 593 988,43 506 678 560,34
IV = EARNINGS BEFORE INTEREST, TAXES, DEPRECIATION & AMORTIZATION (EBITDA) 1 077 841 562,59 1 379 766 490,95
9 + Other operating incomes
10 - Other operating expenses
11 + Operating reversals: transfers of expenses 34 461 270,64 39 578 482,92
12 - Operating expenses 461 543 677,15 441 334 415,79
V = OPERATING RESULTS (+ ou -) 650 759 156,08 978 010 558,08
VI + - FINANCIAL INCOME 59 757 393,59 40 856 980,03
VII = CURRENT INCOME (+ OU -) 710 516 549,67 1 018 867 538,11
VIII + - NON CURRENT INCOME -92 464 242,34 -38 688 316,04
13 - Income taxes 227 255 646,32 324 071 257,07
IX = NET INCOME OF THE FINANCIAL YEAR (+ ou -) 390 796 661,01 656 107 965,00
II. CASH FLOWS FROM OPERATING ACTIVITIES - SELF-FINANCING
1 Net income of the Financial year 390 796 661,01 656 107 965,00
2 + Operating expenses (1) 453 078 548,04 417 927 533,37
3 + Financial expenses (1) 291 007,85
4 + Non current expenses (1) 94 272 151,72 48 238 664,83
5 - Operating reversals (2) 19 583 246,25 34 397 965,89
6 - Financial reversals (2) 598 776,54 3 070 480,94
7 - Non current reversals (2) (3) 4 129 196,66 18 921 459,41
8 - Disposals income 2 784 190,00 5 796 789,00
9 + Net worth of transfered fixed assets depreciation 214 377,26 368 530,95
I CASH FLOWS FROM OPERATING ACTIVITIES 911 557 336,43 1 060 455 998,91
10 Distribution of earnings 161 470 320,00 99 084 060,00
II SELF-FINANCING 750 087 016,43 961 371 938,91
(1) Excluding the expenses relating to the treasury floating assets and liabilities The Cash flows from operating activities can also (2) Excluding the reversals relating to the treasury floating assets and liabilities be calculated from EBITDA (3) Including reversals on investment grants
Financial Year from 01/01/2009 to 31/12/2009
A S S E T SFINANCIAL YEAR
12/31//2009(a)
FINANCIAL YEAR 12/31/2008
(b)
VARIATIONS (a - b)
SOURCES(c)
RESOURCES(d)
• Permanent financing 2 916 556 160,70 2 649 715 481,79 266 840 678,91
• Minus fixed asset 1 521 982 470,34 1 491 843 285,37 30 139 184,97
= WORKING CAPITAL (A) FUNCTIONAL (1-2) 1 394 573 690,36 1 157 872 196,42 236 701 493,94
• Floating assets 2 210 341 103,96 2 162 035 619,69 48 305 484,27
• Minus floating assets 870 727 965,78 1 077 754 141,94 207 026 176,16
= FINANCING REQUIREMENT (B) GLOBAL (4-5) 1 339 613 138,18 1 084 281 477,75 255 331 660,43
NET CASH (ASSET - LIABILITY) = A - B 54 960 552,18 73 590 718,67 18 630 166,49
A S S E T SFINANCIAL YEAR PREVIOUS FINANCIAL YEAR
SOURCES (a)
RESOURCES (b)
SOURCES (a)
RESOURCES (b)
I. PERMANENT RESOURCES OF THE FINANCIAL YEAR (FLOW) 793 612 272,59 1 004 209 686,39
SELF-FINANCING (A) 750 087 016,43 961 371 938,91
• Funds from operations 911 557 336,43 1 060 455 998,91
• Disribution of earnings 161 470 320,00 99 084 060,00
DISPOSLAS AND DECREASE OF CAPITAL ASSETS (B) 43 525 256,16 42 837 747,48
• Disposals of intangible assets
• Disposals of tangible assets 2 784 190,00 5 796 789,00
• Disposals of capital assets
• Nonperforming assets recovery 40 671 066,16 37 040 958,48
• Intangible assets withdrawal 70 000,00
INCREASE IN CAPITALS AND EQUIVALENTS (C’)
• Increase in capital, contributions
• Capital grants
OTHER RESOURCES
INCREASE IN FINANCING DEBTS (D) (net of redemption premiums)
TOTAL 1 : PERMANENT RESOURCES 793 612 272,59 1 004 209 686,39
II. PERMANENT SOURCES OF THE FINANCIAL YEAR (FLOW) 556 910 778,65 657 617 822,40
ACQUISITION AND INCREASE OF FIXED ASSETS (E’) 385 116 709,36 486 833 667,73
• Acquisitions of intangible assets 20 062 165,00 8 855 765,08
• Acquisition of tangible assets 336 938 099,31 451 430 444,17
• Acquisitions of capital assets
• Increase in nonperforming debt 28 116 445,05 26 547 458,48
REDEMPTION OF CAPITAL (F)
REDEMPTION OF FINANCING DEBTS (G) 171 794 069,29 170 784 154,67
SOURCES IN DEFERRED CHARGES (H)
TOTAL II - PERMANENT SOURCES (E + F + G + H) 556 910 778,65 657 617 822,40
III. VARIATION IN THE GLOBAL FINANCING REQUIREMENT (G.F.R) 255 331 660,43 330 428 304,37
IV. VARIATION IN CASH FLOW 18 630 166,49 16 163 559,62
GRAND TOTAL 812 242 439,08 812 242 439,08 1 004 209 686,39 1 004 209 686,39
MANAGEMENT ACCOUNTS (MA)
CASH FLOW STATEMENT
49

Contacts
ANNUAL REPORT 2009
53
ANNUAL REPORT 2009
Contacts
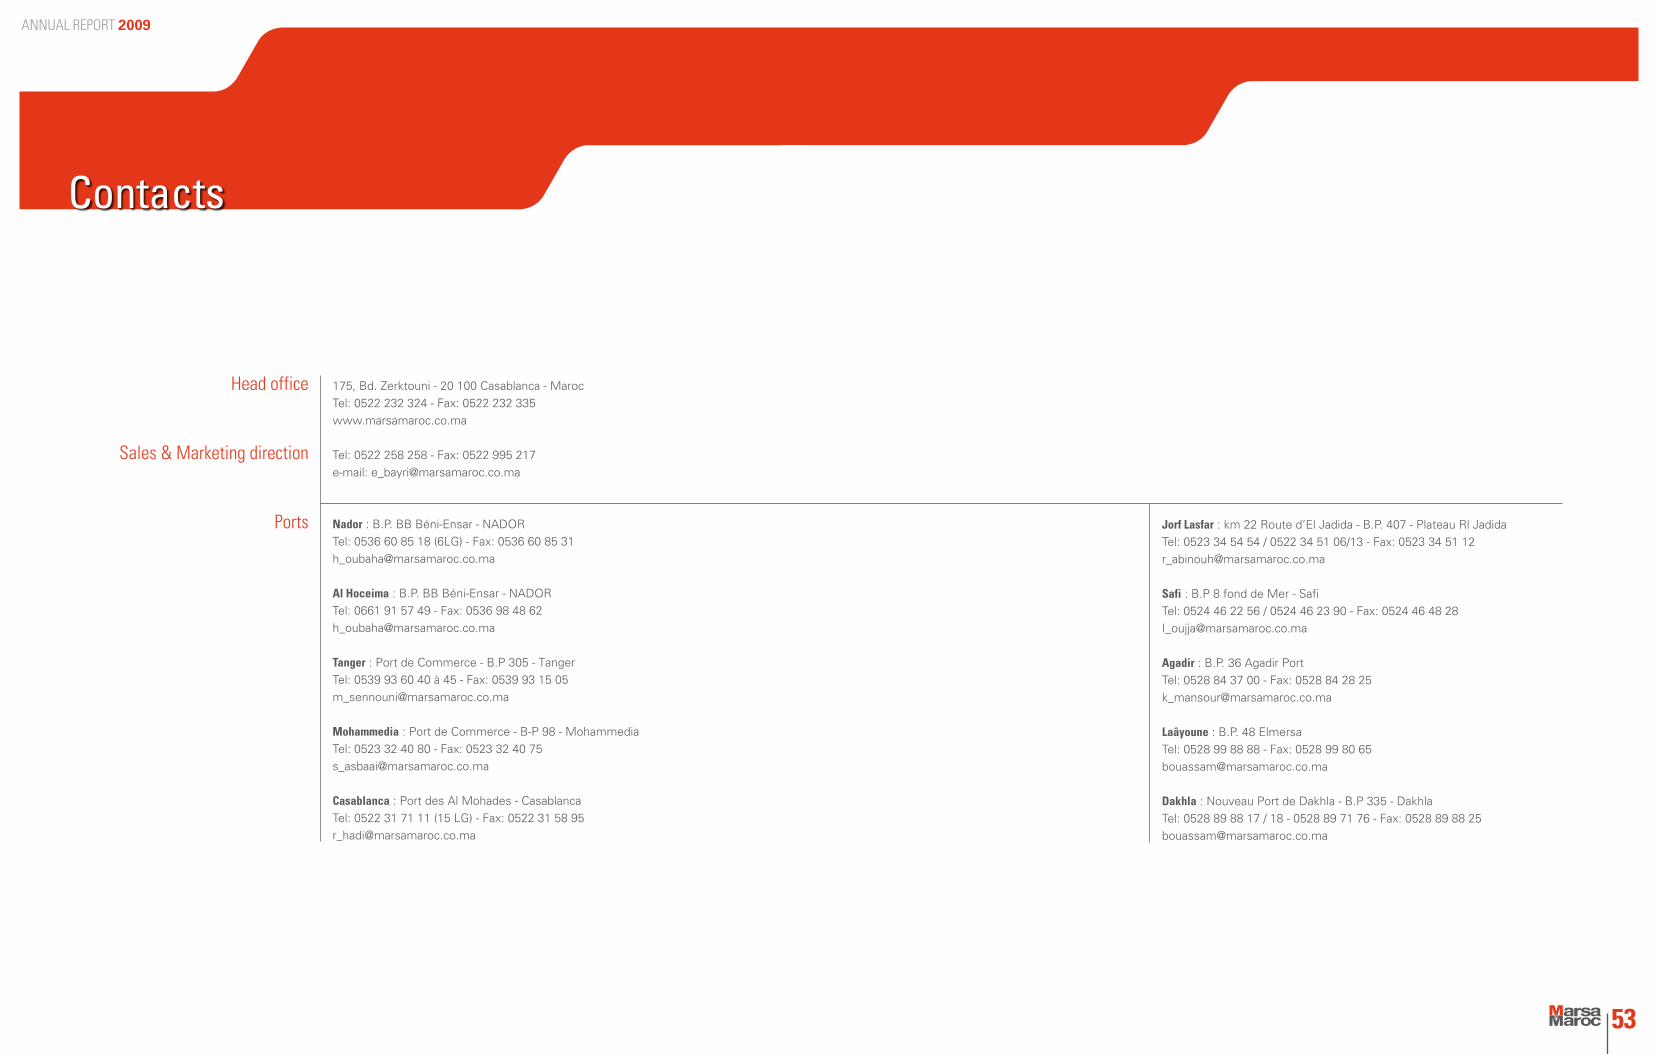
Head office 175, Bd. Zerktouni - 20 100 Casablanca - Maroc
Tel: 0522 232 324 - Fax: 0522 232 335
www.marsamaroc.co.ma
Sales & Marketing direction Tel: 0522 258 258 - Fax: 0522 995 217
e-mail: [email protected]
Ports Nador : B.P. BB Béni-Ensar - NADOR
Tel: 0536 60 85 18 (6LG) - Fax: 0536 60 85 31
Al Hoceima : B.P. BB Béni-Ensar - NADOR
Tel: 0661 91 57 49 - Fax: 0536 98 48 62
Tanger : Port de Commerce - B.P 305 - Tanger
Tel: 0539 93 60 40 à 45 - Fax: 0539 93 15 05
Mohammedia : Port de Commerce - B-P 98 - Mohammedia
Tel: 0523 32 40 80 - Fax: 0523 32 40 75
Casablanca : Port des Al Mohades - Casablanca
Tel: 0522 31 71 11 (15 LG) - Fax: 0522 31 58 95
Jorf Lasfar : km 22 Route d’El Jadida - B.P. 407 - Plateau Rl Jadida
Tel: 0523 34 54 54 / 0522 34 51 06/13 - Fax: 0523 34 51 12
Safi : B.P 8 fond de Mer - Safi
Tel: 0524 46 22 56 / 0524 46 23 90 - Fax: 0524 46 48 28
Agadir : B.P. 36 Agadir Port
Tel: 0528 84 37 00 - Fax: 0528 84 28 25
Laâyoune : B.P. 48 Elmersa
Tel: 0528 99 88 88 - Fax: 0528 99 80 65
Dakhla : Nouveau Port de Dakhla - B.P 335 - Dakhla
Tel: 0528 89 88 17 / 18 - 0528 89 71 76 - Fax: 0528 89 88 25


Head office
175, Bd Zerktouni - 20 100 Casablanca - Maroc
Tel: 0522 232 324
Fax: 0522 232 335
www.marsamaroc.co.ma