Embed Size (px)
Citation preview
Trends and DevelopmentsTransport & Logistics sector Morocco
Presentation byMEYS Emerging Markets Research
Country overview
5,9
4,23,8
5,2
3
4,7
2,4
4,3
1,2
4,0
2,8
2008 2009 2010 2011 2012 2013 2014 2015 2016 2017e 2018p
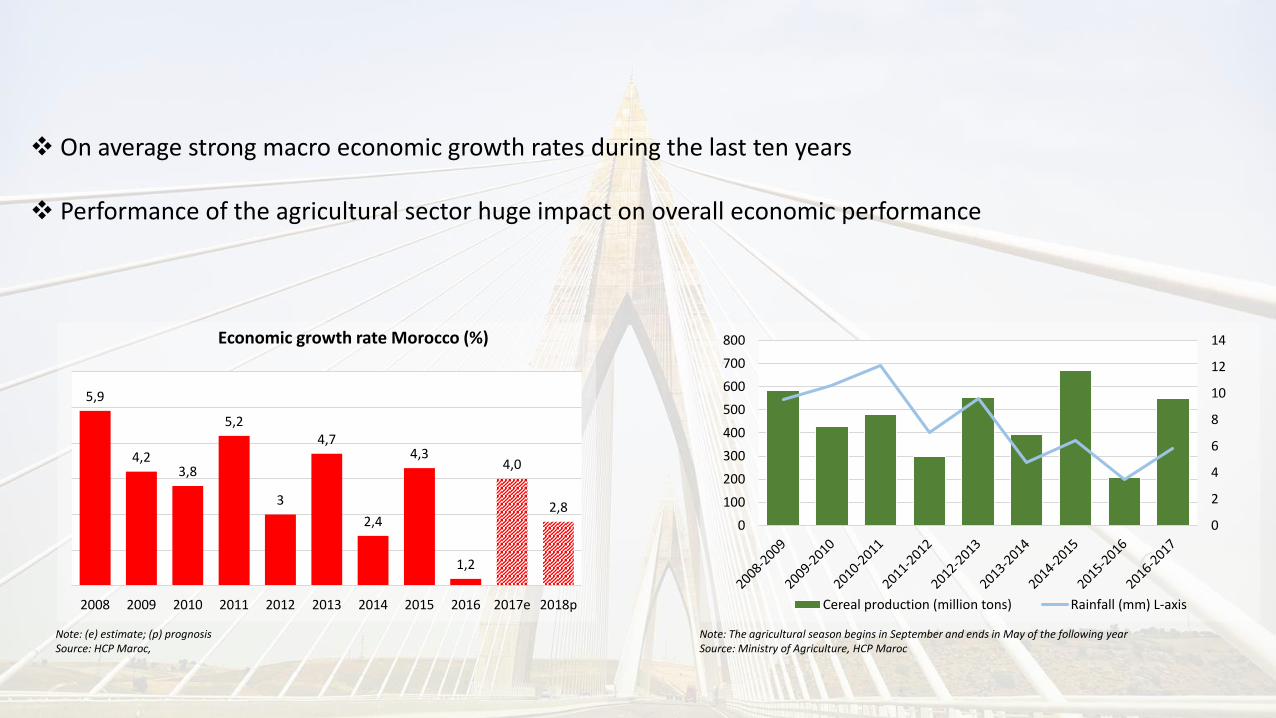
Economic growth rate Morocco (%)
0
2
4
6
8
10
12
14
0
100
200
300
400
500
600
700
800
Cereal production (million tons) Rainfall (mm) L-axis
Note: (e) estimate; (p) prognosisSource: HCP Maroc,
Note: The agricultural season begins in September and ends in May of the following yearSource: Ministry of Agriculture, HCP Maroc
❖ On average strong macro economic growth rates during the last ten years
❖ Performance of the agricultural sector huge impact on overall economic performance
15.494
19.306
20.248
20.944
22.742
23.901
27.669
28.953
30.102
34.271
40.154
45.847
74.254
10.000 20.000 30.000 40.000 50.000 60.000 70.000 80.000
Drâa-Tafilalet
Marrakech-Safi
Oriental
Fès-Meknès
Béni Mellal-Khénifra
Souss-Massa
Tanger-Tétouan-Al Hoceima
National
Guelmim-Oued Noun
Rabat-Salé-Kénitra
Laâyoune-Saguia al Hamra
Casablanca-Settat
Dakhla-Oued ed Dahab
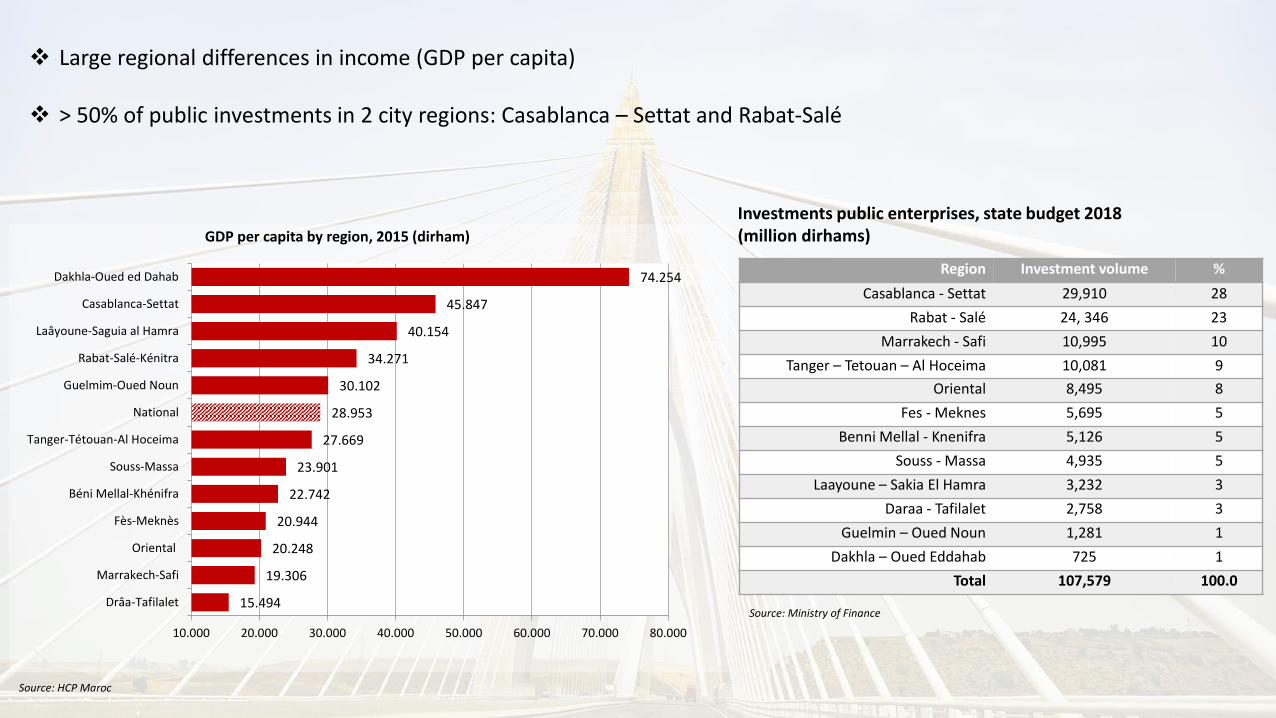
GDP per capita by region, 2015 (dirham)
Region Investment volume %
Casablanca - Settat 29,910 28
Rabat - Salé 24, 346 23
Marrakech - Safi 10,995 10
Tanger – Tetouan – Al Hoceima 10,081 9
Oriental 8,495 8
Fes - Meknes 5,695 5
Benni Mellal - Knenifra 5,126 5
Souss - Massa 4,935 5
Laayoune – Sakia El Hamra 3,232 3
Daraa - Tafilalet 2,758 3
Guelmin – Oued Noun 1,281 1
Dakhla – Oued Eddahab 725 1
Total 107,579 100.0
Investments public enterprises, state budget 2018(million dirhams)
Source: HCP Maroc
Source: Ministry of Finance
❖ Large regional differences in income (GDP per capita)
❖ > 50% of public investments in 2 city regions: Casablanca – Settat and Rabat-Salé
Foreign trade
-300
-200
-100
-
100
200
300
400
500
600
700
2010 2011 2012 2013 2014 2015 2016
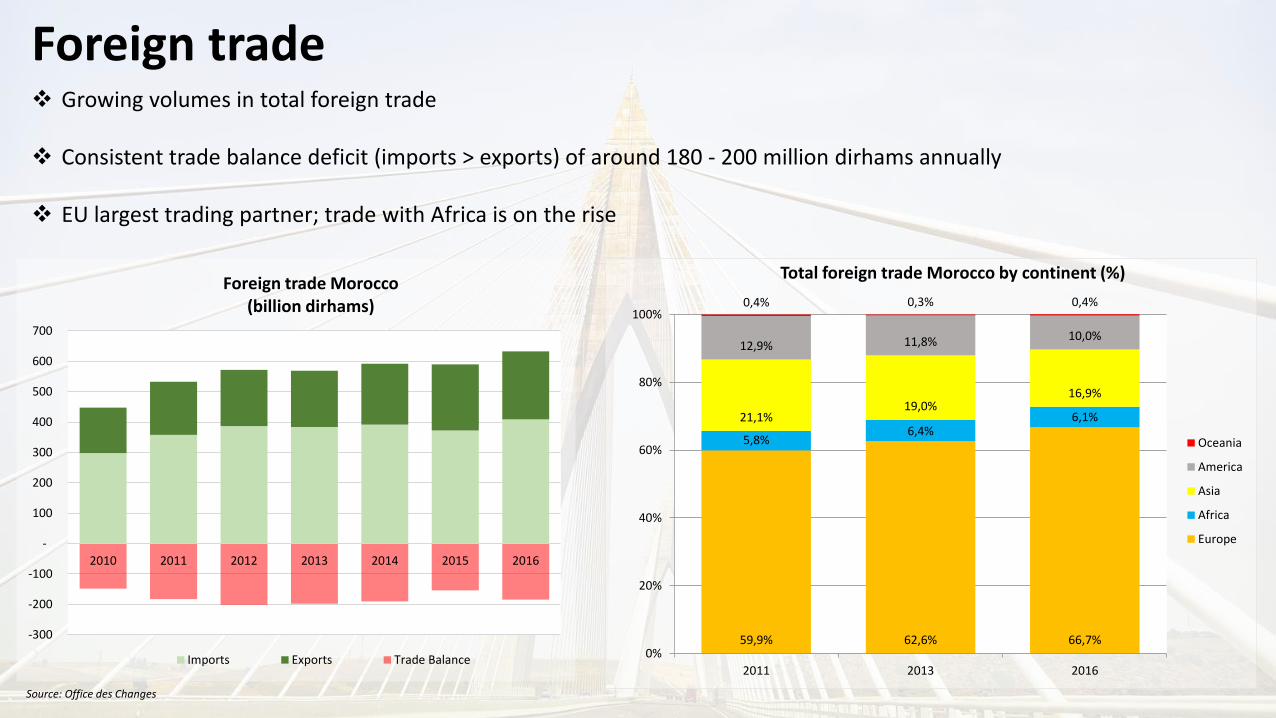
Foreign trade Morocco(billion dirhams)
Imports Exports Trade Balance
59,9% 62,6% 66,7%
5,8%6,4%
6,1%21,1%19,0%
16,9%
12,9% 11,8% 10,0%
0,4% 0,3% 0,4%
0%
20%
40%
60%
80%
100%
2011 2013 2016
Total foreign trade Morocco by continent (%)
Oceania
America
Asia
Africa
Europe
❖ Growing volumes in total foreign trade
❖ Consistent trade balance deficit (imports > exports) of around 180 - 200 million dirhams annually
❖ EU largest trading partner; trade with Africa is on the rise
Source: Office des Changes
Country
Top 20
% in foreign trade Morocco
2016
% in foreign trade Morocco,
2010
Spain 18.4% 12.7%
France 16.0% 17.9%
China 6.3% 6.0%
USA 5.3% 5.9%
Italy 5.1% 5.5%
Germany 4.8% 4.1%
Turkey 4.0% 2.1%
Portugal 2.4% 1.5%
UK 2.3% 2.4%
India 2.2% 3.1%
The Netherlands 2.0% 2.1%
Brazil 1.9% 2.7%
Russia 1.9% 2.9%
Belgium 1.5% 1.8%
Saudi Arabia 1.4% 4.0%
South Korea 1.4% 1.0%
Algeria 1.3% 1.8%
UAE 1.2% 0.6%
Romania 1.2% 0.4%
Japan 1.1% 1.1%
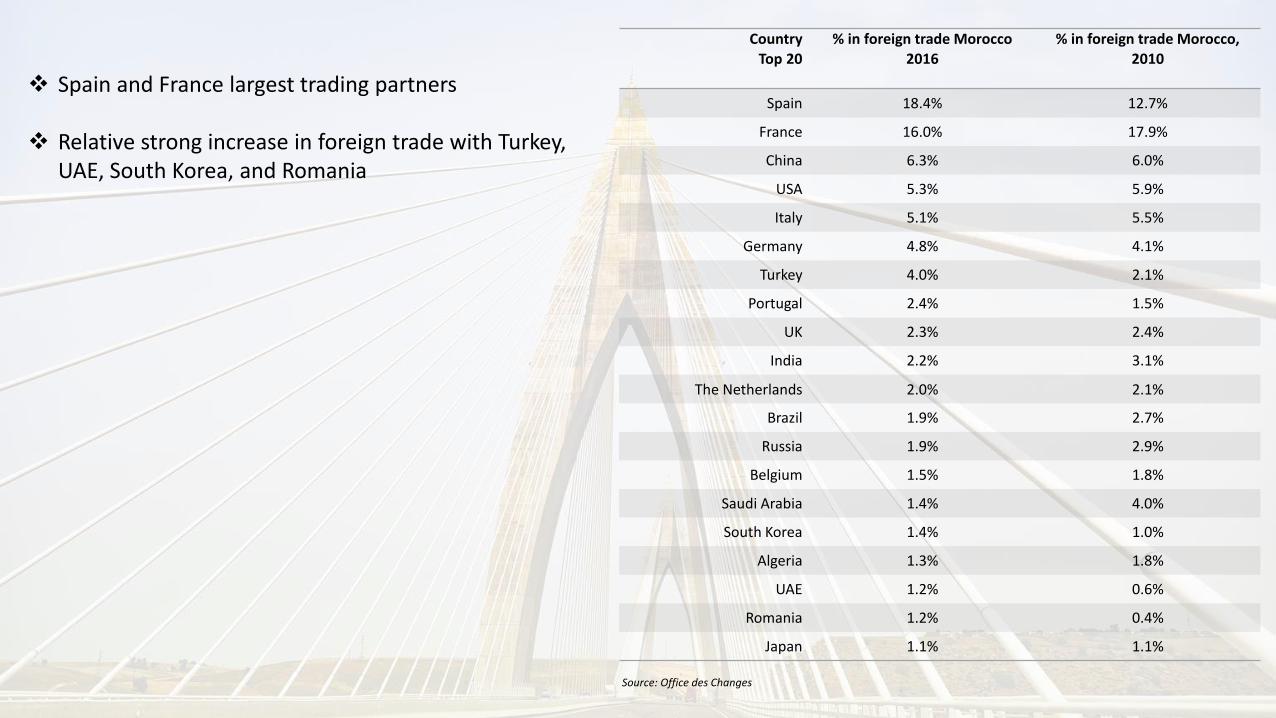
❖ Spain and France largest trading partners
❖ Relative strong increase in foreign trade with Turkey, UAE, South Korea, and Romania
Source: Office des Changes
Foreign Direct Investments
-30,0
-20,0
-10,0
-
10,0
20,0
30,0
40,0
2003 2004 2005 2006 2007 2008 2009 2010 2011 2012 2013 2014 2015 2016
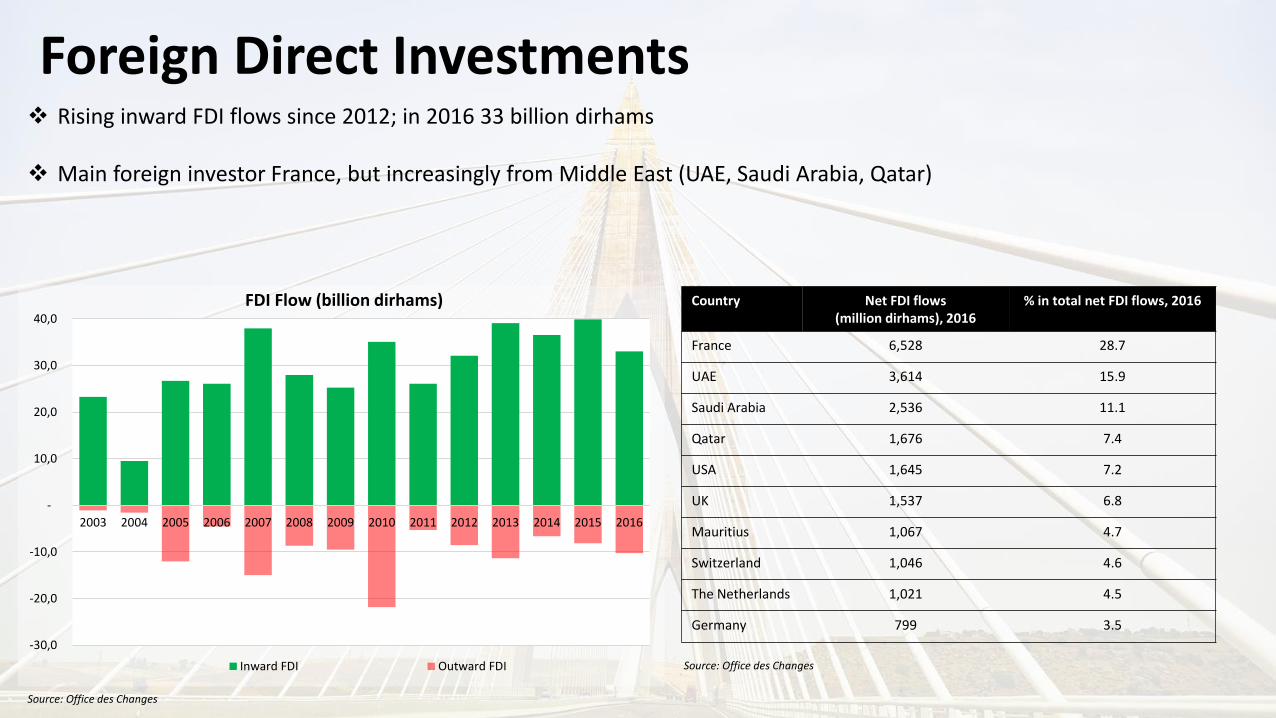
FDI Flow (billion dirhams)
Inward FDI Outward FDI
❖ Rising inward FDI flows since 2012; in 2016 33 billion dirhams
❖ Main foreign investor France, but increasingly from Middle East (UAE, Saudi Arabia, Qatar)
Source: Office des Changes
Source: Office des Changes
Country Net FDI flows(million dirhams), 2016
% in total net FDI flows, 2016
France 6,528 28.7
UAE 3,614 15.9
Saudi Arabia 2,536 11.1
Qatar 1,676 7.4
USA 1,645 7.2
UK 1,537 6.8
Mauritius 1,067 4.7
Switzerland 1,046 4.6
The Netherlands 1,021 4.5
Germany 799 3.5
0,7%
0,9%
3,0%
4,3%
2,4%
28,6%
3,5%
15,5%
24,0%
12,6%
3,4%
4,4%
4,7%
5,3%
6,0%
6,9%
8,3%
9,9%
22,0%
25,4%
0% 5% 10% 15% 20% 25% 30%
Public Works
Holding
Trade
Other services
Energy and Mining
Telecommunications
Banking
Tourism
Industry
Real Estate
Inward FDI flows by sectorin total FDI flows (%)
2008 - 2015 2000 - 2007
Source: Ministry of Finance
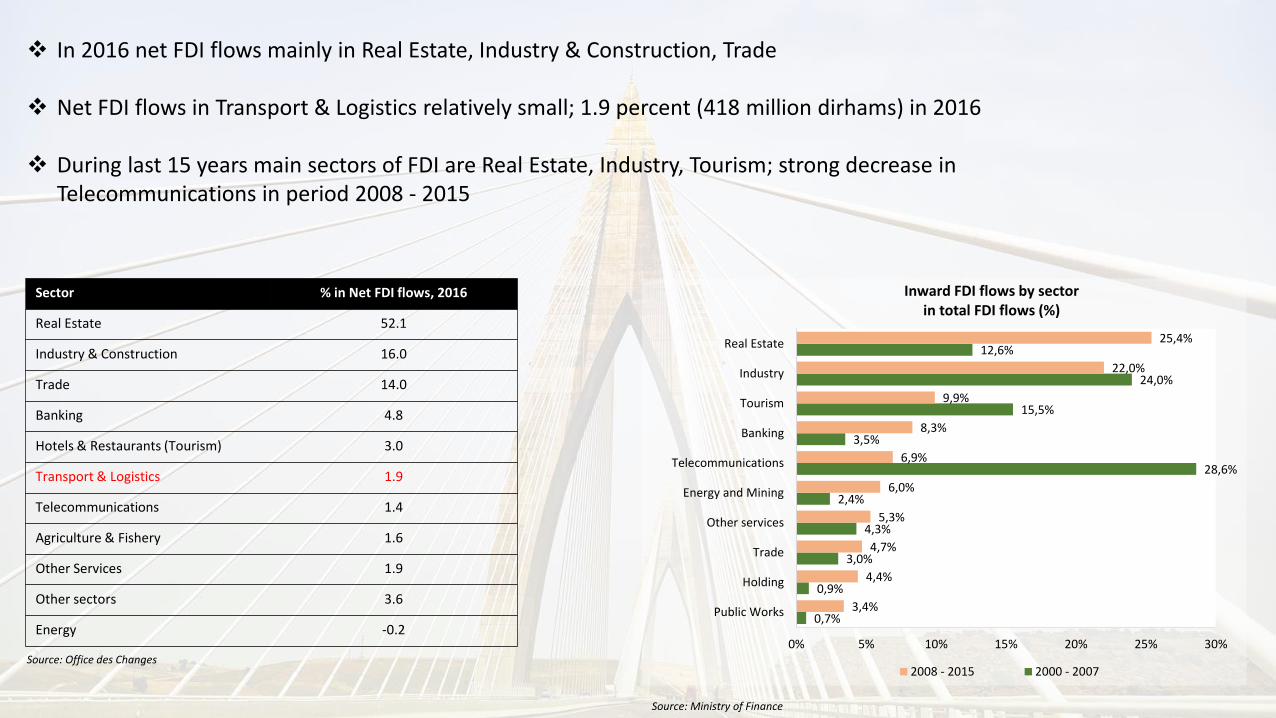
❖ In 2016 net FDI flows mainly in Real Estate, Industry & Construction, Trade
❖ Net FDI flows in Transport & Logistics relatively small; 1.9 percent (418 million dirhams) in 2016
❖ During last 15 years main sectors of FDI are Real Estate, Industry, Tourism; strong decrease in Telecommunications in period 2008 - 2015
Sector % in Net FDI flows, 2016
Real Estate 52.1
Industry & Construction 16.0
Trade 14.0
Banking 4.8
Hotels & Restaurants (Tourism) 3.0
Transport & Logistics 1.9
Telecommunications 1.4
Agriculture & Fishery 1.6
Other Services 1.9
Other sectors 3.6
Energy -0.2
Source: Office des Changes
Developments in Transport & Logistics Morocco
-1,0%
0,0%
1,0%
2,0%
3,0%
4,0%
5,0%
6,0%
Annual growth rate value addedTransport sector (%)
-
20.000
40.000
60.000
80.000
100.000
120.000
2010 2011 2012 2013 2014 2015 2016
Domestic freight transport(x 1000 tons)
Road TIR Rail Air Maritime
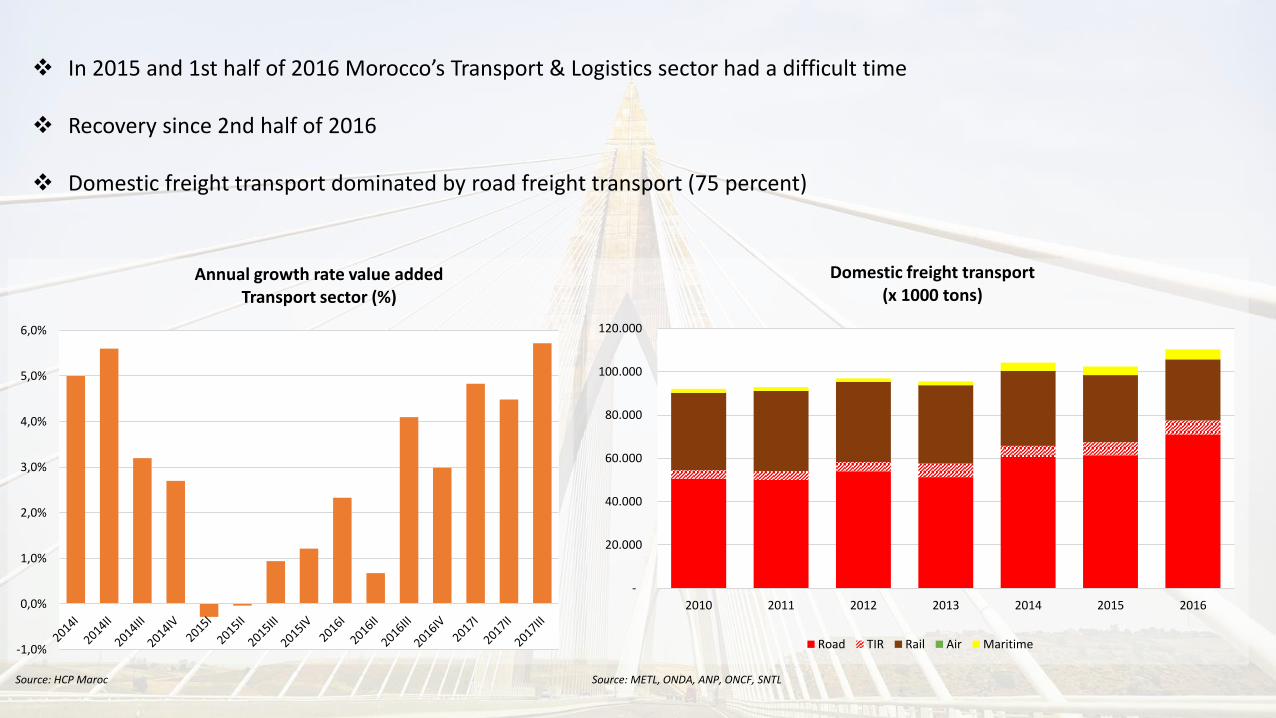
❖ In 2015 and 1st half of 2016 Morocco’s Transport & Logistics sector had a difficult time
❖ Recovery since 2nd half of 2016
❖ Domestic freight transport dominated by road freight transport (75 percent)
Source: HCP Maroc Source: METL, ONDA, ANP, ONCF, SNTL
3.397 2.401
5.993 7.500
6.245 5.898 5.796 7.085 6.828
3.735 4.575
3.977
9.019
3.278 4.270 4.394
7.672
4.035
9.894 9.076
7.912
6.506
3.854 4.928 4.225
10.631
12.971 2.926
1.903
2.413
3.167
1.125
2.945 3.867
3.816
3.700
1.854
303
82
362
262
96 316
2.099
1.229
-
5.000
10.000
15.000
20.000
25.000
30.000
35.000
2010 2011 2012 2013 2014 2015 2016 2017p 2018p
Public investments by sector (million dirhams)
Rail Maritime* Road Air Other
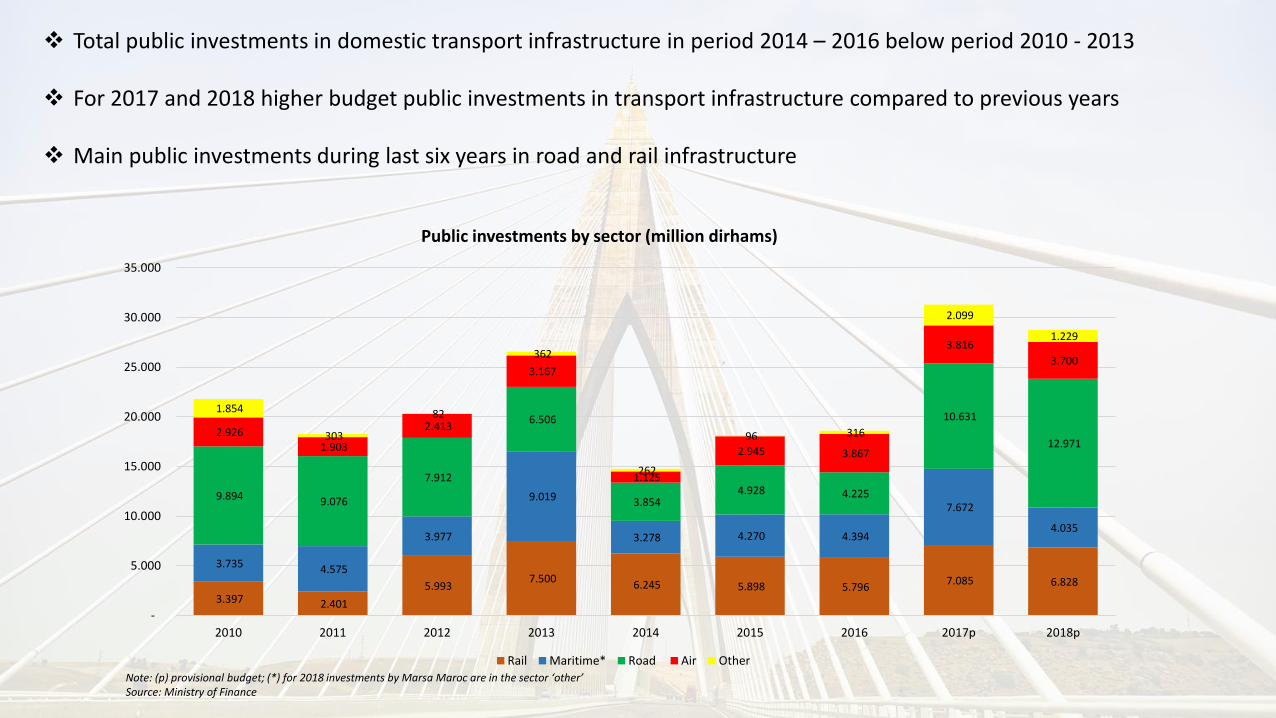
❖ Total public investments in domestic transport infrastructure in period 2014 – 2016 below period 2010 - 2013
❖ For 2017 and 2018 higher budget public investments in transport infrastructure compared to previous years
❖ Main public investments during last six years in road and rail infrastructure
Note: (p) provisional budget; (*) for 2018 investments by Marsa Maroc are in the sector ‘other’Source: Ministry of Finance
Maritime transport
50.000
55.000
60.000
65.000
70.000
75.000
80.000
85.000
90.000
95.000
2010 2011 2012 2013 2014 2015 2016
Global cargo throughput (x 1.000 tons)(excluding transshipment)
Tanger Med
Port traffic excl. Tanger Med
651 1.047 520 446
1.023 743 899 746
2.754
1.532
2.700
1.263
1.595
2.389
1.218
2.892
3.371 2.994
3.144
1.824
1.320
2.177
1.518
589
95 418
3.200
2.183
0
1.000
2.000
3.000
4.000
5.000
6.000
7.000
8.000
2007 2008 2009 2010 2011 2012 2013 2014 2015 2016 2017p 2018p
Public investments in Morocco's ports(million dirhams)
ANP TMSA NWM
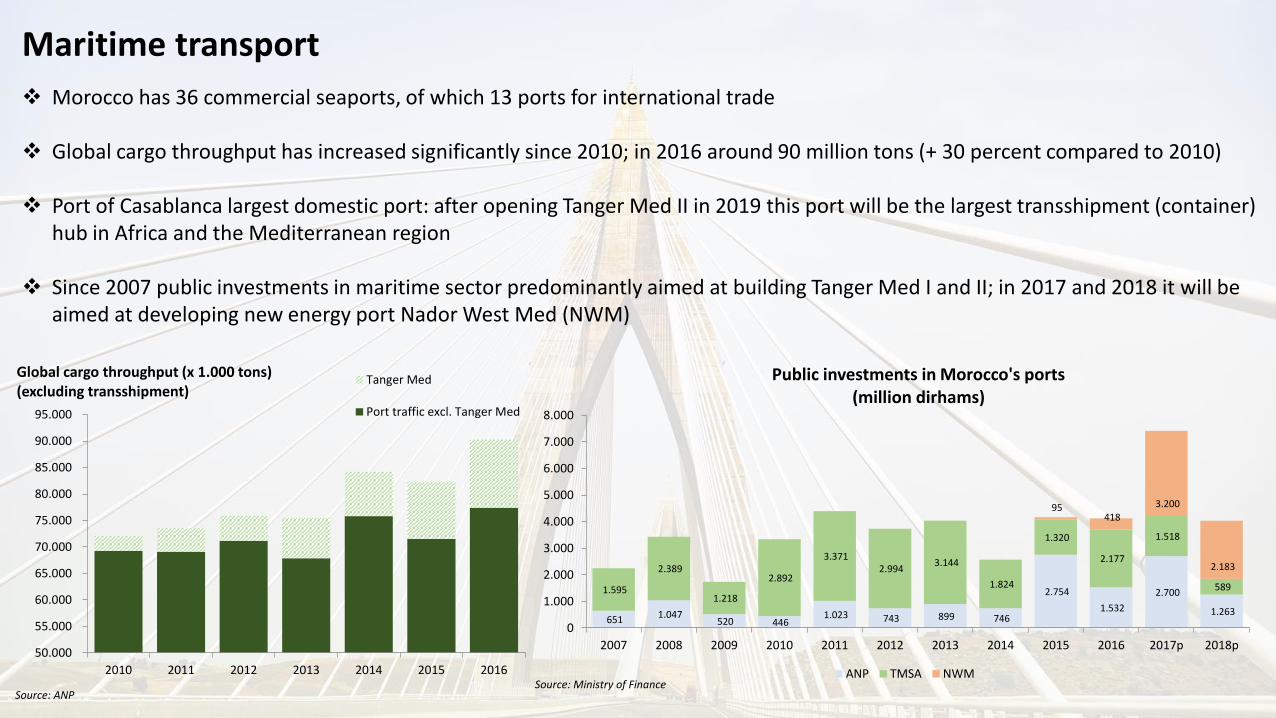
❖ Morocco has 36 commercial seaports, of which 13 ports for international trade
❖ Global cargo throughput has increased significantly since 2010; in 2016 around 90 million tons (+ 30 percent compared to 2010)
❖ Port of Casablanca largest domestic port: after opening Tanger Med II in 2019 this port will be the largest transshipment (container) hub in Africa and the Mediterranean region
❖ Since 2007 public investments in maritime sector predominantly aimed at building Tanger Med I and II; in 2017 and 2018 it will beaimed at developing new energy port Nador West Med (NWM)
Source: ANPSource: Ministry of Finance
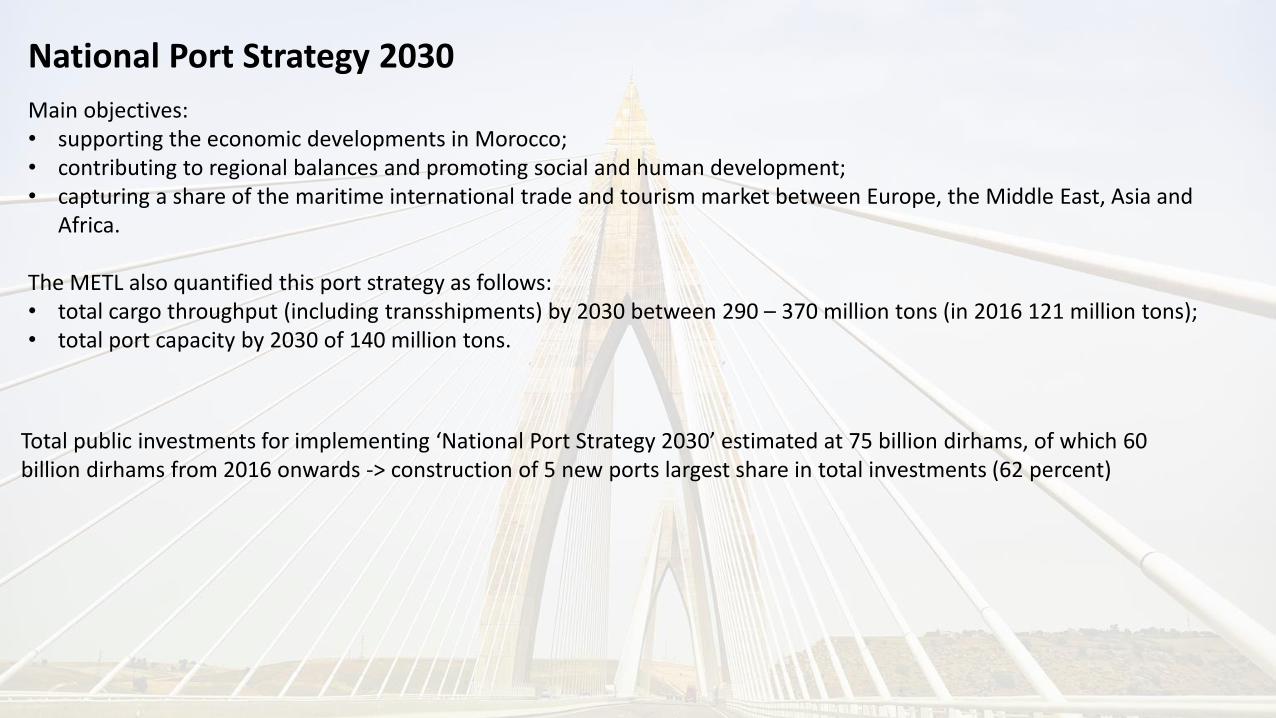
National Port Strategy 2030
Main objectives:• supporting the economic developments in Morocco;• contributing to regional balances and promoting social and human development;• capturing a share of the maritime international trade and tourism market between Europe, the Middle East, Asia and
Africa.
The METL also quantified this port strategy as follows:• total cargo throughput (including transshipments) by 2030 between 290 – 370 million tons (in 2016 121 million tons);• total port capacity by 2030 of 140 million tons.
Total public investments for implementing ‘National Port Strategy 2030’ estimated at 75 billion dirhams, of which 60 billion dirhams from 2016 onwards -> construction of 5 new ports largest share in total investments (62 percent)
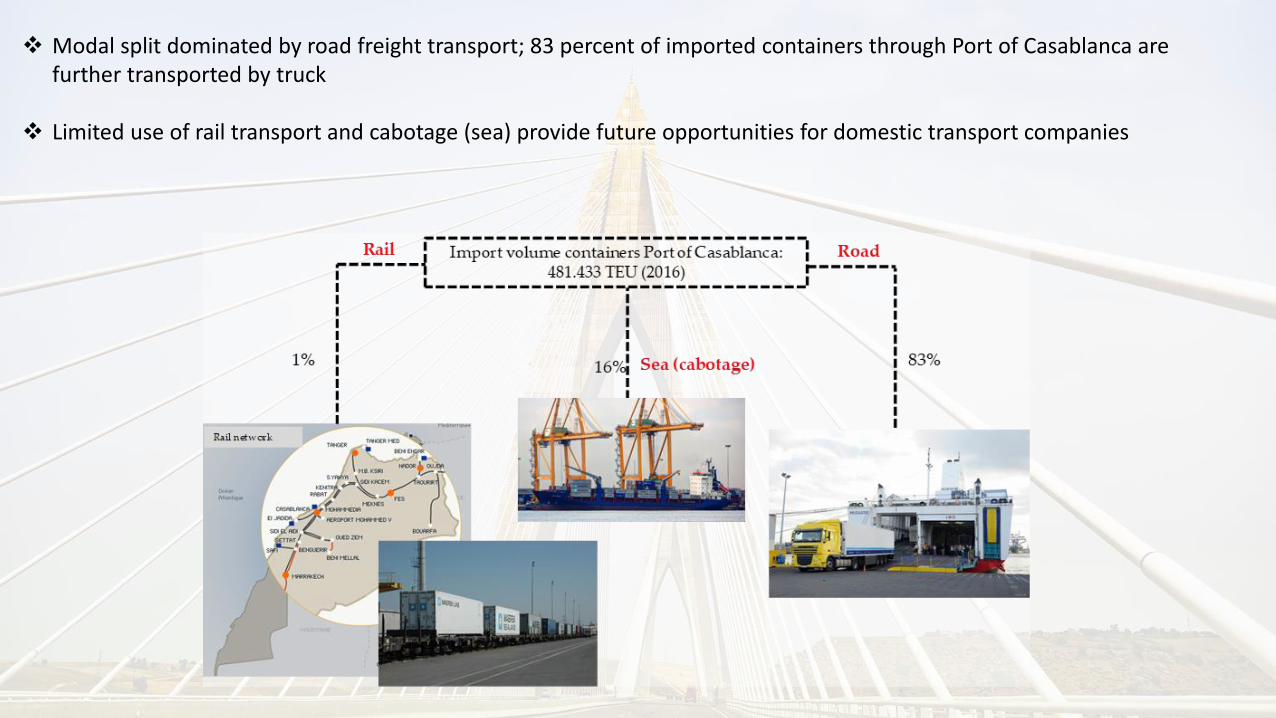
❖ Modal split dominated by road freight transport; 83 percent of imported containers through Port of Casablanca are further transported by truck
❖ Limited use of rail transport and cabotage (sea) provide future opportunities for domestic transport companies
Road freight transport
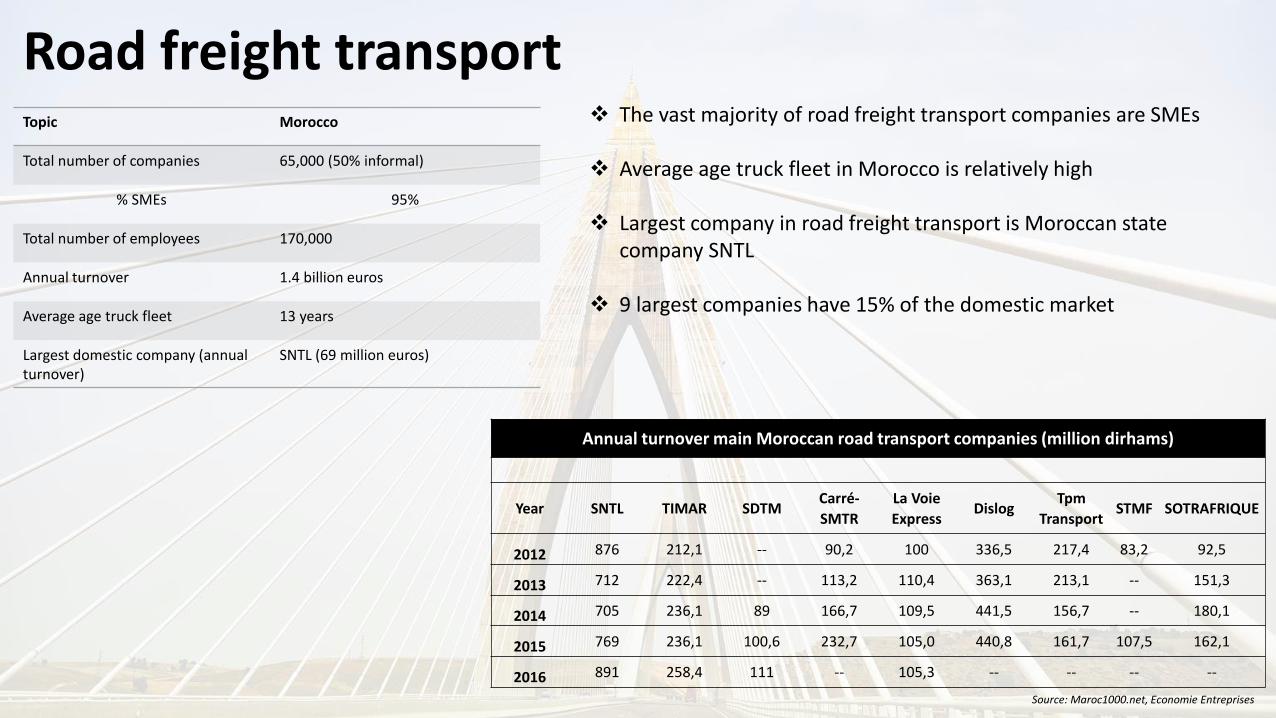
Annual turnover main Moroccan road transport companies (million dirhams)
Year SNTL TIMAR SDTMCarré-
SMTR
La Voie
ExpressDislog
Tpm
TransportSTMF SOTRAFRIQUE
2012 876 212,1 -- 90,2 100 336,5 217,4 83,2 92,5
2013 712 222,4 -- 113,2 110,4 363,1 213,1 -- 151,3
2014 705 236,1 89 166,7 109,5 441,5 156,7 -- 180,1
2015 769 236,1 100,6 232,7 105,0 440,8 161,7 107,5 162,1
2016 891 258,4 111 -- 105,3 -- -- -- --
Source: Maroc1000.net, Economie Entreprises
Topic Morocco
Total number of companies 65,000 (50% informal)
% SMEs 95%
Total number of employees 170,000
Annual turnover 1.4 billion euros
Average age truck fleet 13 years
Largest domestic company (annualturnover)
SNTL (69 million euros)
❖ The vast majority of road freight transport companies are SMEs
❖ Average age truck fleet in Morocco is relatively high
❖ Largest company in road freight transport is Moroccan state company SNTL
❖ 9 largest companies have 15% of the domestic market
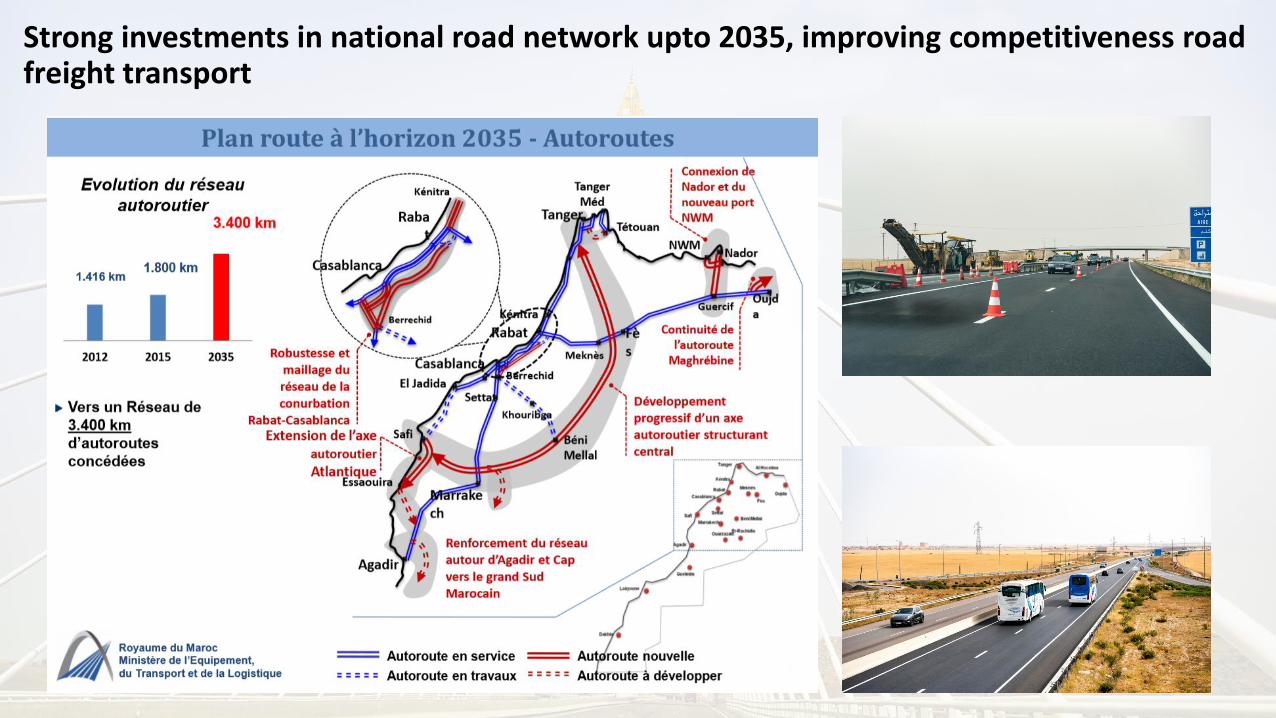
Strong investments in national road network upto 2035, improving competitiveness roadfreight transport
Air transport
10
12
14
16
18
20
2010 2011 2012 2013 2014 2015 2016
Passengers (millions)
International National
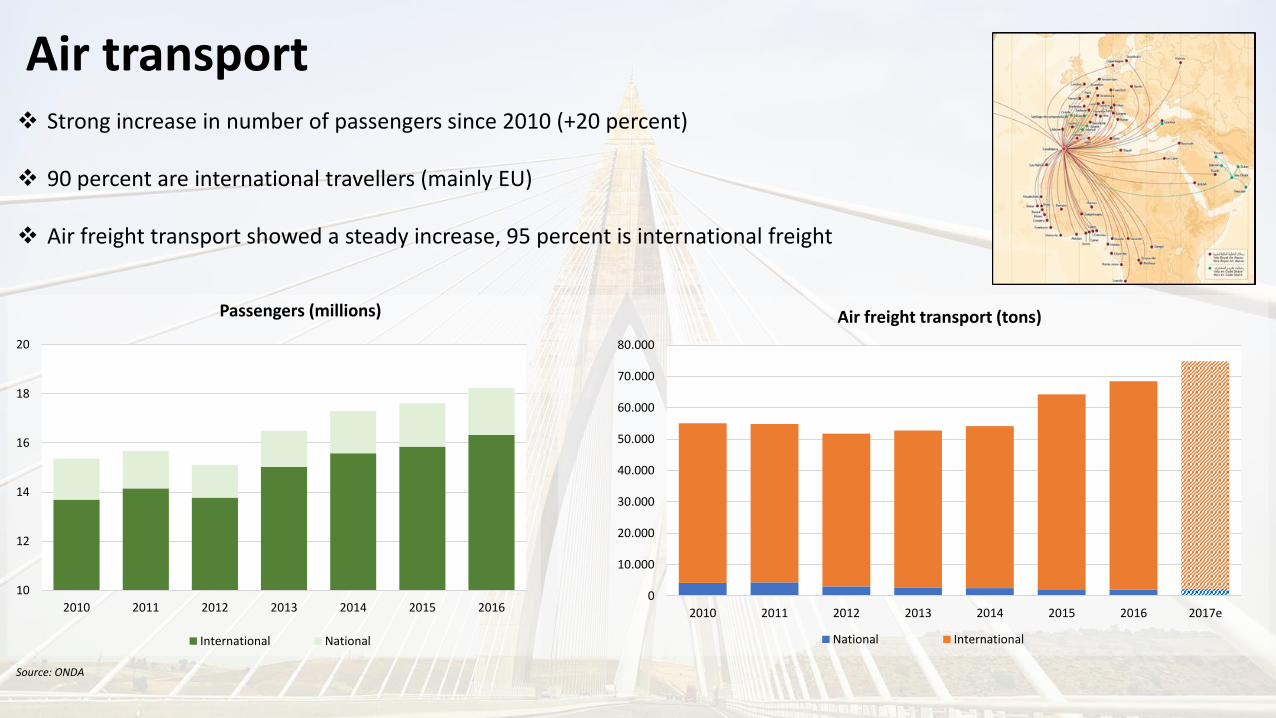
❖ Strong increase in number of passengers since 2010 (+20 percent)
❖ 90 percent are international travellers (mainly EU)
❖ Air freight transport showed a steady increase, 95 percent is international freight
0
10.000
20.000
30.000
40.000
50.000
60.000
70.000
80.000
2010 2011 2012 2013 2014 2015 2016 2017e
Air freight transport (tons)
National International
Source: ONDA
861
625
874
769
1.351
1.609 1.700
2012 2013 2014 2015 2016 2017p 2018p
Public investments in airport infrastructure (million dirhams)
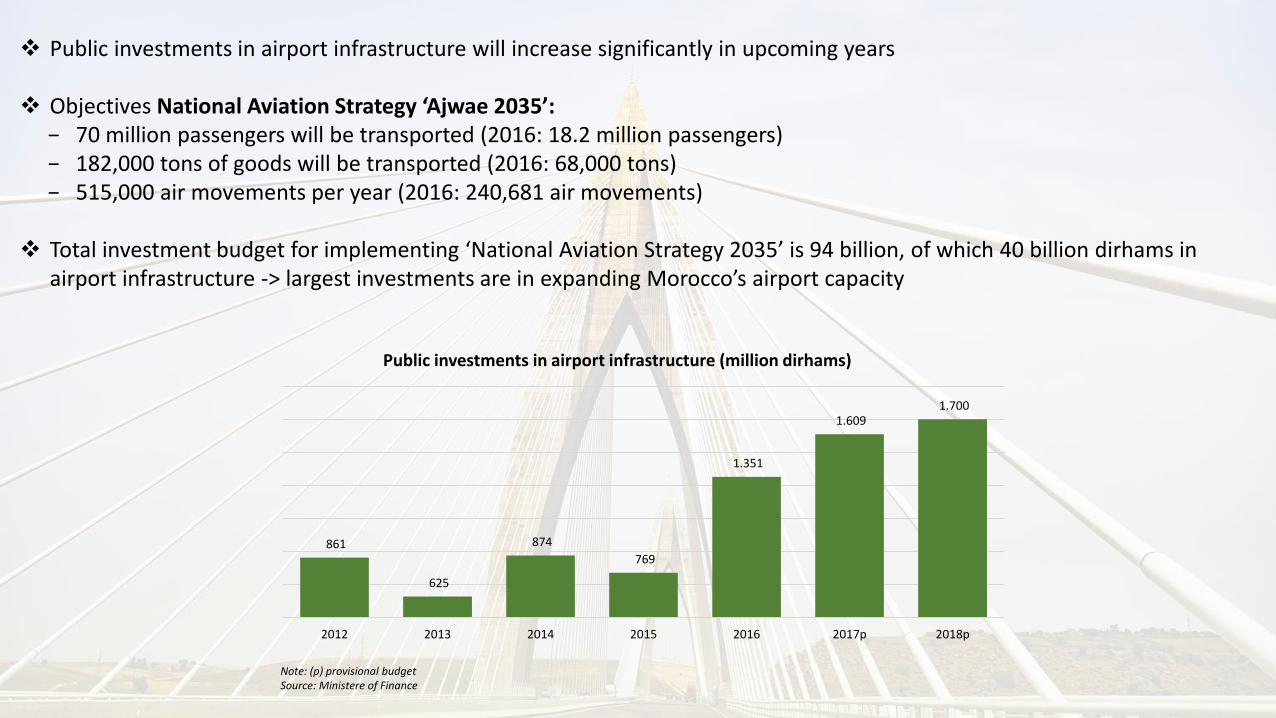
❖ Public investments in airport infrastructure will increase significantly in upcoming years
❖ Objectives National Aviation Strategy ‘Ajwae 2035’:− 70 million passengers will be transported (2016: 18.2 million passengers)− 182,000 tons of goods will be transported (2016: 68,000 tons)− 515,000 air movements per year (2016: 240,681 air movements)
❖ Total investment budget for implementing ‘National Aviation Strategy 2035’ is 94 billion, of which 40 billion dirhams in airport infrastructure -> largest investments are in expanding Morocco’s airport capacity
Note: (p) provisional budgetSource: Ministere of Finance
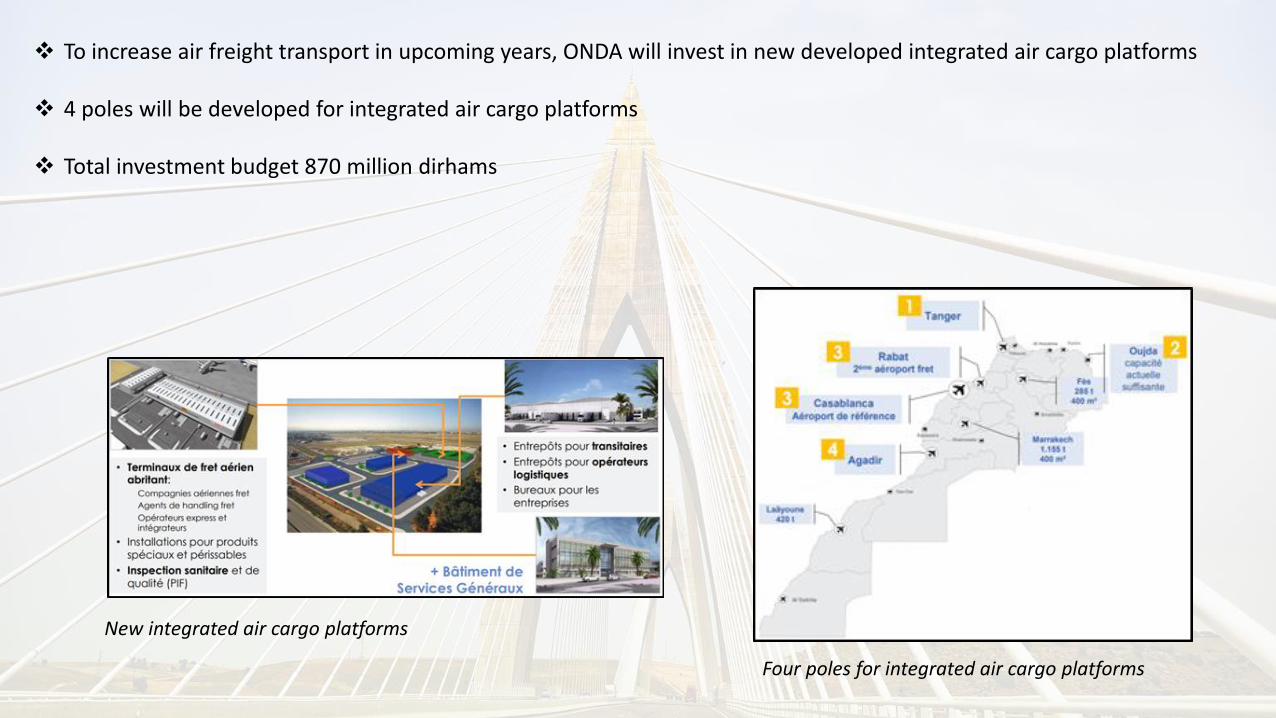
New integrated air cargo platforms
Four poles for integrated air cargo platforms
❖ To increase air freight transport in upcoming years, ONDA will invest in new developed integrated air cargo platforms
❖ 4 poles will be developed for integrated air cargo platforms
❖ Total investment budget 870 million dirhams
Rail freight transport
0
5
10
15
20
25
30
35
40
2012 2013 2014 2015 2016
Rail freight transport (million tons)
Phosphate Other
27.344
35.000
37.800
20.300 19.000
2012 2013 2014 2015 2016
Number of containers transported by rail (TEU)
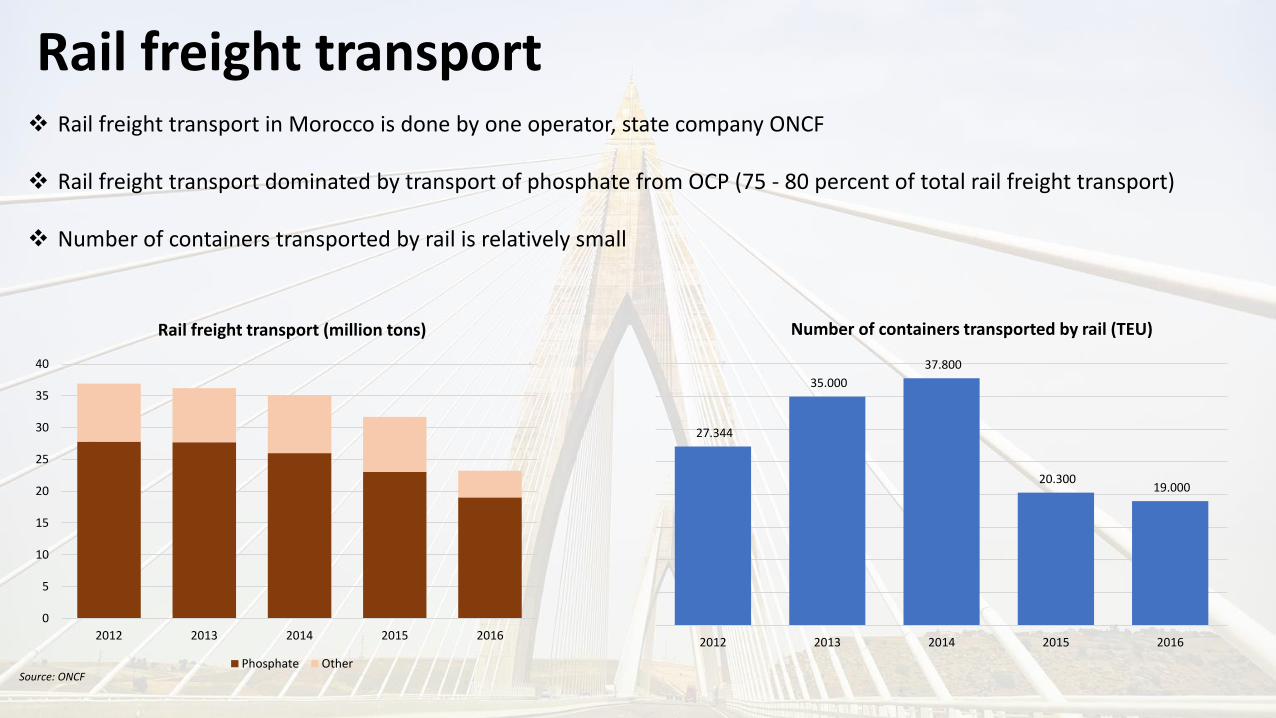
❖ Rail freight transport in Morocco is done by one operator, state company ONCF
❖ Rail freight transport dominated by transport of phosphate from OCP (75 - 80 percent of total rail freight transport)
❖ Number of containers transported by rail is relatively small
Source: ONCF
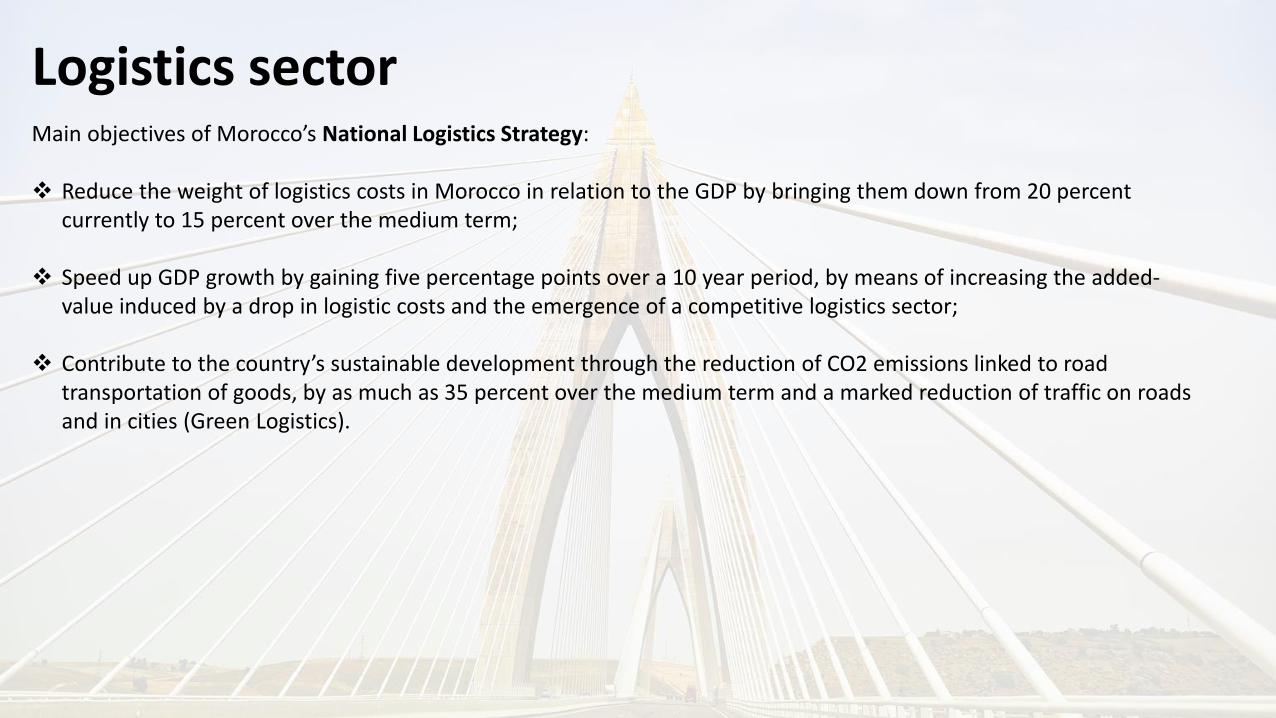
Logistics sectorMain objectives of Morocco’s National Logistics Strategy:
❖ Reduce the weight of logistics costs in Morocco in relation to the GDP by bringing them down from 20 percent currently to 15 percent over the medium term;
❖ Speed up GDP growth by gaining five percentage points over a 10 year period, by means of increasing the added-value induced by a drop in logistic costs and the emergence of a competitive logistics sector;
❖ Contribute to the country’s sustainable development through the reduction of CO2 emissions linked to roadtransportation of goods, by as much as 35 percent over the medium term and a marked reduction of traffic on roadsand in cities (Green Logistics).
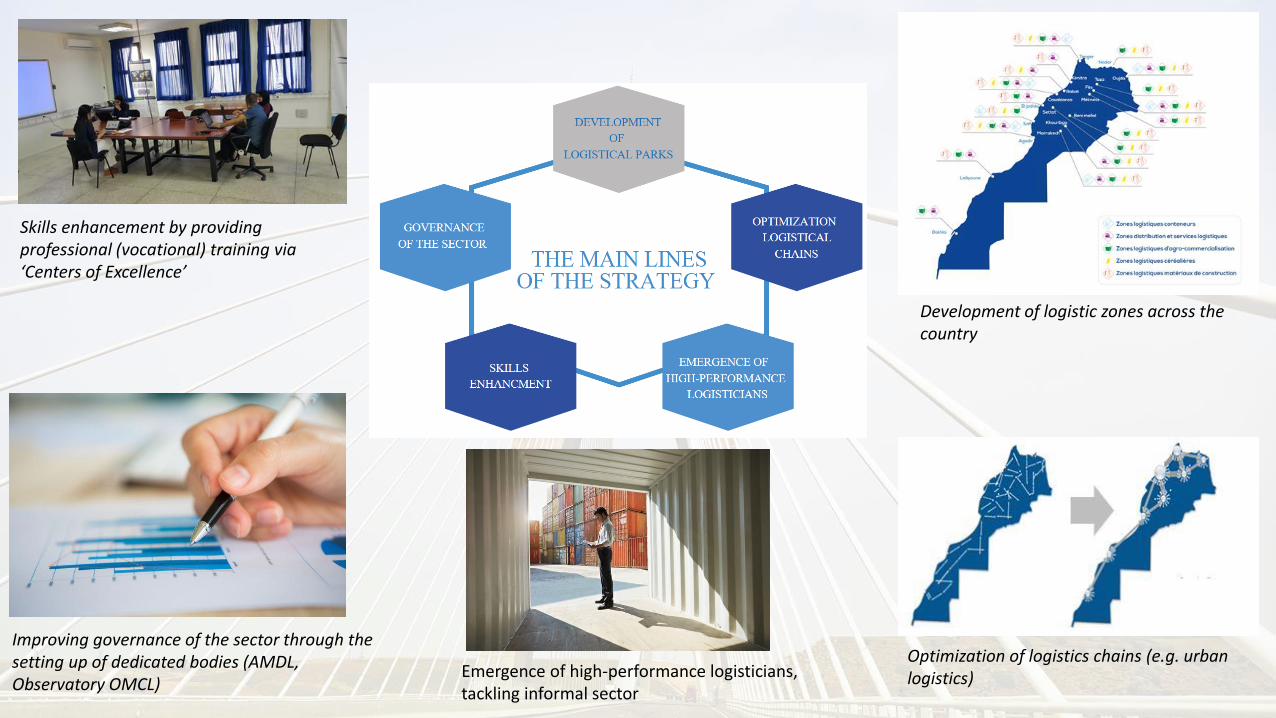
Development of logistic zones across the country
Optimization of logistics chains (e.g. urbanlogistics)
Skills enhancement by providingprofessional (vocational) training via ‘Centers of Excellence’
Improving governance of the sector through thesetting up of dedicated bodies (AMDL, Observatory OMCL)
Emergence of high-performance logisticians, tackling informal sector
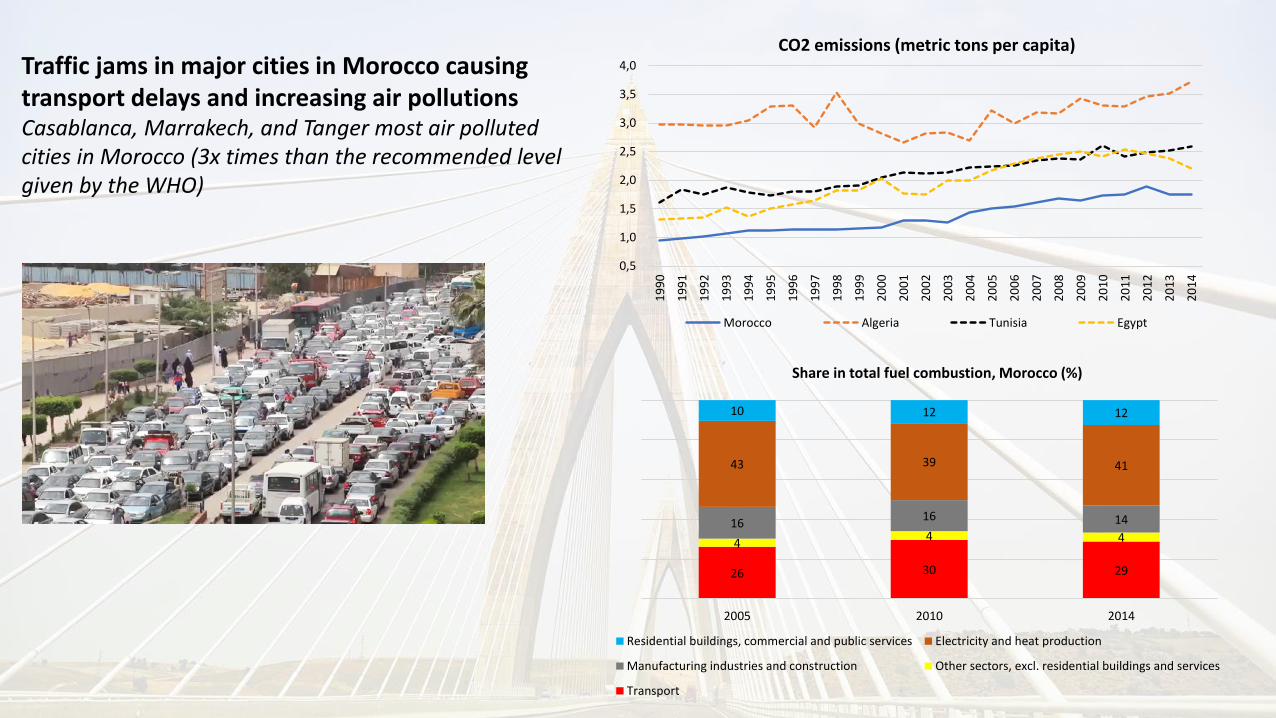
Traffic jams in major cities in Morocco causingtransport delays and increasing air pollutionsCasablanca, Marrakech, and Tanger most air pollutedcities in Morocco (3x times than the recommended level given by the WHO)
0,5
1,0
1,5
2,0
2,5
3,0
3,5
4,0
19
90
19
91
19
92
19
93
19
94
19
95
19
96
19
97
19
98
19
99
20
00
20
01
20
02
20
03
20
04
20
05
20
06
20
07
20
08
20
09
20
10
20
11
20
12
20
13
20
14
CO2 emissions (metric tons per capita)
Morocco Algeria Tunisia Egypt
26 30 29
44 4
1616 14
43 39 41
10 12 12
2005 2010 2014
Share in total fuel combustion, Morocco (%)
Residential buildings, commercial and public services Electricity and heat production
Manufacturing industries and construction Other sectors, excl. residential buildings and services
Transport
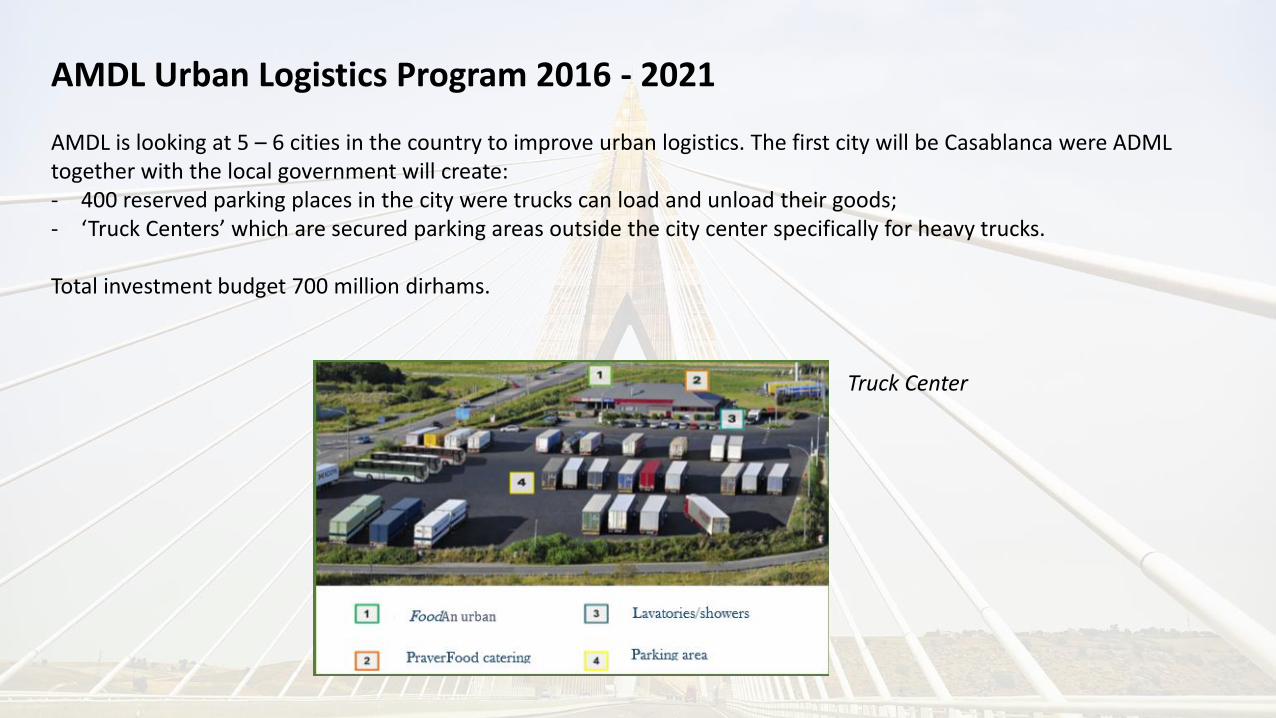
AMDL Urban Logistics Program 2016 - 2021
AMDL is looking at 5 – 6 cities in the country to improve urban logistics. The first city will be Casablanca were ADML together with the local government will create:- 400 reserved parking places in the city were trucks can load and unload their goods;- ‘Truck Centers’ which are secured parking areas outside the city center specifically for heavy trucks.
Total investment budget 700 million dirhams.
Truck Center
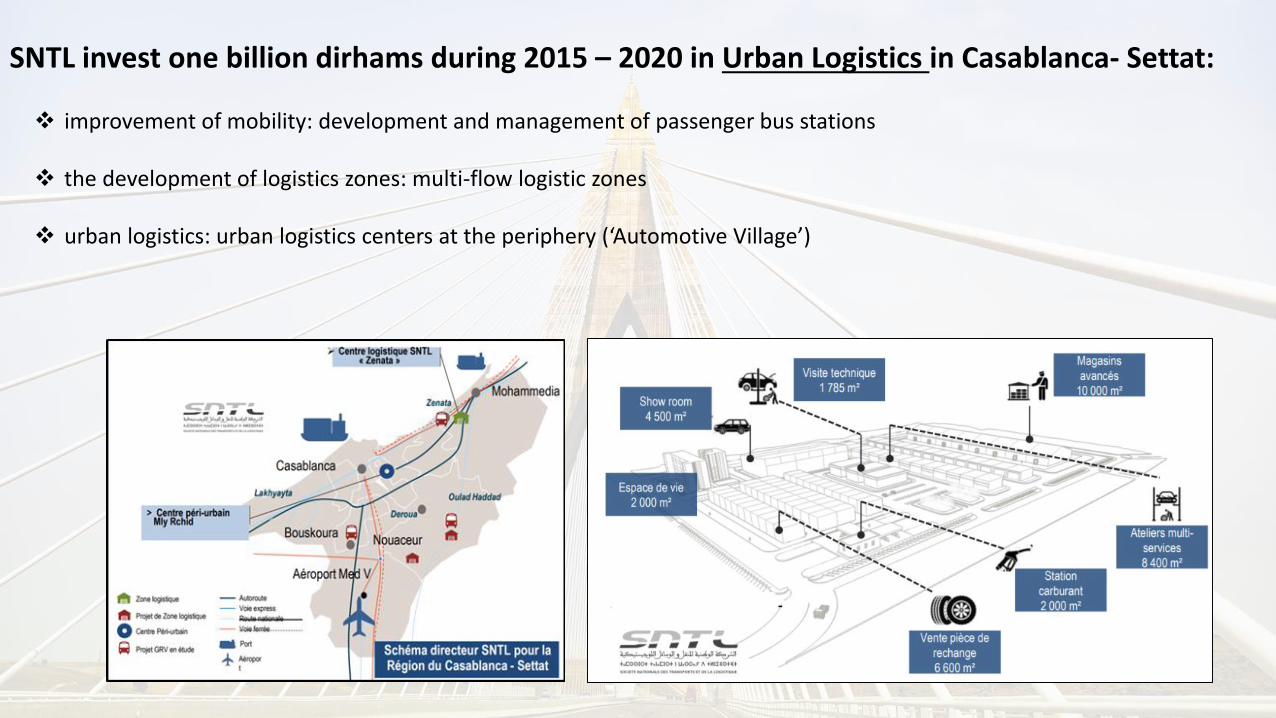
SNTL invest one billion dirhams during 2015 – 2020 in Urban Logistics in Casablanca- Settat:
❖ improvement of mobility: development and management of passenger bus stations
❖ the development of logistics zones: multi-flow logistic zones
❖ urban logistics: urban logistics centers at the periphery (‘Automotive Village’)
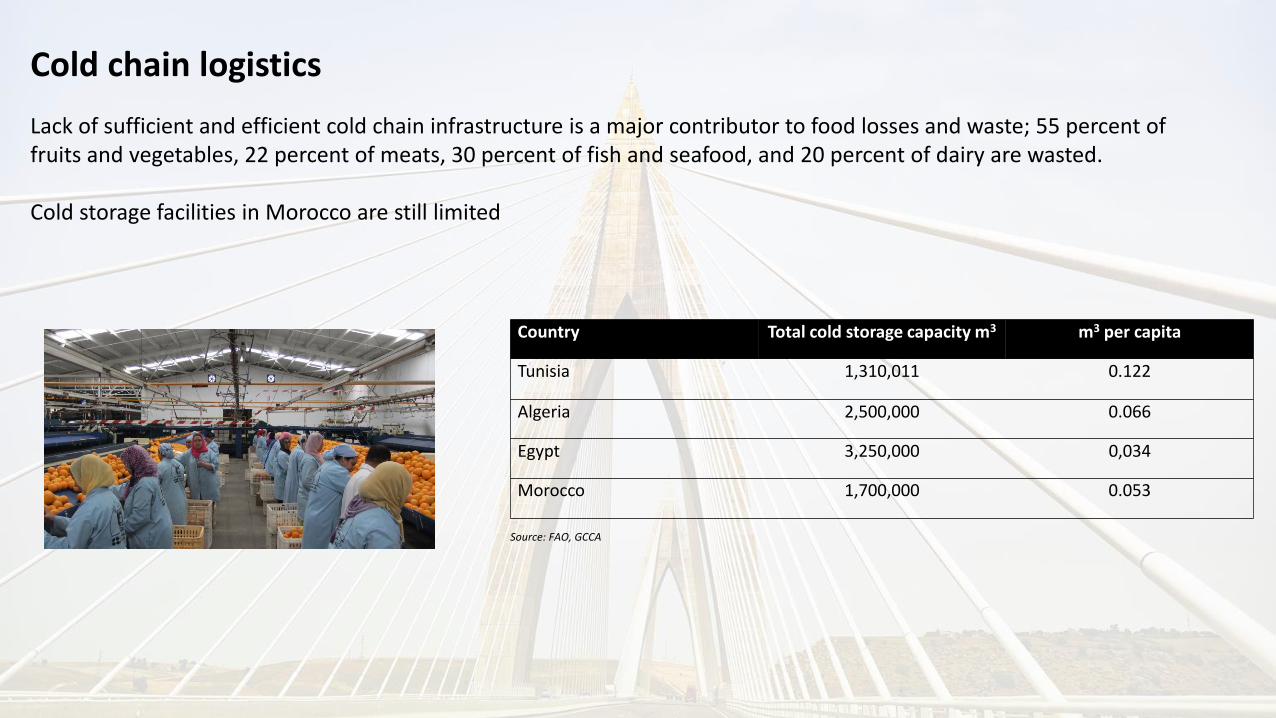
Cold chain logistics
Country Total cold storage capacity m3 m3 per capita
Tunisia 1,310,011 0.122
Algeria 2,500,000 0.066
Egypt 3,250,000 0,034
Morocco 1,700,000 0.053
Lack of sufficient and efficient cold chain infrastructure is a major contributor to food losses and waste; 55 percent of fruits and vegetables, 22 percent of meats, 30 percent of fish and seafood, and 20 percent of dairy are wasted.
Cold storage facilities in Morocco are still limited
Source: FAO, GCCA