Embed Size (px)
Citation preview

ANRV308-PC58-10 ARI 19 October 2006 4:35
RE V I E W
S
IN
AD V A
NC
E
Localized Surface PlasmonResonance Spectroscopyand SensingKatherine A. Willets and Richard P. Van DuyneDepartment of Chemistry, Northwestern University, Evanston, Illinois 60208-3113;email: [email protected], [email protected]
Annu. Rev. Phys. Chem. 2007. 58:267–97
The Annual Review of Physical Chemistry isonline at http://physchem.annualreviews.org
This article’s doi:10.1146/annurev.physchem.58.032806.104607
Copyright c© 2007 by Annual Reviews.All rights reserved
0066-426X/07/0505-0267$20.00
Key Words
molecular plasmonics, refractive-index sensing, surface-enhancedRaman scattering, nanoparticles, nanosphere lithography
AbstractLocalized surface plasmon resonance (LSPR) spectroscopy of metal-lic nanoparticles is a powerful technique for chemical and biologi-cal sensing experiments. Moreover, the LSPR is responsible for theelectromagnetic-field enhancement that leads to surface-enhancedRaman scattering (SERS) and other surface-enhanced spectroscopicprocesses. This review describes recent fundamental spectroscopicstudies that reveal key relationships governing the LSPR spectral lo-cation and its sensitivity to the local environment, including nanopar-ticle shape and size. We also describe studies on the distance depen-dence of the enhanced electromagnetic field and the relationshipbetween the plasmon resonance and the Raman excitation energy.Lastly, we introduce a new form of LSPR spectroscopy, involving thecoupling between nanoparticle plasmon resonances and adsorbatemolecular resonances. The results from these fundamental studiesguide the design of new sensing experiments, illustrated throughapplications in which researchers use both LSPR wavelength-shiftsensing and SERS to detect molecules of chemical and biologicalrelevance.
267
First published online as a Review in Advance on October 26, 2006
Ann
u. R
ev. P
hys.
Che
m. 2
007.
58. D
ownl
oade
d fr
om a
rjou
rnal
s.an
nual
revi
ews.
org
by N
OR
TH
WE
STE
RN
UN
IVE
RSI
TY
- E
vans
ton
Cam
pus
on 0
1/02
/07.
For
per
sona
l use
onl
y.

ANRV308-PC58-10 ARI 19 October 2006 4:35
SPR: surface plasmonresonance
LSPR : localized surfaceplasmon resonance
Localized surfaceplasmon: a photon-drivencoherent oscillation of thesurface conductionelectrons in a material withnegative real and near-zeroimaginary dielectricconstant
SERS : surface-enhancedRaman scattering
INTRODUCTION
Materials that possess a negative real and small positive imaginary dielectric constantare capable of supporting a surface plasmon resonance (SPR). This resonance is acoherent oscillation of the surface conduction electrons excited by electromagnetic(EM) radiation. Plasmonics is the study of these particular light-matter interactions,which have enabled a vast array of applications, including surface-enhanced spectro-scopies (1–16), biological and chemical sensing (17–33), and lithographic fabrication(34–36). Plasmonic materials can already be found in commercial instruments, such asthe BIAcore®, which monitors the thermodynamics and kinetics of biological bind-ing processes using SPR spectroscopy (27, 29, 37). In these experiments, researchersuse thin (∼50-nm) metal films as the sensing platform; these yield propagating plas-mons, also known as surface plasmon polaritons (27, 38, 39). However, with recentadvances that allow the controlled fabrication and manipulation of metallic structureson the nanoscale, researchers have demonstrated new applications that take advantageof the localized surface plasmon resonance (LSPR) (17, 19, 21, 22, 40–42).
Figure 1 illustrates the difference between propagating and localized surface plas-mons (38, 41, 43). In the case of surface plasmon polaritons, plasmons propagate inthe x- and y-directions along the metal-dielectric interface, for distances on the or-der of tens to hundreds of microns, and decay evanescently in the z-direction with1/e decay lengths on the order of 200 nm (27, 39, 44). The interaction between themetal surface-confined EM wave and a molecular surface layer of interest leads toshifts in the plasmon resonance condition, which can be observed in three modes:(a) angle resolved, (b) wavelength shift, and (c) imaging (27). In the first two modes,one measures the reflectivity of light from the metal surface as a function of eitherangle of incidence (at constant wavelength) or wavelength (at constant angle of inci-dence). The third method uses light of both constant wavelength and incident angleto interrogate a two-dimensional region of the sample, mapping the reflectivity ofthe surface as a function of position.
For the case of localized surface plasmons, light interacts with particles muchsmaller than the incident wavelength (Figure 1b). This leads to a plasmon that os-cillates locally around the nanoparticle with a frequency known as the LSPR (41,43). Similar to the SPR, the LSPR is sensitive to changes in the local dielectricenvironment (43, 45, 46). Typically researchers sense changes in the local environ-ment through an LSPR wavelength-shift measurement, although a variant of angle-resolved sensing for the LSPR is also possible (47).
Significant interest in understanding propagating and localized surface plasmonsdeveloped on the discovery of surface-enhanced Raman scattering (SERS) (1, 48). Re-searchers proposed competing mechanisms of both chemical and EM-field enhance-ments to explain the observed Raman enhancement on roughened metallic substrates(5, 49–55). Because the EM-field-enhancement mechanism required coupling of theincident radiation to the metal surface, researchers devoted much theoretical andexperimental effort to understanding surface plasmons (5, 50, 56, 57). In particular,they studied the role of size, shape, material, and local dielectric properties—all ofwhich determine the LSPR wavelength (20, 41, 43, 45, 58, 59). Whereas these studies
268 Willets · Van Duyne
Ann
u. R
ev. P
hys.
Che
m. 2
007.
58. D
ownl
oade
d fr
om a
rjou
rnal
s.an
nual
revi
ews.
org
by N
OR
TH
WE
STE
RN
UN
IVE
RSI
TY
- E
vans
ton
Cam
pus
on 0
1/02
/07.
For
per
sona
l use
onl
y.

ANRV308-PC58-10 ARI 19 October 2006 4:35
+++ - - - +++ - - -
+++
- - - +++
- - -
Metal
Z
X
Dielectric
Electric field
Electron cloud
Metal sphere
a
b
Figure 1Schematic diagrams illustrating (a) a surface plasmon polariton (or propagating plasmon) and(b) a localized surface plasmon.
provided a fundamental understanding of how plasmons are influenced by local struc-ture and environment, they also suggested the usefulness of plasmons as a sensingmodality. Today, plasmon spectroscopy enjoys a reputation as an ultrasensitive methodfor detecting molecules of both biological and chemical interest, in addition to its con-tinued role in enabling surface-enhanced spectroscopic methods, including SERS,
www.annualreviews.org • Localized Plasmon Spectroscopy 269
Ann
u. R
ev. P
hys.
Che
m. 2
007.
58. D
ownl
oade
d fr
om a
rjou
rnal
s.an
nual
revi
ews.
org
by N
OR
TH
WE
STE
RN
UN
IVE
RSI
TY
- E
vans
ton
Cam
pus
on 0
1/02
/07.
For
per
sona
l use
onl
y.

ANRV308-PC58-10 ARI 19 October 2006 4:35
Raman scattering:inelastic scattering of anincident photon whoseenergy changes according tothe vibrational energyspacing of the molecule
surface-enhanced hyper-Raman scattering, surface-enhanced infrared spectroscopy,second harmonic generation, and surface-enhanced fluorescence (11, 12, 15, 16, 41,60, 61).
Although SPR spectroscopy currently dominates commercial instrumentation,LSPR spectroscopy offers many of the same advantages for sensing and spectroscopyexperiments, along with several additional benefits (21, 40). Both SPR and LSPRspectroscopy can provide thermodynamic and real-time kinetic data for binding pro-cesses. Moreover, although SPR spectroscopy provides much higher sensitivity tochanges in the bulk refractive index than LSPR spectroscopy (25, 40), the responseof the two techniques becomes comparable when measuring short-range changes inthe refractive index owing to a molecular adsorption layer (40). This is a result of themuch smaller sensing volume offered by LSPR sensors, as the EM-field-decay lengthis 40–50 times shorter than that of the SPR sensors (62, 63). Single-nanoparticleLSPR spectroscopy is another option, offering sensitivity that not only rivals, butcan surpass, that of nanoparticle array-based LSPR spectroscopy (20, 33, 57, 64).Moreover, advances in both synthetic and lithographic fabrication techniques allowresearchers to tune the LSPR wavelength throughout the visible, near-infrared, andinto the infrared region of the EM spectrum, by varying the shape, size, and mate-rial of the nanoparticles that support the surface plasmons (57, 64–72). This offersadditional flexibility when designing LSPR sensing experiments.
The remainder of this review on LSPR spectroscopy and sensing is organized asfollows: First, we present several key equations for understanding the theory behindthe LSPR. This is followed by a discussion of experimental techniques for fabri-cating metallic nanoparticles and performing spectroscopic measurements. Next, wepresent several fundamental studies of plasmon spectroscopy, illustrating key relation-ships that govern the LSPR spectral location and its sensitivity to the local dielectricenvironment. To round out our discussion, we provide specific examples of LSPRsensing experiments using both wavelength-shift and SERS spectroscopy.
THEORY
A full theoretical treatment of localized surface plasmons is quite lengthy and be-yond the scope of this review. However, we refer the interested reader to theSupplemental Appendix for a complete derivation of several of these equations.(Follow the Supplemental Material link from the Annual Reviews home page athttp://www.annualreviews.org.) For our more compact treatment, we consider aspherical nanoparticle of radius a that is irradiated by z-polarized light of wavelengthλ (where a is much smaller than the wavelength of light λ; i.e., a/λ < 0.1). In thislimit, the magnitude of the electric field appears static around the nanoparticle (as inFigure 1b), allowing us to solve Maxwell’s equations using a quasi-static approxi-mation (3, 43). The resulting solution for the EM field outside the particle is givenby
Eout (x, y, z) = E0z −[
εin − εout
(εin + 2εout)
]a3 E0
[zr3
− 3zr5
(xx + y y + zz)]
. (1)
270 Willets · Van Duyne
Ann
u. R
ev. P
hys.
Che
m. 2
007.
58. D
ownl
oade
d fr
om a
rjou
rnal
s.an
nual
revi
ews.
org
by N
OR
TH
WE
STE
RN
UN
IVE
RSI
TY
- E
vans
ton
Cam
pus
on 0
1/02
/07.
For
per
sona
l use
onl
y.

ANRV308-PC58-10 ARI 19 October 2006 4:35
Extinction spectrum:absorption plus elasticlight-scattering spectrum
Here, εin is the dielectric constant of the metal nanoparticle, and εout is the dielectricconstant of the external environment. Because εin is strongly dependent on wave-length, the first term in square brackets determines the dielectric resonance condi-tion for the particle. When the dielectric constant of the metal is roughly equal to−2εout, the EM field is enhanced relative to the incident field. In the case of silver andgold, this condition is met in the visible region of the spectrum, which has importantimplications for surface-enhanced spectroscopies. The size (a) and external dielectricconstant (εout) also play key roles in determining the EM field outside the particle,consistent with experimental results.
We calculate the extinction spectrum of the metal sphere as follows (73, 74):
E(λ) = 24π2 Na3ε3/2out
λ ln(10)
[εi (λ)
(εr (λ) + χεout)2 + εi (λ)2
]. (2)
Here, εr and εi are the real and imaginary components of the metal dielectric func-tion, respectively. Again, we note the wavelength dependence of the metal dielectricfunction. Of additional interest is the factor of χ that appears in front of εout. Thevalue of χ is 2 for the case of a sphere, but it takes on values as large as 20 to accountfor particle geometries with high aspect ratios (75). Because we can only solve thevalue of χ analytically for spheres and spheroids, and we must approximate it for allother geometries (43, 75), researchers have developed additional numerical methods;these include the discrete dipole approximation and the finite-difference time-domainmethods (76–81). In these calculations, the particle of interest is represented as N fi-nite polarizable elements, each of which can interact with the applied electric field.In the case of the discrete dipole approximation method, this interaction is modeledin the frequency domain, whereas the finite-difference time-domain method evalu-ates this interaction in the time domain. Both methods allow the evaluation of theextinction of particles of arbitrary shape and size, and the results typically match wellwith experimental results.
In addition to modeling the extinction of particles, several equations describehow the LSPR is used for both sensing and spectroscopic experiments. For example,the LSPR extinction (or scattering) wavelength maximum, λmax, is sensitive to thedielectric constant ε (or refractive index, n; both are related by ε = n2). Thus, changesin the local environment—such as through the presence of an adsorbed species—should cause a shift in λmax. This leads to the following relationship (25, 82):
�λmax = m�n[1 − exp
(−2d/ld
)]. (3)
Here m is the bulk refractive-index response of the nanoparticle(s); �n is the change inrefractive index induced by the adsorbate; d is the effective adsorbate layer thickness;and ld is the characteristic EM-field-decay length (approximated as an exponentialdecay). This relationship is the basis of LSPR wavelength-shift sensing experiments,as illustrated in subsequent examples below.
We can describe the enhancement factor for SERS as shown (83, 84):
E FSERS(ωv) = |Eout(ω)2| |Eout(ω − ωv)2|E4
o=
[ISERS(ωv)/Nsurf
][
INRS(ωv)/Nvol
] . (4)
www.annualreviews.org • Localized Plasmon Spectroscopy 271
Ann
u. R
ev. P
hys.
Che
m. 2
007.
58. D
ownl
oade
d fr
om a
rjou
rnal
s.an
nual
revi
ews.
org
by N
OR
TH
WE
STE
RN
UN
IVE
RSI
TY
- E
vans
ton
Cam
pus
on 0
1/02
/07.
For
per
sona
l use
onl
y.

ANRV308-PC58-10 ARI 19 October 2006 4:35
Nanosphere lithography(NSL): lithographictechnique in which aself-assembled close-packedarray of nanospheres is usedas a deposition mask
FON: film over nanosphere
This equation describes how the Raman enhancement effect is a result of enhanc-ing both the incident excitation, Eout(ω), and the resulting Stokes’ shifted Raman,Eout(ω−ωv), EM fields. The calculation of the enhancement factor from experimentalmeasurements is given by the right-hand side of Equation 4—i.e., the SERS-enhancedRaman intensity, ISERS(ωv)—normalized by the number of molecules bound to theenhancing metallic substrate, Nsurf , divided by the normal Raman intensity, INRS(ωv),normalized by the number of molecules in the excitation volume, Nvol . This equationis important for characterizing the enhancing ability of substrates of various mate-rial, geometry, and LSPR wavelength and is applied to several of the fundamentalspectroscopy studies described below.
EXPERIMENTAL DETAILS
Nanofabrication
The ability to fabricate nanoparticles of varying shape, size, and material has been amajor factor in advancing the understanding and application of LSPR spectroscopy.Whereas chemical synthetic techniques offer the ability to fabricate large quantitiesof nanoparticles (often with novel architectures and controlled crystallinity), litho-graphic techniques allow the fabrication of periodic arrays with specific particle shape,placement, and orientation. One particularly useful form of lithography is nanospherelithography (NSL), which is a cost-effective and rapid means of producing several pe-riodic array structures (56, 59, 85, 86). Figure 2 illustrates the NSL process. Briefly,polymer nanospheres are drop coated on a substrate and allowed to self-assembleinto a close-packed hexagonal array. This nanosphere mask allows the fabrication ofseveral different LSPR substrates, all from the same masking procedure. In one case,metal is deposited (typically 15–100 nm) and then the nanosphere mask is washedaway, leaving the triangular nanoparticle array shown in Figure 2b (56). In the secondcase, a thicker layer of metal (∼200 nm) is deposited over the nanospheres, producinga metal film over nanosphere (FON); this substrate is particularly effective for SERSapplications owing to the stability of the local surface roughness on this curved sub-strate (Figure 2c) (41, 42, 87). A third approach is to use reactive-ion etching throughthe nanosphere mask to create small wells, into which metal can be deposited (88).In all cases, the resonance wavelength of the LSPR can be tuned simply by varyingthe diameter of the nanospheres in the mask, as well as the thickness of the depositedmetal.
Electron-beam lithography, although more time-consuming and expensive, offersthe advantage of creating nanoparticles of arbitrary size, shape, and spacing. Here,an electron beam is used to write a deposition mask directly into a polymer film;metal is then deposited through this mask and the film washed away, leaving be-hind the desired pattern. Researchers have used this technique to study plasmoniccoupling between nanoparticles of arbitrary shape with different interparticle spac-ing (71, 89–91). Chemical syntheses provide another strategy for making particles ofdifferent shape and size, although one must realize and accommodate the effects ofpolydispersity (64–67, 69, 70, 92–95). By changing the reaction conditions and the
272 Willets · Van Duyne
Ann
u. R
ev. P
hys.
Che
m. 2
007.
58. D
ownl
oade
d fr
om a
rjou
rnal
s.an
nual
revi
ews.
org
by N
OR
TH
WE
STE
RN
UN
IVE
RSI
TY
- E
vans
ton
Cam
pus
on 0
1/02
/07.
For
per
sona
l use
onl
y.

ANRV308-PC58-10 ARI 19 October 2006 4:35
Figure 2(a) Illustration of the process of nanosphere lithography (NSL) in which nanospheres are dropcoated onto a surface and allowed to self-assemble into a hexagonally close-packed array (steps1–3), followed by metal deposition (step 4), and (optional) removal of the nanosphere mask. (b)Atomic-force-microscope image of an NSL-fabricated nanoparticle array in which thenanosphere mask has been removed. (c) Atomic-force-microscope image of afilm-over-nanosphere (FON) substrate in which the nanospheres remain on the surface.
stabilizing surfactant, researchers have produced a wide variety of shapes, includingtriangles, cubes, prisms, tetrahedra, bipyramids, and even stars (57, 64, 66, 67, 92,93). As an interesting aside, the NSL-produced nanoparticles described above canalso be released into solution via simple chemical functionalization; this provides analternate approach for making particles in solution without the need for any syntheticchemistry (96).
www.annualreviews.org • Localized Plasmon Spectroscopy 273
Ann
u. R
ev. P
hys.
Che
m. 2
007.
58. D
ownl
oade
d fr
om a
rjou
rnal
s.an
nual
revi
ews.
org
by N
OR
TH
WE
STE
RN
UN
IVE
RSI
TY
- E
vans
ton
Cam
pus
on 0
1/02
/07.
For
per
sona
l use
onl
y.

ANRV308-PC58-10 ARI 19 October 2006 4:35
Spectroscopic Measurements
Figure 3 shows several approaches to the measurement of nanoparticle LSPRspectra. The most straightforward is transmission ultraviolet-visible spectroscopy(Figure 3a). Here one measures the extinction spectrum (absorption plus scattering)of the nanoparticles by recording the wavelength dependence of the light passingthrough the sample. In the case of nontransparent samples (such as the FONs de-scribed above), one must use a reflective geometry (Figure 3b) (42). Here, a fiberbundle is used both to direct the excitation light to the sample (center fiber), as well
CCD
a
d
b c
Triplespectrograph
Nikon TE300
Millenia X532 nm
DCM dye laser605 –700 nm
Nanopositioningstage
Ti:sapphire700 –1000 nm
GWU240 – 500 nm
PC
Reflectance probe
Min
iatu
re
sp
ectr
og
rap
h
with
CC
D
White lig
ht
sourc
e
N.A. = 0.5 – 1.3
N.A. = 0.95
PC
Fiber
Miniature spectrograph
with CCD
White light source
Figure 3(a) Transmission and (b) reflectance geometries for measuring extinction spectra ofnanoparticle arrays. (c) Dark-field scattering experimental setup using a high-numericalaperture dark-field condenser and a high-numerical aperture microscope objective formeasuring single-nanoparticle scattering spectra. (d ) Experimental setup for measuringsurface-enhanced Raman scattering in an epi-illumination geometry using awavelength-scanned laser-excitation system and a triple spectrograph coupled with acharge-coupled device (CCD) camera. Reproduced with permission from Reference 84.Copyright 2005 American Chemical Society.
274 Willets · Van Duyne
Ann
u. R
ev. P
hys.
Che
m. 2
007.
58. D
ownl
oade
d fr
om a
rjou
rnal
s.an
nual
revi
ews.
org
by N
OR
TH
WE
STE
RN
UN
IVE
RSI
TY
- E
vans
ton
Cam
pus
on 0
1/02
/07.
For
per
sona
l use
onl
y.

ANRV308-PC58-10 ARI 19 October 2006 4:35
Chronocoulometry:electrochemicalmeasurement of chargeversus time following astep-wise change in theapplied potential
as to collect the light reflected from the surface (radial array of fibers). Whereas thetransmission geometry yields the LSPR wavelength as a maximum value in the ex-tinction curve, the reflected geometry yields the LSPR wavelength as a minimumvalue (because light absorbed or scattered by the sample is not reflected back).
For samples in which small regions or even single nanoparticles are interrogated,dark-field light-scattering measurements are extremely powerful. In this case, whitelight is introduced to the sample at a high angle, and scattered light is collected at alower angle. Figure 3c shows an example of this in which a high-numerical aperturecondenser brings light to the sample, and a low-numerical aperture microscope ob-jective collects the scattered light at low angles. This can also be accomplished using adark-field microscope objective, which serves the dual function of bringing the high-angle excitation light to the sample, as well as collecting the low-angle scattered light(much like the fiber used in the reflectance geometry above). In both cases, the scat-tered light is then directed to a spectrometer and detector, such as a charge-coupleddevice camera, yielding an LSPR spectrum of the sample.
For SERS measurements, the sample is excited by a laser (optimally to the blue ofthe LSPR of the metal substrate), and the Raman scattered light is passed through aspectrometer and onto a detector. The excitation light is typically directed to the sam-ple at either a glancing angle or by using a microscope objective in epi-illumination.Figure 3d shows the latter configuration; this experimental setup was used for thewavelength-scanned SERS excitation–spectroscopy experiments described in the fol-lowing section.
SPECTROSCOPY
Fundamental spectroscopic studies on plasmonic materials provide an understandingof the properties that govern both the LSPR wavelength and the surface enhance-ment factor of these substrates, which is critical when designing materials for sensingapplications. In this section, we describe experiments that demonstrate several ofthese fundamental relationships and explain how these can impact—and hopefullyimprove—LSPR sensing experiments.
Localized Surface Plasmon Resonance Size and Shape Dependence
Because the shape and size of a metallic nanoparticle dictate the spectral signature ofits plasmon resonance, the ability to change these two parameters and study the effecton the LSPR is an important experimental challenge. Researchers first systematicallystudied this using NSL-fabricated arrays with variable diameter nanosphere masks aswell as different Ag film thicknesses (97). A second approach is to use electrochem-istry to oxidize the nanoparticles, thus modifying their surface structure in a highlycontrolled manner (68). For these experiments, NSL-fabricated silver triangles wereprepared on an indium tin oxide substrate and subjected to multiple chronocoulo-metric runs. Figure 4 shows the results of these experiments. The particular powerof this approach is that the triangles are selectively oxidized (first at the bottom edges,then at the triangular tips, and finally from the top face), allowing the LSPR response
www.annualreviews.org • Localized Plasmon Spectroscopy 275
Ann
u. R
ev. P
hys.
Che
m. 2
007.
58. D
ownl
oade
d fr
om a
rjou
rnal
s.an
nual
revi
ews.
org
by N
OR
TH
WE
STE
RN
UN
IVE
RSI
TY
- E
vans
ton
Cam
pus
on 0
1/02
/07.
For
per
sona
l use
onl
y.

ANRV308-PC58-10 ARI 19 October 2006 4:35
Figure 4Localized surface plasmon resonance (LSPR) spectra and atomic-force-microscope images ofAg nanoparticles on indium tin oxide. (a) The LSPR λmax of the Ag nanoparticles shiftstoward shorter wavelengths after subsequent chronocoulometry measurements. (b)Atomic-force-microscope image before any electrochemical oxidation, (c) following onechronocoulometry run, and (d ) following two chronocoulometry runs. Prior toelectrochemical oxidation, the NSL-fabricated nanoparticles have their characteristictriangular shape (b) and the LSPR spectrum shown in red (a); however, after eachchronocoulometric run, the triangular tips are rounded (c,d ) and the LSPR spectrum shifts tohigher energy (a, green and blue curves). The cross section of each atomic-force-microscopeimage illustrates the changing in-plane width of the nanoparticles following oxidation.Reproduced with permission from Reference 68. Copyright 2005 American Chemical Society.
276 Willets · Van Duyne
Ann
u. R
ev. P
hys.
Che
m. 2
007.
58. D
ownl
oade
d fr
om a
rjou
rnal
s.an
nual
revi
ews.
org
by N
OR
TH
WE
STE
RN
UN
IVE
RSI
TY
- E
vans
ton
Cam
pus
on 0
1/02
/07.
For
per
sona
l use
onl
y.

ANRV308-PC58-10 ARI 19 October 2006 4:35
to morphological changes to be directly correlated. For example, we can study therelation between the in-plane width and the LSPR because the triangle height doesnot change during the initial oxidation events. Thus, electrochemical oxidation is aunique tool for changing the shape and size of NSL-fabricated nanoparticles in acontrolled manner, allowing the observation of systematic trends.
A third approach for examining the relationship between shape, size, and theLSPR wavelength is through single-nanoparticle spectroscopy (20, 33, 57, 58, 98,99). Because there is inherent heterogeneity among individual nanoparticles, eachLSPR spectrum is different, revealing the true distribution of resonance wavelengths(20, 98). For example, silver colloids prepared via a citrate reduction have a vari-ety of shapes and sizes, which results in a vast array of LSPR spectra (20, 99). Thedifferent shapes show different refractive-index sensitivities, with rods showing thehighest sensitivity followed by triangles, then spheres (20). More refined syntheticapproaches produce nanoparticles with less heterogeneity in shape and size and evenhigher refractive-index sensitivity (57, 69, 70). For example, triangular nanoprismsfunctionalized with alkanethiols of increasing chain length show a 4.4-nm shift inmaximum LSPR wavelength per each additional methyl group, the highest short-range, single-particle refractive-index sensitivity reported thus far (100). Moreover,the height, width, and tip sharpness of these nanoprisms can be controlled, allow-ing the characterization of the relationships between these structural properties andboth the LSPR wavelength and refractive-index sensitivity (69, 100).
Single-particle spectroscopy has also revealed unique spectroscopic properties.For example, when individual cubic nanoparticles with a 30-nm edge length are placedon a dielectric substrate, the LSPR spectrum reveals two peaks: a broad red peak that isalso present in solution, and a narrow blue peak that emerges owing to its interactionwith the dielectric substrate (57). For a nanoparticle to yield a new plasmon resonancepeak when placed on a dielectric surface, it must satisfy two conditions: (a) Its nearfields must be most intense at the polar (rather than the equatorial) regions of thenanoparticle, and (b) it must be thicker than the skin depth of the material (∼25 nmfor silver). This new peak also shows improved refractive-index sensitivity owing toits narrow line width, defined by a figure of merit in which the bulk refractive-indexsensitivity is divided by the full width half max of the peak (57). Thus, this novel cubicarchitecture may be valuable for future LSPR sensing experiments.
Localized Surface Plasmon Resonance Distance Dependence
Equation 3 models the change in the LSPR wavelength as the refractive index of thenanoparticles’ surroundings is changed. In this equation, the EM-field decay lengthwas approximated as a single exponential decay with characteristic decay length ld .Although Equation 3 provides a reasonable approximation of the behavior of thefield, it provides no insight into the effect of nanoparticle structure on the EM-fielddecay length and related properties. To understand this relationship, researchers haveconducted initial experiments by measuring the LSPR wavelength shift of NSL-fabricated triangles using self-assembled alkanethiol mono- and multilayers to probethe short-range and long-range distance dependence of the field, respectively (63,
www.annualreviews.org • Localized Plasmon Spectroscopy 277
Ann
u. R
ev. P
hys.
Che
m. 2
007.
58. D
ownl
oade
d fr
om a
rjou
rnal
s.an
nual
revi
ews.
org
by N
OR
TH
WE
STE
RN
UN
IVE
RSI
TY
- E
vans
ton
Cam
pus
on 0
1/02
/07.
For
per
sona
l use
onl
y.

ANRV308-PC58-10 ARI 19 October 2006 4:35
Atomic layer deposition(ALD): a self-limitinggrowth process thatproduces a single monolayerof material per depositioncycle
101). The results of the short-range studies suggest that the LSPR shift decreaseswhen either (a) the nanoparticle in-plane width increases or (b) the nanoparticleout-of-plane height increases, whereas the long-range studies suggest the oppositetrend (63, 101). However, these experiments had less-than-optimal control over layerthickness and local refractive index owing to the effects of alkanethiol-chain tilt angleand packing density.
Recently, researchers carried out a second-generation LSPR distance-dependencestudy. They employed atomic layer deposition (ALD) to provide the ultimate in dis-tance resolution and a highly uniform refractive index independent of layer thick-ness (102–104). Here, a single atomic layer of alumina (Al2O3) is deposited ontothe nanoparticle surface, which provides 1.1-A distance resolution (104). Figure 5a
shows the LSPR shift from NSL-fabricated nanoparticles of varying out-of-planeheights as the alumina film thickness increases (62). The nanoparticles show LSPRshifts even with a single atomic layer of Al2O3, demonstrating the impressive sensitiv-ity of nanoparticles to their local environment. However, this sensitivity diminishesas the nanoparticle out-of-plane height increases: The thickest nanoparticles show
a b
AI20
3 film thickness (Å) AI
20
3 film thickness (nm)
Raman shift (cm-1)LS
PR
sh
ift
(nm
)
I 15
94(d
)/I
15
94(0
)
Inte
ns
ity
vib = 1594 cm-1
0.0 1.0 2.0 3.0 4.0 5.00.0
1.0
8000 200 400 6000
40
80
120
160
200
1000 ADU s-1 mW-1
1600 1400 1200 1000 8001800
1594
1
2
3
4
0.0 nm
1.6 nm
4.8 nm3.2 nm
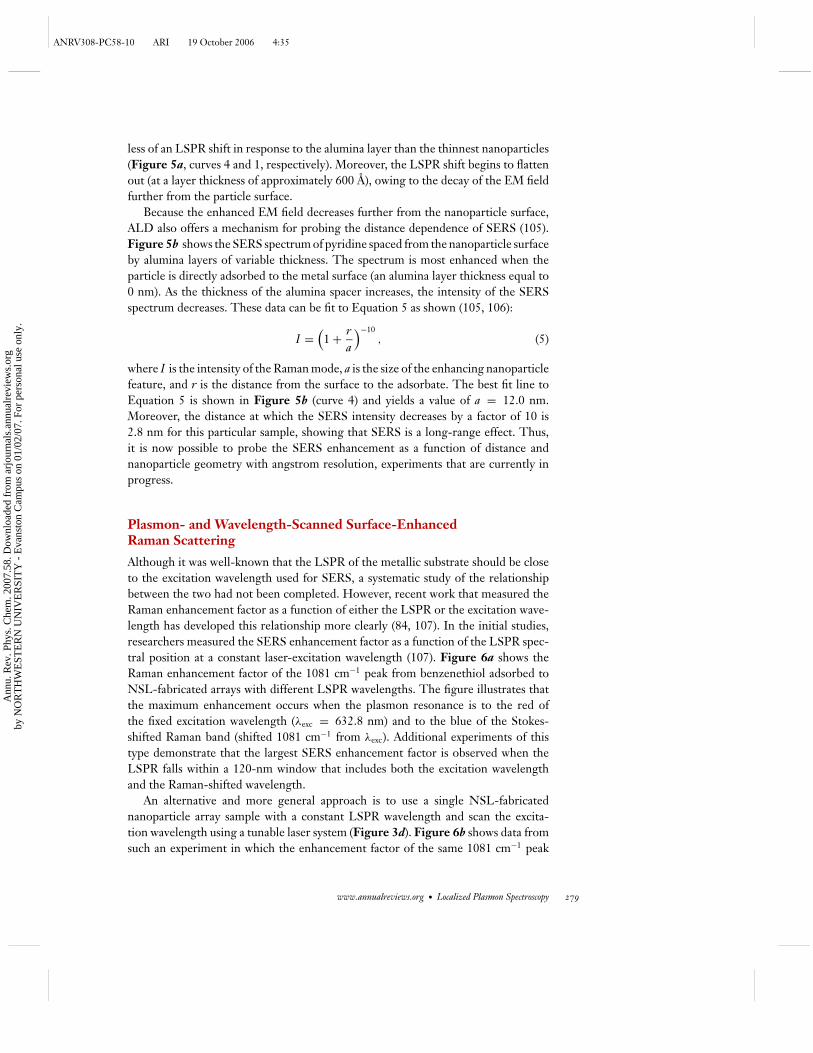
Figure 5(a) Localized surface plasmon resonance (LSPR) shift versus Al2O3 film thickness for particlesof different shape and size. Data are presented for silver triangular nanoparticles with in-planewidths of 90 nm and thicknesses of (1) 30 nm, (2) 40 nm, and (4) 51 nm, as well as Aghemispherical nanoparticles with an in-plane width 104 nm and thickness of 52 nm (3).Reproduced with permission from Reference 62. Copyright 2005 American Chemical Society.(b) Plot of normalized surface-enhanced Raman scattering (SERS) intensity as a function ofalumina thickness for the 1594 cm−1 band of pyridine. (Inset) SERS spectra from which thenormalized SERS intensity is calculated. From Reference 105; reproduced with permission ofThe Royal Society of Chemistry.
278 Willets · Van Duyne
Ann
u. R
ev. P
hys.
Che
m. 2
007.
58. D
ownl
oade
d fr
om a
rjou
rnal
s.an
nual
revi
ews.
org
by N
OR
TH
WE
STE
RN
UN
IVE
RSI
TY
- E
vans
ton
Cam
pus
on 0
1/02
/07.
For
per
sona
l use
onl
y.
ANRV308-PC58-10 ARI 19 October 2006 4:35
less of an LSPR shift in response to the alumina layer than the thinnest nanoparticles(Figure 5a, curves 4 and 1, respectively). Moreover, the LSPR shift begins to flattenout (at a layer thickness of approximately 600 A), owing to the decay of the EM fieldfurther from the particle surface.
Because the enhanced EM field decreases further from the nanoparticle surface,ALD also offers a mechanism for probing the distance dependence of SERS (105).Figure 5b shows the SERS spectrum of pyridine spaced from the nanoparticle surfaceby alumina layers of variable thickness. The spectrum is most enhanced when theparticle is directly adsorbed to the metal surface (an alumina layer thickness equal to0 nm). As the thickness of the alumina spacer increases, the intensity of the SERSspectrum decreases. These data can be fit to Equation 5 as shown (105, 106):
I =(
1 + ra
)−10, (5)
where I is the intensity of the Raman mode, a is the size of the enhancing nanoparticlefeature, and r is the distance from the surface to the adsorbate. The best fit line toEquation 5 is shown in Figure 5b (curve 4) and yields a value of a = 12.0 nm.Moreover, the distance at which the SERS intensity decreases by a factor of 10 is2.8 nm for this particular sample, showing that SERS is a long-range effect. Thus,it is now possible to probe the SERS enhancement as a function of distance andnanoparticle geometry with angstrom resolution, experiments that are currently inprogress.
Plasmon- and Wavelength-Scanned Surface-EnhancedRaman Scattering
Although it was well-known that the LSPR of the metallic substrate should be closeto the excitation wavelength used for SERS, a systematic study of the relationshipbetween the two had not been completed. However, recent work that measured theRaman enhancement factor as a function of either the LSPR or the excitation wave-length has developed this relationship more clearly (84, 107). In the initial studies,researchers measured the SERS enhancement factor as a function of the LSPR spec-tral position at a constant laser-excitation wavelength (107). Figure 6a shows theRaman enhancement factor of the 1081 cm−1 peak from benzenethiol adsorbed toNSL-fabricated arrays with different LSPR wavelengths. The figure illustrates thatthe maximum enhancement occurs when the plasmon resonance is to the red ofthe fixed excitation wavelength (λexc = 632.8 nm) and to the blue of the Stokes-shifted Raman band (shifted 1081 cm−1 from λexc). Additional experiments of thistype demonstrate that the largest SERS enhancement factor is observed when theLSPR falls within a 120-nm window that includes both the excitation wavelengthand the Raman-shifted wavelength.
An alternative and more general approach is to use a single NSL-fabricatednanoparticle array sample with a constant LSPR wavelength and scan the excita-tion wavelength using a tunable laser system (Figure 3d). Figure 6b shows data fromsuch an experiment in which the enhancement factor of the same 1081 cm−1 peak
www.annualreviews.org • Localized Plasmon Spectroscopy 279
Ann
u. R
ev. P
hys.
Che
m. 2
007.
58. D
ownl
oade
d fr
om a
rjou
rnal
s.an
nual
revi
ews.
org
by N
OR
TH
WE
STE
RN
UN
IVE
RSI
TY
- E
vans
ton
Cam
pus
on 0
1/02
/07.
For
per
sona
l use
onl
y.

ANRV308-PC58-10 ARI 19 October 2006 4:35
600 680640 720 760
1.2
1.0
0.8
0.6
0.4
0.2
a
EF
(1081 c
m–1)
x 1
08
LSPR max
(nm)
Wavelength (nm)
Wave numbers (cm–1)
Wavelength (nm)
Wave numbers (cm–1)
b
14000 18000 220000.05
0.1
0.15
0.2
0.25
0.0E+00.0E+0
4.0E+6
8.0E+6
1.2E+7
1.6E+7
2.0E+7800 700 600 500
Exti
ncti
on
En
han
cem
en
t facto
r
c
12000 16000 200000
0.1
0.2
0.3
0.0E+00.0E+0
2.0E+72.0E+7
4.0E+74.0E+7
6.0E+76.0E+7
8.0E+78.0E+7
1.0E+81.0E+81000 800 700 600 500
Exti
ncti
on
En
han
cem
en
t facto
r
Figure 6(a) Plasmon-sampled surface-enhanced Raman excitation spectrum of the 1081 cm−1 peak ofbenzenethiol (dashed line) excited at 632.8 nm (solid line). The enhancement factor is highestwhen the plasmon wavelength is between the Raman excitation and emission energies.Reproduced with permission from Reference 107. Copyright 2003 American ChemicalSociety. (b) Wavelength-scanned surface-enhanced Raman excitation spectra of the 1081 cm−1
peak of benzenethiol, LSPR λmax = 690 nm, profile fit maximum at 662 nm. (c)Wavelength-scanned surface-enhanced Raman excitation spectra of the 1575 cm−1 peak ofbenzenethiol, LSPR λmax = 810 nm, profile fit maximum at 765 nm. Reproduced withpermission from Reference 84. Copyright 2005 American Chemical Society.
280 Willets · Van Duyne
Ann
u. R
ev. P
hys.
Che
m. 2
007.
58. D
ownl
oade
d fr
om a
rjou
rnal
s.an
nual
revi
ews.
org
by N
OR
TH
WE
STE
RN
UN
IVE
RSI
TY
- E
vans
ton
Cam
pus
on 0
1/02
/07.
For
per
sona
l use
onl
y.

ANRV308-PC58-10 ARI 19 October 2006 4:35
Molecular resonances:electronic (or vibrational)resonances in moleculesthat absorb photons in thesame energy region as thelocalized surface plasmonresonance
from benzenethiol is monitored as the excitation wavelength varied between 475 and800 nm. The excitation spectrum shows the highest SERS enhancement factor whenthe excitation wavelength is to the blue of the LSPR wavelength, consistent with theplasmon-scanned results above. (The axes on this plot are in units of increasing wavenumber and thus decreasing wavelength.) Based on Gaussian fits to the spectra, theshift between the maximum energy of the excitation profile and the LSPR spectrumis 613 cm−1, placing it roughly at the midpoint of the shift between the excitationand the Stokes Raman scattering energies (i.e., 1081 cm−1). The 1575 cm−1 peak ofbenzenethiol shown in Figure 6c also demonstrates this relationship. Again, the shiftbetween the excitation wavelength producing the maximum enhancement and thepeak in the extinction spectrum is 726 cm−1, or roughly half of the shift between theexcitation and Raman-shifted scatter.
By repeating this measurement on different vibrational bands, we see a distincttrend emerge: For higher-energy Raman transitions, the shift between the excitationprofile and the LSPR spectrum also moves to higher energy. This is because the LSPRshould be located at some intermediate energy between the excitation and RamanEM fields to provide the maximum enhancement of the two. As the Raman tran-sition moves to higher energy, the gap between the excitation and Raman energieswidens, and the LSPR maximum must shift to remain roughly midway between thetwo. In this case, the LSPR is static, so the effect is reversed: The excitation profileshifts to higher energy. This is in agreement with the EM-enhancement mecha-nism and is an important outcome of these wavelength-scanned SERS experiments.Moreover, these experiments illustrate the importance of optimizing the plasmon andexcitation wavelengths to achieve maximum SERS enhancements; enhancements ofnearly 108 can be produced when experimental conditions are properly optimized(Figure 6c). Although ensemble-averaged SERS enhancement factors of 108 are thehighest we have measured to date, there is good reason to believe that future experi-ments will reveal substantially higher values for systems involving highly crystallinesingle nanoparticles and specific, finite nanoparticle assemblies (108).
Localized Surface Plasmon Resonance SpectroscopyNear Molecular Resonances
Surface-enhanced resonance Raman scattering (SERRS) has been known for produc-ing enhancement factors of the order 1011–1012 dating back to the original report ofSERS (1, 107). In SERRS, the Raman excitation light is of sufficient energy to pro-mote an electronic transition in the molecule of interest, from the ground to someelectronically excited state. When the LSPR of the enhancing substrate is also in theproper energy region, this provides SERRS enhancement factors that are roughly theproduct of the enhancement factors for nonresonant SERS of the substrate and theresonance Raman spectrum of the adsorbate (107). However, there had previouslynot been any study on the effect of an electronically resonant molecule on the spectralposition and lineshape of the nanoparticle plasmon resonance.
To study this relationship, recent work focused on the LSPR shift induced by theadsorption of a molecule whose absorption spectrum is in the same energy region as
www.annualreviews.org • Localized Plasmon Spectroscopy 281
Ann
u. R
ev. P
hys.
Che
m. 2
007.
58. D
ownl
oade
d fr
om a
rjou
rnal
s.an
nual
revi
ews.
org
by N
OR
TH
WE
STE
RN
UN
IVE
RSI
TY
- E
vans
ton
Cam
pus
on 0
1/02
/07.
For
per
sona
l use
onl
y.

ANRV308-PC58-10 ARI 19 October 2006 4:35
the plasmon resonance (109). [2, 3, 7, 8, 12, 13, 17, 18-Octakis(propyl) porphyrazi-nato] magnesium (II) has the solution-phase absorption curve shown in Figure 7a.When this molecule is adsorbed on NSL-fabricated nanoparticles with LSPR wave-lengths both near and far from the molecular resonance, the shift is quite different(Figure 7a) (109). When the LSPR λmax is close to the molecular resonance, theshift is either enhanced (Figure 7b) or suppressed (Figure 7d). In contrast, when theLSPR λmax is far from the molecular resonance, the shift is less dramatic and closerto expectations based on a simple refractive-index change (Figure 7c). This resultsuggests that it may be possible to optimize the LSPR shift response for sensing ex-periments in which the analyte of interest has an electronic resonance in the visibleor infrared region of the spectrum (see below).
LOCALIZED SURFACE PLASMON RESONANCE SENSING
Whereas the above section describes several fundamental spectroscopic relationshipsand their impact on LSPR sensing, this section focuses on sensing molecules of bio-logical and chemical interest. We focus on two different sensing modes—wavelength-shift LSPR sensing and SERS—and their application to several different systems.
Localized Surface Plasmon Resonance Wavelength-Shift Sensing
The most common method for LSPR sensing is the wavelength-shift measure-ment, in which the change in the maximum (or minimum) of the LSPR extinc-tion curve is monitored as a function of changes in the local dielectric environmentcaused by analyte adsorption. This relationship is described in Equation 3, and hasbeen demonstrated for a number of systems in which either the bulk-solvent re-fractive index or the length of a molecular adsorbate (i.e., a linear alkane chain) ischanged (20, 24, 32, 46, 57, 88, 98). Coupling two plasmonic nanoparticles alsoleads to a shift in λmax. Researchers have demonstrated this for the released NSL-fabricated triangles described above, which were coupled using alkanedithiols (96),and more recently, for Au spheres linked by double-stranded DNA of varying length(110, 111).
This sensitivity to local environment can be expanded to sensing biologicalmolecules such as proteins and antibodies. Initial demonstrations of this principlemeasured the shift in λmax on binding of either streptavidin or antibiotin to biotin-functionalized nanoparticle arrays (82, 112). Experiments measuring the binding ofconcanavalin A to mannose-functionalized nanoparticles followed these first demon-strations (21). Figure 8a shows the real-time kinetic response of the LSPR shiftfor mannose-functionalized nanoparticles of different thickness on exposure to con-canavalin A followed by washing with buffer. In all cases, the LSPR λmax changes inresponse to the concanavalin A with a similar time constant but with a different overallshift magnitude. This agrees with the distance-dependence experiments because theLSPR wavelength-shift response was largest for the thinnest nanoparticles. Theseexperiments demonstrate the importance of the fundamental spectroscopic studiesdescribed above for guiding the design of LSPR sensing experiments.
282 Willets · Van Duyne
Ann
u. R
ev. P
hys.
Che
m. 2
007.
58. D
ownl
oade
d fr
om a
rjou
rnal
s.an
nual
revi
ews.
org
by N
OR
TH
WE
STE
RN
UN
IVE
RSI
TY
- E
vans
ton
Cam
pus
on 0
1/02
/07.
For
per
sona
l use
onl
y.

ANRV308-PC58-10 ARI 19 October 2006 4:35
a
b
c
d500 550 600 650 700
0
20
40
60
Molecular resonance
LSPR shift
Wavelength (nm)
LS
PR
sh
ift
(nm
)
400 600 800 1000
0.18
0.08
0.1
0.12
0.14
0.16
Wavelength (nm)
400 600 800 10000.16
0.2
0.24
0.28
0.32
Exti
ncti
on
400 600 800 10000.14
0.16
0.18
0.2
0.22
0.24
0.26
Wavelength (nm)E
xti
ncti
on
Wavelength (nm)
Exti
ncti
on
1
1
2
2
1
2
Figure 7(a) Localized surface plasmon resonance (LSPR) shift induced by [2, 3, 7, 8, 12, 13, 17,18-Octakis(propyl) porphyrazinato] magnesium (II) (MgPz) adsorption to Ag nanoparticlesversus initial nanoparticle LSPR wavelength (blue dots). The absorption spectrum of the MgPzis also shown (red line). (b–d) LSPR spectra before and after MgPz adsorption both (b, d ) nearand (c) far from the molecular resonance. Measured LSPR shifts are (b) 59.6 nm, (c) 20.0 nm,and (d) 2.5 nm. Reproduced with permission from Reference 109. Copyright 2006 AmericanChemical Society.
www.annualreviews.org • Localized Plasmon Spectroscopy 283
Ann
u. R
ev. P
hys.
Che
m. 2
007.
58. D
ownl
oade
d fr
om a
rjou
rnal
s.an
nual
revi
ews.
org
by N
OR
TH
WE
STE
RN
UN
IVE
RSI
TY
- E
vans
ton
Cam
pus
on 0
1/02
/07.
For
per
sona
l use
onl
y.

ANRV308-PC58-10 ARI 19 October 2006 4:35
a
b
c
1759.7
1780.6
2762.6
2809.1
3766.9
3824.5
0 400 800 1200
0
5
10
15
20
25
Time (s)
Δλm
ax (
nm
)
Buffer Concanavalin A Buffer
16 nm
100 nm
25 nm
100 nm
50 nm
d
Ag
Ag
Ag
100 nm
650 700 750 800 850 9000.06
0.08
0.1
0.12
0.14
0.16
Wavelength (nm)
Exti
ncti
on
650 700 750 800 850 9000.06
0.08
0.1
0.12
0.14
0.16
Wavelength (nm)
Exti
ncti
on
Ka,surf
Ka,surf
CSF
21 3
Figure 8(a) Real-time response of mannose-functionalized Ag nanosensor of different out-of-planeheights as 19-μM concanavalin A is injected in the cell following buffer injection. The solidlines are provided as guides. Reproduced with permission from Reference 21. Copyright 2004American Chemical Society. (b) Surface chemistry for the possible amyloid-beta-deriveddiffusible ligand (ADDL) detection in human cerebrospinal fluid (CSF) samples using theantibody sandwich assay. The three steps include (1) functionalization with 100-mManti-ADDL, (2) the introduction of human CSF, and (3) the introduction of the secondcapping antibody. (c) Localized surface plasmon resonance spectra for each step of the assay foran age-matched control patient. (d) LSPR spectra for each step of the assay for an Alzheimer’spatient. Reproduced with permission from Reference 17. Copyright 2005 American ChemicalSociety.
284 Willets · Van Duyne
Ann
u. R
ev. P
hys.
Che
m. 2
007.
58. D
ownl
oade
d fr
om a
rjou
rnal
s.an
nual
revi
ews.
org
by N
OR
TH
WE
STE
RN
UN
IVE
RSI
TY
- E
vans
ton
Cam
pus
on 0
1/02
/07.
For
per
sona
l use
onl
y.

ANRV308-PC58-10 ARI 19 October 2006 4:35
ADDL:amyloid-beta-deriveddiffusible ligand
CaDPA: calciumdipicolinate
Perhaps the most biomedically relevant demonstration of LSPR sensing has beenthe work in which a biomarker for Alzheimer’s disease, amyloid-beta-derived dif-fusible ligand (ADDL) (113–115), has been sensed using LSPR spectroscopy (17, 18).For these experiments, researchers developed a sandwich-format assay (Figure 8b):First the nanoparticle array is functionalized with an antibody for the ADDLmolecules; then the ADDLs are allowed to bind to the antibodies; and finally, asecond capping antibody is introduced that can bind to the surface-bound ADDLand complete the sandwich assay. Initial experiments using synthetic ADDLs showedthat ADDL concentrations on the order of 100 fM could be detected (17). Next, theexperiments were repeated using cerebrospinal fluid (CSF) from both an Alzheimer’spatient, as well as an age-matched control (17). The results from these experimentsare shown in Figures 8d,c, respectively. In Figure 8c, the CSF from an age-matchedcontrol patient is exposed to the anti-ADDL functionalized nanoparticles; the shift inthe LSPR spectrum is modest after both initial CSF exposure as well as the introduc-tion of the second capping antibody (�λmax = 2.9 and 4.3 nm, respectively). Figure 8d
shows the data from an Alzheimer’s patient. Here, the binding of the ADDLs in theCSF induces a shift of 28.5 nm, with a further shift of 15.4 nm after the secondantibody is introduced. The researchers obtained a similar result when they usedbrain extract instead of CSF. Thus, LSPR spectroscopy is a promising technologyfor sensing this biomarker of Alzheimer’s disease in a clinical setting. Moreover, thisapproach can be broadly generalized, allowing the diagnosis of any disease with anassociated biomarker and antibody pair (such as ovarian cancer) (116).
Sensing experiments can also benefit from the introduction of an electronicallyresonant analyte (as described above). This has been demonstrated recently usingcytochrome P450, which changes its absorption spectrum on the binding of smallmolecules such as camphor (117). As with previous examples above, the adsorptionof the cytochrome P450 to the nanoparticle surface leads to a red shift in the LSPRwavelength owing to the change in the local refractive index. However, the bindingof camphor to the adsorbed cytochrome P450 leads to a blue shift in the absorptionspectrum of the protein, which, in turn, induces a corresponding blue shift in theLSPR spectrum (117). Thus, small-molecule binding, which normally does not yielda large-enough refractive-index change to induce a detectable LSPR shift, can nowbe sensed using LSPR spectroscopy near an electronic resonance.
Surface-Enhanced Raman Scattering Sensing
A second application in which the LSPR plays an important role is SERS-basedsensing. As described above, it is important for the LSPR of the enhancing substrateto be properly matched with the Raman excitation and scattering wavelengths (84,107). Here we describe several examples in which SERS is used for biological sensingexperiments.
Recent work has focused on the detection of an anthrax biomarker, calcium dipicol-inate (CaDPA), using SERS on both bare and alumina-modified silver FON substrates(Figure 9a) (42, 118). Bacillus subtilis spores (a harmless simulant of B. anthracis) aresonicated in dilute nitric acid to extract the CaDPA; this solution is then deposited
www.annualreviews.org • Localized Plasmon Spectroscopy 285
Ann
u. R
ev. P
hys.
Che
m. 2
007.
58. D
ownl
oade
d fr
om a
rjou
rnal
s.an
nual
revi
ews.
org
by N
OR
TH
WE
STE
RN
UN
IVE
RSI
TY
- E
vans
ton
Cam
pus
on 0
1/02
/07.
For
per
sona
l use
onl
y.

ANRV308-PC58-10 ARI 19 October 2006 4:35
Figure 9(a) Scanning-electron-microscope images of alumina-modified Ag film over nanosphere(FON) substrates. (b) Surface-enhanced Raman scattering (SERS) spectrum of 2 × 10⁻⁵ MCaDPA in 0.2 μL, 0.02 M HNO3 on alumina-modified silver FON substrate. ∗273 = adu s−1
mW−1; adu, analog to digital converter units on the CCD detector; s, seconds of datacollection time; mW, millwatts of laser power. (c) The alumina thickness effect on the SERSintensity. The spectral intensities at 1020 cm−1 are plotted versus atomic layer deposition(ALD) cycles and normalized against the highest measured intensity, in this case after twoALD cycles. (d) The intensity ratio (I1020/I1050) variation with time for an alumina-modifiedsilver FON (two ALD cycles) over a nine-month period. Reproduced with permission fromReference 118. Copyright 2006 American Chemical Society.
onto a silver FON (both bare and alumina modified); and the SERS spectrum is mea-sured as shown in Figure 9b. The peak at 1020 cm−1 is indicative of the CaDPA,whereas the 1050 cm−1 peak owing to nitric acid provides an internal standard. InFigure 9c, the intensity of the 1020 cm−1 peak is plotted with an increasing numberof alumina monolayers. Figure 9 shows two competing effects: Initially the intensity
286 Willets · Van Duyne
Ann
u. R
ev. P
hys.
Che
m. 2
007.
58. D
ownl
oade
d fr
om a
rjou
rnal
s.an
nual
revi
ews.
org
by N
OR
TH
WE
STE
RN
UN
IVE
RSI
TY
- E
vans
ton
Cam
pus
on 0
1/02
/07.
For
per
sona
l use
onl
y.

ANRV308-PC58-10 ARI 19 October 2006 4:35
CEES: chloroethyl ethylsulfide
of the 1020 cm−1 peak increases because alumina is acting as a capture layer for theanalyte (118). However, after three cycles of alumina deposition, the Raman sig-nal decreases owing to the drop-off in EM-field enhancement, in analogy to thedistance-dependence study shown in Figure 5b. Using this scheme, the detectionlimit is 1400 spores, better than the previously reported limit of 2600 spores for baresilver surfaces and well below the infectious dose of 104 spores (42). Moreover, thealumina layer protects the FON surface from oxidation, improving the temporal sta-bility of these SERS substrates to greater than 270 days after fabrication (Figure 9d )(118).
In addition to capture layers, which provide high-affinity binding sites for targetanalytes, partition layers are also important for quantitative, real-time detection ofmolecules, such as glucose. Current commercial glucose sensors rely on the user’sdiligence to take readings from drawn blood in a periodic fashion; as such, data onblood glucose concentration are taken only a few times during the day. A real-time,implantable glucose sensor would be a vast improvement, and SERS may be a routeto such a device (4, 87, 119, 120). To develop a viable glucose sensor, researchers mustassemble a SERS substrate that allows the glucose to approach the metal surface tobenefit from the enhanced EM fields, but also to be rapidly released from the sur-face to maintain a quantitative equilibrium that accurately reflects the local glucoseconcentration. This is accomplished using partition layers, which are analogous tothe stationary phases used in high-performance liquid chromatography and providelow affinity and rapidly reversible binding sites for target analytes. In the case of glu-cose sensing, researchers have developed a mixed self-assembled monolayer that hasboth hydrophobic and hydrophilic components and can assemble on the FON (120).With this functionalized SERS substrate, quantitative detection of local glucose con-centration has been demonstrated using SERS both in vitro and in vivo (105, 120).Moreover, the SERS-based glucose sensor measures glucose concentration directlyby monitoring its spectral signature, rather than the indirect electrochemical methodemployed by most commercial sensors. Lastly, this sensor can provide real-time in-formation, allowing potentially harmful fluctuations in glucose levels to be monitoredand remedied in a timely manner (120).
All the experiments described thus far detect molecules introduced to the sensingsurface via solution-phase chemistry. However, SERS is also an effective means fordetecting molecules in the gas phase, as shown in a previous study in which severaldifferent molecules were vapor deposited onto a silver FON substrate in ultrahighvacuum (121). This has recently been expanded to a gas-phase detection protocol un-der ambient conditions—in particular, for the detection of 2-chloroethyl ethyl sulfide(CEES), a simulant of the chemical-warfare agent mustard gas (122). By incubatinga silver FON optimized for 785-nm excitation with CEES-saturated air, researchersobserved the Raman spectrum of the CEES molecule, even in the absence of a capturelayer. One important feature of this experiment is that they used a portable Ramanspectrometer for these measurements; thus, this experiment could be repeated inthe field where the presence of chemical-warfare agents must be detected quickly,efficiently, and without false positives. Moreover, CEES could be detected at con-centrations much lower than the harmful limit. Thus, this experiment represents an
www.annualreviews.org • Localized Plasmon Spectroscopy 287
Ann
u. R
ev. P
hys.
Che
m. 2
007.
58. D
ownl
oade
d fr
om a
rjou
rnal
s.an
nual
revi
ews.
org
by N
OR
TH
WE
STE
RN
UN
IVE
RSI
TY
- E
vans
ton
Cam
pus
on 0
1/02
/07.
For
per
sona
l use
onl
y.

ANRV308-PC58-10 ARI 19 October 2006 4:35
important first step toward the detection of these harmful gas-phase nerve agentsusing SERS spectroscopy.
CONCLUSIONS
In this review, we describe studies related both to the fundamental spectroscopicproperties of LSPR spectroscopy as well as to several biological and chemical sensingexperiments. The results demonstrate the importance of nanoparticle shape and sizeon both the spectral location of the LSPR and its sensitivity to changes in the localrefractive index. Moreover, the response of the nanoparticles is highly distance de-pendent, as shown with ALD studies measuring both the alumina-induced LSPR shiftand the SERS intensity of an adsorbed molecule. Studies in which both the plasmonand Raman excitation wavelength are varied to find the conditions for maximumSERS enhancements demonstrate that the plasmon wavelength should be locatedsomewhere between the excitation and Raman emission wavelengths, as predictedby the EM-enhancement theory. Lastly, localized surface plasmon spectroscopy nearmolecular resonances provides a new direction for future sensing experiments owingto the enhanced LSPR shifts.
Applications of both wavelength-shift and SERS sensing have shown that a varietyof chemically and biologically relevant molecules can be detected—from biomarkersof Alzheimer’s disease and anthrax to the direct detection of glucose and chemical-warfare agents. Moreover, the results of these studies demonstrate the necessity offundamental spectroscopic studies for guiding experimental design to achieve thelargest overall signal or to observe signals at all. As our understanding of the plasmonicresponse of nanoparticles continues to grow, these LSPR-based sensing experimentswill improve as well, leading to higher sensitivity, faster and more reversible responses,and an ever-broadening scope of applicability.
SUMMARY POINTS
1. LSPR spectroscopy is used for biological and chemical sensing by transduc-ing changes in the local refractive index via a wavelength-shift measurement.
2. LSPR spectroscopy offers similar sensitivity to the commercially avail-able SPR systems, with the additional advantages of wavelength tunability,smaller sensing volumes, and lower cost instrumentation.
3. Surface-enhanced Raman spectroscopy can identify the presence of spe-cific target molecules based on their unique vibrational signatures. Capture/partition layers provide a means of bringing the target analyte to thenanoparticle surface without obscuring the desired Raman spectrum.
4. Single-nanoparticle LSPR spectroscopy is an important tool for understand-ing the relationship between local structure and spectra. In addition, sin-gle nanoparticles can provide even higher refractive-index sensitivity thannanoparticle arrays.
288 Willets · Van Duyne
Ann
u. R
ev. P
hys.
Che
m. 2
007.
58. D
ownl
oade
d fr
om a
rjou
rnal
s.an
nual
revi
ews.
org
by N
OR
TH
WE
STE
RN
UN
IVE
RSI
TY
- E
vans
ton
Cam
pus
on 0
1/02
/07.
For
per
sona
l use
onl
y.

ANRV308-PC58-10 ARI 19 October 2006 4:35
5. ALD allows the decay of the EM field to be measured as a function ofdistance from the nanoparticle surface using LSPR wavelength-shift spec-troscopy. This same distance dependence can be followed by measuring theSERS enhancement factor of an adsorbed analyte on alumina spacer layersof different thickness.
6. Surface-enhanced Raman spectroscopy is made possible owing to the en-hanced EM fields caused by the excitation of plasmon resonances. Funda-mental studies of the relationships between the LSPR, the SERS excitationwavelength, and the Raman scattered wavelength reveal that the plasmonresonance wavelength maximum should be positioned between the excita-tion and Stokes Raman scattered energies. By properly tuning these condi-tions, enhancement factors up to 108 have been recorded for well-definednanoparticle arrays.
7. LSPR spectroscopy near molecular electronic resonances yields wavelengthshifts that are dramatically different than those expected based on a simplerefractive-index change. New sensing opportunities arise from this recentlydiscovered effect.
ACKNOWLEDGMENTS
The authors gratefully acknowledge Professor George C. Schatz for his assis-tance with theoretical calculations and many helpful discussions. This work wassupported by NSF grants DMR-0076097/008, EEC-0118025, CHE-0414554, andBES-0507036; AFOSR/MURI grant F49620-02-1-0381; DOE grant DE-FG02-03ER15457, NIH grant 4 R33 DK066990-02, and grant number U54CA119341from the NIH National Cancer Institute (NCI). The contents of the review aresolely the responsibility of the authors and do not necessarily represent the officialviews of the NSF, AFOSR, DOE, or the NIH.
LITERATURE CITED1. First submitted paperrecognizing SERS as anew physicalphenomenon with Ramanintensity enhancements of105–106 (see alsoReference 48).
1. Jeanmarie DL, Van Duyne RP. 1977. Surface Raman spectroelectrochem-istry, part 1: heterocyclic, aromatic, and aliphatic amines adsorbed on theanodized silver electrode. J. Electroanal. Chem. 84:1–20
2. Haynes CL, Yonzon CR, Zhang X. 2005. Surface-enhanced Raman sensors:early history and the development of sensors for quantitative biowarfare agentand glucose detection. J. Raman Spectrosc. 36:471–84
3. Recent chapterdescribing the importanttheoretical equationsbehind the EM-fieldenhancement responsiblefor SERS.
3. Schatz GC, Young MA, Van Duyne RP. 2006. Electromagnetic mecha-nism of SERS. In Surface-Enhanced Raman Scattering: Physics and Applica-
tions, ed. K Kneipp, M Moskovits, H Kneipp, pp. 19–46. Berlin: Springer-Verlag
4. Yonzon CR, Haynes CL, Zhang X, Walsh JT, Van Duyne RP. 2004. A glu-cose biosensor based on surface-enhanced Raman scattering: improved partition
www.annualreviews.org • Localized Plasmon Spectroscopy 289
Ann
u. R
ev. P
hys.
Che
m. 2
007.
58. D
ownl
oade
d fr
om a
rjou
rnal
s.an
nual
revi
ews.
org
by N
OR
TH
WE
STE
RN
UN
IVE
RSI
TY
- E
vans
ton
Cam
pus
on 0
1/02
/07.
For
per
sona
l use
onl
y.

ANRV308-PC58-10 ARI 19 October 2006 4:35
layer, temporal stability, reversibility, and resistance to serum protein interfer-ence. Anal. Chem. 76:78–85
5. Zeman EJ, Schatz GC. 1987. An accurate electromagnetic theory study of sur-face enhancement factors for silver, gold, copper, lithium, sodium, aluminum,gallium, indium, zinc, and cadmium. J. Phys. Chem. 91:634–43
6. First paper describingsingle-molecule SERSusing resonant excitationof rhodamine 6Gadsorbed on silvernanoparticles (followedindependently byReference 7).
6. Emory SR, Nie S. 1997. Probing single molecules and single nanoparticlesby surface-enhanced Raman scattering. Science 275:1102–6
7. Kneipp K, Wang Y, Kneipp H, Perelman LT, Itzkan I, et al. 1997. Singlemolecule detection using surface-enhanced Raman scattering (SERS). Phys. Rev.Lett. 78:1667–70
8. Haller KL, Bumm LA, Altkorn RI, Zeman EJ, Schatz GC, Van Duyne RP.1989. Spatially resolved surface enhanced second harmonic generation: theo-retical and experimental evidence for electromagnetic enhancement in the nearinfrared on a laser microfabricated platinum surface. J. Chem. Phys. 90:1237–52
9. Pipino ACR, Schatz GC, Van Duyne RP. 1994. Surface-enhanced second-harmonic diffraction: selective enhancement by spatial harmonics. Phys. Rev.B 49:8320–30
10. Pipino ACR, Van Duyne RP, Schatz GC. 1996. Surface-enhanced second-harmonic diffraction: experimental investigation of selective enhancement.Phys. Rev. B 53:4162–69
11. Yang W, Hulteen J, Schatz GC, Van Duyne RP. 1996. A surface-enhancedhyper-Raman and surface-enhanced Raman scattering study of trans-1,2-bis(4-pyridyl)ethylene adsorbed onto silver film over nanosphere electrodes. Vibra-tional assignments: experiment and theory. J. Chem. Phys. 104:4313–23
12. Geddes CD, Aslan K, Gryczynski I, Malicka J, Lakowicz JR. 2004. Noble-metalsurfaces for metal enhanced fluorescence. Rev. Fluoresc. 1:365–401
13. Goulet PJG, Aroca RF. 2005. Surface-enhancement of fluorescence near noblemetal nanostructures. Top. Fluoresc. Spectrosc. 8:223–47
14. Golab JT, Sprague JR, Carron KT, Schatz GC, Van Duyne RP. 1988. A surface-enhanced hyper-Raman scattering study of pyridine adsorbed onto silver: ex-periment and theory. J. Chem. Phys. 88:7942–51
15. Jensen TR, Van Duyne RP, Johnson SA, Maroni VA. 2000. Surface-enhancedinfrared spectroscopy: a comparison of metal island films with discrete andnondiscrete surface plasmons. Appl. Spectrosc. 54:371–77
16. Shimizu KT, Woo WK, Fisher BR, Eisler HJ, Bawendi MG. 2002. Surface-enhanced emission from single semiconductor nanocrystals. Phys. Rev. Lett.89:117401
17. First description of aclinical diagnosticprocedure using LSPRwavelength-shift sensing.
17. Haes AJ, Chang L, Klein WL, Van Duyne RP. 2005. Detection of abiomarker for Alzheimer’s disease from synthetic and clinical samplesusing a nanoscale optical biosensor. J. Am. Chem. Soc. 127:2264–71
18. Haes AJ, Hall WP, Chang L, Klein WL, Van Duyne RP. 2004. A localizedsurface plasmon resonance biosensor: first steps toward an assay for Alzheimer’sdisease. Nano Lett. 4:1029–34
19. Haes AJ, Stuart DA, Nie SM, Van Duyne RP. 2004. Using solution-phasenanoparticles, surface-confined nanoparticle arrays and single nanoparticles asbiological sensing platforms. J. Fluoresc. 14:355–67
290 Willets · Van Duyne
Ann
u. R
ev. P
hys.
Che
m. 2
007.
58. D
ownl
oade
d fr
om a
rjou
rnal
s.an
nual
revi
ews.
org
by N
OR
TH
WE
STE
RN
UN
IVE
RSI
TY
- E
vans
ton
Cam
pus
on 0
1/02
/07.
For
per
sona
l use
onl
y.

ANRV308-PC58-10 ARI 19 October 2006 4:35
20. McFarland AD, Van Duyne RP. 2003. Single silver nanoparticles as real-timeoptical sensors with zeptomole sensitivity. Nano Lett. 3:1057–62
21. Yonzon CR, Jeoung E, Zou S, Schatz GC, Mrksich M, Van Duyne RP. 2004.A comparative analysis of localized and propagating surface plasmon resonancesensors: the binding of concanavalin A to a monosaccharide functionalized self-assembled monolayer. J. Am. Chem. Soc. 126:12669–76
22. Yonzon CR, Stuart DA, Zhang X, McFarland AD, Haynes CL, Van Duyne RP.2005. Towards advanced chemical and biological nanosensors: an overview.Talanta 67:438–48
23. Yonzon CR, Zhang X, Van Duyne RP. 2003. Localized surface plasmon res-onance immunoassay and verification using surface-enhanced Raman spec-troscopy. Proc. SPIE 5224:78–85
24. Malinsky MD, Kelly KL, Schatz GC, Van Duyne RP. 2001. Chain length de-pendence and sensing capabilities of the localized surface plasmon resonance ofsilver nanoparticles chemically modified with alkanethiol self-assembled mono-layers. J. Am. Chem. Soc. 123:1471–82
25. Jung LS, Campbell CT, Chinowsky TM, Mar MN, Yee SS. 1998. Quantitativeinterpretation of the response of surface plasmon resonance sensors to adsorbedfilms. Langmuir 14:5636–48
26. Smith EA, Corn RM. 2003. Surface plasmon resonance imaging as a tool tomonitor biomolecular interactions in an array based format. Appl. Spectrosc.57:A320–22
27. Brockman JM, Nelson BP, Corn RM. 2000. Surface plasmon resonance imagingmeasurements of ultrathin organic films. Annu. Rev. Phys. Chem. 51:41–63
28. Giebel KF, Bechinger C, Herminghaus S, Riedel M, Leiderer P, et al. 1999.Imaging of cell/substrate contacts of living cells with surface plasmon resonancemicroscopy. Biophys. J. 76:509–16
29. Berger CEH, Beumer TAM, Kooyman RPH, Greve J. 1998. Surface plasmonresonance multisensing. Anal. Chem. 70:703–6
30. Endo T, Kerman K, Nagatani N, Takamura Y, Tamiya E. 2005. Label-freedetection of peptide nucleic acid-DNA hybridization using localized surfaceplasmon resonance based optical biosensor. Anal. Chem. 77:6976–84
31. Endo T, Yamamura S, Nagatani N, Morita Y, Takamura Y, Tamiya E. 2005.Localized surface plasmon resonance based optical biosensor using surface mod-ified nanoparticle layer for label free monitoring of antigen-antibody reaction.Sci. Technol. Adv. Mater. 6:491–500
32. First use of an LSPRwavelength-shiftmeasurement for sensingthe local refractive-indexchange owing toantigen-antibody binding.32. Englebienne P. 1998. Use of colloidal gold surface plasmon resonance
peak shift to infer affinity constants from the interactions between proteinantigens and antibodies specific for single or multiple epitopes. Analyst
123:1599–60333. First report ofsingle-nanoparticle LSPRsensing using single goldnanoparticles (followedindependently byReference 20 using silvernanoparticles).
33. Raschke G, Kowarik S, Franzl T, Soennichsen C, Klar TA, et al. 2003.Biomolecular recognition based on single gold nanoparticle light scatter-ing. Nano Lett. 3:935–38
34. Srituravanich W, Fang N, Sun C, Luo Q, Zhang X. 2004. Plasmonic nano-lithography. Nano Lett. 4:1085–88
www.annualreviews.org • Localized Plasmon Spectroscopy 291
Ann
u. R
ev. P
hys.
Che
m. 2
007.
58. D
ownl
oade
d fr
om a
rjou
rnal
s.an
nual
revi
ews.
org
by N
OR
TH
WE
STE
RN
UN
IVE
RSI
TY
- E
vans
ton
Cam
pus
on 0
1/02
/07.
For
per
sona
l use
onl
y.

ANRV308-PC58-10 ARI 19 October 2006 4:35
35. Kik PG, Maier SA, Atwater HA. 2004. Surface plasmons for nanofabrication.Proc. SPIE 5347:215–23
36. Sundaramurthy A, Schuck PJ, Conley NR, Fromm DP, Kino GS, Moerner WE.2006. Toward nanometer-scale optical photolithography: utilizing the near-fieldof bowtie optical nanoantennas. Nano Lett. 6:355–60
37. Malmqvist M. 1993. Biospecific interaction analysis using biosensor technology.Nature 361:186–87
38. Van Duyne RP. 2004. Molecular plasmonics. Science 306:985–8639. Knoll W. 1998. Interfaces and thin films as seen by bound electromagnetic
waves. Annu. Rev. Phys. Chem. 49:569–63840. Haes AJ, Van Duyne RP. 2004. A unified view of propagating and localized
surface plasmon resonance biosensors. Anal. Bioanal. Chem. 379:920–3041. Haes AJ, Haynes CL, McFarland AD, Zou S, Schatz GC, Van Duyne RP. 2005.
Plasmonic materials for surface-enhanced sensing and spectroscopy. MRS Bull.30:368–75
42. Zhang X, Young MA, Lyandres O, Van Duyne RP. 2005. Rapid detection ofan anthrax biomarker by surface-enhanced Raman spectroscopy. J. Am. Chem.Soc. 127:4484–89
43. Kelly KL, Coronado E, Zhao L, Schatz GC. 2003. The optical properties ofmetal nanoparticles: the influence of size, shape, and dielectric environment. J.Phys. Chem. B 107:668–77
44. Knobloch H, Brunner H, Leitner A, Aussenegg F, Knoll W. 1993. Probing theevanescent field of propagating plasmon surface polaritons by fluorescence andRaman spectroscopies. J. Chem. Phys. 98:10093–95
45. Miller MM, Lazarides AA. 2005. Sensitivity of metal nanoparticle surface plas-mon resonance to the dielectric environment. J. Phys. Chem. B 109:21556–65
46. Jensen TR, Duval ML, Kelly L, Lazarides A, Schatz GC, Van Duyne RP. 1999.Nanosphere lithography: effect of the external dielectric medium on the surfaceplasmon resonance spectrum of a periodic array of silver nanoparticles. J. Phys.Chem. B 103:9846–53
47. Hamamoto K, Micheletto R, Oyama M, Umar AA, Kawai S, Kawakami Y. 2006.An original planar multireflection system for sensing using the local surfaceplasmon resonance of gold nanospheres. J. Opt. A 8:268–71
48. Albrecht MG, Creighton JA. 1977. Anomalously intense Raman spectra of pyri-dine at a silver electrode. J. Am. Chem. Soc. 99:5215–17
49. Otto A, Mrozek I, Grabhorn H, Akemann W. 1992. Surface-enhanced Ramanscattering. J. Phys. Condens. Matter 4:1143–212
50. Moskovits M. 1978. Surface roughness and the enhanced intensity of Ramanscattering by molecules adsorbed on metals. J. Chem. Phys. 69:4159–61
51. Gersten J, Nitzan A. 1980. Electromagnetic theory of enhanced Raman scat-tering by molecules adsorbed on rough surfaces. J. Chem. Phys. 73:3023–37
52. Metiu H, Das P. 1984. The electromagnetic theory of surface enhanced spec-troscopy. Annu. Rev. Phys. Chem. 35:507–36
53. Schatz GC. 1984. Theoretical studies of surface enhanced Raman scattering.Acc. Chem. Res. 17:370–76
292 Willets · Van Duyne
Ann
u. R
ev. P
hys.
Che
m. 2
007.
58. D
ownl
oade
d fr
om a
rjou
rnal
s.an
nual
revi
ews.
org
by N
OR
TH
WE
STE
RN
UN
IVE
RSI
TY
- E
vans
ton
Cam
pus
on 0
1/02
/07.
For
per
sona
l use
onl
y.

ANRV308-PC58-10 ARI 19 October 2006 4:35
54. Wokaun A. 1985. Surface enhancement of optical fields: mechanism and appli-cations. Mol. Phys. 56:1–33
55. Wokaun A. 1984. Surface-enhanced electromagnetic processes. Solid State Phys.38:223–94
56. Haynes CL, Van Duyne RP. 2001. Nanosphere lithography: a versatile nanofab-rication tool for studies of size-dependent nanoparticle optics. J. Phys. Chem. B105:5599–611
57. Sherry LJ, Chang SH, Schatz GC, Van Duyne RP, Wiley BJ, Xia Y. 2005.Localized surface plasmon resonance spectroscopy of single silver nanocubes.Nano Lett. 5:2034–38
58. Mock JJ, Barbic M, Smith DR, Schultz DA, Schultz S. 2002. Shape effects inplasmon resonance of individual colloidal silver nanoparticles. J. Chem. Phys.116:6755–59
59. Haynes CL, McFarland AD, Smith MT, Hulteen JC, Van Duyne RP. 2002.Angle-resolved nanosphere lithography: manipulation of nanoparticle size,shape, and interparticle spacing. J. Phys. Chem. B 106:1898–902
60. Haynes CL, McFarland AD, Van Duyne RP. 2005. Surface-enhanced Ramanspectroscopy. Anal. Chem. 77:A338–46
61. Moran AM, Sung J, Hicks EM, Van Duyne RP, Spears KG. 2005. Secondharmonic excitation spectroscopy of silver nanoparticle arrays. J. Phys. Chem. B109:4501–6
62. Whitney AV, Elam JW, Zou S, Zinovev AV, Stair PC, et al. 2005. Localizedsurface plasmon resonance nanosensor: a high-resolution distance-dependencestudy using atomic layer deposition. J. Phys. Chem. B 109:20522–28
63. Haes AJ, Zou S, Schatz GC, Van Duyne RP. 2004. A nanoscale optical biosensor:the long range distance dependence of the localized surface plasmon resonanceof noble metal nanoparticles. J. Phys. Chem. B 108:109–16
64. Nehl CL, Liao H, Hafner JH. 2006. Optical properties of star-shaped goldnanoparticles. Nano Lett. 6:683–88
65. Xia Y, Halas NJ. 2005. Shape-controlled synthesis and surface plasmonic prop-erties of metallic nanostructures. MRS Bull. 30:338–48
66. Wiley B, Sun Y, Mayers B, Xia Y. 2005. Shape-controlled synthesis of metalnanostructures: the case of silver. Chem. A Eur. J. 11:454–63
67. Sun Y, Xia Y. 2002. Shape-controlled synthesis of gold and silver nanoparticles.Science 298:2176–79
68. Zhang X, Hicks EM, Zhao J, Schatz GC, Van Duyne RP. 2005. Electrochemicaltuning of silver nanoparticles fabricated by nanosphere lithography. Nano Lett.5:1503–7
69. Jin R, Cao YC, Hao E, Metraux GS, Schatz GC, Mirkin CA. 2003. Controllinganisotropic nanoparticle growth through plasmon excitation. Nature 425:487–90
70. Jin R, Cao Y, Mirkin CA, Kelly KL, Schatz GC, Zheng JG. 2001. Photoinducedconversion of silver nanospheres to nanoprisms. Science 294:1901–3
71. Haynes CL, McFarland AD, Zhao L, Van Duyne RP, Schatz GC, et al.2003. Nanoparticle optics: the importance of radiative dipole coupling in two-dimensional nanoparticle arrays. J. Phys. Chem. B 107:7337–42
www.annualreviews.org • Localized Plasmon Spectroscopy 293
Ann
u. R
ev. P
hys.
Che
m. 2
007.
58. D
ownl
oade
d fr
om a
rjou
rnal
s.an
nual
revi
ews.
org
by N
OR
TH
WE
STE
RN
UN
IVE
RSI
TY
- E
vans
ton
Cam
pus
on 0
1/02
/07.
For
per
sona
l use
onl
y.

ANRV308-PC58-10 ARI 19 October 2006 4:35
72. Athawale AA, Katre PP, Majumdar MB. 2005. Nonaqueous phase synthesis ofcopper nanoparticles. J. Nanosci. Nanotech. 5:991–3
73. Bohren CF, Huffman DR. 1983. Absorption and Scattering of Light by SmallParticles. New York: Wiley. 530 pp.
74. Mie G. 1908. Contributions to the optics of turbid media, especially colloidalmetal solutions. Ann. Phys. 25:377–445
75. Excellent reviewarticle on thesize-dependent spectralproperties of goldnanoparticles.
75. Link S, El-Sayed MA. 1999. Spectral properties and relaxation dynamicsof surface plasmon electronic oscillations in gold and silver nano-dots andnano-rods. J. Phys. Chem. B 103:8410–26
76. Draine BT, Flatau PJ. 1994. Discrete-dipole approximation for scattering cal-culations. J. Opt. Soc. Am. A 11:1491–99
77. Jensen TR, Kelly KL, Lazarides A, Schatz GC. 1999. Electrodynamics of noblemetal nanoparticles and nanoparticle clusters. J. Cluster Sci. 10:295–317
78. Yang W, Schatz GC, Van Duyne RP. 1995. Discrete dipole approximation forcalculating extinction and Raman intensities for small particles with arbitraryshapes. J. Chem. Phys. 103:869–75
79. Novotny L, Bian RX, Xie XS. 1997. Theory of nanometric optical tweezers.Phys. Rev. Lett. 79:645–48
80. Bian RX, Dunn RC, Xie XS, Leung PT. 1995. Single molecule emission char-acteristics in near-field microscopy. Phys. Rev. Lett. 75:4772–75
81. Taflove A. 1995. Computational Electrodynamics: The Finite-Difference Time Do-main Method. Boston: Artech House
82. Haes AJ, Van Duyne RP. 2002. A nanoscale optical biosensor: sensitivity andselectivity of an approach based on the localized surface plasmon resonance oftriangular silver nanoparticles. J. Am. Chem. Soc. 124:10596–604
83. Earliest appearance ofthe termsurface-enhanced Ramanspectroscopy and theacronym SERS in print.
83. Van Duyne RP. 1979. Laser excitation of Raman scattering from adsorbedmolecules on electrode surfaces. Chem. Biochem. Appl. Lasers 4:101–85
84. Extensive study of therelationship between theSERS excitation spectrumand the LSPR spectrum ofthe enhancing substrate.
84. McFarland AD, Young MA, Dieringer JA, Van Duyne RP. 2005.Wavelength-scanned surface-enhanced Raman excitation spectroscopy.J. Phys. Chem. B 109:11279–85
85. Haynes CL, Haes AJ, Van Duyne RP. 2001. Nanosphere lithography: synthe-sis and application of nanoparticles with inherently anisotropic structures andsurface chemistry. In Anisotropic Nanoparticles: Synthesis, Characterization, Ap-plications, ed. LA Lyon, S Stranick, CD Keating, P Searson, pp. C.6.3.1–6.3.Warrendale, PA: MRS
86. Introduces theconcept of NSL as alow-cost, materialsgeneral nanofabricationtechnique.
86. Hulteen JC, Van Duyne RP. 1995. Nanosphere lithography: a materialsgeneral fabrication process for periodic particle array surfaces. J. Vac. Sci.
Technol. A 13:1553–5887. Stuart DA, Yonzon CR, Zhang X, Lyandres O, Shah NC, et al. 2005. Glu-
cose sensing using near-infrared surface-enhanced Raman spectroscopy: goldsurfaces, 10-day stability, and improved accuracy. Anal. Chem. 77:4013–19
88. Hicks EM, Zhang XY, Zou SL, Lyandres O, Spears KG, et al. 2005. Plasmonicproperties of film over nanowell surface fabricated by nanosphere lithography.J. Phys. Chem. B 109:22351–58
294 Willets · Van Duyne
Ann
u. R
ev. P
hys.
Che
m. 2
007.
58. D
ownl
oade
d fr
om a
rjou
rnal
s.an
nual
revi
ews.
org
by N
OR
TH
WE
STE
RN
UN
IVE
RSI
TY
- E
vans
ton
Cam
pus
on 0
1/02
/07.
For
per
sona
l use
onl
y.

ANRV308-PC58-10 ARI 19 October 2006 4:35
89. Hicks EM, Zou S, Schatz GC, Spears KG, Van Duyne RP, et al. 2005. Con-trolling plasmon line shapes through diffractive coupling in linear arrays ofcylindrical nanoparticles fabricated by electron beam lithography. Nano Lett.5:1065–70
90. Lamprecht B, Schider G, Lechner RT, Ditlbacher H, Krenn JR, et al. 2000.Metal nanoparticle gratings: influence of dipolar particle interaction on theplasmon resonance. Phys. Rev. Lett. 84:4721–24
91. Fromm DP, Sundaramurthy A, Schuck PJ, Kino G, Moerner WE. 2004. Gap-dependent optical coupling of single “bowtie” nanoantennas resonant in thevisible. Nano Lett. 4:957–61
92. Wiley B, Sun Y, Xia Y. 2005. Polyol synthesis of silver nanostructures: controlof product morphology with Fe(II) or Fe(III) species. Langmuir 21:8077–80
93. Im Sang H, Lee Yun T, Wiley B, Xia Y. 2005. Large-scale synthesis of silvernanocubes: the role of HCl in promoting cube perfection and monodispersity.Angew. Chem. 44:2154–57
94. Jun Y, Choi J, Cheon J. 2006. Shape control of semiconductor and metal oxidenanocrystals through nonhydrolytic colloidal routes. Angew. Chem. 45:3414–39
95. Xu Q, Bao J, Capasso F, Whitesides GM. 2006. Surface plasmon resonances offree-standing gold nanowires fabricated by nanoskiving. Angew. Chem. 45:3631–35
96. Haes AJ, Zhao J, Zou S, Own CS, Marks LD, et al. 2005. Solution-phase,triangular Ag nanotriangles fabricated by nanosphere lithography. J. Phys. Chem.B 109:11158–62
97. Jensen TR, Malinsky MD, Haynes CL, Van Duyne RP. 2000. Nanospherelithography: tunable localized surface plasmon resonance spectra of silvernanoparticles. J. Phys. Chem. B 104:10549–56
98. Mock JJ, Smith DR, Schultz S. 2003. Local refractive index dependence ofplasmon resonance spectra from individual nanoparticles. Nano Lett. 3:485–91
99. Michaels AM, Nirmal M, Brus LE. 1999. Surface enhanced Raman spectroscopyof individual rhodamine 6G molecules on large Ag nanocrystals. J. Am. Chem.Soc. 121:9932–39
100. Sherry LJ, Jin R, Mirkin CA, Schatz GC, Van Duyne RP. 2006. Localizedsurface plasmon resonance spectroscopy of single silver triangular nanoprisms.Nano Lett. In press
101. Haes AJ, Zou S, Schatz GC, Van Duyne RP. 2004. A nanoscale optical biosensor:the short range distance dependence of the localized surface plasmon resonanceof silver and gold nanoparticles. J. Phys. Chem. B 108:6961–68
102. Groner MD, Elam JW, Fabreguette FH, George SM. 2002. Electrical charac-terization of thin Al2O3 films grown by atomic layer deposition on silicon andvarious metal substrates. Thin Solid Films 413:186–97
103. Ritala M, Leskela M. 2002. Atomic layer deposition. In Handbook Thin FilmMaterials, ed. HS Nalwa, Vol. 1, pp. 103–59. San Diego: Academic
104. Ott AW, Klaus JW, Johnson JM, George SM. 1997. Al2O3 thin film growthon Si(100) using binary reaction sequence chemistry. Thin Solid Films 292:135–44
www.annualreviews.org • Localized Plasmon Spectroscopy 295
Ann
u. R
ev. P
hys.
Che
m. 2
007.
58. D
ownl
oade
d fr
om a
rjou
rnal
s.an
nual
revi
ews.
org
by N
OR
TH
WE
STE
RN
UN
IVE
RSI
TY
- E
vans
ton
Cam
pus
on 0
1/02
/07.
For
per
sona
l use
onl
y.

ANRV308-PC58-10 ARI 19 October 2006 4:35
105. Dieringer JA, McFarland AD, Shah NC, Stuart DA, Whitney AV, et al. 2005.Surface enhanced Raman spectroscopy: new materials, concepts, characteriza-tion tools, and applications. Faraday Discuss. 132:9–26
106. Kennedy BJ, Spaeth S, Dickey M, Carron KT. 1999. Determination of thedistance dependence and experimental effects for modified SERS substratesbased on self-assembled monolayers formed using alkanethiols. J. Phys. Chem.B 103:3640–46
107. Haynes CL, Van Duyne RP. 2003. Plasmon-sampled surface-enhanced Ramanexcitation spectroscopy. J. Phys. Chem. B 107:7426–33
108. Zou S, Schatz GC. 2005. Silver nanoparticle array structures that produce giantenhancements in electromagnetic fields. Chem. Phys. Lett. 403:62–67
109. Haes AJ, Zou S, Zhao J, Schatz GC, Van Duyne RP. 2006. Localized surfaceplasmon resonance spectroscopy near molecular resonances. J. Am. Chem. Soc.128:10905–14
110. Reinhard BM, Siu M, Agarwal H, Alivisatos AP, Liphardt J. 2005. Calibrationof dynamic molecular rulers based on plasmon coupling between gold nanopar-ticles. Nano Lett. 5:2246–52
111. Soennichsen C, Reinhard BM, Liphardt J, Alivisatos AP. 2005. A molecularruler based on plasmon coupling of single gold and silver nanoparticles. Nat.Biotech. 23:741–45
112. Riboh JC, Haes AJ, McFarland AD, Yonzon CR, Van Duyne RP. 2003. Ananoscale optical biosensor: real-time immunoassay in physiological buffer en-abled by improved nanoparticle adhesion. J. Phys. Chem. B 107:1772–80
113. Gong Y, Chang L, Viola KL, Lacor PN, Lambert MP, et al. 2003. Alzheimer’sdisease-affected brain: presence of oligomeric AB ligands (ADDLs) suggests amolecular basis for reversible memory loss. Proc. Nat. Acad. Sci. USA 100:10417–22
114. Lambert MP, Barlow AK, Chromy BA, Edwards C, Freed R, et al. 1998. Dif-fusible, nonfibrillar ligands derived from Aβ1−42 are potent central nervoussystem neurotoxins. Proc. Nat. Acad. Sci. USA 95:6448–53
115. Lambert MP, Viola KL, Chromy BA, Chang L, Morgan TE, et al. 2001. Vac-cination with soluble Aβ oligomers generates toxicity-neutralizing antibodies.J. Neurochem. 79:595–605
116. Chapman SC, Kenny HA, Woodruff TK. 2004. Activin, inhibin, and follistatinin ovarian physiology. In The ovary, ed. PCK Leung, EY Adashi, pp. 273–87.San Diego: Elsevier
117. Zhao J, Das A, Zhang X, Schatz GC, Sligar SG, Van Duyne RP. 2006. Res-onance surface plasmon spectroscopy: low molecular weight substrate bindingto cytochrome P450. 128:11004–5
118. Zhang X, Zhao J, Whitney AV, Elam JW, Van Duyne RP. 2006. Ultrastablesubstrates for surface-enhanced Raman spectroscopy: Al2O3 overlayers fabri-cated by atomic layer deposition yield improved anthrax biomarker detection.J. Am. Chem. Soc. 128:10304–9
119. Shafer-Peltier KE, Haynes CL, Glucksberg MR, Van Duyne RP. 2003. Towarda glucose biosensor based on surface-enhanced raman scattering. J. Am. Chem.Soc. 125:588–93
296 Willets · Van Duyne
Ann
u. R
ev. P
hys.
Che
m. 2
007.
58. D
ownl
oade
d fr
om a
rjou
rnal
s.an
nual
revi
ews.
org
by N
OR
TH
WE
STE
RN
UN
IVE
RSI
TY
- E
vans
ton
Cam
pus
on 0
1/02
/07.
For
per
sona
l use
onl
y.

ANRV308-PC58-10 ARI 19 October 2006 4:35
120. Lyandres O, Shah NC, Yonzon CR, Walsh JT, Glucksberg MR, Van DuyneRP. 2005. Real-time glucose sensing by surface-enhanced Raman spectroscopyin bovine plasma facilitated by a mixed decanethiol/mercaptohexanol partitionlayer. Anal. Chem. 77:6134–39
121. Litorja M, Haynes CL, Haes AJ, Jensen TR, Van Duyne RP. 2001. Surface-enhanced Raman scattering detected temperature programmed desorption: op-tical properties, nanostructure, and stability of silver film over SiO2 nanospheresurfaces. J. Phys. Chem. B 105:6907–15
122. Stuart DA, Biggs KB, Van Duyne RP. 2006. Surface-enhanced Raman spec-troscopy of half-mustard agent. Analyst 131:568–72
www.annualreviews.org • Localized Plasmon Spectroscopy 297
Ann
u. R
ev. P
hys.
Che
m. 2
007.
58. D
ownl
oade
d fr
om a
rjou
rnal
s.an
nual
revi
ews.
org
by N
OR
TH
WE
STE
RN
UN
IVE
RSI
TY
- E
vans
ton
Cam
pus
on 0
1/02
/07.
For
per
sona
l use
onl
y.