Embed Size (px)
Citation preview
Localisation of LRP1 in neurons and
glia of the central nervous system
Rosalind Peta Herbert
B.MedRes (Hons)
Submitted in fulfillment of the requirements for the degree of Masters of
Medical Science
University of Tasmania
October 2014
ii
Statements
Declaration of Originality
This thesis contains no material which has been accepted for a degree or diploma by the
University or any other institution, except by way of background information and duly
acknowledged in the thesis, and to the best of my knowledge and belief no material
previously published or written by another person except where due acknowledgement
is made in the text of the thesis, nor does the thesis contain any material that infringes
copyright.
Rosalind Peta Herbert
September 2014
Authority of Access
This thesis may be made available for loan and limited copying and communication in
accordance with the Copyright Act 1968.
Rosalind Peta Herbert
September 2014
iii
Statement of Ethical Conduct
The research associated with this thesis abides by the international and Australian codes
on human and animal experimentation, the guidelines by the Australian Government’s
Office of the Gene Technology Regulator and the rulings of the Safety, Ethics and
Institutional Biosafety Committees of the University.
Rosalind Peta Herbert
September 2014

iv
Acknowledgements
Firstly to my supervisors, Professor Adrian West, Associate Professor Inn
Chuah, Dr. Rob Gasperini and Professor James Vickers, for all your support. Particular
thanks must go to Adrian and Inn. Adrian, for your advice, enthusiasm, optimism and
belief in me and the project. Inn, for your honesty, direction and amazing wealth of
knowledge. Also to Rob, for all your help and patience with my calcium imaging.
To my West/Chuah/Chung lab groupies past and present, but particularly: Emma
Eaton – who still gets excited by science even after building a house, getting married
and having a baby while doing a PhD. Dr. Jackie Leung who made me laugh and
always amazed me with her intelligence. Dr. Bill Bennett, who never ignored my
whiney voice asking for help. Dr. Kate Lewis, one the most helpful and smartest people
I know. To the other Menzies lab guys, especially Dr. Lucy Apps and Jess Collins, it
was worth it just to get to know you guys. Also Graeme McCormack and Justin
Dittmann for their lab help and sense of humour.
Steph, Sarah, Frieda and Danni – who kept me in the real world. Thanks for the
dinners, wines, support, laughs and love, and for believing in me even when you had no
idea what I was doing.
To my family – Georgie and Chris, Andrew and Justine, Nigel and Lucia – you
are the best siblings and siblings-in-law anyone could ever have and the most
intelligent, funny, best looking people I will ever know. Most of all, to mum and dad –
thanks for the encouragement and love, and for being proud and believing in me no
matter what. I love you all very much.
Finally, to the big guy in the sky. The more I learn about this complex,
constantly evolving world the more I am blown away with how amazing it all is. I look
forward to continuing to explore and appreciate it. Thanks for smashing me down and
teaching me how to get back up again.
v
Abstract
The low density lipoprotein receptor-related protein-1 (LRP1) receptor
modulates neuronal survival, neurite outgrowth, regeneration and calcium signaling. Its
effects are thought to be ligand and cell specific, but how LRP1 is able to differentiate
between different signals to produce specific responses is unclear. The subcellular
localisation of LRP1 in neurons and glia of the central nervous system (CNS) was
investigated to gain insight into the receptor’s role in specific cell types and during
maturation. The role of LRP1 in calcium signaling and regeneration following injury
was assessed using two of its ligands, metallothionein (MT) and emtinB.
Expression and localisation of LRP1 in vivo and in vitro was determined using
western blot analysis and immunochemistry. LRP1 was expressed in neurons and glia of
post-natal day 2 (P2), P7 and adult rat brains. Greater immunoreactivity was
demonstrated in P2 compared to adult brain, mainly due to increased expression in
neurons and oligodendrocytes. Neuronal expression was greatest in cell bodies of
hippocampal and cortical neurons in P2 and adult brain. Glial expression of LRP1 was
greatest in oligodendrocytes of the corpus callosum and hippocampal fimbria, but
LRP1-positive astrocytes and microglia were also present throughout the brain at both
time points. These data suggest that LRP1 has a role in neuronal and glial function and
that this changes during maturation.
LRP1 was localised to cell bodies of hippocampal neurons 3, 7, 14 and 21 days
in vitro (DIV). The receptor was also expressed on dendrites at all time points, and did
not co-localise with synaptophysin, PSD-95 or the NMDA receptor subunit, NR2a, but
did partially co-localise with NR2b. Addition of MT and emtinB did not induce calcium
influx in live neurons demonstrating that LRP1 mediated synaptic regulation is not
modulated by these ligands in this cell type. LRP1 was also expressed along and at the
ends of 3DIV and some 7DIV axons, suggesting a role in neurite outgrowth. This
vi
hippocampal neuron model was used to investigate the role of LRP1 in response to
injury. LRP1 was expressed at the ends of extending neurites 24 hours after scratch
injury, suggesting that it is involved in neurite regeneration. 10μg/mL MT did not
promote neurite extension but 25μM emtinB significantly increased the number of
neurites that extended along or into the scratch injury site (57.8 ± 4.6 neurites/cm injury
site) compared to saline controls (27.7 ± 3.3 neurites/cm injury site; p<0.005) and
cultures treated with both emtinB and the LRP1 inhibitor, receptor associated protein
(36.5 ± 3.2 neurites/cm injury site; p<0.005). These findings demonstrate the ability for
LRP1 to promote neurite extension following injury through stimulation by emtinB.
This thesis presents the temporal, regional and subcellular expression profile of
LRP1 in neurons and glia of the CNS and how this may influence the receptor’s
function in specific cell types during normal and injury conditions. The data support a
role for LRP1 in neuronal biology and provide the foundation for further investigation
into how LRP1 regulates neuron function.
vii
Contents
Title…………………………………………………………………………………. i
Statements………………………………………………………………………….. ii
Acknowledgements………………………………………………………………… iv
Abstract…………………………………………………………………………….. v
Contents……………………………………………………………………….……. vii
List of tables………………………………………………………………………... xii
List of figures………………………………………………………………….…… xiii
Abbreviations………………………………………………………………….…… xvi
Chapter 1: Introduction
1.1 General development of neural connections in the brain………………….. 1
1.2 Role of cell surface receptors in integrating extracellular and intracellular
environments……………………………………….……………………………… 2
1.2.1 Example of a well understood but complex neuronal signaling pathway:
The neurotrophins………………………………………..……................................. 2
1.3 Low density lipoprotein receptor-related protein-1 (LRP1)……………….. 6
1.3.1 Structure and processing of LRP1……………………………………...….… 9
1.3.2 LRP1 in the nervous system……………………………………..................... 15
1.3.2.1 Regulation of neuronal function…………………………………... 19
1.3.2.2 Regulation of neurite outgrowth and regeneration…………….. 20
1.3.2.3 Regulation of synaptic function……………………………………. 24
viii
1.3.2.4 LRP1 mediated signaling…………………………………………. 26
1.4 Metallothionein……………………………………………………….…….… 28
1.4. Metallothionein and emtin regulation of neuron function……….……..…. 29
1.5 Project hypothesis and aims………………………………………..….…….. 30
Chapter 2: In vivo characterisation of LRP1 in the maturing rat
brain
2.1 Introduction…………………………………………………………………… 32
2.2 Methods………………………………………………………………………... 37
2.2.1 Western blot……………………………………………………………………... 37
2.2.2 Immunohistochemistry…………………………………………………………. 39
2.3 Results…………………………………………………………………………. 44
2.3.1 Cleavage pattern of LRP1 changes during development…………………. 44
2.3.2 LRP1 is expressed in neuron and glia cell bodies of P2, P7 and adult
rat brains………………………………………………………………………………... 47
2.3.3 LRP1-positive neurons and glia are located throughout the P2 and
adult rat brain………………………………………………………………………….. 54
2.4 Discussion……………………………………………………………………… 57
2.4.1 The cleavage pattern of LRP1 changes during maturation of the rat
brain………………………………………………………………………………….….. 57
2.4.2 LRP1 is expressed in cell bodies and processes of neurons and glia……. 61
2.4.2.1 LRP1 expression in neurons……………………………………….. 61
2.4.2.2 LRP1 expression in oligodendrocytes……………………………. 63
ix
2.4.2.3 LRP1 expression in astrocytes…………………………………….. 65
2.4.2.4 LRP1 expression in microglia……………………………………... 66
2.4.2.5 LRP1 expression at the BBB……………………………………….. 68
2.5 Conclusions……………………………………………………………………. 70
Chapter 3: In vitro characterisation of LRP1 expression in
hippocampal neurons
3.1 Introduction…………………………………………………………………… 72
3.2 Methods………………………………………………………………………... 76
3.2.1 Primary hippocampal neuron culture……………………………………….. 76
3.2.2 Western blot……………………………………………………………………... 77
3.2.3 Immunocytochemistry………………………………………………………….. 78
3.2.4 Hippocampal neuron synaptic activity assay……………………………….. 82
3.3 Results…………………………………………………………………………. 85
3.3.1 LRP1 is expressed in hippocampal neuron cultures from 3 to 21DIV…... 85
3.3.2 LRP1 is localised to cell bodies and dendrites of hippocampal neurons
in vitro………………………………………………………………………….. 87
3.3.3 14-15DIV hippocampal neurons respond to NMDA and glutamate…….. 99
3.4 Discussion……………………………………………………………………… 102
3.4.1 The cleavage pattern of LRP1 changes during maturation of
hippocampal neuron cultures………………………………………………………… 102
3.4.2 LRP1 is expressed in cell bodies and processes of hippocampal neurons
from 3 to 21DIV………………………………………………………………………... 106
x
3.4.3 LRP1 does not co-localise with PSD-95, synaptophysin or NR2a but
does partially co-localise with NR2b………………………………………………... 108
3.4.4 LRP1 ligands, MT and emtinB, do not induce calcium influx in
hippocampal neurons……………………………………………………….…………. 111
3.4.5 LRP1 expression in astrocytes, oligodendrocytes and microglia of
hippocampal neuron cultures………………………………………………………… 112
3.5 Conclusions……………………………………………………………………. 116
Chapter 4: Effects of the LRP1 ligands, MT and emtinB, on
hippocampal neurite regeneration following scratch injury
4.1 Introduction…………………………………………………………………… 118
4.2 Methods………………………………………………………………………... 121
4.2.1 Primary hippocampal neuron culture……………………………………….. 121
4.2.2 Scratch injury and immunocytochemistry…………………………………… 121
4.3 Results…………………………………………………………………………. 126
4.3.1 The majority of regenerating tau positive neurites are axons and
express LRP1…………………………………………………………………………… 126
4.3.2 EmtinB increases the number of neurites that extend along or into the
scratch injury site but MT does not………………………………………………….. 131
4.4 Discussion……………………………………………………………………… 134
4.4.1 LRP1 is expressed at the ends of extending hippocampal neurites after
scratch injury…………………………………………………………………………… 134
4.4.2 MT does not appear to promote hippocampal neurite extension
following injury………………………………………………………………………… 135
xi
4.4.3 EmtinB increases the number of hippocampal neurites that extend along
or enter the injury site…………………………………………………………………. 137
4.4.4 Different effects of LRP1 ligands on neurite extension……………………. 138
4.5 Conclusions……………………………………………………………………. 140
Chapter 5: Conclusions and future directions………………………. 141
References…………………………..…………………………………. 148
Appendix 1: Solution and buffer recipes………………………………………… 166
Appendix 2: Reagent and equipment information………………………………. 170
xii
List of tables
Table 1.1: Ligands that bind LRP1…………………………………………………. 8
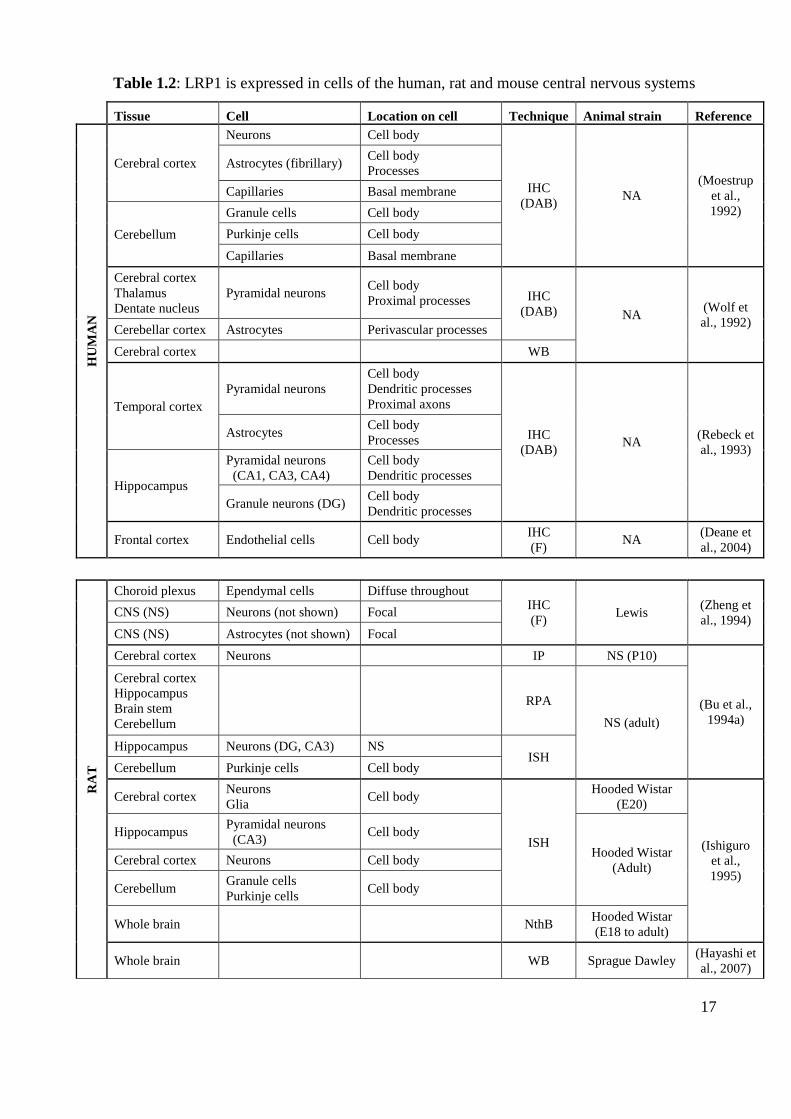
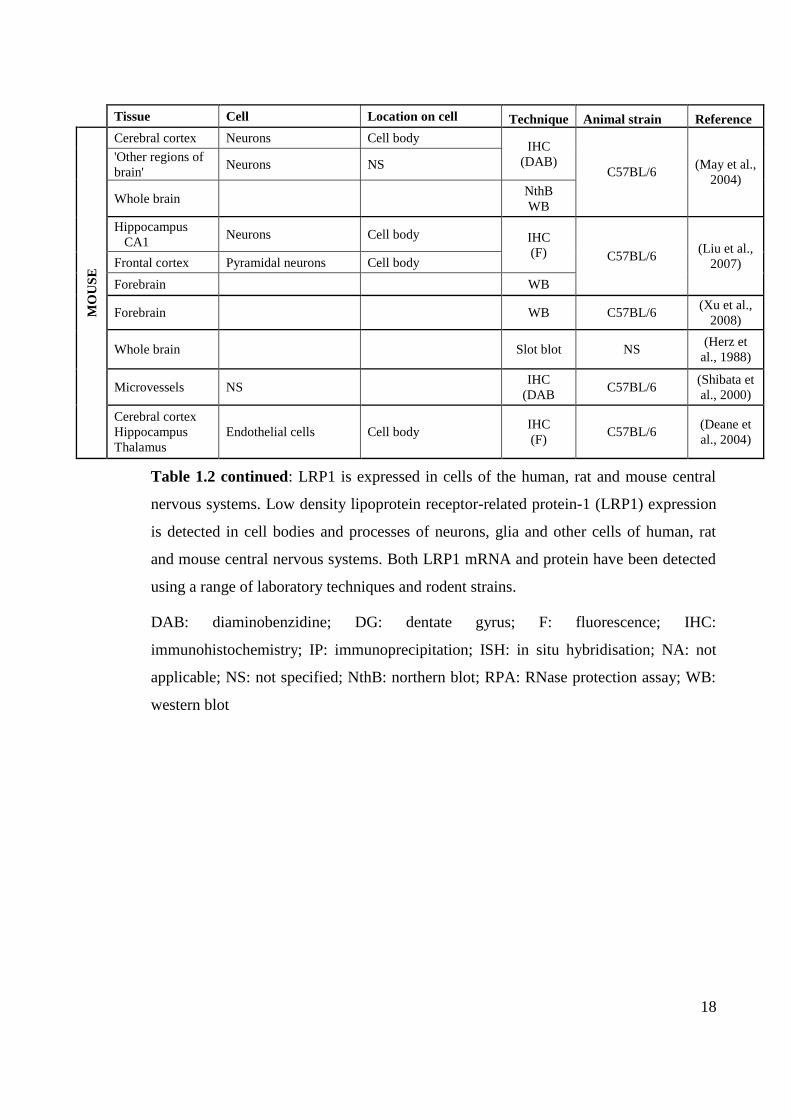
Table 1.2: LRP1 is expressed in cells of the human, rat and mouse central nervous
system……………………………………………………………………………….. 17
Table 1.3: Effect of LRP1 activation on neuronal survival, neurite outgrowth and
regeneration…………………………………………………………………………. 22
Table 1.4: Effect of LRP1 on synaptic calcium responses following pre-treatment
or immediate addition of ligands……………………………..................................... 27
Table 2.1: A list of working dilutions of primary antibodies, their targets and
respective secondary antibodies used for western blot and immunohistochemistry
analysis…………………………………………….................................................... 41
Table 2.2: LRP1-positive cells are present in different brain regions of the post-
natal day 2 (P2) and adult rat brain…….……………………………………………. 56
Table 3.1: A list of working dilutions of primary antibodies, their targets and
respective secondary antibodies used for western blots and immunocytochemistry
analysis. …………………………………………………………………………..… 81
xiii
List of figures
Figure 1.1: Simplified diagram of some receptor-ligand interactions in different cell
types…………………………………………………………………………….....…
5
Figure 1.2: Processing and cleavage of LRP1…………………………………..….. 12
Figure 1.3: Structure, cleavage and binding sites of the LRP1…………….…....…. 14
Figure 2.1: Brain regions photographed for semi-quantitative values of LRP1
regional localisation in the post-natal day 2 rat brain………………………….……. 42
Figure 2.2: Brain regions photographed for semi-quantitative values of LRP1
regional localisation in the adult rat brain……………………………….…............... 43
Figure 2.3: LRP1 is expressed in post natal day 2 (P2), day 7 (P7) and adult rat
hippocampus………………………………................................................................. 46
Figure 2.4: LRP1 is expressed on neuron cell bodies of post-natal day 2 (P2), day 7
(P7) and adult rat brain………………………………………………........................ 48
Figure 2.5: LRP1 is expressed upon dendrites of adults and some post-natal day 2
(P2) neurons…………………………………………………………………....……. 49
Figure 2.6: LRP1 is expressed on astrocytes of post-natal day 2 (P2), day 7 (P7) and
adult rat brain………………………………………................................................... 50
Figure 2.7: LRP1 is expressed on oligodendrocytes of post-natal day 2 (P2), day 7
(P7) and adult rat brain…………………………………............................................ 51
Figure 2.8: LRP1 is expressed on microglia of post-natal day 2 (P2), day 7 (P7) and
adult rat brain………………………………………………………............................ 52
Figure 2.9: Positive and negative controls for LRP1 immunohistochemistry............ 53
Figure 2.10: Post-translational modifications of the LRP1 light chain that may
correspond to bands detected on western blots………………………......................... 60
xiv
Figure 3.1: LRP1 is expressed in hippocampal neuron cultures at 3, 7, 14 and 21
days in vitro (DIV)……………………………………………………....................... 86
Figure 3.2: Purity of neurons, astrocytes and other glia in hippocampal neuron
cultures………………………………………………................................................. 87
Figure 3.3: LRP1 is expressed on astrocytes in hippocampal neuron cultures…...... 90
Figure 3.4: LRP1 is expressed on oligodendrocytes in hippocampal neuron
cultures………………………………………………………………………............. 91
Figure 3.5: LRP1 is expressed on microglia in hippocampal neuron cultures……... 92
Figure 3.6: LRP1 is expressed along axons of neurons at 3 and 7 days in vitro (DIV)
but not at 14 or 21DIV………………………………………………………..…….... 93
Figure 3.7: LRP1 is expressed on dendrites of hippocampal neurons in vitro……... 94
Figure 3.8: LRP1 does not co-localise with PSD-95 in hippocampal neurons in
vitro………………………………………………...................................................... 95
Figure 3.9: LRP1 does not co-localise with synaptophysin in hippocampal neurons
in vitro……………………………………………...................................................... 96
Figure 3.10: Cultures omitting primary antibodies are immunonegative…............... 97
Figure 3.11: LRP1 co-localises with NR2b but not NR2a in vitro……………....…. 98
Figure 3.12: Hippocampal neurons respond to NMDA and glutamate at 14-15 days
in vitro……………………………………………………………………….……...… 100
Figure 3.13: 10μg/mL MT or 25μM emtinB do not induce calcium influx in NMDA
responsive hippocampal neurons at 14-15 days in vitro…………………...………… 101
xv
Figure 4.1: Simplified schematic and amino acid sequence of rabbit MT and the
synthetic peptide, emtinB…………………………….………………………………. 120
Figure 4.2: Pattern of photographs taken for scratch injury analysis………...…..… 125
Figure 4.3: The majority of neurites are cut during scratch injury………………….. 127
Figure 4.4: The majority of neurites that extend into or along the injury site 24 hours
after scratch injury at 7 days in vitro (DIV) are axons…………………....……..….. 128
Figure 4.5: LRP1 is expressed at the ends of extending hippocampal neurites 24
hours after scratch injury at 7 and 14 days in vitro (DIV)………………................... 129
Figure 4.6: Most LRP1 positive processes that extend across or along the injury site
are not dendrites………………………………………............................................... 130
Figure 4.7: Representative images of neurite extension 24 hours after scratch injury
with saline, MT or emtinB with or without RAP……………………………...……... 132
Figure 4.8: Effect of MT and emtinB on the number of neurites that extended along
or into the scratch injury site………...…………………………………….……….... 133
xvi
Abbreviations
α2-M: α2-macroglobulin
ApoE: apolipoprotein E
BBB: blood brain barrier
BDNF: brain derived neurotrophin factor
CA: cornu ammonis region of the
hippocampus
CC: corpus callosum
CNS: central nervous system
Cx: cerebral cortex
DAB: diaminobenzidine
DG: dentate gyrus
DIV: days in vitro
DRG: dorsal root ganglia
F: fluorescence
HBSS: Hank’s buffered saline solution
Hp Fi: hippocampal fimbriae
Hp SR: stratum radiatum of the
hippocampus
HRP: horse radish peroxidase
HyT: hypothalamus
IHC: immunohistochemistry
IP: immunoprecipitation
ISH: in situ hybridisation
LDL: low density lipoprotein
LRP1: low density lipoprotein receptor-
related protein-1
LTP: long term potentiation
MAG: myelin associated glycoprotein
MMP-9: matrix metalloproteinase-9
MT: metallothionein
NA: not applicable
NGF: nerve growth factor
NMDA: N-methyl D-aspartate
NS: not specified
NT-3/4: neurotrophin-3/4
NthB: northern blot
NY: nuclear yellow
P2/7: post-natal day 2/7
p75NTR
: p75 neurotrophin receptor
PBS: phosphate buffered saline
PBS-Tw: phosphate buffered saline with
0.05% Tween-20
PNS: peripheral nervous system
PSD-95: post-synaptic density-95
RAP: receptor associated protein
RIPA: radio-immunoprecipitation assay
RPA: RNase protection assay
SDS-PAGE: sodium dodecyl sulphate-
polyacrylamide gel electrophoresis
Th: thalamus
tPA: tissue-type plasminogen activator
Trk: tropomyosin-related kinase
WB: western blot
1
1 Chapter 1: Introduction
1.1 GENERAL DEVELOPMENT OF NEURAL CONNECTIONS IN THE
BRAIN
There are billions of neurons in the brain responsible for our ability to sense,
think and move. Without the correct regulation and maintenance of these cells, life
would be impossible. Control of neuronal function in development and maturity is
complex and affected by both intrinsic and extrinsic factors. Chemical transmission is
fundamental to the function in the central nervous system (CNS) and is dependent on
the formation of correct connections between neurons during embryonic development.
Developing neurons detect attractive or repulsive cues from the extracellular
environment. These cues activate intracellular pathways involved in modulating
cytoskeleton rearrangement and axon movement (Yamada et al., 1970). This allows the
extending axon to maneouver through the brain to reach its specific destination
(reviewed by (Mueller, 1999)). The axon then forms and stabilises a synaptic
connection that allows neurons to receive, interpret and forward chemical signals
through the CNS (reviewed by (Vaughn, 1989)). Neurons continue to receive a range of
extracellular signals through maturity in order to maintain cell integrity and function
appropriately.
The interaction of extracellular and intracellular elements to produce a response
is highly precise. Extracellular proteins interact with specific membrane bound
receptors that modulate intracellular protein activation and distribution. This in turn
activates or inhibits transcription factor activity and gene and protein expression
(reviewed in (Kadonaga, 2004)). For all neuron functions, the cell must receive
extracellular cues that mediate intracellular changes and responses.
2
1.2 ROLE OF CELL SURFACE RECEPTORS IN INTEGRATING
EXTRACELLULAR AND INTRACELLULAR ENVIRONMENTS
One key link between extracellular and intracellular environments is the
membrane receptor. Extracellular ligands bind to their specific surface receptors to
induce a conformational change that elicits an intracellular chemical response (Elliott
and Elliott, 2004). This enables cells to detect signals in their surrounding environment
and to respond appropriately. These signals are not only receptor-ligand specific but
also cell specific. Receptors and their intracellular signaling targets are only present in
certain cell types or on specific subcellular locations within that cell. In addition, signals
from other receptors can promote or inhibit responses (Nelson and Cox, 2008) (Figure
1.1). This complex mix of ligand, receptor and cell expressed proteins ensures that
responses are tightly regulated and appropriate.
1.2.1 EXAMPLE OF A WELL UNDERSTOOD BUT COMPLEX NEURONAL
SIGNALING PATHWAY: THE NEUROTROPHINS
An example of, and one of the best understood, systems that displays the
complex interactions between ligand, receptor and intracellular proteins to produce
neuronal responses is the neurotrophin signaling pathway. Four neurotrophins have
been identified in the mammalian system: nerve growth factor (NGF) (Cohen and Levi-
Montalcini, 1956), brain derived neurotrophin factor (BDNF) (Barde et al., 1982),
neurotrophin-3 (NT-3) (Maisonpierre et al., 1990) and NT-4 (Hallbook et al., 1991).
Neurotrophins are ligands for the tropomyosin-related kinase (Trk) receptors, TrkA,
TrkB and TrkC, and the p75 neurotrophin receptor (p75NTR
) (Klein et al., 1991, Squinto
et al., 1991, Ip et al., 1992). Each neurotrophin binds to a specific Trk receptor but all
neurotrophins are able to bind to p75NTR
(Hallbook et al., 1991, Kaplan et al., 1991,
Lamballe et al., 1991, Squinto et al., 1991). Upon neurotrophin binding, Trk receptors
phosphorylate intracellular proteins that activate pathways to promote neuronal growth,
3
migration, differentiation and survival (Datta et al., 1997, Xing et al., 1998). In
comparison, neurotrophin stimulation of p75NTR
often activates pro-apoptotic pathways
(Frade et al., 1996, Bamji et al., 1998).
The outcomes of neurotrophin binding are complex and dependent on
interactions between the receptor, the ligand that binds it, and other receptors and
intracellular proteins expressed by the cell. For example, NGF induces apoptosis in
retinal neurons (Frade et al., 1996) but promotes survival in sensory neurons, of which
both effects are through activation of p75NTR
(Hamanoue et al., 1999). This
demonstrates that the same ligand and receptor combination can mediate opposing
effects in different cell types. BDNF protects against NGF and p75NTR
mediated
apoptosis in retinal neurons through TrkB activation (Frade et al., 1997). This
demonstrates how the balance of neurotrophins and interactions of their Trk and p75NTR
receptors is crucial in determining cell outcomes. Trk receptors can promote neuronal
survival through suppression of p75NTR
and pro-apoptotic pathways (Yoon et al., 1998).
This explains, in part, why p75NTR
mediated apoptosis only occurs when Trk receptors
are inactive or decreased in expression (Bamji et al., 1998, Davey and Davies, 1998).
Interestingly, the affinity of neurotrophins to bind to Trk receptors is stronger and more
selective in the presence of p75NTR
(Hempstead et al., 1991, Mahadeo et al., 1994, Bibel
et al., 1999). The effect of neurotrophin receptor activation and subsequent outcomes is
dependent on the identity of the neurotrophin and the proteins expressed by the target
cell that can interact with the receptor.
The objective of this thesis is to investigate another complex, but less
understood, receptor system. As will be discussed, the low density lipoprotein receptor-
related protein-1 (LRP1) is a receptor that, similar to neurotrophin receptors, modulates
a diverse range of neuronal responses. The receptor also has an unusually high number

4
of ligands, giving rise to the hypothesis that it assists neurons to integrate and respond
to a range of extracellular cues.
5
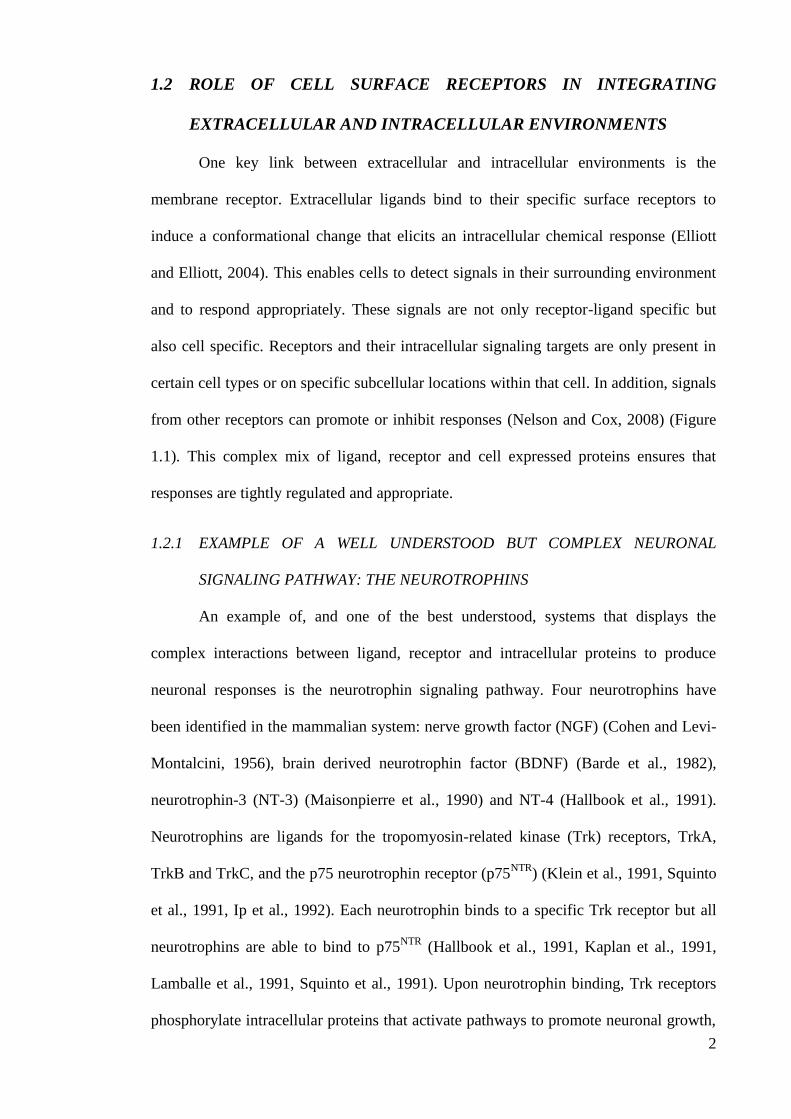
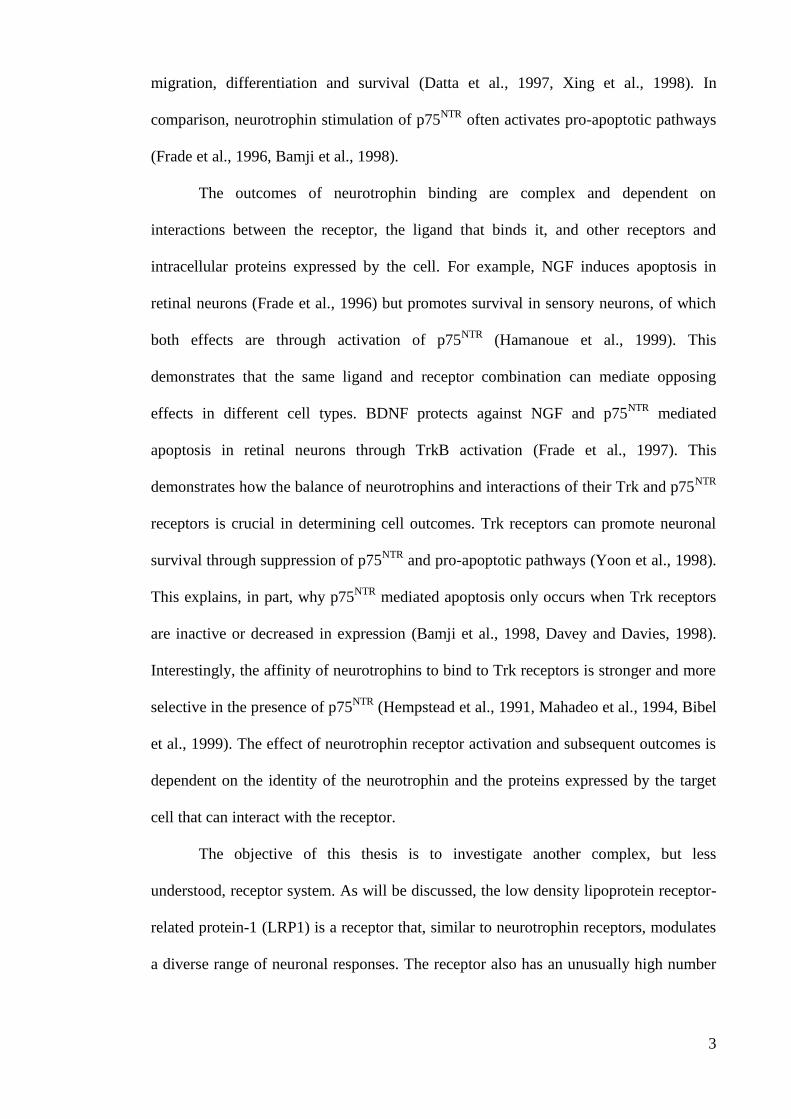
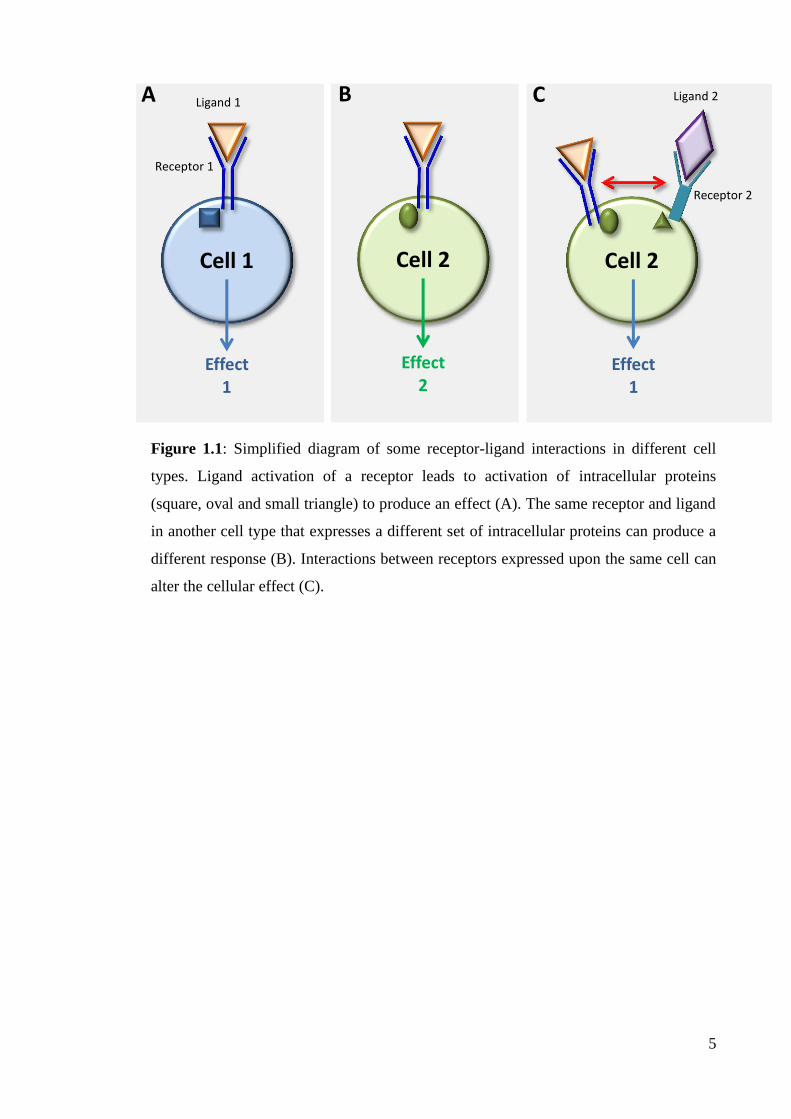
Figure 1.1: Simplified diagram of some receptor-ligand interactions in different cell
types. Ligand activation of a receptor leads to activation of intracellular proteins
(square, oval and small triangle) to produce an effect (A). The same receptor and ligand
in another cell type that expresses a different set of intracellular proteins can produce a
different response (B). Interactions between receptors expressed upon the same cell can
alter the cellular effect (C).
Cell 1 Cell 2
Effect
1
Effect 1
Cell 2
Effect
2
A B C Ligand 1
Receptor 1
Ligand 2
Receptor 2
6
1.3 LOW DENSITY LIPOPROTEIN RECEPTOR-RELATED PROTEIN-1
(LRP1)
LRP1 was first described in 1988 by Herz and colleagues as a 600kDa receptor
found in great abundance in the liver and brain (Herz et al., 1988). The receptor is one
of the eleven members of the low density lipoprotein (LDL) receptor family. Like other
members of this family, the primary role of LRP1 was initially believed to be in
apolipoprotein transport (Herz et al., 1988, Kowal et al., 1989). However, further
analysis of the receptor found it to be identical to the α2-macroglobulin receptor, which
bound many more ligands and mediated several signaling pathways unrelated to the
LDL receptor (Strickland et al., 1990). LRP1 is now known to have over 40 ligands
(Table 1.1) and is expressed in cells of the liver, kidney, bone, fat, lung, skin, spleen,
ovaries and testes (Herz et al., 1988, Feldman and Sangha, 1992, Moestrup et al., 1992,
Zheng et al., 1994, Igdoura et al., 1997, Niemeier et al., 2005). Expression is also
present in neurons and glia of human and rodent central nervous systems (discussed
below).
LRP1 is highly conserved between bacterial, avian and mammalian species
(Springer, 1998) and knock-out mice are embryonically unviable, demonstrating a vital
role for the receptor during embryonic development. Though the reason for this lethality
is not entirely understood, it could be due to blockage of embryo implantation or
abnormalities in liver development (Herz et al., 1992, Roebroek et al., 2006). In
genetically altered mice where brain and liver LRP1 expression is decreased by 75%,
animals are viable and functionally normal despite increased levels of plasma proteins
(Willnow et al., 1995). This indicates that reduced expression of the receptor is
sufficient for normal embryonic development. Mouse strains with a conditional knock-
out in specific neuronal populations are also viable but display increased neuronal death
and cognitive deficits as they age (May et al., 2004, Liu et al., 2010). While the primary

7
function of LRP1 remains unclear, it is apparent that the receptor has an essential role in
mammalian systems during development and maturity.
8
Ligand Reference
α2-macroglobulin
(Moestrup and Gliemann,
1989)
(Gliemann et al., 1989)
Amyloid-β (Deane et al., 2004)
Apolipoprotein E (Kowal et al., 1989)
- Apolipoprotein E3 (Nathan et al., 2002)
(Matsuo et al., 2011)
- Apolipoprotein E4 (Nathan et al., 2002)
(Hashimoto et al., 2000)
Amyloid precursor protein (Kounnas et al., 1995)
β-very low density
lipoprotein
(Kowal et al., 1989)
(Handelmann et al., 1992)
C1s-C1 inhibitor complex (Storm et al., 1997)
Calreticulin (Ogden et al., 2001)
(Gardai et al., 2005)
Cholesterol (Handelmann et al., 1992)
Complement C3 (Meilinger et al., 1999)
Connective tissue growth
factor (Segarini et al., 2001)
EmtinB (Ambjørn et al., 2008)
Factor VIII (Lenting et al., 1999)
(Saenko et al., 1999)
Fibronectin (Salicioni et al., 2002)
Gentamicin (Moestrup et al., 1995)
gp96 (Binder et al., 2000)
Hepatic lipase (Kounnas et al., 1995)
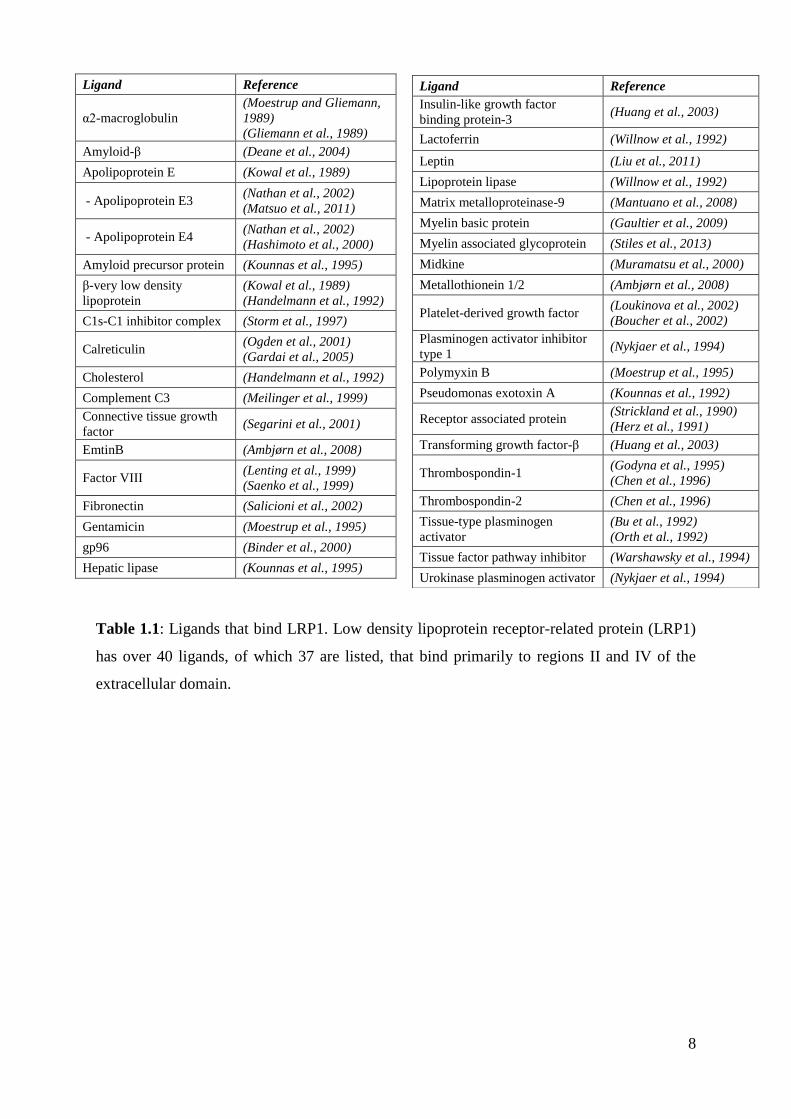
Table 1.1: Ligands that bind LRP1. Low density lipoprotein receptor-related protein (LRP1)
has over 40 ligands, of which 37 are listed, that bind primarily to regions II and IV of the
extracellular domain.
Ligand Reference
Insulin-like growth factor
binding protein-3 (Huang et al., 2003)
Lactoferrin (Willnow et al., 1992)
Leptin (Liu et al., 2011)
Lipoprotein lipase (Willnow et al., 1992)
Matrix metalloproteinase-9 (Mantuano et al., 2008)
Myelin basic protein (Gaultier et al., 2009)
Myelin associated glycoprotein (Stiles et al., 2013)
Midkine (Muramatsu et al., 2000)
Metallothionein 1/2 (Ambjørn et al., 2008)
Platelet-derived growth factor (Loukinova et al., 2002)
(Boucher et al., 2002)
Plasminogen activator inhibitor
type 1 (Nykjaer et al., 1994)
Polymyxin B (Moestrup et al., 1995)
Pseudomonas exotoxin A (Kounnas et al., 1992)
Receptor associated protein (Strickland et al., 1990)
(Herz et al., 1991)
Transforming growth factor-β (Huang et al., 2003)
Thrombospondin-1 (Godyna et al., 1995)
(Chen et al., 1996)
Thrombospondin-2 (Chen et al., 1996)
Tissue-type plasminogen
activator
(Bu et al., 1992)
(Orth et al., 1992)
Tissue factor pathway inhibitor (Warshawsky et al., 1994)
Urokinase plasminogen activator (Nykjaer et al., 1994)
9
1.3.1 STRUCTURE AND PROCESSING OF LRP1
The human LRP1 gene is located on chromosome 12 (Myklebost et al., 1989)
and codes a 4544 amino acid protein (Herz et al., 1988). After translation and transport
to the endoplasmic reticulum, LRP1 binds with high affinity to a 39kDa chaperone
called receptor associated protein (RAP) (Strickland et al., 1990) (Figure 1.2). This
binding inhibits protein interaction and receptor clumping (Herz et al., 1991) and assists
with correct protein folding (Bu and Rennke, 1996). The receptor is transported to the
Golgi apparatus where it is cleaved by the enzyme furin to form two non-covalently
bound subunits of 515kDa and 85kDa. The 515kDa fragment (also known as the α- or
heavy chain) contains the majority of the extracellular domain and all ligand binding
regions of the receptor. The 85kDa fragment (also known as the β- or light chain) is
composed of the membrane anchor and cytoplasmic domain (Herz et al., 1990). RAP
dissociates from LRP1 in the lower pH of the Golgi apparatus, leaving the receptor
functionally active to be transported to the cell membrane (Bu et al., 1995). The
importance of LRP1-RAP interactions during processing is confirmed in RAP deficient
mouse models that demonstrate impaired LRP1 expression (Willnow et al., 1995).
Conversely, overexpression of RAP leads to its increased secretion from the cell and
inhibition of LRP1 on the cell membrane. When applied extracellularly, RAP acts as a
competitive antagonist of LDL receptor family members and inhibits receptor-mediated
effects (Willnow et al., 1994, Medh et al., 1995).
LRP1 has distinct extracellular, transmembrane and intracellular motifs (Figure
1.3). The extracellular domain is composed of four regions of cysteine rich ligand
binding repeats separated by four regions of epidermal growth factor/β-sheet motifs,
which are involved in ligand release (Davis et al., 1987). The majority of ligands bind to
ligand binding regions II and IV, though binding can involve multiple regions (Neels et
al., 1999, Mikhailenko et al., 2001). One of the reasons that the receptor can bind many
10
ligands is due to the 31 ligand binding repeats contained in its extracellular domain
(Mikhailenko et al., 2001). A type 1 transmembrane domain spans the cell membrane,
connecting the extracellular and intracellular domains (Herz et al., 1988).
The LRP1intracellular domain contains a YxxL tyrosine motif, two di-leucine
motifs and two NPxY tyrosine motifs (proximal and distal). The YxxL and di-leucine
motifs are the primary mediators of LRP1 mediated endocytosis (Li et al., 2000). As for
other members of the LDL family, this process occurs via clathrin-coated vesicles (Bu
et al., 1994a). Upon receptor mediated signaling, clathrin is recruited to form vesicles
containing the receptor and ligand that bud from the cell membrane. The receptor is
then released and returned to the cell surface while the ligand is degraded in lysosomes
((Van Kerkhof et al., 2005); reviewed by (Schwartz, 1995)). Though NPxY motifs can
induce endocytosis (Bonifacino and Traub, 2003), they also associate with intracellular
proteins and activate pathway signaling.
The NPxY motifs bind to scaffold and adaptor proteins to activate intracellular
signals. The ability of intracellular proteins to associate is dependent upon the motifs
phosphorylation status. The majority of intracellular proteins bind to the phosphorylated
distal NPxY motif, though the non-phosphorylated form is able to bind different
proteins and activate separate pathways (Gotthardt et al., 2000, Guttman et al., 2009).
Distal NPxY phosphorylation can occur via association of intracellular proteins (Barnes
et al., 2001) or by activated platelet derived growth factor receptor (Boucher et al.,
2002, Loukinova et al., 2002) and leads to phosphorylation of the proximal NPxY motif
(Betts et al., 2008). The primary role of the proximal NPxY motif appears to be in the
synthesis of LRP1 (Reekmans et al., 2010), but when phosphorylated it can bind a
number of proteins similar to the distal motif (Guttman et al., 2009). Therefore, the
ability of LRP1 to activate intracellular signaling pathways is dependent on both
intracellular protein composition and activity of co-receptors.
11
LRP1 activity is also regulated by cleavage of its extracellular and intracellular
domains (Figure 1.2). The extracellular domain of LRP1 can be cleaved by the amyloid
precursor protein enzyme β-secretase to release it from the membrane (von Arnim et al.,
2005). The soluble LRP1 heavy chain has been found free in blood and can bind free
ligands to inhibit activation of the cell bound receptor (Quinn et al., 1997). The
formation of this soluble fraction has been conserved between mammalian, avian,
reptilian and mollusc species and implies an important role for it in regulating LRP1
activity (Grimsley et al., 1999). Following β-secretase cleavage, the transmembrane
domain can be cleaved by a γ-secretase complex (May et al., 2002). This releases the
intracellular domain that can bind to adaptor proteins (Trommsdorff et al., 1998,
Gotthardt et al., 2000) or enter the nucleus to interact directly with transcription factors
(Kinoshita et al., 2003). γ-secretase cleavage is regulated by glycosylation of the
receptor, a cell specific mechanism, which modulates LRP1 mediated transcription
activation in different tissues (May et al., 2003).
LRP1 can modulate a variety of cellular functions due to a structure that allows
it to bind a range of extracellular ligands and intracellular proteins. However, the
receptors activity is tightly regulated through cell specific mechanisms including
phosphorylation, glycosylation and expression of signaling proteins, co-receptors and
enzymes. This ensures that while LRP1 responses are diverse, they are also specific.
12
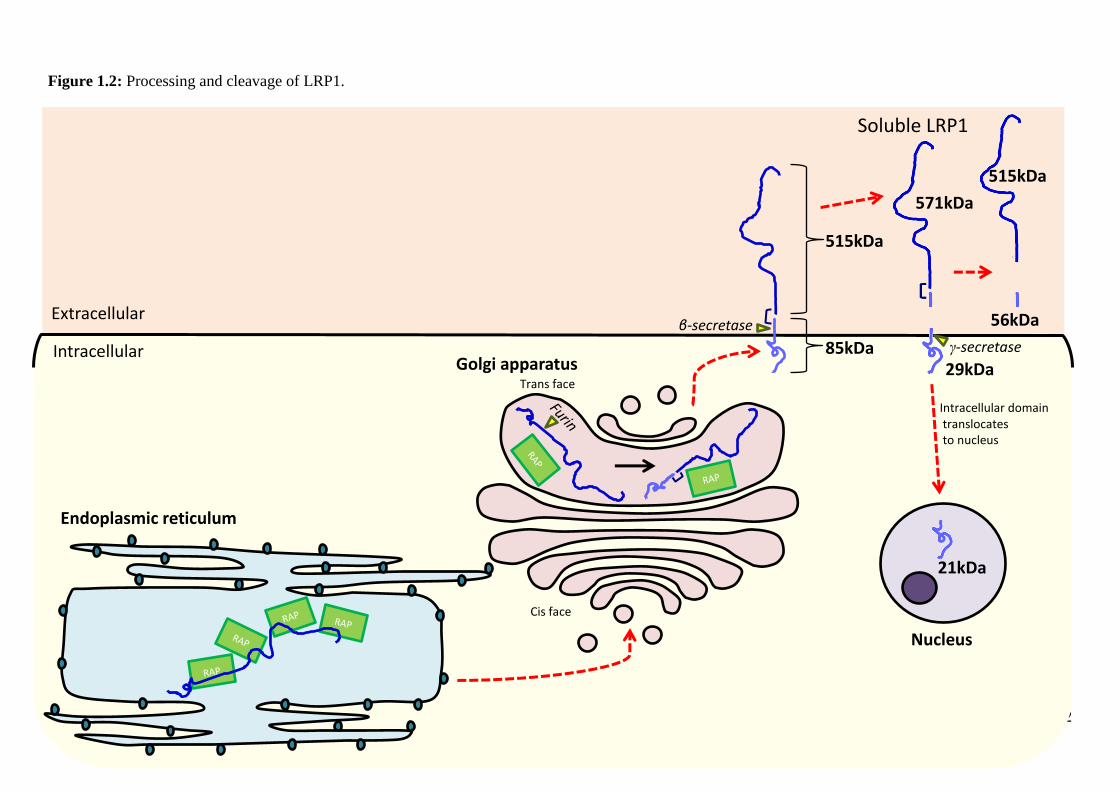
Figure 1.2: Processing and cleavage of LRP1.
β-secretase
γ-secretase
571kDa
Extracellular
Intracellular
Endoplasmic reticulum
Golgi apparatus
Cis face
Trans face
56kDa
515kDa
21kDa
29kDa
515kDa
85kDa
Intracellular domain translocates to nucleus
Soluble LRP1
Nucleus
13
Figure 1.2 continued: Processing and cleavage of LRP1. Low density lipoprotein
receptor-related protein (LRP1) is translated and transported to the endoplasmic
reticulum where it is bound to receptor associated protein (RAP) to inhibit ligand
binding, receptor clumping and to assist with correct protein folding. In the Golgi
apparatus the receptor dissociates from RAP and is cleaved by furin to form a 515kDa
heavy chain bound non-covalently to an 85kDa light chain. LRP1 is transported to the
cell membrane. Extracellular ligands can bind to the receptor for endocytosis or to
activate intracellular pathways. Alternatively, the extracellular domain can be cleaved
by the amyloid precursor protein enzyme β-secretase to release a 571kDa soluble
fraction, which in turn can lose its non-covalent bond to form 515kDa and 56kDa
fractions. Soluble LRP1 can antagonize ligand binding in plasma and cerebral spinal
fluid. LRP1 can be subsequently cleaved by γ-secretase, releasing the 21kDa
intracellular domain which binds intracellular proteins or translocates to the nucleus to
regulate transcription events.
Adapted from (Bu, 2009)
14
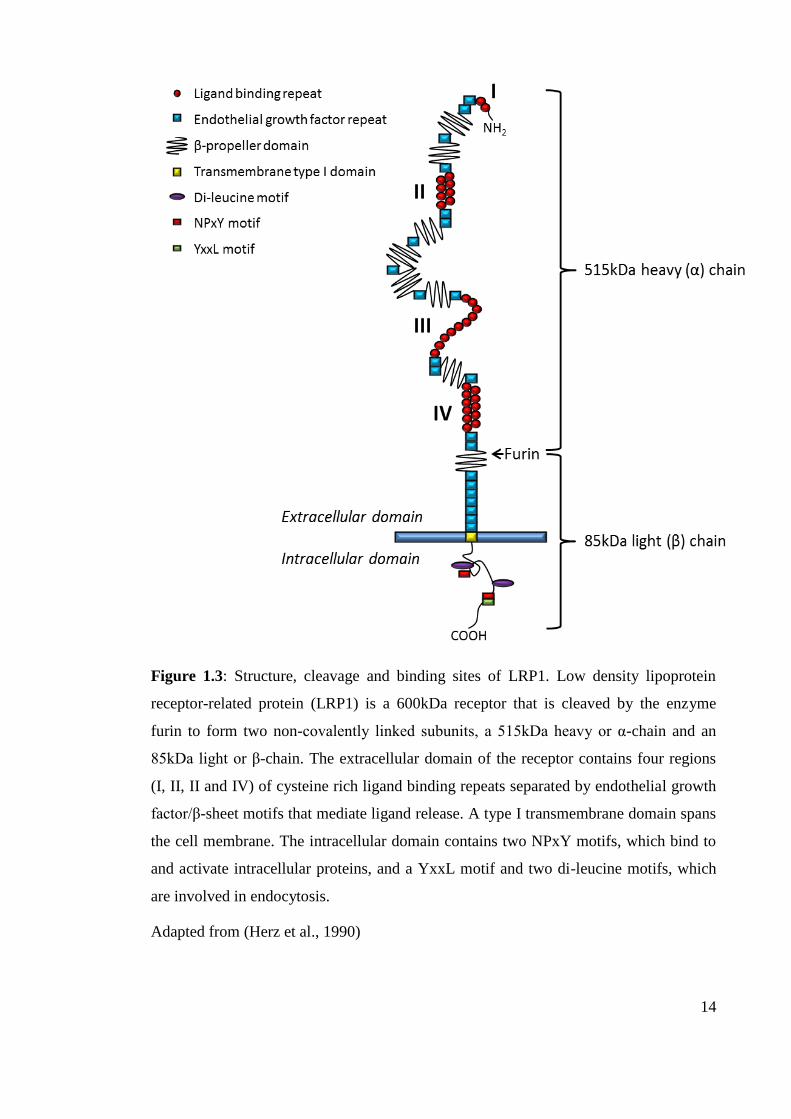
Figure 1.3: Structure, cleavage and binding sites of LRP1. Low density lipoprotein
receptor-related protein (LRP1) is a 600kDa receptor that is cleaved by the enzyme
furin to form two non-covalently linked subunits, a 515kDa heavy or α-chain and an
85kDa light or β-chain. The extracellular domain of the receptor contains four regions
(I, II, II and IV) of cysteine rich ligand binding repeats separated by endothelial growth
factor/β-sheet motifs that mediate ligand release. A type I transmembrane domain spans
the cell membrane. The intracellular domain contains two NPxY motifs, which bind to
and activate intracellular proteins, and a YxxL motif and two di-leucine motifs, which
are involved in endocytosis.
Adapted from (Herz et al., 1990)
15
1.3.2 LRP1 IN THE NERVOUS SYSTEM
LRP1 is expressed in a range of cells of the peripheral and central nervous
systems. Peripheral nervous system (PNS) expression of LRP1 has been demonstrated
in dorsal root ganglia, the sciatic nerve, Schwann cells and satellite cells (Handelmann
et al., 1992, Campana et al., 2006, Shi et al., 2009). In the human and rodent CNS,
LRP1 is expressed in a range of cell types throughout the brain (Table 1.2). The primary
function of LRP1 in the CNS is not well understood, but it is able to regulate protein
transport into the brain, cell survival, neurite outgrowth, regeneration and signaling.
LRP1 is expressed primarily on neuron cell bodies of the cerebral cortex,
cerebellum, thalamus, brain stem and hippocampus, though there are some reports of
reactivity along proximal and dendritic processes (Wolf et al., 1992, Rebeck et al.,
1993, Bu et al., 1994b, Ishiguro et al., 1995, Deane et al., 2004, May et al., 2004, Liu et
al., 2007). Further work in vitro has supported these in vivo findings and allowed more
defined identification of LRP1 in these cells. Expression has been reported in
hippocampal, cortical, retinal ganglion and cerebellar granule neuron cell bodies and
dendritic processes (Brown et al., 1997, May et al., 2004, Hayashi et al., 2007, Ambjørn
et al., 2008, Shi et al., 2009). The primary glial cells positive for LRP1 in vivo are
astrocytes, in which expression is present in cell bodies and processes (Wolf et al.,
1992, Rebeck et al., 1993, Zheng et al., 1994, Ishiguro et al., 1995). However, microglia
and oligodendrocytes, as well as astrocytes, express the receptor in cell bodies and
processes in vitro (Marzolo et al., 2000, Gaultier et al., 2009). Much of the interest in
LRP1 expression in the CNS has evolved from findings that the receptor is involved in
Alzheimer’s disease.
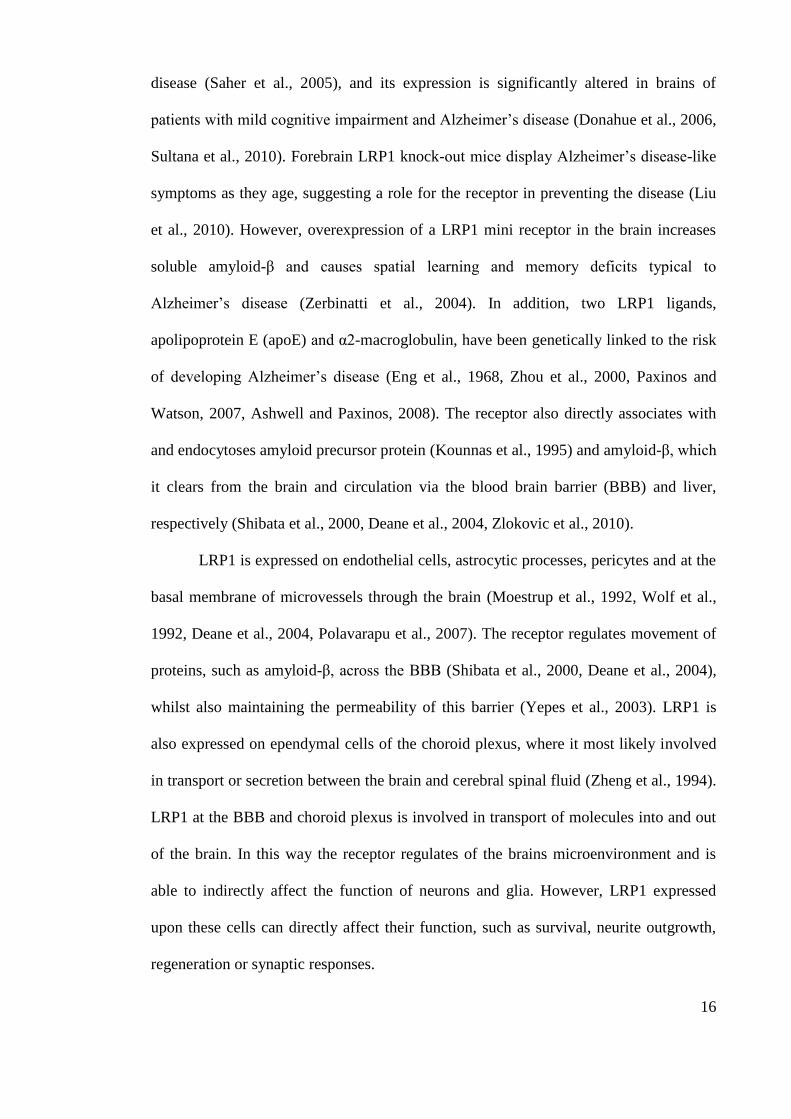
LRP1 has been associated with late onset of Alzheimer’s disease by a number of
mechanisms. The receptor has been genetically linked to the risk of developing the
16
disease (Saher et al., 2005), and its expression is significantly altered in brains of
patients with mild cognitive impairment and Alzheimer’s disease (Donahue et al., 2006,
Sultana et al., 2010). Forebrain LRP1 knock-out mice display Alzheimer’s disease-like
symptoms as they age, suggesting a role for the receptor in preventing the disease (Liu
et al., 2010). However, overexpression of a LRP1 mini receptor in the brain increases
soluble amyloid-β and causes spatial learning and memory deficits typical to
Alzheimer’s disease (Zerbinatti et al., 2004). In addition, two LRP1 ligands,
apolipoprotein E (apoE) and α2-macroglobulin, have been genetically linked to the risk
of developing Alzheimer’s disease (Eng et al., 1968, Zhou et al., 2000, Paxinos and
Watson, 2007, Ashwell and Paxinos, 2008). The receptor also directly associates with
and endocytoses amyloid precursor protein (Kounnas et al., 1995) and amyloid-β, which
it clears from the brain and circulation via the blood brain barrier (BBB) and liver,
respectively (Shibata et al., 2000, Deane et al., 2004, Zlokovic et al., 2010).
LRP1 is expressed on endothelial cells, astrocytic processes, pericytes and at the
basal membrane of microvessels through the brain (Moestrup et al., 1992, Wolf et al.,
1992, Deane et al., 2004, Polavarapu et al., 2007). The receptor regulates movement of
proteins, such as amyloid-β, across the BBB (Shibata et al., 2000, Deane et al., 2004),
whilst also maintaining the permeability of this barrier (Yepes et al., 2003). LRP1 is
also expressed on ependymal cells of the choroid plexus, where it most likely involved
in transport or secretion between the brain and cerebral spinal fluid (Zheng et al., 1994).
LRP1 at the BBB and choroid plexus is involved in transport of molecules into and out
of the brain. In this way the receptor regulates of the brains microenvironment and is
able to indirectly affect the function of neurons and glia. However, LRP1 expressed
upon these cells can directly affect their function, such as survival, neurite outgrowth,
regeneration or synaptic responses.
17
Table 1.2: LRP1 is expressed in cells of the human, rat and mouse central nervous systems
Tissue Cell Location on cell Technique Animal strain Reference
HU
MA
N
Cerebral cortex
Neurons Cell body
IHC
(DAB) NA
(Moestrup
et al.,
1992)
Astrocytes (fibrillary) Cell body
Processes
Capillaries Basal membrane
Cerebellum
Granule cells Cell body
Purkinje cells Cell body
Capillaries Basal membrane
Cerebral cortex
Thalamus
Dentate nucleus
Pyramidal neurons Cell body
Proximal processes IHC
(DAB) NA (Wolf et
al., 1992) Cerebellar cortex Astrocytes Perivascular processes
Cerebral cortex WB
Temporal cortex
Pyramidal neurons
Cell body
Dendritic processes
Proximal axons
IHC
(DAB) NA
(Rebeck et
al., 1993)
Astrocytes Cell body
Processes
Hippocampus
Pyramidal neurons
(CA1, CA3, CA4)
Cell body
Dendritic processes
Granule neurons (DG) Cell body
Dendritic processes
Frontal cortex Endothelial cells Cell body IHC
(F) NA
(Deane et
al., 2004)
RA
T
Choroid plexus Ependymal cells Diffuse throughout IHC
(F) Lewis
(Zheng et
al., 1994) CNS (NS) Neurons (not shown) Focal
CNS (NS) Astrocytes (not shown) Focal
Cerebral cortex Neurons IP NS (P10)
(Bu et al.,
1994a)
Cerebral cortex
Hippocampus
Brain stem
Cerebellum
RPA
NS (adult)
Hippocampus Neurons (DG, CA3) NS ISH
Cerebellum Purkinje cells Cell body
Cerebral cortex Neurons
Glia Cell body
ISH
Hooded Wistar
(E20)
(Ishiguro
et al.,
1995)
Hippocampus Pyramidal neurons
(CA3) Cell body
Hooded Wistar
(Adult) Cerebral cortex Neurons Cell body
Cerebellum Granule cells
Purkinje cells Cell body
Whole brain NthB Hooded Wistar
(E18 to adult)
Whole brain WB Sprague Dawley (Hayashi et
al., 2007)
18
Tissue Cell Location on cell Technique Animal strain Reference
MO
US
E
Cerebral cortex Neurons Cell body IHC
(DAB) C57BL/6
(May et al.,
2004)
'Other regions of
brain' Neurons NS
Whole brain NthB
WB
Hippocampus
CA1 Neurons Cell body IHC
(F) C57BL/6 (Liu et al.,
2007) Frontal cortex Pyramidal neurons Cell body
Forebrain WB
Forebrain WB C57BL/6 (Xu et al.,
2008)
Whole brain Slot blot NS (Herz et
al., 1988)
Microvessels NS IHC
(DAB C57BL/6
(Shibata et
al., 2000)
Cerebral cortex
Hippocampus
Thalamus
Endothelial cells Cell body IHC
(F) C57BL/6
(Deane et
al., 2004)
Table 1.2 continued: LRP1 is expressed in cells of the human, rat and mouse central
nervous systems. Low density lipoprotein receptor-related protein-1 (LRP1) expression
is detected in cell bodies and processes of neurons, glia and other cells of human, rat
and mouse central nervous systems. Both LRP1 mRNA and protein have been detected
using a range of laboratory techniques and rodent strains.
DAB: diaminobenzidine; DG: dentate gyrus; F: fluorescence; IHC:
immunohistochemistry; IP: immunoprecipitation; ISH: in situ hybridisation; NA: not
applicable; NS: not specified; NthB: northern blot; RPA: RNase protection assay; WB:
western blot
19
1.3.2.1 Regulation of neuronal survival
The development of in vitro models of neuron survival, neurite outgrowth,
regeneration and signaling has enabled the investigation of LRP1 function in a range of
neuron subtypes.
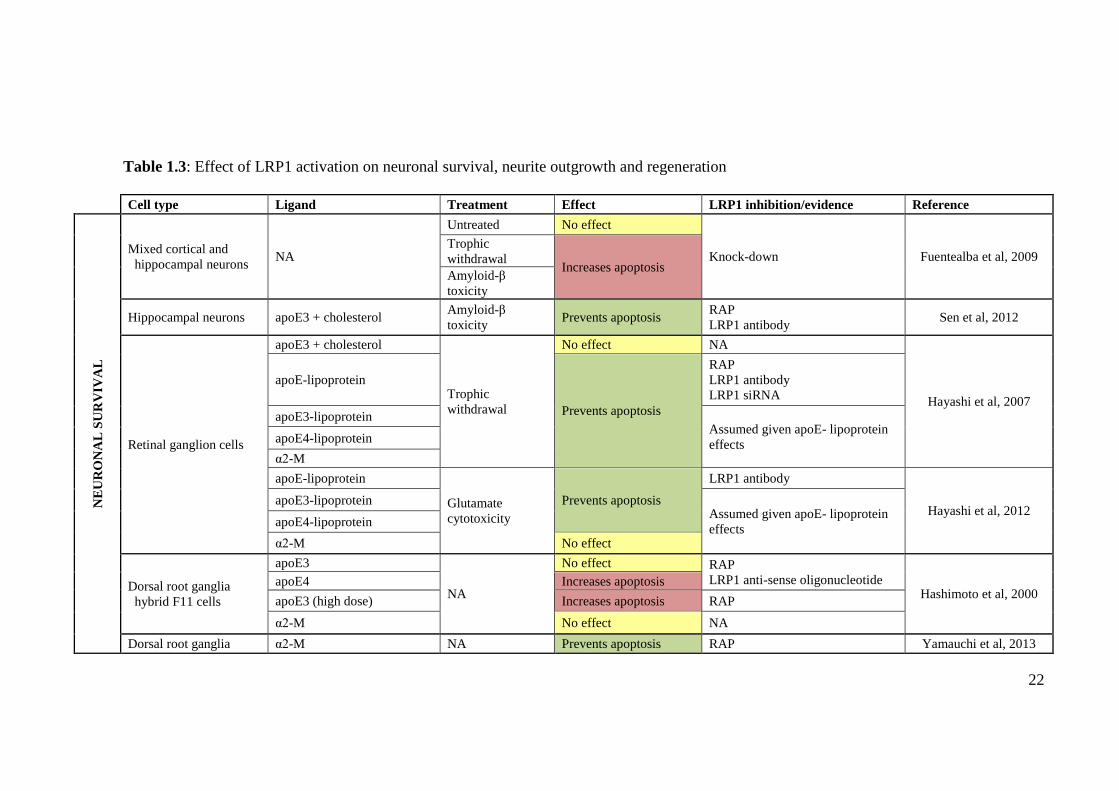
LRP1 regulates neuronal survival in a manner dependent on cell type, ligand and
apoptotic stimuli involved (Table 1.3). LRP1 knock-down increases apoptosis of mixed
cortical and hippocampal neurons following trophic withdrawal and amyloid-β toxicity
in vitro (Fuentealba et al., 2009). This demonstrates a role for the receptor in
maintaining neuron health, a finding supported by evidence that direct stimulation of
LRP1 affects neuron survival. apoE3 with cholesterol protects against amyloid-β
mediated apoptosis in hippocampal neurons, an outcome inhibited by addition of
antibodies against LRP1 (Sen et al., 2012). In comparison, apoE3 with cholesterol does
not inhibit apoptosis of retinal ganglion cells following trophic withdrawal (Hayashi et
al., 2007). However, apoE containing lipoproteins prevent apoptosis of these cells
following trophic withdrawal and glutamate toxicity, effects that are abolished when
LRP1 is inhibited (Hayashi et al., 2007, Hayashi et al., 2012). In comparison, LRP1
induces apoptosis of dorsal root ganglia (DRG) hybrid F11 cells through apoE4, though
apoE3 does not affect these cells survival. Both RAP and an anti-sense oligonucleotide
that caused 40-70% knock-down of LRP1 inhibited apoE4 induced apoptosis.
Interestingly, a high dose of apoE3 (200μg/mL vs 30μg/mL) induced apoptosis in F11
cells (Hashimoto et al., 2000). The binding domain of α2-macroglobulin prevents
apoptosis of DRGs, but interestingly, α2-macroglobulin itself does not affect survival of
F11 cells (Hashimoto et al., 2000, Yamauchi et al., 2013). These findings demonstrate
that LRP1 mediated effects are significantly dependent on cell type and ligand
properties.
20
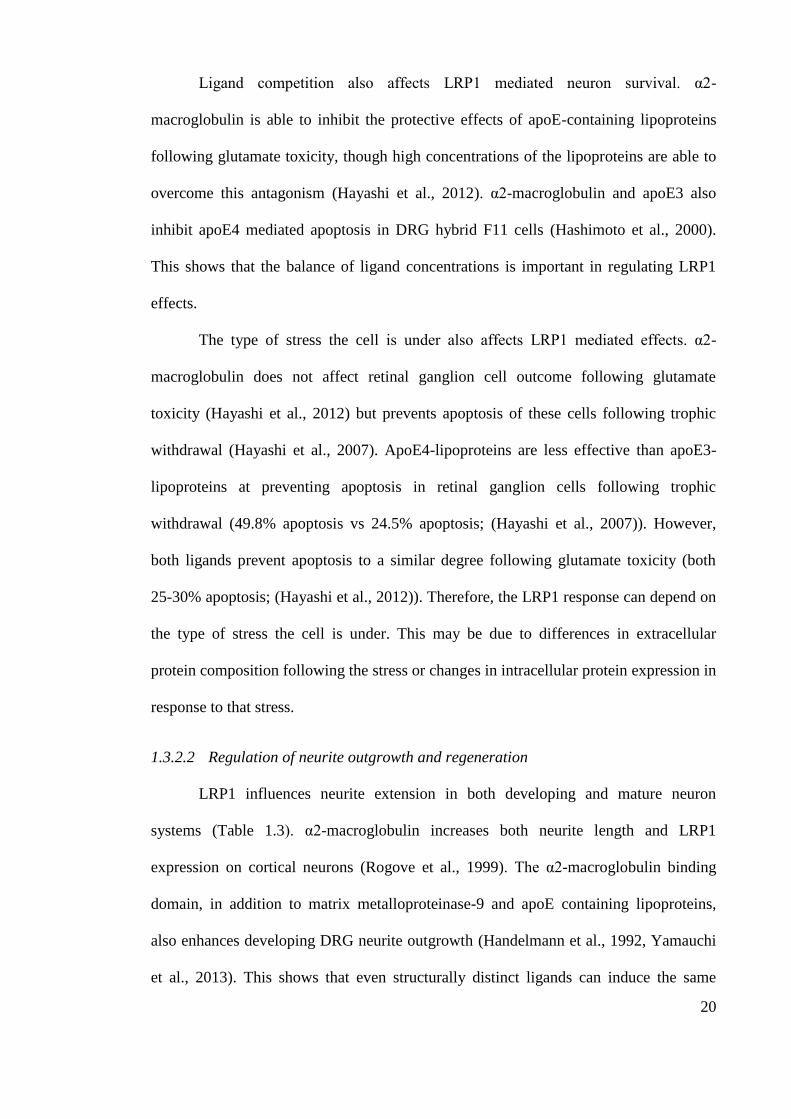
Ligand competition also affects LRP1 mediated neuron survival. α2-
macroglobulin is able to inhibit the protective effects of apoE-containing lipoproteins
following glutamate toxicity, though high concentrations of the lipoproteins are able to
overcome this antagonism (Hayashi et al., 2012). α2-macroglobulin and apoE3 also
inhibit apoE4 mediated apoptosis in DRG hybrid F11 cells (Hashimoto et al., 2000).
This shows that the balance of ligand concentrations is important in regulating LRP1
effects.
The type of stress the cell is under also affects LRP1 mediated effects. α2-
macroglobulin does not affect retinal ganglion cell outcome following glutamate
toxicity (Hayashi et al., 2012) but prevents apoptosis of these cells following trophic
withdrawal (Hayashi et al., 2007). ApoE4-lipoproteins are less effective than apoE3-
lipoproteins at preventing apoptosis in retinal ganglion cells following trophic
withdrawal (49.8% apoptosis vs 24.5% apoptosis; (Hayashi et al., 2007)). However,
both ligands prevent apoptosis to a similar degree following glutamate toxicity (both
25-30% apoptosis; (Hayashi et al., 2012)). Therefore, the LRP1 response can depend on
the type of stress the cell is under. This may be due to differences in extracellular
protein composition following the stress or changes in intracellular protein expression in
response to that stress.
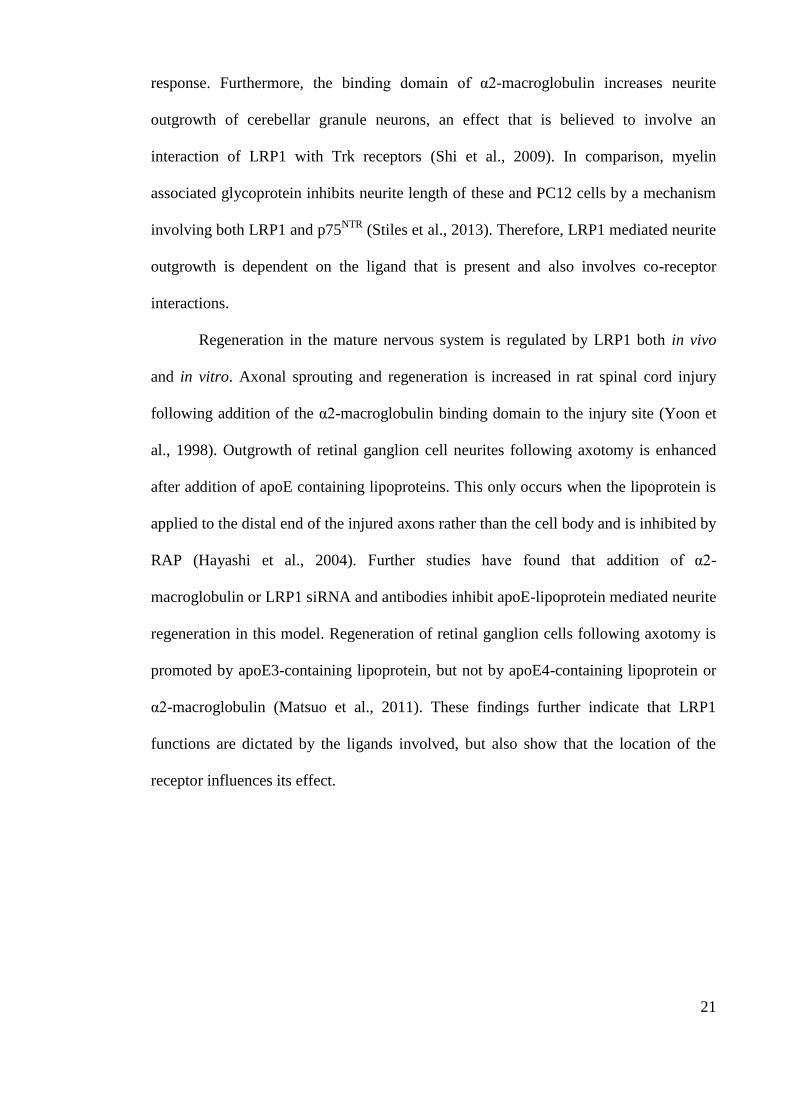
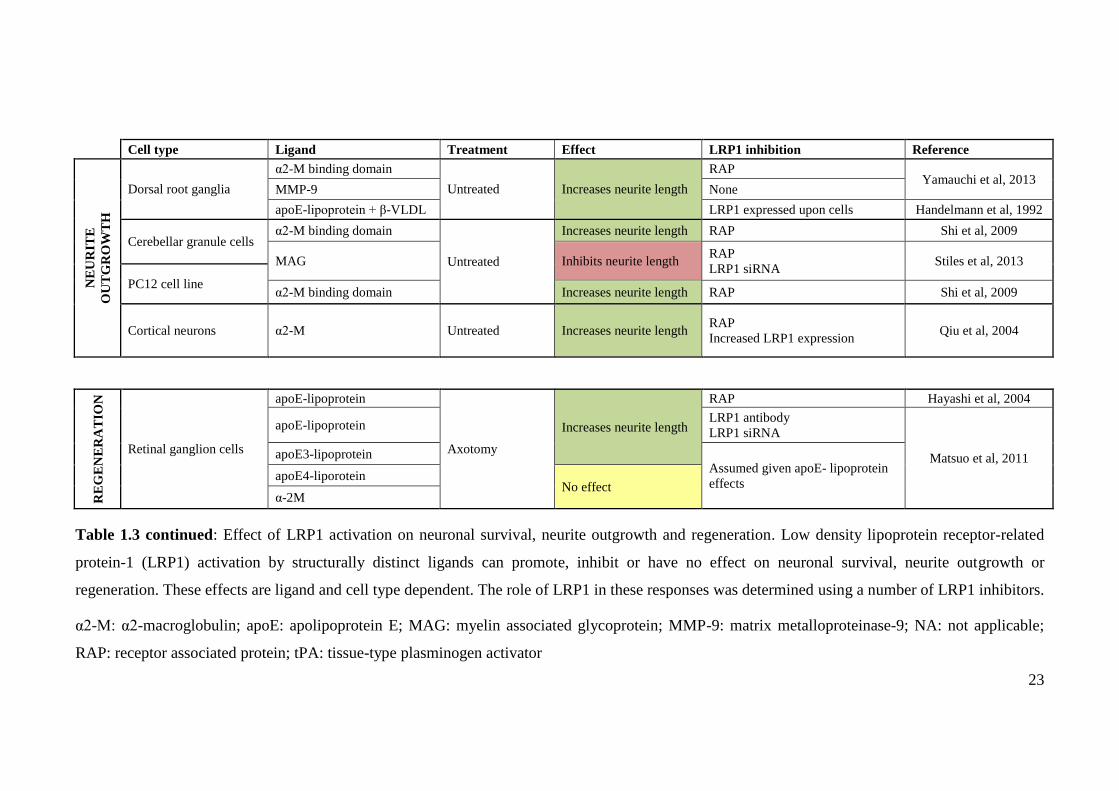
1.3.2.2 Regulation of neurite outgrowth and regeneration
LRP1 influences neurite extension in both developing and mature neuron
systems (Table 1.3). α2-macroglobulin increases both neurite length and LRP1
expression on cortical neurons (Rogove et al., 1999). The α2-macroglobulin binding
domain, in addition to matrix metalloproteinase-9 and apoE containing lipoproteins,
also enhances developing DRG neurite outgrowth (Handelmann et al., 1992, Yamauchi
et al., 2013). This shows that even structurally distinct ligands can induce the same
21
response. Furthermore, the binding domain of α2-macroglobulin increases neurite
outgrowth of cerebellar granule neurons, an effect that is believed to involve an
interaction of LRP1 with Trk receptors (Shi et al., 2009). In comparison, myelin
associated glycoprotein inhibits neurite length of these and PC12 cells by a mechanism
involving both LRP1 and p75NTR
(Stiles et al., 2013). Therefore, LRP1 mediated neurite
outgrowth is dependent on the ligand that is present and also involves co-receptor
interactions.
Regeneration in the mature nervous system is regulated by LRP1 both in vivo
and in vitro. Axonal sprouting and regeneration is increased in rat spinal cord injury
following addition of the α2-macroglobulin binding domain to the injury site (Yoon et
al., 1998). Outgrowth of retinal ganglion cell neurites following axotomy is enhanced
after addition of apoE containing lipoproteins. This only occurs when the lipoprotein is
applied to the distal end of the injured axons rather than the cell body and is inhibited by
RAP (Hayashi et al., 2004). Further studies have found that addition of α2-
macroglobulin or LRP1 siRNA and antibodies inhibit apoE-lipoprotein mediated neurite
regeneration in this model. Regeneration of retinal ganglion cells following axotomy is
promoted by apoE3-containing lipoprotein, but not by apoE4-containing lipoprotein or
α2-macroglobulin (Matsuo et al., 2011). These findings further indicate that LRP1
functions are dictated by the ligands involved, but also show that the location of the
receptor influences its effect.
22
Table 1.3: Effect of LRP1 activation on neuronal survival, neurite outgrowth and regeneration
Cell type Ligand Treatment Effect LRP1 inhibition/evidence Reference
NE
UR
ON
AL
SU
RV
IVA
L
Mixed cortical and
hippocampal neurons NA
Untreated No effect
Knock-down Fuentealba et al, 2009 Trophic
withdrawal Increases apoptosis
Amyloid-β
toxicity
Hippocampal neurons apoE3 + cholesterol Amyloid-β
toxicity Prevents apoptosis
RAP
LRP1 antibody Sen et al, 2012
Retinal ganglion cells
apoE3 + cholesterol
Trophic
withdrawal
No effect NA
Hayashi et al, 2007
apoE-lipoprotein
Prevents apoptosis
RAP
LRP1 antibody
LRP1 siRNA
apoE3-lipoprotein Assumed given apoE- lipoprotein
effects apoE4-lipoprotein
α2-M
apoE-lipoprotein
Glutamate
cytotoxicity
Prevents apoptosis
LRP1 antibody
Hayashi et al, 2012 apoE3-lipoprotein
Assumed given apoE- lipoprotein
effects apoE4-lipoprotein
α2-M No effect
Dorsal root ganglia
hybrid F11 cells
apoE3
NA
No effect RAP
LRP1 anti-sense oligonucleotide Hashimoto et al, 2000
apoE4 Increases apoptosis
apoE3 (high dose) Increases apoptosis RAP
α2-M No effect NA
Dorsal root ganglia α2-M NA Prevents apoptosis RAP Yamauchi et al, 2013
23
Cell type Ligand Treatment Effect LRP1 inhibition Reference
NE
UR
ITE
OU
TG
RO
WT
H
Dorsal root ganglia
α2-M binding domain
Untreated Increases neurite length
RAP Yamauchi et al, 2013
MMP-9 None
apoE-lipoprotein + β-VLDL LRP1 expressed upon cells Handelmann et al, 1992
Cerebellar granule cells α2-M binding domain
Untreated
Increases neurite length RAP Shi et al, 2009
MAG Inhibits neurite length RAP
LRP1 siRNA Stiles et al, 2013
PC12 cell line α2-M binding domain Increases neurite length RAP Shi et al, 2009
Cortical neurons α2-M Untreated Increases neurite length RAP
Increased LRP1 expression Qiu et al, 2004
RE
GE
NE
RA
TIO
N
Retinal ganglion cells
apoE-lipoprotein
Axotomy
Increases neurite length
RAP Hayashi et al, 2004
apoE-lipoprotein LRP1 antibody
LRP1 siRNA
Matsuo et al, 2011 apoE3-lipoprotein Assumed given apoE- lipoprotein
effects apoE4-liporotein
No effect α-2M
Table 1.3 continued: Effect of LRP1 activation on neuronal survival, neurite outgrowth and regeneration. Low density lipoprotein receptor-related
protein-1 (LRP1) activation by structurally distinct ligands can promote, inhibit or have no effect on neuronal survival, neurite outgrowth or
regeneration. These effects are ligand and cell type dependent. The role of LRP1 in these responses was determined using a number of LRP1 inhibitors.
α2-M: α2-macroglobulin; apoE: apolipoprotein E; MAG: myelin associated glycoprotein; MMP-9: matrix metalloproteinase-9; NA: not applicable;
RAP: receptor associated protein; tPA: tissue-type plasminogen activator
24
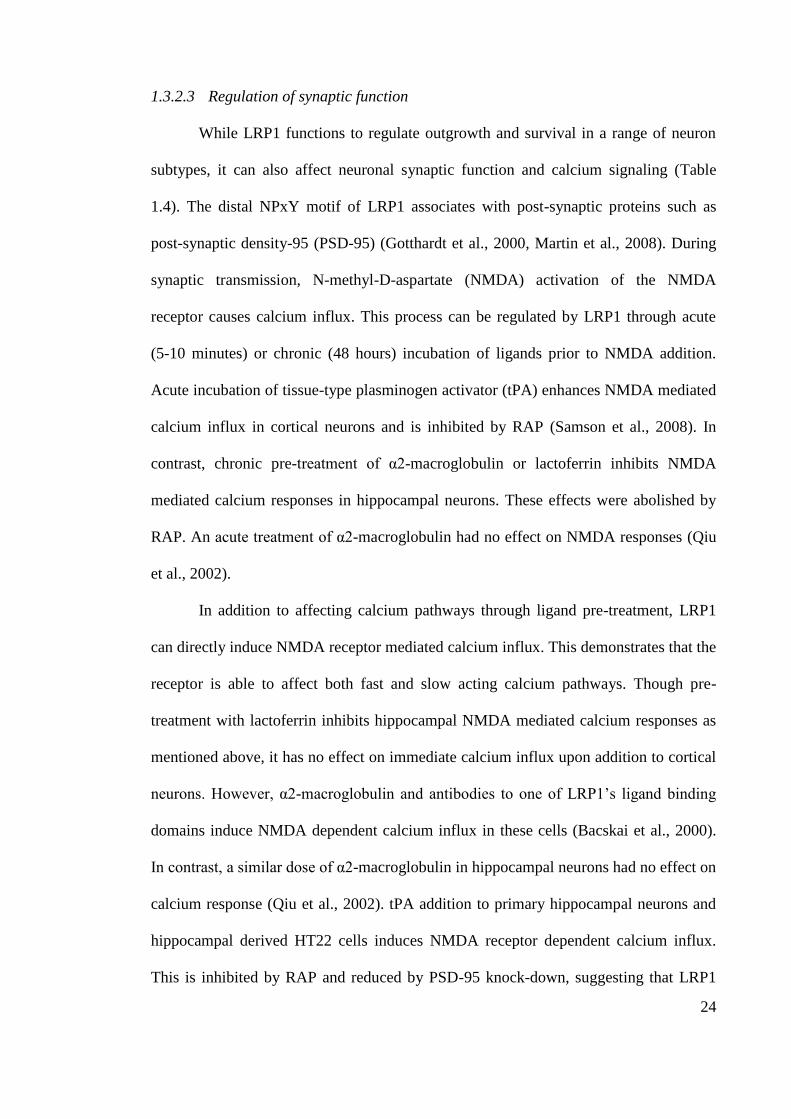
1.3.2.3 Regulation of synaptic function
While LRP1 functions to regulate outgrowth and survival in a range of neuron
subtypes, it can also affect neuronal synaptic function and calcium signaling (Table
1.4). The distal NPxY motif of LRP1 associates with post-synaptic proteins such as
post-synaptic density-95 (PSD-95) (Gotthardt et al., 2000, Martin et al., 2008). During
synaptic transmission, N-methyl-D-aspartate (NMDA) activation of the NMDA
receptor causes calcium influx. This process can be regulated by LRP1 through acute
(5-10 minutes) or chronic (48 hours) incubation of ligands prior to NMDA addition.
Acute incubation of tissue-type plasminogen activator (tPA) enhances NMDA mediated
calcium influx in cortical neurons and is inhibited by RAP (Samson et al., 2008). In
contrast, chronic pre-treatment of α2-macroglobulin or lactoferrin inhibits NMDA
mediated calcium responses in hippocampal neurons. These effects were abolished by
RAP. An acute treatment of α2-macroglobulin had no effect on NMDA responses (Qiu
et al., 2002).
In addition to affecting calcium pathways through ligand pre-treatment, LRP1
can directly induce NMDA receptor mediated calcium influx. This demonstrates that the
receptor is able to affect both fast and slow acting calcium pathways. Though pre-
treatment with lactoferrin inhibits hippocampal NMDA mediated calcium responses as
mentioned above, it has no effect on immediate calcium influx upon addition to cortical
neurons. However, α2-macroglobulin and antibodies to one of LRP1’s ligand binding
domains induce NMDA dependent calcium influx in these cells (Bacskai et al., 2000).
In contrast, a similar dose of α2-macroglobulin in hippocampal neurons had no effect on
calcium response (Qiu et al., 2002). tPA addition to primary hippocampal neurons and
hippocampal derived HT22 cells induces NMDA receptor dependent calcium influx.
This is inhibited by RAP and reduced by PSD-95 knock-down, suggesting that LRP1
25
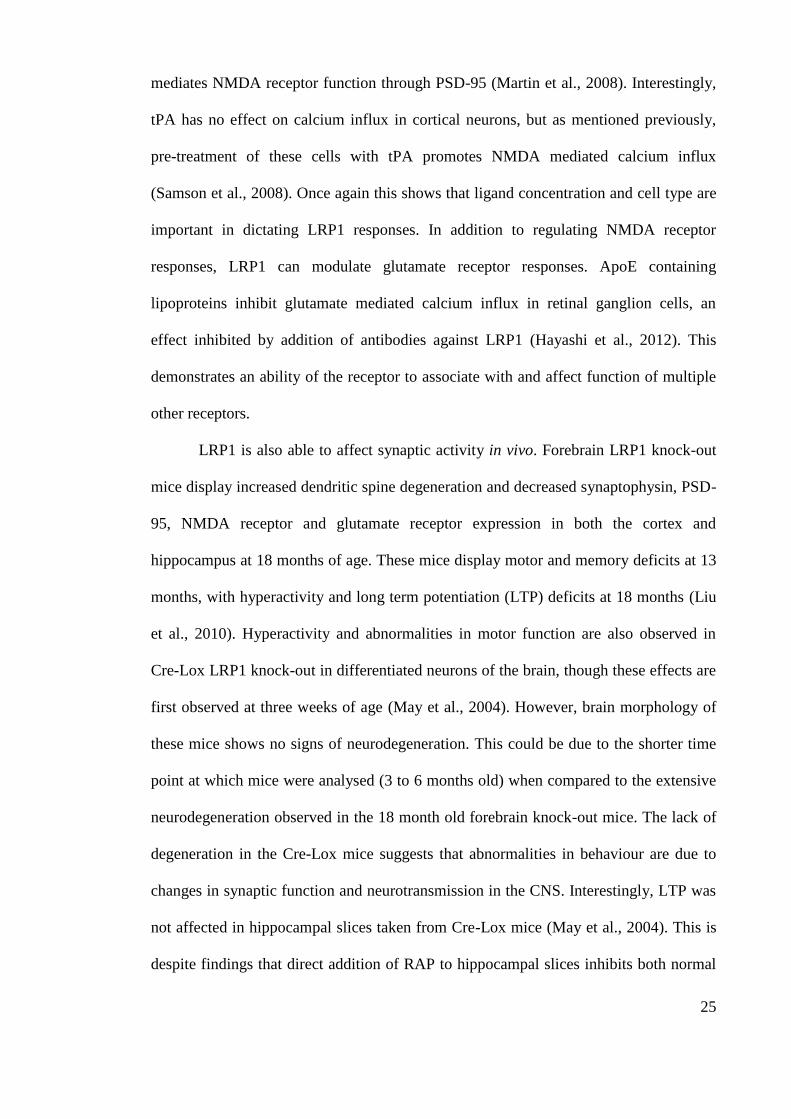
mediates NMDA receptor function through PSD-95 (Martin et al., 2008). Interestingly,
tPA has no effect on calcium influx in cortical neurons, but as mentioned previously,
pre-treatment of these cells with tPA promotes NMDA mediated calcium influx
(Samson et al., 2008). Once again this shows that ligand concentration and cell type are
important in dictating LRP1 responses. In addition to regulating NMDA receptor
responses, LRP1 can modulate glutamate receptor responses. ApoE containing
lipoproteins inhibit glutamate mediated calcium influx in retinal ganglion cells, an
effect inhibited by addition of antibodies against LRP1 (Hayashi et al., 2012). This
demonstrates an ability of the receptor to associate with and affect function of multiple
other receptors.
LRP1 is also able to affect synaptic activity in vivo. Forebrain LRP1 knock-out
mice display increased dendritic spine degeneration and decreased synaptophysin, PSD-
95, NMDA receptor and glutamate receptor expression in both the cortex and
hippocampus at 18 months of age. These mice display motor and memory deficits at 13
months, with hyperactivity and long term potentiation (LTP) deficits at 18 months (Liu
et al., 2010). Hyperactivity and abnormalities in motor function are also observed in
Cre-Lox LRP1 knock-out in differentiated neurons of the brain, though these effects are
first observed at three weeks of age (May et al., 2004). However, brain morphology of
these mice shows no signs of neurodegeneration. This could be due to the shorter time
point at which mice were analysed (3 to 6 months old) when compared to the extensive
neurodegeneration observed in the 18 month old forebrain knock-out mice. The lack of
degeneration in the Cre-Lox mice suggests that abnormalities in behaviour are due to
changes in synaptic function and neurotransmission in the CNS. Interestingly, LTP was
not affected in hippocampal slices taken from Cre-Lox mice (May et al., 2004). This is
despite findings that direct addition of RAP to hippocampal slices inhibits both normal
26
and tPA induced LTP. LRP1 is expressed with tPA in slices and is the primary receptor
that tPA bound to, supporting a role for LRP1 in this process (Zhuo et al., 2000). LRP1
knock-out models demonstrate an important role for LRP1 in behavioural and motor
functions, a role that involves both protection against neuron death and regulation of
neurotransmission.
1.3.2.4 LRP1 mediated signaling
As LRP1 can affect calcium influx in a number of cell models (Table 1.4), and
many LRP1 mediated responses are based on calcium events, it is likely that the
receptor is able to mediate its effects through calcium signaling mechanisms. There are
a range of mechanisms used to control LRP1 function. Not only is the presence of a
ligand available to bind to the receptor important, but also the balance of all ligands and
their interactions in the environment. Cell specific proteins, such as intracellular
signaling proteins and co-receptors, also regulate LRP1 pathway activation upon ligand
binding. The regulation of LRP1 is particular important as it is has so many effects, is
expressed in a range of tissues and binds an abnormally large number of ligands. One of
these ligands of particular interest due to its effects on neuronal biology is
metallothionein (MT).
27
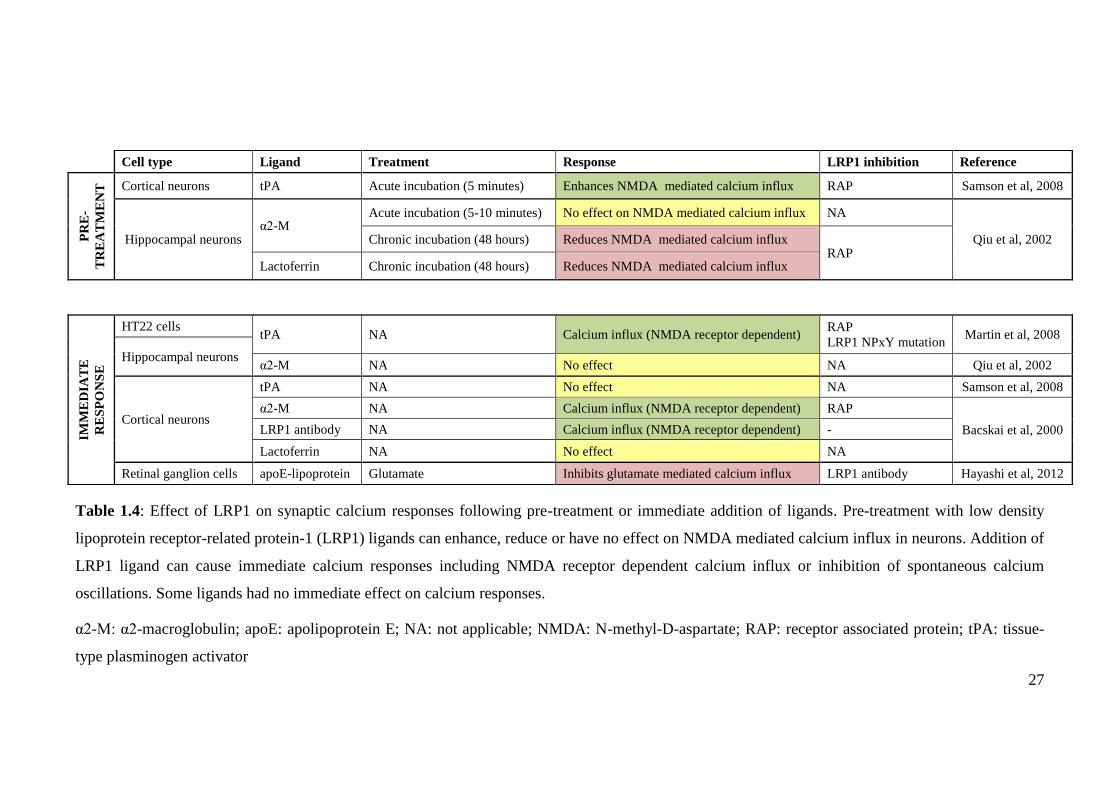
Table 1.4: Effect of LRP1 on synaptic calcium responses following pre-treatment or immediate addition of ligands. Pre-treatment with low density
lipoprotein receptor-related protein-1 (LRP1) ligands can enhance, reduce or have no effect on NMDA mediated calcium influx in neurons. Addition of
LRP1 ligand can cause immediate calcium responses including NMDA receptor dependent calcium influx or inhibition of spontaneous calcium
oscillations. Some ligands had no immediate effect on calcium responses.
α2-M: α2-macroglobulin; apoE: apolipoprotein E; NA: not applicable; NMDA: N-methyl-D-aspartate; RAP: receptor associated protein; tPA: tissue-
type plasminogen activator
Cell type Ligand Treatment Response LRP1 inhibition Reference
PR
E-
TR
EA
TM
EN
T
Cortical neurons tPA Acute incubation (5 minutes) Enhances NMDA mediated calcium influx RAP Samson et al, 2008
Hippocampal neurons α2-M
Acute incubation (5-10 minutes) No effect on NMDA mediated calcium influx NA
Qiu et al, 2002 Chronic incubation (48 hours) Reduces NMDA mediated calcium influx RAP
Lactoferrin Chronic incubation (48 hours) Reduces NMDA mediated calcium influx
IMM
ED
IAT
E
RE
SP
ON
SE
HT22 cells tPA NA Calcium influx (NMDA receptor dependent)
RAP
LRP1 NPxY mutation Martin et al, 2008
Hippocampal neurons α2-M NA No effect NA Qiu et al, 2002
Cortical neurons
tPA NA No effect NA Samson et al, 2008
α2-M NA Calcium influx (NMDA receptor dependent) RAP
Bacskai et al, 2000 LRP1 antibody NA Calcium influx (NMDA receptor dependent) -
Lactoferrin NA No effect NA
Retinal ganglion cells apoE-lipoprotein Glutamate Inhibits glutamate mediated calcium influx LRP1 antibody Hayashi et al, 2012
28
1.4 METALLOTHIONEIN
There are four different isoforms in the MT family: MT-I, MT-II, MT-II and
MT-IV (Kägi et al., 1974, Lawson et al., 1990, Quaife et al., 1994). The most common
and best characterised members of the MT family are MT-I and MT-II. These two
isoforms are often referred in combination as MT-I/II as they are so similar in structure,
function and regulation in the mouse system (Searle et al., 1984). However, this may
not be true in other mammalian species, including humans (Blackstad et al., 1970). For
the remainder of this thesis, MT-I/II will be referred to as MT.
MTs possess seven cysteine rich sites that bind metals such as zinc and copper
(Kägi et al., 1974, Kojima et al., 1976). MT sequesters heavy metals (Kelly et al., 1996,
Seamans et al., 1997), regulates the availability of metals able to interact with other
proteins (Udom and Brady, 1980, Jiang et al., 1998) and scavenges free radicals to
protect cells from oxidative stress (Hussain et al., 1996, Ye et al., 2003). MT has two
known receptors, LRP1 and LRP2 (Fitzgerald et al., 2007) and can activate intracellular
pathways through binding these receptors (Klassen et al., 2004, Ambjørn et al., 2008).
Through LRP mediated mechanisms, MT is able to regulate neuronal survival,
outgrowth and regeneration.
In recent years, peptides modeled after MT subunits have been developed that
possess similar properties. These peptides, called emtins, include emtinAn, emtinAc,
which are based on the N- and C-terminals of MT’s α-domain, respectively (Lopes et
al., 1994), and emtinB, which is based on MT’s β-domain (Ambjørn et al., 2008).
Emtins are able to cross the BBB (Henze et al., 1996) and bind LRPs (Ambjørn et al.,
2008). As these peptides do not bind metals or scavenge free radicals (Ambjørn et al.,
2008), it is plausible that LRP activation is their primary mode of action and allows
them to mediate neurotrophic responses.
29
1.4.1 METALLOTHIONEIN AND EMTIN REGULATION OF NEURON FUNCTION
MT-IIA, an isoform of MT-II, increases wound healing following in vivo
cortical needle-stick injury and in vitro cortical axon transection (Chung et al., 2003).
Addition of MT, emtinAc and emtinB to cerebellar granule neurons increases
developing neurite outgrowth and protects against apoptosis triggered by potassium
withdrawal. These effects occurred through activation of pro-survival pathways and
were inhibited by RAP, demonstrating a LRP dependent mechanism (Lopes et al., 1994,
Ambjørn et al., 2008). MT is also able to promote DRG outgrowth and stimulate
regeneration of DRG axons in vitro after scratch injury through a similar mechanism.
The role of LRPs in these outcomes was demonstrated by RAP inhibition of effects
(Leung et al., 2011). These findings indicate that many of the neurotrophic effects of
MT are mediated through LRP activation.
In addition to acting directly upon neurons, MT can also indirectly affect
function through actions on supportive glial cells such as astrocytes. Cultured astrocytes
undergo pro-regenerative astrogliosis in the presence of MT leading to activation of
pathways that increase cortical neuron axon regeneration following injury (Leung et al.,
2010). Astrocytes not only respond to MT but also secrete it to be taken up by
surrounding cortical neurons, an action inhibited by RAP (Chung et al., 2008). MT and
emtins promote neuronal survival and regeneration in a range of neuron models. LRP
mediated intracellular signaling is likely to be involved in this process, though the exact
role of LRP1 is currently unknown.
Interestingly, different MT isoform can have opposing effects through LRP
activation. MT is a chemoattractive cue in growth cone turning in developing DRGs,
whereas MT-III is chemorepulsive. Both these responses are inhibited by siRNA against
either or both LRP1 and LRP2 (Landowski et al., 2011). The metal composition of MT
also affects its function. While zinc bound MT inhibits LTP in normal hippocampal
30
slices, non-metal bound MT has no effect in untreated slices and protects against an
amyloid-beta mediated inhibition of LTP (Herbert et al., 2012). These findings are
consistent with past reports that similar ligands can produce different effects through
LRP1 activation, and that the nature of the ligand is crucial in dictating these effects.
1.5 PROJECT HYPOTHESIS AND AIMS
The range of LRP1 expression throughout the body, its many ligands and its
ability to dictate numerous cellular processes suggest that this receptor may be a generic
sensor of the extracellular environment. In the nervous system, it appears particularly
important in maintaining healthy, functional neurons and glia. LRP1 regulation is
complex but specific to produce precise effects. Understanding the specificity of LRP1
in different conditions is important in determining how the receptor is able to regulate
so many different functions. LRP1 activity is affected by the ligands available to bind it
and cell specific proteins that interact with the receptor. These in turn are determined by
the cell LRP1 is expressed upon and its location upon that cell. Therefore, the pattern of
LRP1 expression and how this changes in development or injury will provide insight
into the role of the receptor in different neuronal functions.
MTs and emtins provide an interesting tool through which to study LRP1
function as these proteins act through LRPs, have many effects on neuron function and
there are a range of isoforms that can have different effects. Using MT isoforms, we can
study the effects of LRP1 activation on neuronal function and gain insight into the
receptors’ biology.
This thesis forms the groundwork for exploring the proposal that the diversity
and specificity of an LRP1 response modulates neuronal function, such as regeneration.
In this regard, I hypothesise that 1) LRP1 protein expression in vivo and in vitro
demonstrates developmental and regional differences, and 2) injury will induce changes
31
in cellular expression of LRP1 and regeneration will be promoted in an LRP dependent
manner following addition of MT or emtinB.
Thus, the aims of my project are as follows:
1. Define the expression profile of LRP1 in neurons and glia of the developing and
mature brain through western blots and immunohistochemistry
2. Determine the expression profile of LRP1 in cultured hippocampal neurons and
glia as they mature through western blots and immunocytochemistry
3. Investigate whether MT and emtinB modulate calcium signaling in hippocampal
neurons in vitro in an LRP1 dependent manner
4. Develop an in vitro scratch injury model to determine whether MT and emtinB
promote regeneration of hippocampal neuron axons in an LRP1 dependent
manner
32
2 Chapter 2: In vivo characterisation of LRP1 in the maturing rat
brain
INTRODUCTION 2.1
LRP1 is a multifunctional receptor that binds a wide range of structurally
distinct ligands and is expressed in, and regulates the function of, neurons and glia of
the brain (Moestrup et al., 1992, Wolf et al., 1992, Rebeck et al., 1993, Zheng et al.,
1994, Ishiguro et al., 1995). In vitro models demonstrate LRP1 mediated regulation of
neuronal survival, neurite outgrowth, regeneration and calcium signaling in a range of
neuron subtypes (Bacskai et al., 2000, Qiu et al., 2002, Hayashi et al., 2007, Martin et
al., 2008, Fuentealba et al., 2009, Matsuo et al., 2011, Hayashi et al., 2012, Stiles et al.,
2013, Yamauchi et al., 2013). LRP1 mediated responses vary depending on both the
expression of cell specific intracellular proteins and availability of extracellular ligands
present to interact with and activate the receptor (Hashimoto et al., 2000, Qiu et al.,
2002, Shi et al., 2009, Matsuo et al., 2011, Stiles et al., 2013). Therefore, LRP1 effects
may vary in different regions of the brain due to differences in cell types and
extracellular ligands.
Intracellular protein composition can vary at different subcellular locations in
the same cell, and therefore LRP1 mediated effects may vary from one subcellular
compartment to another. In neurons, the cell body is the primary location of protein
synthesis, dendrites receive and interpret synaptic signals and axons transmit outgoing
signals (Haines, 2002). Therefore, receptors located in these structures may be involved
in these functions. Glia have fundamental roles in maintaining neuron health and
function and LRP1 expression in these cells may have implications for neuron health.
The glia cell body, similar to the neuron, is the site of protein synthesis, but glial
processes can have a range of functions including structurally supporting neurons and
33
surveying and maintaining the surrounding environment (Haines, 2002, Nimmerjahn et
al., 2005). Through investigation of its subcellular location in specific regional
populations of neurons and glia, the role of LRP1 in a given cell type may be better
understood.
Experimental rodent models allow investigation of LRP1 function in vivo. The
majority of LRP1 expression studies in rats have been conducted through detection of
mRNA or immunoblots of protein (Bu et al., 1994b, Ishiguro et al., 1995, Hayashi et al.,
2007). When LRP1 protein was visualised using immunofluorescence in one study it
was noted on neurons and astrocytes but specific cellular localisation of the receptor
was not commented on (Zheng et al., 1994). Differences in LRP1 expression have also
been previously noted between developing and mature brains (Moestrup et al., 1992,
Ishiguro et al., 1995). However, specific distribution of the receptor and how this
changes during maturation has not been investigated thoroughly.
The function of neurons and glia during development is very different to their
function in the mature brain. During embryonic development, neurons proliferate at the
subventricular zone of the neural tube (Nicholls et al., 2001). Through binding to
subtype specific surface molecules on radial glia processes, different neuron populations
are directed to precise brain regions (Rakic, 1972, Nowakowski and Rakic, 1979,
Edmondson et al., 1988, Zheng et al., 1996). Once in position, neurons differentiate and
develop dendrites and axons (Nowakowski and Rakic, 1979). Extending axons are
directed through the brain by attractive or repulsive extracellular cues, extracellular
matrix substrates and cell adhesion molecules to form synapses with other neurons
(Manthorpe et al., 1983, Neugebauer et al., 1988, Serafini et al., 1994, Luo et al., 1995).
Following the formation of a synapse, a large number of neurons undergo apoptosis and
synaptic pruning to refine innervation pathways (Hollyday and Hamburger, 1976,
Nakamura and O'Leary, 1989, Blaschke et al., 1996). Synaptogenesis continues post-
34
natally but decreases during maturation, though it can occur in adulthood to a lesser
degree (Huttenlocher, 1979). Once functional neuronal networks have formed, healthy
neurons and glia must be maintained to allow for chemotransmission (Nicholls et al.,
2001).
A healthy and functional neuronal network requires the presence of astrocytes,
oligodendrocytes and microglia. During development, astrocytes create an environment
permissive for neuron migration, neurite extension and synaptic formation. Astrocytes
produce extracellular matrix components such as laminin, express cell adhesion
molecules such as neural cell adhesion molecule, and release growth factors such as
NGF, all of which aid in neuron and neurite guidance (Liesi and Silver, 1988,
Neugebauer et al., 1988, Yoshida and Gage, 1991). As the brain matures, the ability of
astrocytes to mediate axon regeneration decreases (Smith et al., 1986). An absence of
astrocytes in vitro results in the failure of neurons to form functional, mature synapses,
demonstrating a critical role of these cells in development and stabilisation of these
structures (Ullian et al., 2001). This may be in part through the production of
thrombospondins. These proteins promote synaptogenesis but are downregulated in
adult brains. It is believed that this decrease in thrombospondins contributes to the
decreased synaptogenesis capabilities of adult brains (Christopherson et al., 2005).
However, astrocytes in a mature brain continue to regulate synaptic function by direct
control of synaptic transmission through release and uptake of neurotransmitters
(reviewed by (Perea et al., 2009)). These cells also regulate cerebral blood flow, provide
structural and physical support to neurons of the brain and are activated to promote
immune responses in response to injury ((Haines, 2002, Zonta et al., 2002); reviewed by
(Sofroniew and Vinters, 2010))
Oligodendrocytes are also essential for correct brain development and function
through the myelination of neuron axons to aid in conductance. Differentiation of
35
precursor oligodendrocytes into mature, myelinating cells results in the gradual decline
of proliferative and migratory properties and increase in myelination capabilities of
these cells (Miller et al., 1985). Precursor oligodendrocyte cells differentiate to
progenitor cells, then to pre-oligodendrocytes that begin to associate with axons. These
cells form immature non-myelinating cell before becoming mature non-myelinating
cells, and eventually differentiating into mature myelinating oligodendrocyte (reviewed
by (Baumann and Pham-Dinh, 2001)). Myelination begins at different stages of
development in different areas of the brain. Myelination of the rat spinal cord begins at
foetal day 19, whereas it occurs in the brain stem and frontal cortex post-natal day 1 and
7, respectively. This process in the brain continues until about 60 days post-natally
(Bjelke and Seiger, 1989, Bjartmar et al., 1994, Hamano et al., 1996). Very little
myelination occurs in adults and instead oligodendrocytes maintain myelin and replace
it during injury. Mature oligodendrocytes are renewed by oligodendrocyte precursors
present in the adult brain in cases such as injury (Ffrench-Constant and Raff, 1986).
However, oligodendrocyte precursors present in the adult rat differ in morphology and
have slower migration and differentiation rates to those found in post-natal day 1 brain.
This is believed to be due to differences in the needs for new mature oligodendrocytes
in the adult brain compared to the developing brain (Wolswijk and Noble, 1989).
Microglia are the primary initiators of immune responses in the central nervous
system. They possess many properties similar to macrophages in that they can
phagocytose and present antigens to lymphocytes, and secrete inflammatory mediators
such as interleukin-1 that activate astrocytes (Giulian and Baker, 1985, Giulian et al.,
1986, Hickey and Kimura, 1988). Microglia are present in the central nervous system in
either amoeboid or ramified morphology. The majority of microglia in the foetal brain
are amoeboid. These cells phagocytose apoptotic neurons during development and
allow functional networks to be established (Ashwell, 1990, Brockhaus et al., 1996).
36
Amoeboid microglia differentiate to ramified ‘resting’ microglia during the first 15 days
following birth (Ling, 1979, Murabe and Sano, 1982, Wu et al., 1992). Ramified
microglia have reduced capacity for proliferation, secretion and phagocytosis (Ilschner
and Brandt, 1996). However, upon activation during injury or infection in the adult
brain ramified microglia convert back to amoeboid microglia to promote inflammatory
responses and remove pathogens and debris (Stence et al., 2001).
The functions of neurons and glia change significantly from the developing to
mature brain. This is due to changes in the functional activity of the brain and creation
of an environment that accommodates these changes. Therefore, the role of receptors
expressed upon these cells could be expected to change as well. This is particularly
relevant for a receptor such as LRP1 that can mediate a wide range of effects such as
survival, neurite outgrowth and signaling that are essential in both developing and
mature brains (Hayashi et al., 2007, Martin et al., 2008, Shi et al., 2009, Stiles et al.,
2013).
Through identification of LRP1 expression in cells within specific regions of the
brain, and its subcellular location upon those cells, it is possible to gain a greater
understanding into the role of the receptor in the brain. I hypothesise that LRP1 will be
predominately expressed in cell bodies of neurons and glia of the rat brain, and that this
expression will change from pup to adult brain.
37
METHODS 2.2
All experiments involving the use of animals were approved by the Animal
Experimentation Ethics Committee of the University of Tasmania (ethics number
A0011957), and were conducted in accordance with the Australian Code of Practice for
the Care and Use of Animals for Scientific Purposes. Sprague Dawley rats were used in
all animal experiments.
Buffer recipes and product information for all reagents can be found in
appendices. An LRP1 antibody that targeted the C-terminal end of the light chain
intracellular domain was used in western blots and immunohistochemistry.
2.2.1 WESTERN BLOT
Adult female rats (250-300g) were euthanised by carbon dioxide asphyxiation
and post-natal day 2 and 7 rat pups (P2 and P7 respectively) were decapitated. Brain
tissue was harvested from three separate animals for each time point. For each animal,
the skull was removed and brain transferred to a petri dish. The cerebellum and part of
the brain stem was discarded and the two brain hemispheres separated using scissors.
The cortex and hippocampus were selected for identification of LRP1 as these regions
have been found to express the receptor previously (Rebeck et al., 1993, Bu et al.,
1994b, Ishiguro et al., 1995). The hippocampus is also an interesting tissue as it is one
of the sites in the adult brain to undergo neurogenesis (Eriksson et al., 1998). From one
hemisphere the midbrain was removed to expose the hippocampus which was dissected
out. The remaining thalamus and hypothalamus were removed leaving only cortex.
Hippocampal and cortical tissue and the remaining hemisphere were snap frozen,
crushed using a mortar and pestle in liquid nitrogen and stored at -80°C.
A sample of tissue was homogenised in 100μL RIPA lysis buffer with 1:100
protease inhibitor (Thermo Scientific, USA) using an ultra-turrax. Homogenate was
centrifuged at 13,000g for 10 minutes at 4°C and the supernatant removed. Total protein
38
concentration was determined using a BCA protein assay (Bio-Rad, USA). A working
reagent was prepared as directed by the manufacturer. Briefly, part A and part B
solutions were mixed by a 50:1 ratio. 200μL of working reagent was added to each well
of a 96 well plate. Bovine serum albumin protein standards at 0.5, 1.0, 1.5, 2.0, 2.5 and
3.0mg/mL were prepared to calculate a protein standard curve. 1μL of protein standards
or 1μL of brain sample were mixed with the BCA reagent and incubated for 30 minutes
at 37°C. Triplicates were prepared for each sample. Absorbance at 595nm was
measured using a SpectraMax M2 plate reader (Molecular Devices) and SoftMax Pro
computer program (v 4.8). A standard curve was calculated and used to determine each
sample’s concentration.
1mm thick sodium dodecyl sulphate-polyacrylamide gel electrophoresis (SDS-
PAGE) gels were prepared as 10% resolving and 5% stacking gels (see appendices).
5μL of Spectra protein ladder (Thermo Scientific, USA) was loaded into the first lane.
20μg protein was loaded for each sample. Samples were run using a Mini-Protean Tetra
electrophoresis system (Bio-Rad, USA) in running buffer at 200 volts for 35-45
minutes. Transfer to nitrocellulose paper (Thermo Scientific, USA) was conducted
overnight using an XCell Sure Lock electrophoresis system (Life Technologies, USA)
at 20 volts at 4°C. The nitrocellulose membrane was protein blocked using 5% milk
powder in phosphate buffered saline with 0.05% Tween-20 (PBS-Tw) for at least 60
minutes. Primary antibodies to the light chain of LRP1 or β-actin (housekeeping
protein) were applied in 5% milk powder in PBS-Tw overnight at 4°C (antibody
concentrations and combinations in Table 2.1). Controls of whole brain blots omitting
the primary antibodies were incubated with 5% milk powder alone. The secondary
antibody in PBS-Tw was incubated while shaking for 1 hour at room temperature.
Three 10-minute washes with PBS-Tw occurred after each antibody incubation. Signal
was detected using a chemiluminescent substrate (Millipore, USA). Peroxide and
39
luminol components were mixed at a 1:1 ratio and incubated with the membrane for 5
minutes at room temperature. The membrane was exposed for 600 seconds using a
Chemi-Smart 5000 imaging system and Chemi-Capt 5000 computer program (v 12.8).
Natural light was used to capture the ladder. Image contrast and brightness were
uniformly enhanced using Adobe Photoshop (v 11.0.2).
2.2.2 IMMUNOHISTOCHEMISTRY
Three P2 and three P7 rats were decapitated and the skull removed to expose the
brain which was dissected out and drop fixed in 4% paraformaldehyde overnight. Three
adult male rats (~250g) were intraperitoneally injected with 0.1mL/100g pentobarbitone
(60mg/mL; Troy Laboratories, Aus). Reflexes were tested and once negative rats were
transcardially perfused with PBS followed by 4% paraformaldehyde. The brain was
removed and transferred to 4% paraformaldehyde overnight. All brain tissue was placed
sequentially in 10%, 20% and 30% sucrose overnight for cryoprotection.
Brains were frozen in cryomatrix and sectioned coronally at 10μm on a Leica
CM 1850 UV cryostat. Sections were washed with PBS and dried overnight at 37°C
prior to antigen retrieval with citrate buffer. Sections were immersed in citrate buffer
(see appendices) and cooked at maximum pressure in a pressure cooker for 6 minutes.
Pressure was decreased to 65% for an additional 14 minutes. Sections were cooled to
room temperature and washed for 10 minutes three times in PBS. They were then
incubated in 10% goat serum (Vector Laboratories, USA) in 0.03% triton X-100 (Lab-
Chem, USA) in PBS for 30 minutes at room temperature to block non-specific protein
binding. This was followed by incubation in primary antibodies diluted in 10% goat
serum at room temperature for 1 hour and overnight at 4°C. LRP1 primary antibody was
incubated with primary antibodies against either GFAP (astrocytes), MAP2 (dendrites),
NeuN (neuron cell bodies), olig2 (oligodendrocytes), SMI-312 (axons) or tomato lectin
(microglia; Table 2.1). Negative controls of sections omitting the primary antibodies
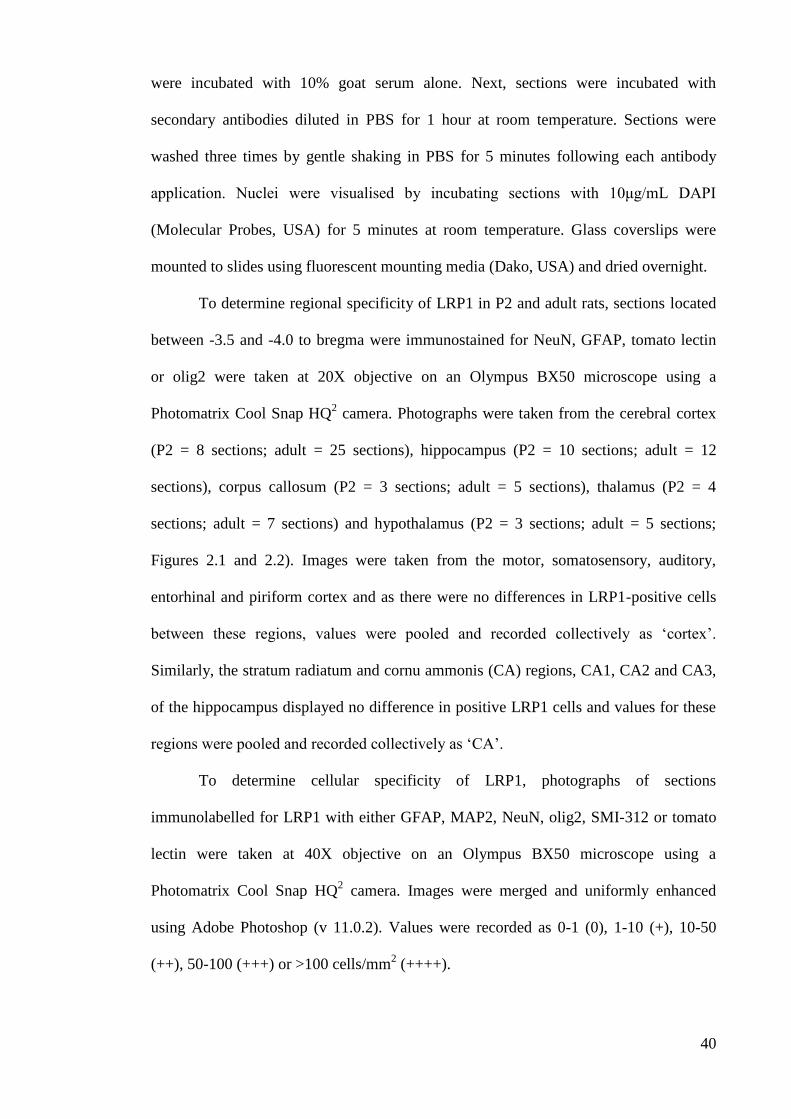
40
were incubated with 10% goat serum alone. Next, sections were incubated with
secondary antibodies diluted in PBS for 1 hour at room temperature. Sections were
washed three times by gentle shaking in PBS for 5 minutes following each antibody
application. Nuclei were visualised by incubating sections with 10μg/mL DAPI
(Molecular Probes, USA) for 5 minutes at room temperature. Glass coverslips were
mounted to slides using fluorescent mounting media (Dako, USA) and dried overnight.
To determine regional specificity of LRP1 in P2 and adult rats, sections located
between -3.5 and -4.0 to bregma were immunostained for NeuN, GFAP, tomato lectin
or olig2 were taken at 20X objective on an Olympus BX50 microscope using a
Photomatrix Cool Snap HQ2 camera. Photographs were taken from the cerebral cortex
(P2 = 8 sections; adult = 25 sections), hippocampus (P2 = 10 sections; adult = 12
sections), corpus callosum (P2 = 3 sections; adult = 5 sections), thalamus (P2 = 4
sections; adult = 7 sections) and hypothalamus (P2 = 3 sections; adult = 5 sections;
Figures 2.1 and 2.2). Images were taken from the motor, somatosensory, auditory,
entorhinal and piriform cortex and as there were no differences in LRP1-positive cells
between these regions, values were pooled and recorded collectively as ‘cortex’.
Similarly, the stratum radiatum and cornu ammonis (CA) regions, CA1, CA2 and CA3,
of the hippocampus displayed no difference in positive LRP1 cells and values for these
regions were pooled and recorded collectively as ‘CA’.
To determine cellular specificity of LRP1, photographs of sections
immunolabelled for LRP1 with either GFAP, MAP2, NeuN, olig2, SMI-312 or tomato
lectin were taken at 40X objective on an Olympus BX50 microscope using a
Photomatrix Cool Snap HQ2 camera. Images were merged and uniformly enhanced
using Adobe Photoshop (v 11.0.2). Values were recorded as 0-1 (0), 1-10 (+), 10-50
(++), 50-100 (+++) or >100 cells/mm2 (++++).
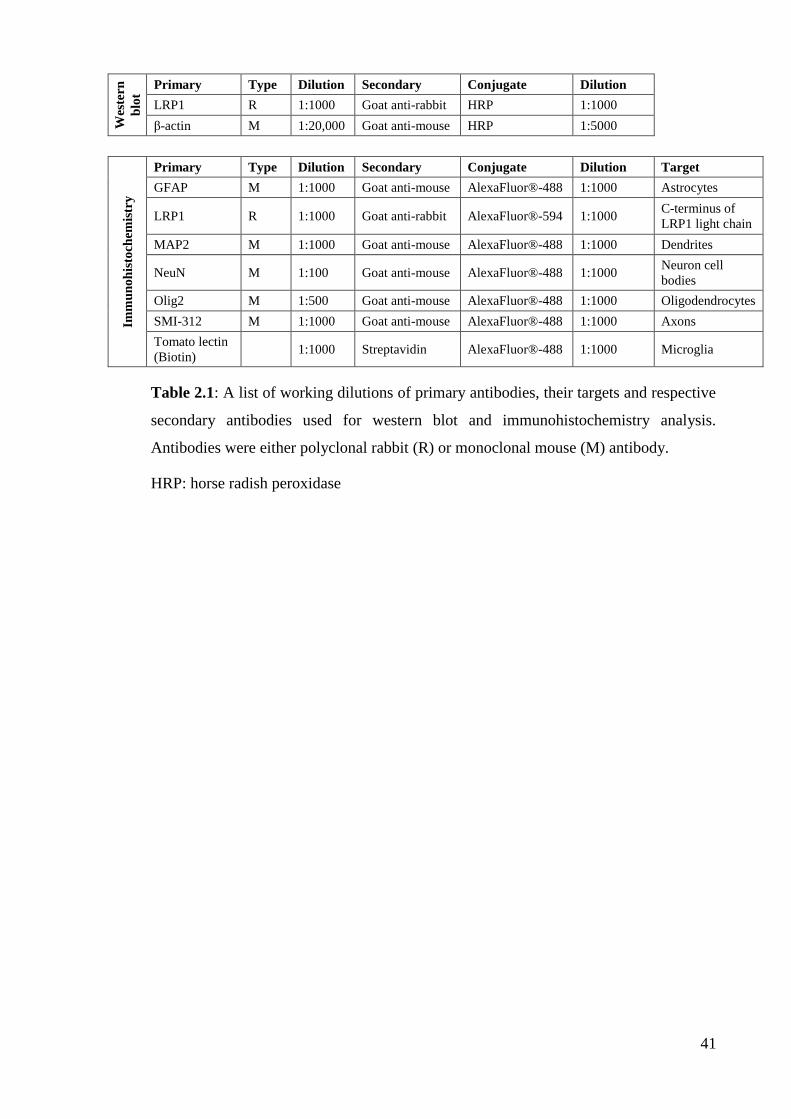
41
Wes
tern
blo
t
Primary Type Dilution Secondary Conjugate Dilution
LRP1 R 1:1000 Goat anti-rabbit HRP 1:1000
β-actin M 1:20,000 Goat anti-mouse HRP 1:5000
Imm
un
oh
isto
chem
istr
y
Primary Type Dilution Secondary Conjugate Dilution Target
GFAP M 1:1000 Goat anti-mouse AlexaFluor®-488 1:1000 Astrocytes
LRP1 R 1:1000 Goat anti-rabbit AlexaFluor®-594 1:1000 C-terminus of
LRP1 light chain
MAP2 M 1:1000 Goat anti-mouse AlexaFluor®-488 1:1000 Dendrites
NeuN M 1:100 Goat anti-mouse AlexaFluor®-488 1:1000 Neuron cell
bodies
Olig2 M 1:500 Goat anti-mouse AlexaFluor®-488 1:1000 Oligodendrocytes
SMI-312 M 1:1000 Goat anti-mouse AlexaFluor®-488 1:1000 Axons
Tomato lectin
(Biotin) 1:1000 Streptavidin AlexaFluor®-488 1:1000 Microglia
Table 2.1: A list of working dilutions of primary antibodies, their targets and respective
secondary antibodies used for western blot and immunohistochemistry analysis.
Antibodies were either polyclonal rabbit (R) or monoclonal mouse (M) antibody.
HRP: horse radish peroxidase
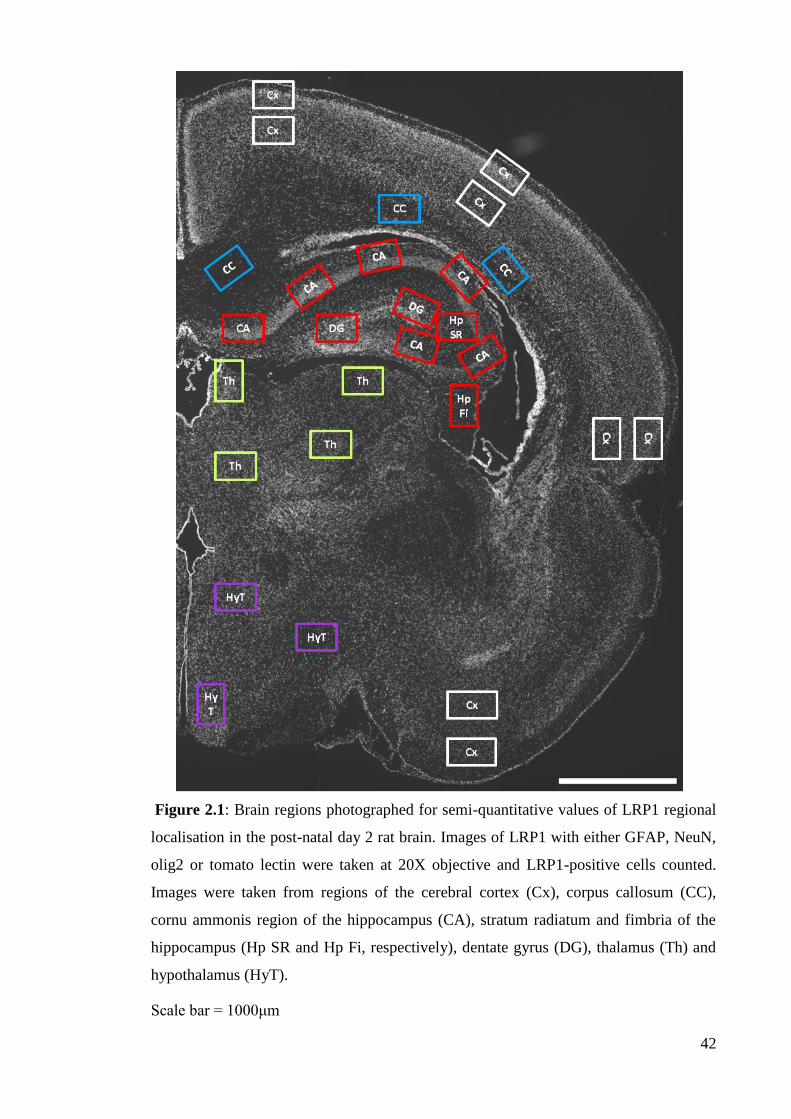
42
Figure 2.1: Brain regions photographed for semi-quantitative values of LRP1 regional
localisation in the post-natal day 2 rat brain. Images of LRP1 with either GFAP, NeuN,
olig2 or tomato lectin were taken at 20X objective and LRP1-positive cells counted.
Images were taken from regions of the cerebral cortex (Cx), corpus callosum (CC),
cornu ammonis region of the hippocampus (CA), stratum radiatum and fimbria of the
hippocampus (Hp SR and Hp Fi, respectively), dentate gyrus (DG), thalamus (Th) and
hypothalamus (HyT).
Scale bar = 1000μm
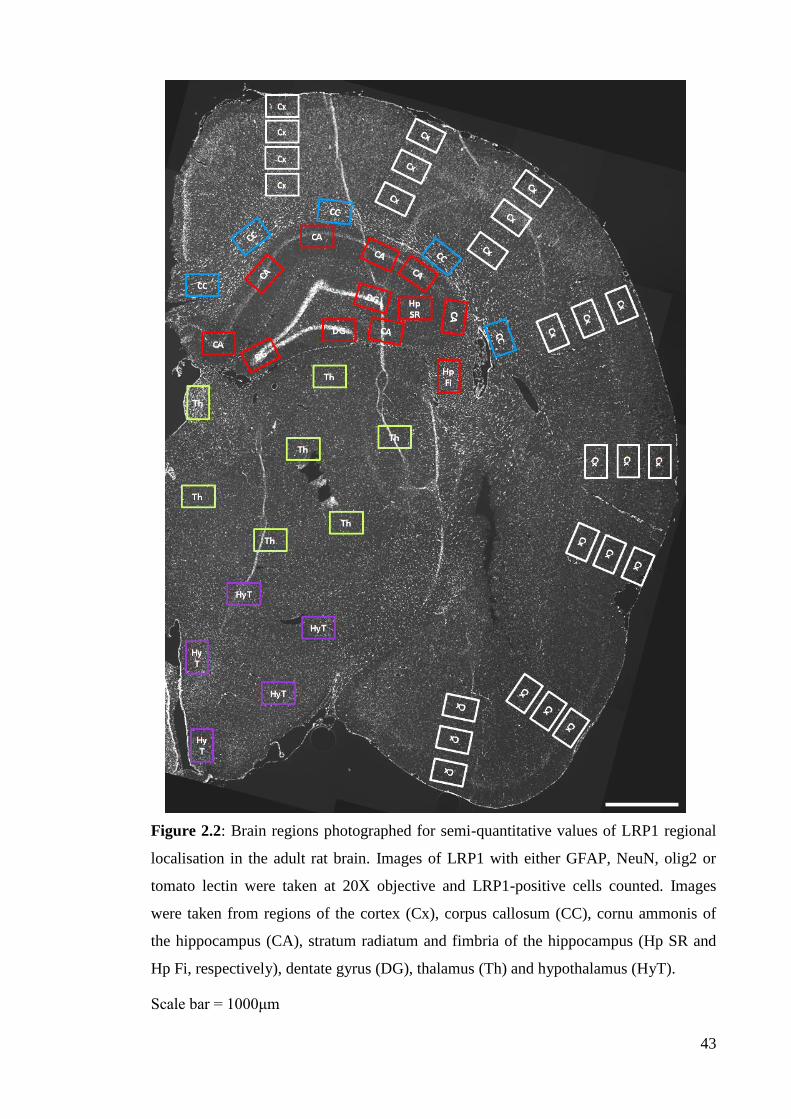
43
Figure 2.2: Brain regions photographed for semi-quantitative values of LRP1 regional
localisation in the adult rat brain. Images of LRP1 with either GFAP, NeuN, olig2 or
tomato lectin were taken at 20X objective and LRP1-positive cells counted. Images
were taken from regions of the cortex (Cx), corpus callosum (CC), cornu ammonis of
the hippocampus (CA), stratum radiatum and fimbria of the hippocampus (Hp SR and
Hp Fi, respectively), dentate gyrus (DG), thalamus (Th) and hypothalamus (HyT).
Scale bar = 1000μm
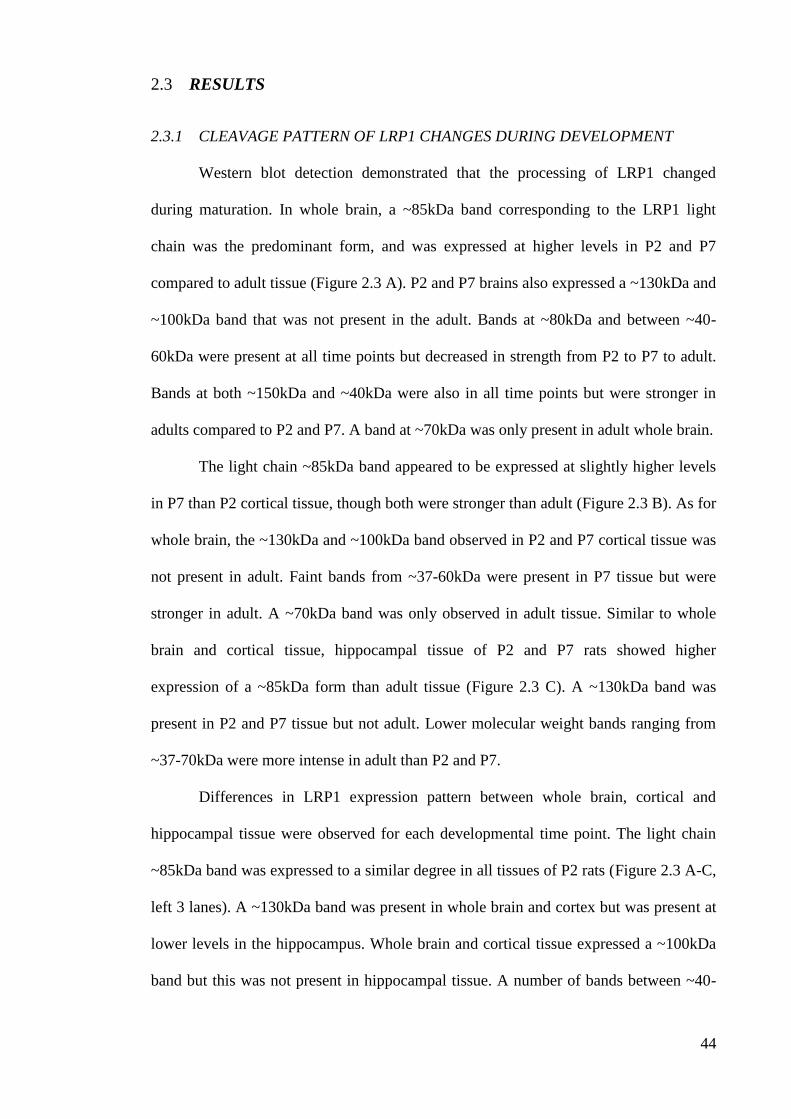
44
RESULTS 2.3
2.3.1 CLEAVAGE PATTERN OF LRP1 CHANGES DURING DEVELOPMENT
Western blot detection demonstrated that the processing of LRP1 changed
during maturation. In whole brain, a ~85kDa band corresponding to the LRP1 light
chain was the predominant form, and was expressed at higher levels in P2 and P7
compared to adult tissue (Figure 2.3 A). P2 and P7 brains also expressed a ~130kDa and
~100kDa band that was not present in the adult. Bands at ~80kDa and between ~40-
60kDa were present at all time points but decreased in strength from P2 to P7 to adult.
Bands at both ~150kDa and ~40kDa were also in all time points but were stronger in
adults compared to P2 and P7. A band at ~70kDa was only present in adult whole brain.
The light chain ~85kDa band appeared to be expressed at slightly higher levels
in P7 than P2 cortical tissue, though both were stronger than adult (Figure 2.3 B). As for
whole brain, the ~130kDa and ~100kDa band observed in P2 and P7 cortical tissue was
not present in adult. Faint bands from ~37-60kDa were present in P7 tissue but were
stronger in adult. A ~70kDa band was only observed in adult tissue. Similar to whole
brain and cortical tissue, hippocampal tissue of P2 and P7 rats showed higher
expression of a ~85kDa form than adult tissue (Figure 2.3 C). A ~130kDa band was
present in P2 and P7 tissue but not adult. Lower molecular weight bands ranging from
~37-70kDa were more intense in adult than P2 and P7.
Differences in LRP1 expression pattern between whole brain, cortical and
hippocampal tissue were observed for each developmental time point. The light chain
~85kDa band was expressed to a similar degree in all tissues of P2 rats (Figure 2.3 A-C,
left 3 lanes). A ~130kDa band was present in whole brain and cortex but was present at
lower levels in the hippocampus. Whole brain and cortical tissue expressed a ~100kDa
band but this was not present in hippocampal tissue. A number of bands between ~40-
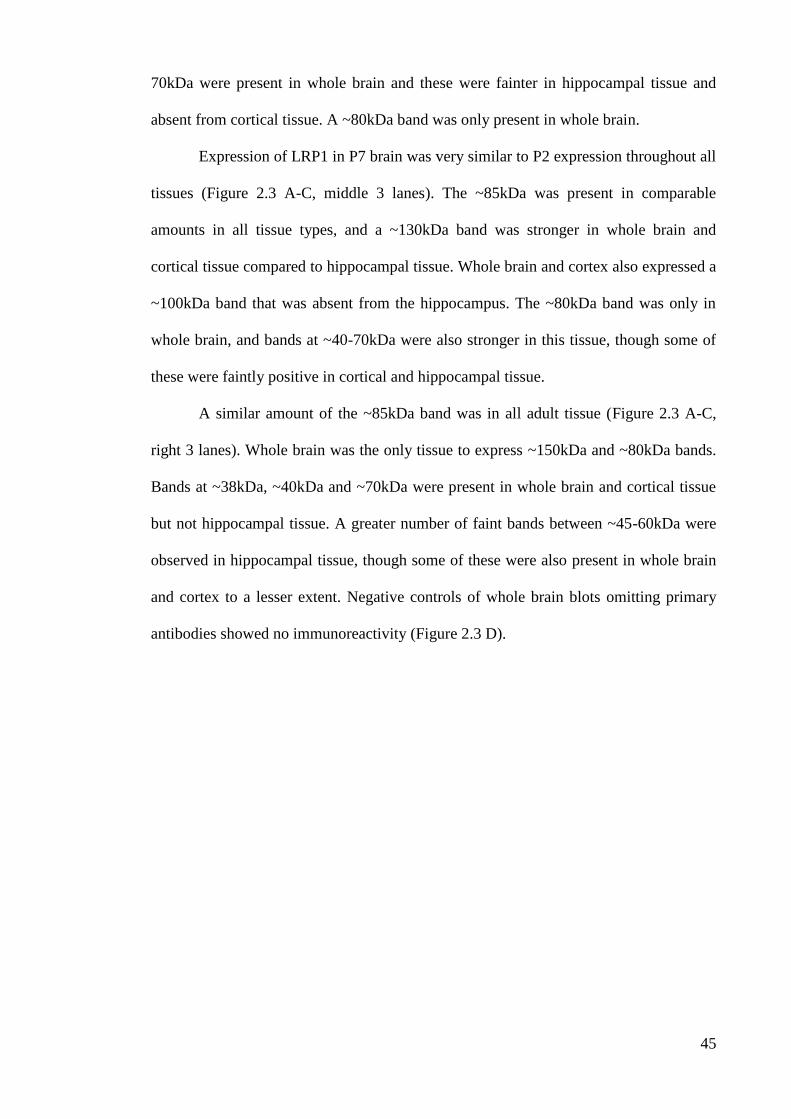
45
70kDa were present in whole brain and these were fainter in hippocampal tissue and
absent from cortical tissue. A ~80kDa band was only present in whole brain.
Expression of LRP1 in P7 brain was very similar to P2 expression throughout all
tissues (Figure 2.3 A-C, middle 3 lanes). The ~85kDa was present in comparable
amounts in all tissue types, and a ~130kDa band was stronger in whole brain and
cortical tissue compared to hippocampal tissue. Whole brain and cortex also expressed a
~100kDa band that was absent from the hippocampus. The ~80kDa band was only in
whole brain, and bands at ~40-70kDa were also stronger in this tissue, though some of
these were faintly positive in cortical and hippocampal tissue.
A similar amount of the ~85kDa band was in all adult tissue (Figure 2.3 A-C,
right 3 lanes). Whole brain was the only tissue to express ~150kDa and ~80kDa bands.
Bands at ~38kDa, ~40kDa and ~70kDa were present in whole brain and cortical tissue
but not hippocampal tissue. A greater number of faint bands between ~45-60kDa were
observed in hippocampal tissue, though some of these were also present in whole brain
and cortex to a lesser extent. Negative controls of whole brain blots omitting primary
antibodies showed no immunoreactivity (Figure 2.3 D).
46
Figure 2.3: LRP1 is expressed in post natal day 2 (P2), day 7 (P7) and adult rat
hippocampus. Whole brain (A), cortical (B) or hippocampal tissue (C) was collected
from 3 separate animals for either P2 (left 3 lanes), P7 (middle 3 lanes) or adult rats
(Ad; right 3 lanes). 20μg total protein for each sample was run on an SDS-PAGE gel
and probed with anti-LRP1 or anti-β-actin antibodies. Similar amounts of protein were
loaded for each sample (β-actin). Controls of whole brain blots omitting primary
antibodies were negative for non-specific secondary antibody binding (D). Molecular
weights of bands were determined using a commercial protein ladder (L).
47
2.3.2 LRP1 IS EXPRESSED IN NEURON AND GLIA CELL BODIES OF P2, P7 AND
ADULT RAT BRAINS
Immunohistochemistry showed that LRP1 expression was present on neurons,
astrocytes, oligodendrocytes and microglia of P2, P7 and adult rat brains. Punctate
immunoreactivity of LRP1 in P2 and P7 rat brains appeared to be both cellular and
extracellular throughout the cortex, hippocampus, thalamus, hypothalamus and corpus
callosum. LRP1 immunoreactivity in adult brain was punctate and cellular throughout
all regions of the brain.
LRP1 was expressed at all time points in a subpopulation of neuronal cell bodies
of the cerebral cortex (Figure 2.4 A, C, E) and pyramidal layer of the hippocampus
(Figure 2.4 B, D, F), as well as some neurons in the thalamus and hypothalamus (data
not shown). A small number of dendrites were LRP1-positive in the P2, but not P7
cerebral cortex brain (Figure 2.5 A, C). The proximal segments of adult apical dendrites
were LRP1-positive (Figure 2.5 E) while axons were negative for LRP1
immunoreactivity at all time points and in all brain regions including the cerebral cortex
and hippocampus (Figure 2.5 B, D, F).
Subpopulations of astrocytes, oligodendrocytes and microglia express LRP1 in
P2, P7 and adult rat brains. LRP1 was present in astrocyte cell bodies and foot processes
lining some blood vessels (Figure 2.6 A-C). Cell bodies and processes of
oligodendrocytes (Figure 2.7 A-C) and microglia were also LRP1-positive at all time
points (Figure 2.8A-C). LRP1 expressing microglia had a ramified appearance. The
receptor was expressed on some endothelial cells in P2 and P7 brains (Figure 2.8 A-B)
but not in adult brains. The choroid plexus, used as a positive LRP1 control, was
strongly LRP1 immunoreactive at all time points (Figure 2.9 A, C, E). Negative controls
omitting primary antibodies showed no immunoreactivity (Figure 2.9 B, D, F).
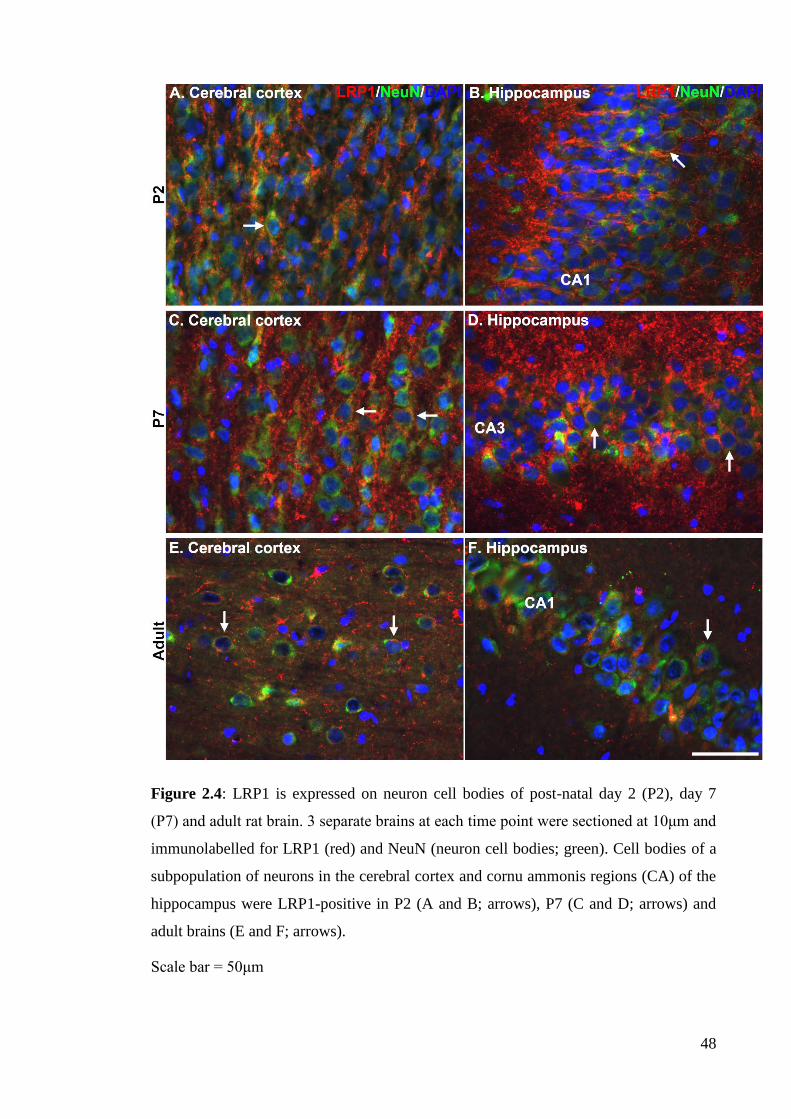
48
Figure 2.4: LRP1 is expressed on neuron cell bodies of post-natal day 2 (P2), day 7
(P7) and adult rat brain. 3 separate brains at each time point were sectioned at 10μm and
immunolabelled for LRP1 (red) and NeuN (neuron cell bodies; green). Cell bodies of a
subpopulation of neurons in the cerebral cortex and cornu ammonis regions (CA) of the
hippocampus were LRP1-positive in P2 (A and B; arrows), P7 (C and D; arrows) and
adult brains (E and F; arrows).
Scale bar = 50μm
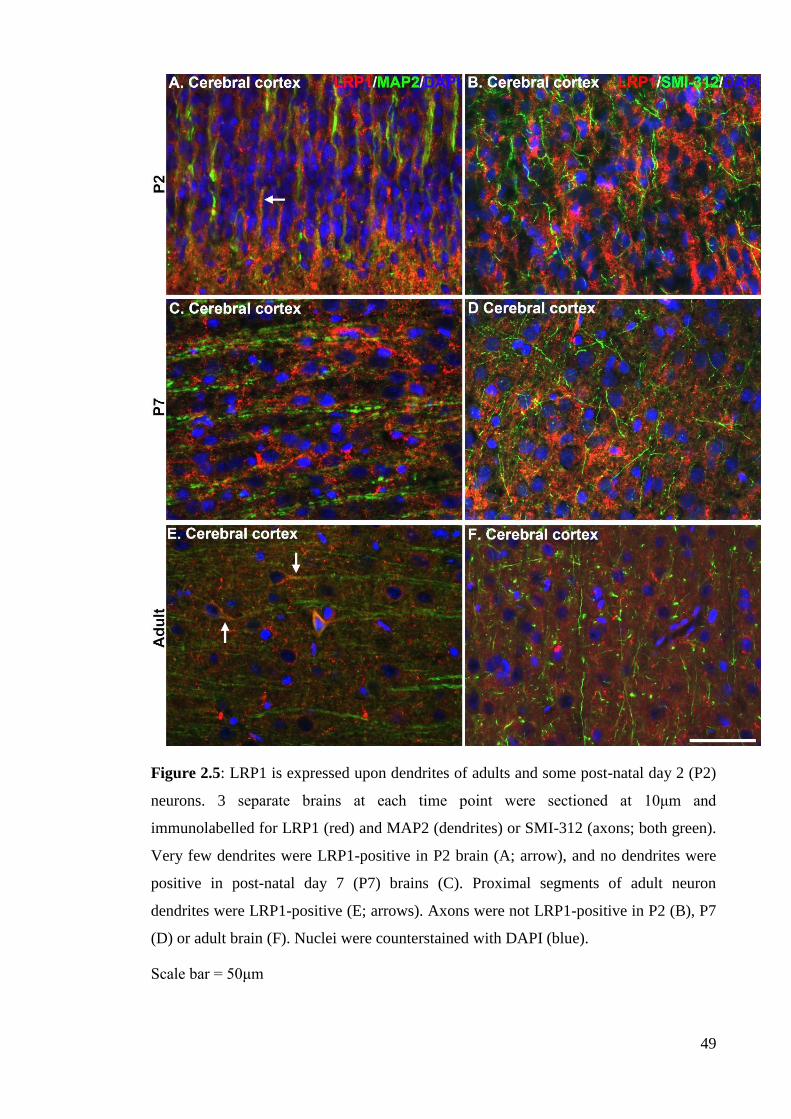
49
Figure 2.5: LRP1 is expressed upon dendrites of adults and some post-natal day 2 (P2)
neurons. 3 separate brains at each time point were sectioned at 10μm and
immunolabelled for LRP1 (red) and MAP2 (dendrites) or SMI-312 (axons; both green).
Very few dendrites were LRP1-positive in P2 brain (A; arrow), and no dendrites were
positive in post-natal day 7 (P7) brains (C). Proximal segments of adult neuron
dendrites were LRP1-positive (E; arrows). Axons were not LRP1-positive in P2 (B), P7
(D) or adult brain (F). Nuclei were counterstained with DAPI (blue).
Scale bar = 50μm
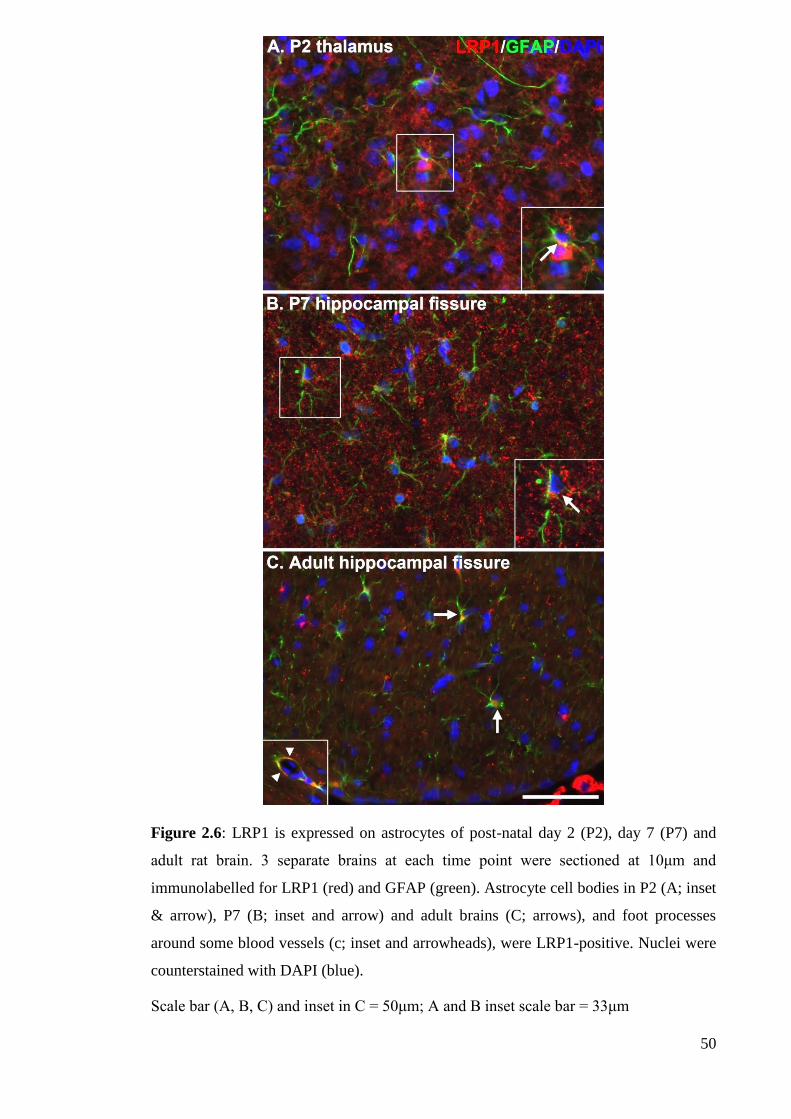
50
Figure 2.6: LRP1 is expressed on astrocytes of post-natal day 2 (P2), day 7 (P7) and
adult rat brain. 3 separate brains at each time point were sectioned at 10μm and
immunolabelled for LRP1 (red) and GFAP (green). Astrocyte cell bodies in P2 (A; inset
& arrow), P7 (B; inset and arrow) and adult brains (C; arrows), and foot processes
around some blood vessels (c; inset and arrowheads), were LRP1-positive. Nuclei were
counterstained with DAPI (blue).
Scale bar (A, B, C) and inset in C = 50μm; A and B inset scale bar = 33μm
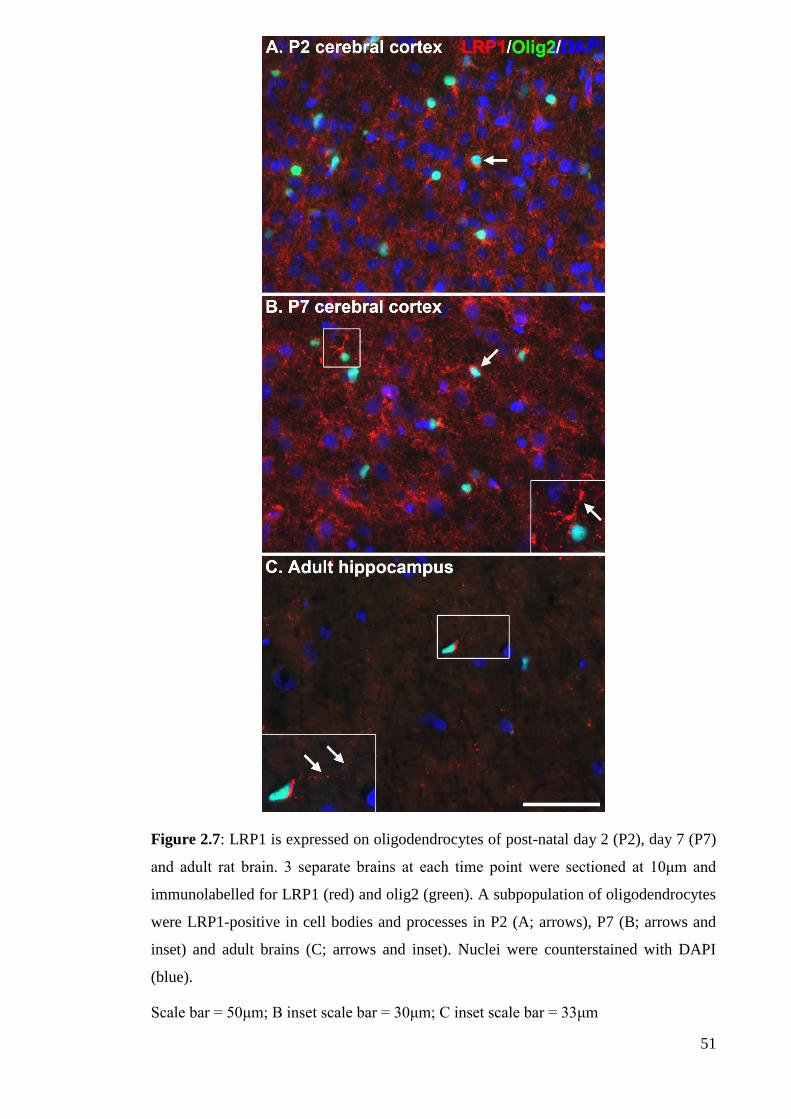
51
Figure 2.7: LRP1 is expressed on oligodendrocytes of post-natal day 2 (P2), day 7 (P7)
and adult rat brain. 3 separate brains at each time point were sectioned at 10μm and
immunolabelled for LRP1 (red) and olig2 (green). A subpopulation of oligodendrocytes
were LRP1-positive in cell bodies and processes in P2 (A; arrows), P7 (B; arrows and
inset) and adult brains (C; arrows and inset). Nuclei were counterstained with DAPI
(blue).
Scale bar = 50μm; B inset scale bar = 30μm; C inset scale bar = 33μm
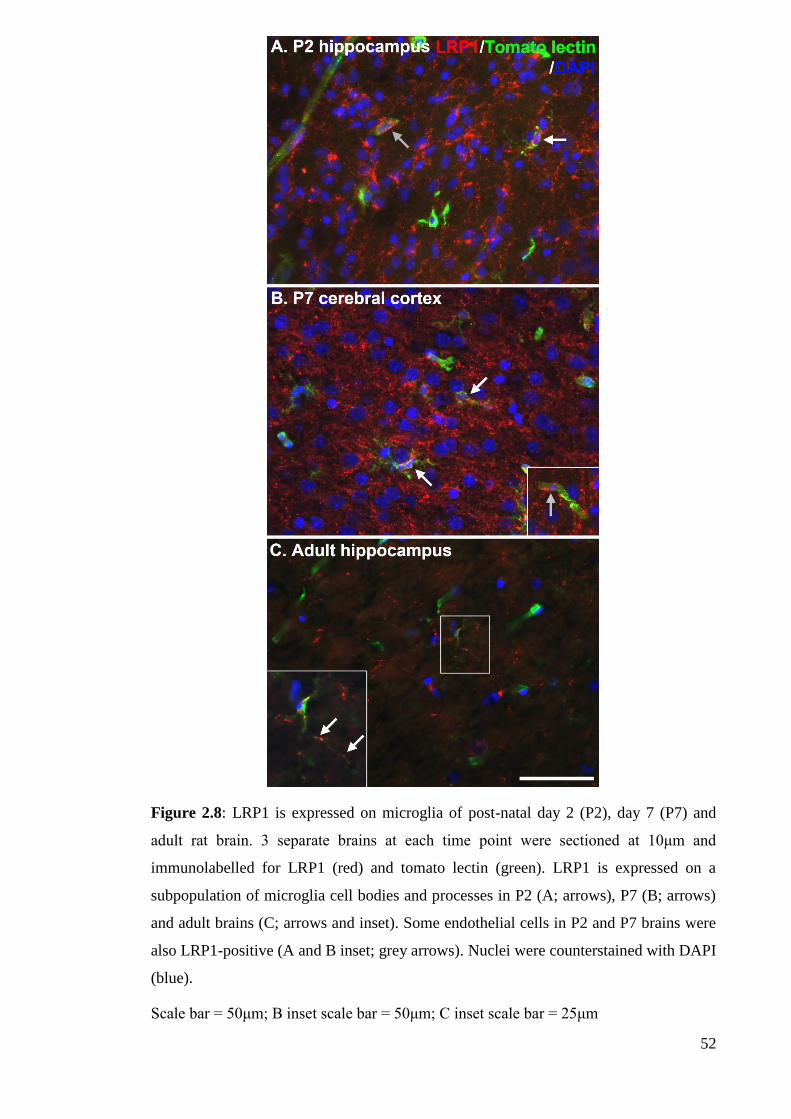
52
Figure 2.8: LRP1 is expressed on microglia of post-natal day 2 (P2), day 7 (P7) and
adult rat brain. 3 separate brains at each time point were sectioned at 10μm and
immunolabelled for LRP1 (red) and tomato lectin (green). LRP1 is expressed on a
subpopulation of microglia cell bodies and processes in P2 (A; arrows), P7 (B; arrows)
and adult brains (C; arrows and inset). Some endothelial cells in P2 and P7 brains were
also LRP1-positive (A and B inset; grey arrows). Nuclei were counterstained with DAPI
(blue).
Scale bar = 50μm; B inset scale bar = 50μm; C inset scale bar = 25μm
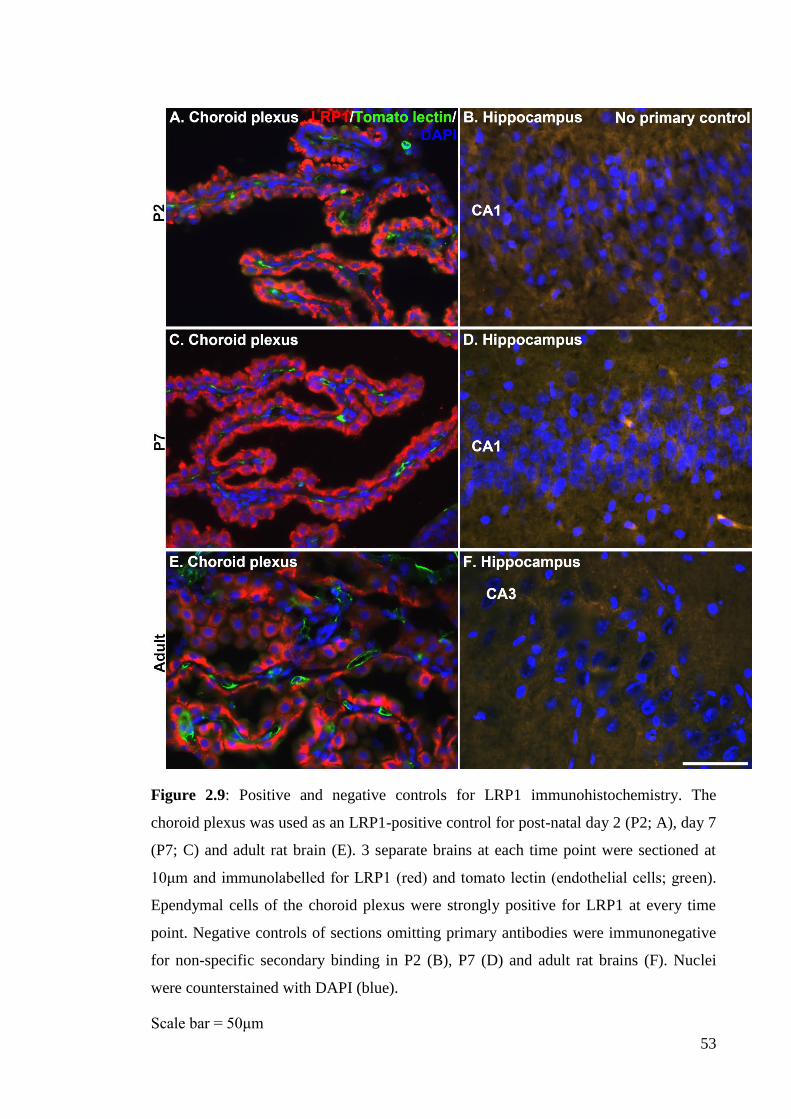
53
Figure 2.9: Positive and negative controls for LRP1 immunohistochemistry. The
choroid plexus was used as an LRP1-positive control for post-natal day 2 (P2; A), day 7
(P7; C) and adult rat brain (E). 3 separate brains at each time point were sectioned at
10μm and immunolabelled for LRP1 (red) and tomato lectin (endothelial cells; green).
Ependymal cells of the choroid plexus were strongly positive for LRP1 at every time
point. Negative controls of sections omitting primary antibodies were immunonegative
for non-specific secondary binding in P2 (B), P7 (D) and adult rat brains (F). Nuclei
were counterstained with DAPI (blue).
Scale bar = 50μm
54
2.3.3 LRP1-POSITIVE NEURONS AND GLIA ARE LOCATED THROUGHOUT THE
P2 AND ADULT RAT BRAIN
Semi-quantitative analysis of sections examined by immunohistochemistry
showed that LRP1 expressing cells were present at higher levels in P2 brains compared
to adults (Table 2.2; 38.9 ± 5.6 vs 22.3 ± 4.2 cells/mm2 respectively). The most
abundant LRP1-positive cells in P2 brains were neurons throughout grey matter, except
for the thalamus. The regions with the greatest number of LRP1-positive neurons were
the cortex and CA region of the hippocampus. Of these two areas, the CA region of the
hippocampus had about two and a half times as many positive neurons as the cortex
(273 ± 17 vs 105 ± 7 cells/mm2
respectively). In comparison, there were fewer positive
neurons in the dentate gyrus and hypothalamus, and the thalamus had the least number
of LRP1-positive neurons. Oligodendrocytes were the most abundant LRP1-positive
glia cells in white matter regions of the corpus callosum and hippocampal fimbria.
There were LRP1-positive oligodendrocytes throughout the grey matter, though to a
lesser extent. LRP1-positive astrocytes and microglia were located throughout both grey
and white matter regions of the brain.
LRP1-positive neurons of the adult rat brain were predominately located in the
CA region and dentate gyrus of the hippocampus. Similar numbers of LRP1 expressing
neurons were observed in the cortex and hypothalamus. The region with the least
number of LRP1-positive neurons was the thalamus. The white matter tracts of the
corpus callosum and hippocampal fimbria were the region’s most prolific in LRP1-
positive astrocytes and oligodendrocytes. As for P2 brains, microglia were the glial type
that displayed the least number of total LRP1-positive cells, and this was consistent
across all regions of the brain.
The number and regional location of LRP1-positive neurons, astrocytes and
oligodendrocytes changed from P2 to adult rat brains. There were more LRP1-positive
55
neurons in the cortex, thalamus and hypothalamus of the P2 brain compared to the adult
brain. There were almost twice as many positive neurons of the P2 CA region compared
to the adult (P2 = 273 ± 17 cell/mm2; adult = 162 ± 35 cell/mm
2). However, there were
more LRP1 expressing neurons in the adult dentate gyrus than the P2.
P2 rats had more LRP1-positive astrocytes in the dentate gyrus of the
hippocampus compared to the adult. However, there were more of these cells positive
for LRP1 in the adult CA regions and fimbria of the hippocampus, thalamus,
hypothalamus and corpus callosum compared to the P2 brain. Similar numbers of
LRP1-positive astrocytes were observed in the cerebral cortex. There were greater
numbers of LRP1 expressing astrocytes in the adult than P2 brain in all other regions,
except the dentate gyrus of the hippocampus where there were more in the P2 brain.
Similar numbers of LRP1-positive oligodendrocytes were observed in the grey matter of
P2 and adult rat brains. P2 rat brains had more LRP1-positive oligodendrocytes in white
matter regions of the corpus callosum and hippocampal fimbria than the adult. No
differences were observed in LRP1-positive microglia between P2 and adult brains
except for the hippocampal fimbria where there were slightly greater numbers of LRP1-
positive cells in the P2.
Overall there were more LRP1-positive cells in P2 rat brain compared to adult
rat brain. This was largely due to greater numbers of LRP1-positive neurons and
oligodendrocytes, and is consistent with western blot data that demonstrate greater
LRP1 immunoreactivity in P2 brains compared to adult brains.
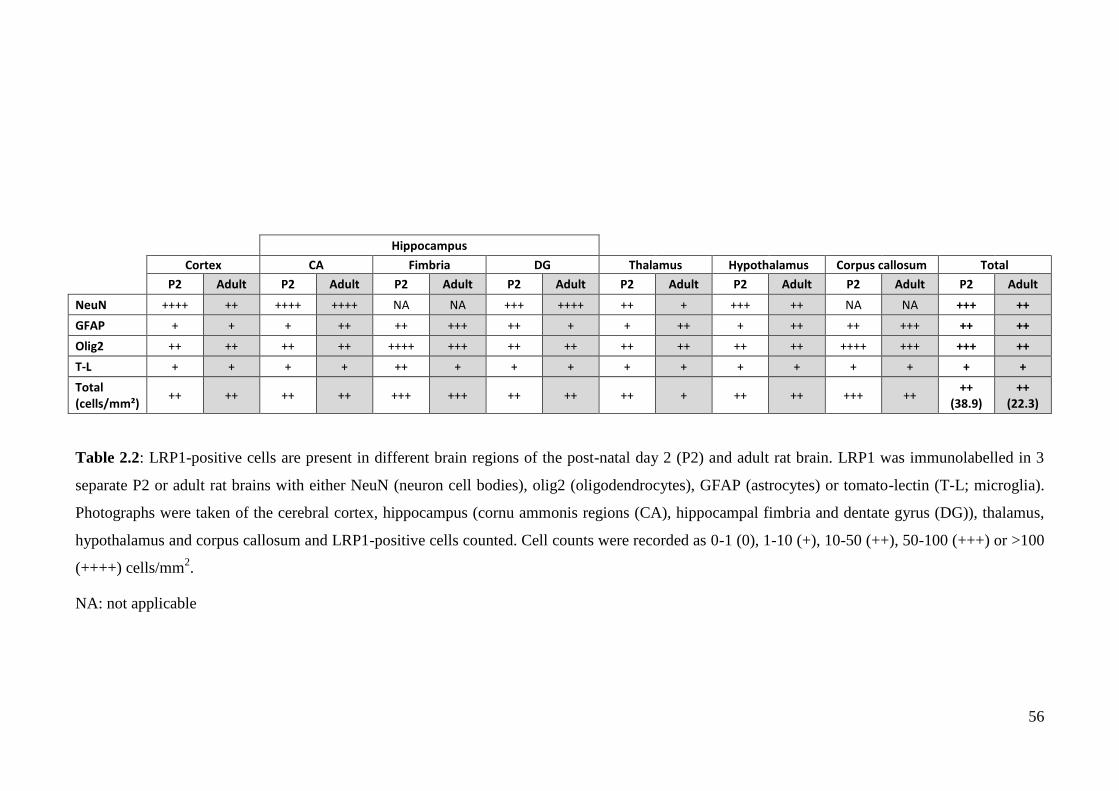
56
Table 2.2: LRP1-positive cells are present in different brain regions of the post-natal day 2 (P2) and adult rat brain. LRP1 was immunolabelled in 3
separate P2 or adult rat brains with either NeuN (neuron cell bodies), olig2 (oligodendrocytes), GFAP (astrocytes) or tomato-lectin (T-L; microglia).
Photographs were taken of the cerebral cortex, hippocampus (cornu ammonis regions (CA), hippocampal fimbria and dentate gyrus (DG)), thalamus,
hypothalamus and corpus callosum and LRP1-positive cells counted. Cell counts were recorded as 0-1 (0), 1-10 (+), 10-50 (++), 50-100 (+++) or >100
(++++) cells/mm2.
NA: not applicable
Hippocampus
Cortex CA Fimbria DG Thalamus Hypothalamus Corpus callosum Total
P2 Adult P2 Adult P2 Adult P2 Adult P2 Adult P2 Adult P2 Adult P2 Adult
NeuN ++++ ++ ++++ ++++ NA NA +++ ++++ ++ + +++ ++ NA NA +++ ++
GFAP + + + ++ ++ +++ ++ + + ++ + ++ ++ +++ ++ ++
Olig2 ++ ++ ++ ++ ++++ +++ ++ ++ ++ ++ ++ ++ ++++ +++ +++ ++
T-L + + + + ++ + + + + + + + + + + +
Total (cells/mm²)
++ ++ ++ ++ +++ +++ ++ ++ ++ + ++ ++ +++ ++ ++
(38.9) ++
(22.3)
57
DISCUSSION 2.4
Western blot and immunohistochemical analysis have demonstrated that LRP1
is expressed in the brain of P2, P7 and adult rats. The expression pattern of the receptor
changes during maturation and is predominately located on cell bodies of a
subpopulation of neurons, astrocytes and oligodendrocytes throughout the cortex,
hippocampus, hypothalamus, thalamus and corpus callosum. A small subset of
microglia were also LRP1-positive.
2.4.1 THE CLEAVAGE PATTERN OF LRP1 CHANGES DURING MATURATION
OF THE RAT BRAIN
A number of bands ranging from ~37kDa to ~150kDa were observed
throughout whole brain, cortical and hippocampal tissue of P2, P7 and adult rat brain.
The antibody used for these experiments binds C-terminal end of the intracellular
domain of the LRP1 light chain. The LRP1 light chain undergoes a number of post-
translational modifications, including cleavage by β- and γ-secretase (May et al., 2002,
von Arnim et al., 2005), phosphorylation of NPxY intracellular domains (Barnes et al.,
2001, Guttman et al., 2009) and glycosylation of the light chain (Quinn et al., 1999,
May et al., 2003) (Figure 2.10). These modifications allow for the tight regulation of
LRP1 function.
Bands of a molecular weight larger than the ~85kDa light chain were observed
at 100kDa and 130kDa of P2 and P7 brains, and at 150kDa of adult brain. These forms
of LRP1 most likely correspond to glycosylated or phosphorylated forms of this
domain. Wolf and colleagues (1992) observed a 130kDa band in western blots of
human cerebral cortex using antibodies targeting both the heavy and light chain of
LRP1. They hypothesised that this corresponded to digestion products of the LRP1
heavy chain. However, as the antibody used in the present experiments labels the C-
58
terminal of the light chain, the product observed here is unlikely to be a heavy chain
product.
The main band detected for all time points in whole brain, cortical and
hippocampal tissue was at ~85kDa. This corresponded to the light chain, which is
normally non-covalently linked to the heavy chain of LRP1. It is likely that the non-
covalently bound heavy and light chains of the LRP1 receptor dissociate during
reduction in preparation for western blot analysis. Previous studies have demonstrated
the detection of similar molecular weight bands (Herz et al., 1990, Wolf et al., 1992,
Ambjørn et al., 2008).
Bands of a lower molecular weight than the ~85kDa light chain most likely
correspond to cleaved forms of the light chain. These bands ranged from 30kDa to
80kDa in P2, P7 and adult tissues. The extracellular segment of the LRP1 light chain
can be cleaved by β-secretase to produce a ~30kDa product (von Arnim et al., 2005). It
is possible that the ~37 to ~80kDa bands observed correspond to the cleaved fraction of
the LRP1 light chain that has been glycosylated or phosphorylated. Previous data
demonstrate alterations in light chain LRP1 band sizes between ~50kDa to ~80kDa due
to glycosylation (Quinn et al., 1999, Ambjørn et al., 2008). Therefore, the different
sized bands observed here could correspond to different stages of LRP1 post-
translational modifications.
There was greater expression of the ~85kDa light chain band in P2 and P7 brains
compared to adult in whole brain, cortical and hippocampal tissue. This demonstrates
that overall expression of LRP1 is greater in the younger brain, consistent with findings
from previous studies (Moestrup et al., 1992, Ishiguro et al., 1995). ~100kDa and
~130kDa bands observed in P2 and P7 whole brain and cortical tissue were not
observed in any adult tissue, suggesting that these LRP1 forms have a developmental
role. Adult cortical and hippocampal tissue showed a number of lower molecular weight
59
bands between ~37-70kDa that were absent or faint in P2 and P7 samples. These
fractions, therefore, may have a role in the mature brain but not in the developing brain.
These findings demonstrate that the post-translational regulation of LRP1 changes from
the developing to mature brain.
Hippocampal tissue in P2 and P7 brain did not express the ~100kDa band and
only faintly expressed the ~130kDa observed in whole brain and cortical tissue. This
suggests that higher molecular weight forms do not have as an important role in
development of this region of the brain. However, hippocampal tissue did express a
number of lower molecular weight bands that were absent from the cortex in P2 brain,
and reduced in P7. This demonstrates that the cleavage and maturation of LRP1 is
regionally specific during the first week of post-natal development.
Adult whole brain expressed a ~150kDa band that was not observed in cortical
or hippocampal tissues, suggesting that this form of LRP1 is expressed in a brain region
other than these. A ~70kDa band observed in whole brain and cortical tissue was not
present in hippocampal tissue. There were also stronger bands at ~37kDa and ~40kDa
in cortical tissue than hippocampal, but the latter tissue expressed more lower weighted
bands between ~40-70kDa. These data provide evidence that post-translational
modifications and regulation of LRP1 in cortical tissue differ from that of hippocampal
tissue in adult tissue.
The identity of each LRP1-positive band in whole brain, cortical and
hippocampal rat tissue is currently unknown. However, these findings demonstrate that
post-translational modifications of LRP1 differ between rat brain regions and stages of
maturity. This suggests that regulation, and therefore function, of LRP1 is dependent on
the tissue in which it is expressed and its stage of development.
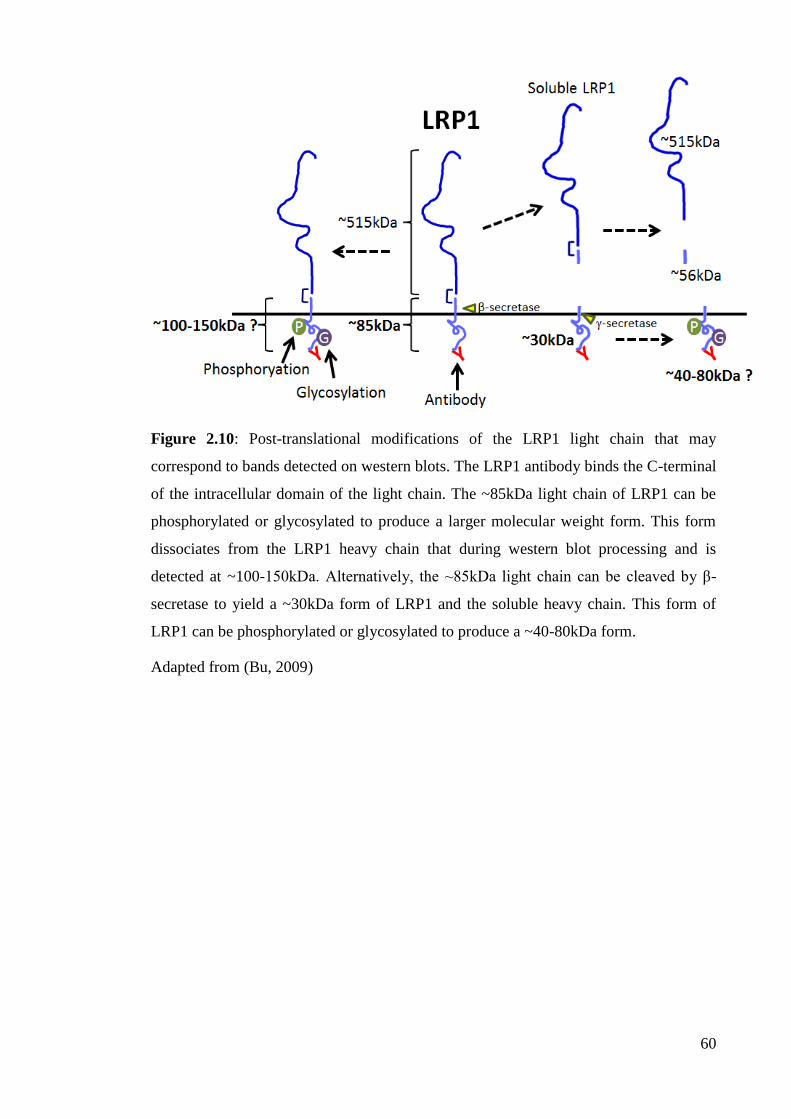
60
Figure 2.10: Post-translational modifications of the LRP1 light chain that may
correspond to bands detected on western blots. The LRP1 antibody binds the C-terminal
of the intracellular domain of the light chain. The ~85kDa light chain of LRP1 can be
phosphorylated or glycosylated to produce a larger molecular weight form. This form
dissociates from the LRP1 heavy chain that during western blot processing and is
detected at ~100-150kDa. Alternatively, the ~85kDa light chain can be cleaved by β-
secretase to yield a ~30kDa form of LRP1 and the soluble heavy chain. This form of
LRP1 can be phosphorylated or glycosylated to produce a ~40-80kDa form.
Adapted from (Bu, 2009)
61
2.4.2 LRP1 IS EXPRESSED IN CELL BODIES AND PROCESSES OF NEURONS
AND GLIA
Immunoreactivity of LRP1 appeared more widespread in P2 and P7 rat brains
compared to adult brain, supporting western blot data. Immunohistochemical analysis
demonstrated that LRP1 is localised to cell bodies of a subset of P2 and P7 neurons, and
cell bodies and proximal segments of apical dendrites of adult neurons. The receptor
was also expressed in the cell bodies of a subset of astrocytes, and cell bodies and
processes of a subset of oligodendrocytes and microglia. There appeared to be
extracellular, punctate staining of LRP1 throughout all regions of the P2 and P7 but not
in the adult brain. The antibody used in these experiments targets the intracellular
domain of the receptor, so this LRP1 product cannot be soluble LRP1 as this fragment
is only composed of the extracellular domain (von Arnim et al., 2005). It is currently
unclear what this apparent extracellular staining seen in the work shown here is, though
this pattern of staining has been noted before in human foetal tissue (Moestrup et al.,
1992) and suggests a role for this LRP1 fragment in development.
The choroid plexus was consistently abundant in LRP1 between pups and adults
and corresponded to expression patterns previously reported (Zheng et al., 1994).
Interestingly, LRP1 immunoreactivity has been found to be absent in the choroid plexus
of human brain (Wolf et al., 1992, Lopes et al., 1994). Whether these discrepancies are
due to species or technical differences is currently unknown.
2.4.2.1 LRP1 expression in neurons
LRP1 regulates the survival and signaling of healthy neurons in vitro (Bacskai et
al., 2000, Qiu et al., 2002, Hayashi et al., 2007, Martin et al., 2008, Fuentealba et al.,
2009, Sen et al., 2012). Though LRP1 was not expressed in axons and therefore is
unlikely to be involved in pre-synaptic activity, it was present at the proximal segment
62
of apical dendrites. This site possesses specific synaptic characteristics that LRP1 may
have a role in. Mossy fibres of the dentate gyrus synapse at the proximal end of apical
dendrites on CA3 pyramidal neurons of the hippocampus (Blackstad et al., 1970, Henze
et al., 1996). In addition, synapses on proximal apical dendrites can amplify excitatory
post-synaptic potentials initiated in distal segments of prefrontal cortical neurons
(Seamans et al., 1997). Calcium accumulation also varies between proximal and distal
segments of apical dendrites suggesting different roles at these sites (Yuste et al., 1994).
LRP1 is able to associate with synaptic proteins including PSD-95 and NMDA receptor,
and affects neurotransmitter mediated calcium influx (Gotthardt et al., 2000, May et al.,
2004, Martin et al., 2008, Hayashi et al., 2012). Therefore, LRP1 may have a role in
regulation of synaptic activity at proximal segments of apical dendrites, and therefore
the signaling potential of LRP1 expressing neurons in the adult brain.
Numbers of LRP1 expressing neurons decreased from P2 to adult in the CA
region of the hippocampus, cerebral cortex, thalamus and hypothalamus, suggesting that
there may be a role of LRP1 in the development of neurons in these regions. Following
synaptogenesis, which occurs embryonically and post-natally, a large proportion of
neurons undergo apoptosis to refine neuronal networks (Huttenlocher, 1979, Blaschke
et al., 1996). However, many neurons need to remain alive and functional and this
process can be regulated by neurotrophins (reviewed by (Yuan and Yankner, 2000)).
LRP1 can interact with neurotrophin receptors (Shi et al., 2009) and activate the same
intracellular pathways as neurotrophins to promote neuronal survival (Fuentealba et al.,
2009). The role of LRP1 in developing neurons may be in the regulation of their
apoptosis during this critical stage.
LRP1-positive neurons of the adult brain were found predominately in the CA
regions and dentate gyrus of the hippocampus. There were more LRP1-positive neurons
in the adult dentate gyrus of the hippocampus compared to the P2 brain. This suggests
63
that LRP1 has a function specific to mature hippocampal neurons. The hippocampus is
a region of the brain involved primarily in learning and memory (Scoville and Milner,
1957). Significant memory impairments and hippocampal neuron loss occur following
events such as ischaemia and Alzheimer’s disease, suggesting that it is a region of the
brain that is particularly vulnerable to injury and disease (Zola-Morgan et al., 1986,
Kesslak et al., 1991, Wood et al., 1993, Laakso et al., 1995). Different regions of the
hippocampus also display specific vulnerabilities. For example, granule cells of the
dentate gyrus undergo degeneration following removal of the adrenal glands and
corticosterone, though neurons of the CA regions of the hippocampus are unaffected
(Sloviter et al., 1989). In comparison, ischaemia causes significant loss of CA1 neurons
but the CA3 region and dentate gyrus are unaffected (Zola-Morgan et al., 1986). LRP1
may be expressed in specific neuron populations to protect them from apoptosis. LRP1
knock-down both in vivo and in vitro increases the vulnerability of cortical and
hippocampal neurons to apoptosis. Knock-out of LRP1 in mouse forebrain neurons
causes neurodegeneration of the cerebral cortex and hippocampus in a manner similar to
Alzheimer’s disease (Liu et al., 2010). Hippocampal and cortical neurons in vitro also
undergo increased apoptosis during trophic withdrawal and amyloid-β toxicity when
LRP1 is knocked-down (Fuentealba et al., 2009). These studies support the idea that
LRP1 could protect neurons from apoptosis. This may be particularly important in a
region such as the hippocampus that appears already vulnerable to injury and disease.
2.4.2.2 LRP1 expression in oligodendrocytes
The majority of LRP1-positive oligodendrocytes were located in white matter of
P2 and adult rat brain, though some cells were located throughout grey matter. LRP1
mRNA has been identified in rat brain cells likely to be oligodendrocytes (Ishiguro et
al., 1995, Saher et al., 2005) but expression of the LRP1 protein has not been
definitively identified in these cells previously. In vitro work has demonstrated greater
64
LRP1 mRNA and protein expression in oligodendrocytes than both astrocytes and
microglia (Gaultier et al., 2009). Interestingly, studies in human tissue have reported the
absence of LRP1 immunoreactivity in oligodendrocytes of human brain (Moestrup et
al., 1992, Wolf et al., 1992, Lopes et al., 1994). These disparities may be due to species
or technical differences.
LRP1 was expressed in a subset of oligodendrocytes and establishing what
maturity these cells are could aid in determining whether the receptor is involved in the
myelination process. Olig2 is a transcription factor expressed by oligodendrocytes
throughout maturity (Zhou et al., 2000). Oligodendrocytes mature over a number of
steps that can be identified by specific antigenic phenotypes. Oligodendrocyte precursor
cells differentiate to progenitor cells, pre-oligodendrocytes, immature non-myelinating
oligodendrocytes, mature non-myelinating oligodendrocytes and finally to mature
myelinating oligodendrocytes (reviewed by (Baumann and Pham-Dinh, 2001)). By
using specific markers for different stages of oligodendrocyte maturity it would be
possible to identify whether LRP1 expression is specific to one or more of these stages
of maturity. As oligodendrocytes mature, their capability to proliferate and migrate
decreases while their ability to myelinate increases (Miller et al., 1985). Silencing of the
LRP1 gene in Schwann cells inhibits migration of these cells (Mantuano et al., 2010).
Therefore, there is a possibility that if expressed in precursor oligodendrocyte cells,
LRP1 could regulate migration of these cells in the CNS. It may also support
oligodendrocyte survival. LRP1 silencing in Schwann cells increases their susceptibility
to TNF-α and serum deprivation induced apoptosis, suggesting a role for the receptor in
pro-survival mechanisms in these cells (Campana et al., 2006). In vivo, Schwann cell
death following sciatic nerve crush injury is increased from <3% for wild type mice to
over 35% when LRP1 is knocked out of these cells (Orita et al., 2013). It is possible that
65
LRP1 expression in both the developing and adult brain may be involved in maintaining
oligodendrocyte health.
There were more LRP1-positive oligodendrocytes in P2 brain than adult brain.
Myelination of the central nervous system begins foetally in the spinal cord but extends
through to the frontal cortex during the first week following birth (Bjelke and Seiger,
1989, Bjartmar et al., 1994, Hamano et al., 1996). One major component of myelin is
cholesterol (Saher et al., 2005) which can bind to and be endocytosed by LRP1
(Handelmann et al., 1992). Though the bulk of cholesterol used in myelin is synthesised
by oligodendrocytes, it can also be transferred to these cells from other CNS cell types
when cholesterol is depleted (Saher et al., 2005). Oligodendrocytes of the developing
brain may require LRP1 for myelin production during this stage if cholesterol is low.
LRP1 also regulates phagocytosis of myelin vesicles, as a model of degraded myelin, in
oligodendrocytes in vitro (Gaultier et al., 2009). In addition, LRP1 may be involved in
direct myelination of axons. Myelin thickness around axons of the sciatic nerve in LRP1
knockout in mice is significantly reduced when compared to wild type mice. Sciatic
nerve crush injury in knockout mice also demonstrate accelerated myelin sheath
degeneration and decreased re-myelination (Orita et al., 2013). Therefore, the receptor
may have a role in clearance of myelin in injury and replacement of it through
cholesterol uptake.
2.4.2.3 LRP1 expression in astrocytes
Expression of LRP1 was evident in a subpopulation of astrocytes in both pup
and adult rat brain. The presence of morphologically and regionally distinct astrocyte
subpopulations has been recognised for over a century. Protoplasmic astrocytes are
branched in morphology and located primarily in grey matter, whereas fibrous
astrocytes have long processes and are located in white matter (Ramon and Cajal,
1909). These two population of astrocytes not only vary in morphology and regional
66
location, but also in protein expression and developmental history (Miller and Raff,
1984). The greatest number of LRP1-positive astrocytes were in the corpus callosum
and hippocampal fimbria of both P2 and adult rats. This suggests that the LRP1 may be
expressed primarily on fibrous astrocytes in both the developing and mature brain.
There were more LRP1-positive astrocytes in white matter of the adult compared to P2
brain, suggesting that there is a greater role for LRP1 in astrocytes of the mature brain
in these regions. Astrocytes in grey matter also expressed LRP1, suggesting that the
receptor may have a function in a subpopulation of protoplasmic astrocytes. Recent
microarray studies have begun to reveal that there is even greater astrocyte
heterogeneity that is region specific, but studies into functional and phenotypic
differences between these subpopulations are limited (Bachoo et al., 2004, Sofroniew
and Vinters, 2010). Further investigation is required to determine whether LRP1 is
expressed on a specific subpopulation of astrocytes.
Astrocytes have a complex range of roles in the healthy brain in addition to
providing structural and metabolic support to neurons (Haines, 2002). These glia are not
only essential for the correct formation and functioning of neuron synapses (Ullian et
al., 2001) but also regulate subsequent activity at these sites. Upon calcium stimulation,
astrocytes release neurotransmitters such as glutamate to promote neuron transmission
(Parpura et al., 1994). LRP1 can regulate calcium signaling (Bacskai et al., 2000, Martin
et al., 2008, Hayashi et al., 2012) and through similar mechanisms could have a role in
astrocyte neurotransmitter release.
2.4.2.4 LRP1 expression in microglia
Microglia expression of LRP1 has not been noted in rodent brains previously but
these cells have been reported as being negative for LRP1 in human brain (Wolf et al.,
1992). However, rat microglia are LRP1-positive in vitro (Marzolo et al., 2000, Gaultier
et al., 2009). Though LRP1 immunoreactivity was present at both the cell body and
67
some processes of ramified microglia, only a small subset of these cells was positive for
the receptor and there did not appear to be regional specificity. The identification of
microglia in the brain can be difficult due to their scattered distribution and relatively
low population in the brain compared to other glia (Lawson et al., 1990, Marzolo et al.,
2000). Therefore, it may be that previous reports have overlooked this co-localisation
due to the difficultly in identifying the small proportion of cells positive for LRP1.
While the majority of microglia appear quiescent in healthy brain they actually
have an active role in maintaining normal brain function and homeostasis. Ramified
microglia processes are surprisingly dynamic and continually survey the brain’s
microenvironment to clear accumulations of metabolic products and degraded tissue
(Nimmerjahn et al., 2005). However, these cells also have an important role in immune
responses in the brain (reviewed by (Kreutzberg, 1996)). LRP1 may have a role in the
detection of necrotic cells in infection or injury and the subsequent immune response
regulated by microglia.
Upon necrotic cell death, heat shock proteins are released and associate with cell
derived antigens before binding to antigen presenting cells such as macrophages to
induce cytokine release and antigen presentation to T-cells (Basu et al., 2000). This
process has been found to be mediated by LRP1. Peritoneal macrophages and bone
marrow-derived dendritic cells present antigen bound heat shock protein gp-90 to T-
cells. These effects were inhibited with antibodies against LRP1 (Basu et al., 2001). In
addition, α2-macroglobulin complexes with antigens such as parasite derived
proteinases enhance macrophage antigen uptake and presentation to T-cells through
LRP1 (Morrot et al., 1997). Macrophages incubated with an α2-macroglobulin-
lysozyme complex require 200-250 times less lipopolysaccharide for effective antigen
presentation to T-cells (Chu and Pizzo, 1993). Furthermore, LRP1 can mediate
phagocytosis of apoptotic cells in both human monocyte-derived macrophages and
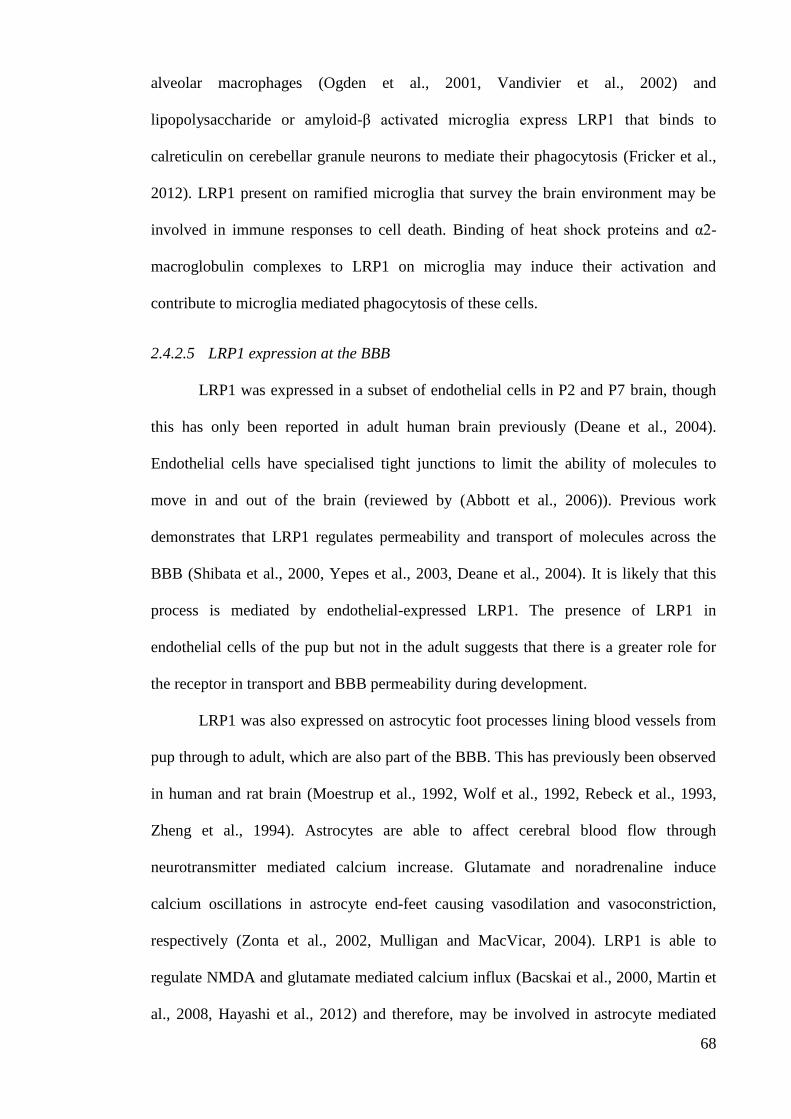
68
alveolar macrophages (Ogden et al., 2001, Vandivier et al., 2002) and
lipopolysaccharide or amyloid-β activated microglia express LRP1 that binds to
calreticulin on cerebellar granule neurons to mediate their phagocytosis (Fricker et al.,
2012). LRP1 present on ramified microglia that survey the brain environment may be
involved in immune responses to cell death. Binding of heat shock proteins and α2-
macroglobulin complexes to LRP1 on microglia may induce their activation and
contribute to microglia mediated phagocytosis of these cells.
2.4.2.5 LRP1 expression at the BBB
LRP1 was expressed in a subset of endothelial cells in P2 and P7 brain, though
this has only been reported in adult human brain previously (Deane et al., 2004).
Endothelial cells have specialised tight junctions to limit the ability of molecules to
move in and out of the brain (reviewed by (Abbott et al., 2006)). Previous work
demonstrates that LRP1 regulates permeability and transport of molecules across the
BBB (Shibata et al., 2000, Yepes et al., 2003, Deane et al., 2004). It is likely that this
process is mediated by endothelial-expressed LRP1. The presence of LRP1 in
endothelial cells of the pup but not in the adult suggests that there is a greater role for
the receptor in transport and BBB permeability during development.
LRP1 was also expressed on astrocytic foot processes lining blood vessels from
pup through to adult, which are also part of the BBB. This has previously been observed
in human and rat brain (Moestrup et al., 1992, Wolf et al., 1992, Rebeck et al., 1993,
Zheng et al., 1994). Astrocytes are able to affect cerebral blood flow through
neurotransmitter mediated calcium increase. Glutamate and noradrenaline induce
calcium oscillations in astrocyte end-feet causing vasodilation and vasoconstriction,
respectively (Zonta et al., 2002, Mulligan and MacVicar, 2004). LRP1 is able to
regulate NMDA and glutamate mediated calcium influx (Bacskai et al., 2000, Martin et
al., 2008, Hayashi et al., 2012) and therefore, may be involved in astrocyte mediated

69
vascular flow in the brain. By regulating BBB permeability and cerebral blood flow
LRP1 may have an important role in the maintaining the microenvironment of the brain.
70
CONCLUSIONS 2.5
LRP1 is able to regulate survival and function of a range of neuron and glial
subtypes in vitro and its expression upon neurons and glia in the rat brain suggests that
it regulates the function of these cells in vivo. Post-translational modifications aid in
regulating the function of LRP1 and appear to change during maturation and between
rat brain regions suggesting that the receptors function changes from development to
maturity.
LRP1 expression was present on neuronal cell bodies of P2, P7 and adult rats
where it may be involved in regulating survival through both development and maturity.
The presence of the receptor on apical proximal dendrites of adult rat neurons suggests
it may also be involved in neuronal signaling. Expression upon oligodendrocyte cell
bodies and processes indicate a role for LRP1 in myelin synthesis through cholesterol
endocytosis, cell survival and migration of precursor cells. The receptor was present on
astrocyte cell bodies where it may affect astrocyte mediated neurotransmitter release
and immune responses. LRP1 expressed on microglia could potentially be involved in
antigen presentation and phagocytosis. The receptor was also located on endothelial
cells and astrocytic end-feet of the BBB, suggesting that it may regulate the
microenvironment of the brain through transport of molecules in and out of it.
Subcellular and regional expression of LRP1 in the rat brain indicates a role of
the receptor in mediating neuronal survival through direct effects on these cells.
However, it may also indirectly affect function of these cells through maintaining
survival and function of glia and modulating the microenvironment of the brain via the
BBB. While identification of the subcellular and regional localisation of LRP1 allows
speculation into its function in subsets of neurons and glia of the brain, it does not
definitively explain the function of the receptor in these cells. In vivo observations

71
provide direction for what to investigate in in vitro models of neuron and glia to
determine the specific functions that LRP1 regulates in these cells.
72
3 Chapter 3: In vitro characterisation of LRP1 expression in
hippocampal neurons
INTRODUCTION 3.1
LRP1 is expressed in neurons, astrocytes, oligodendrocytes and microglia
throughout the grey and white matter regions of the rat brain (Chapter 2.3.2). The
extensive expression of LRP1 in the CNS suggests that it has a role in maintaining a
healthy, functional brain by regulating neuron and glial survival and function. However,
the precise function of LRP1 in these cell populations in vivo is unknown. Simpler in
vitro neuron models have demonstrated that LRP1 can regulate neuron functions such
as survival, neurite outgrowth and calcium signaling (Qiu et al., 2002, Qiu et al., 2004,
Hayashi et al., 2007, Martin et al., 2008, Fuentealba et al., 2009, Hayashi et al., 2012,
Sen et al., 2012, Stiles et al., 2013). Culture systems investigating LRP1 functions in
CNS glia have been more limited. However, LRP1 expression has been demonstrated in
astrocytes, oligodendrocytes and microglia in vitro (Marzolo et al., 2000, Gaultier et al.,
2009). These in vitro models allow investigation into the effects of injury or LRP1
ligand addition on cell biology that can be investigated further in vivo.
LRP1 is expressed on a range of neuron subtypes in vitro including
hippocampal, cortical, cerebellar granule and retinal ganglionic neurons (Brown et al.,
1997, May et al., 2004, Hayashi et al., 2007, Ambjørn et al., 2008, Shi et al., 2009).
Hippocampal neurons have been well characterised in culture and develop well defined
dendrites and axons (Caceres et al., 1986, Dotti et al., 1987, Dotti et al., 1988). These
neurons also express functional synaptic networks that begin to form at 10-14 days in
vitro (DIV) and are fully established by 21DIV (Fletcher et al., 1991, Rao et al., 1998).
This makes them a useful culture model for studying neuronal functions such as
survival, neurite outgrowth, regeneration and synaptic signaling.
73
Investigating the regulation of hippocampal neuron survival and function is
particularly relevant for neurodegenerative conditions such as Alzheimer’s disease. The
hippocampus undergoes significant neurodegeneration in Alzheimer’s disease. This
pathology corresponds to the short and long-term memory dysfunction associated with
the condition (Kesslak et al., 1991, Laakso et al., 1995). LRP1 and some of its ligands,
including apoE and α2-macroglobulin, have been genetically linked to the risk of
developing Alzheimer’s disease (Strittmatter et al., 1993, Kang et al., 1997, Blacker et
al., 1998). LRP1 expression is altered in the hippocampus of patients with early and late
stages of the disease (Donahue et al., 2006, Sultana et al., 2010). Animal models further
support a role of LRP1 in Alzheimer’s disease. LRP1 knock-out mouse models display
Alzheimer’s disease-like pathology as they age, such as neurodegeneration of the
hippocampus (Liu et al., 2010). Investigating the role of LRP1 in hippocampal neurons
may aid in understanding how to promote survival and function of these cells and to
limit the degeneration that occurs in conditions such as Alzheimer’s disease.
LRP1 is expressed in cell bodies, axons and dendrites of rat hippocampal
neurons in the first week of culture. After 7DIV it becomes restricted to cell bodies and
dendrites (Brown et al., 1997). This correlates to observations made in vivo where LRP1
is expressed on a subset of neuron cell bodies and proximal segments of their dendrites
but absent from axons (Chapter 2.3.2). Determining subcellular localisation of LRP1 in
hippocampal neurons will aid in understanding how this receptor regulates neuron
function. Confirming previous in vivo and in vitro work will allow further investigation
into the receptor’s function at specific cellular sites.
Evidence that LRP1 is involved in synaptic function is increasing through both
in vivo and in vitro work. LRP1 is expressed on the proximal segment of apical
dendrites of hippocampal neurons in adult rats (Chapter 2.3.2). This is a site in which
specific neurons can synapse, post-synaptic potentials can be amplified and has distinct
74
calcium accumulation characteristics (Blackstad et al., 1970, Yuste et al., 1994,
Seamans et al., 1997). In vitro, LRP1 co-localises with the NR2a subunit of NMDA
receptor in hippocampal neurons (May et al., 2004). The receptor regulates NMDA
receptor dependent calcium influx of hippocampal neurons, demonstrating an ability to
modulate synaptic activity. Knock-in of a mutant distal NPxY motif to LRP1 inhibits
tPA mediated NMDA receptor dependent calcium influx in hippocampal neurons
(Martin et al., 2008). This demonstrates that LRP1 regulated calcium influx is mediated
by this motif. It is believed that the mechanism by which this occurs is through an
interaction with the post-synaptic protein, PSD-95.
PSD-95 binds to and anchors the NMDA receptor to post-synaptic sites as well
as regulating its calcium signaling (Kornau et al., 1995, Sattler et al., 1999). Yeast two-
hybrid screening and pull-down assays have demonstrated the ability for the distal
NPxY motif of LRP1 to associate with PSD-95 (Gotthardt et al., 2000). However, direct
co-localisation of LRP1 and PSD-95 has not been identified in hippocampal neurons.
Whether the receptor associates with pre-synaptic proteins such as synaptophysin has
not been investigated previously. But given the expression of LRP1 on dendrites not
axons after 7DIV (Brown et al., 1997) when the neurons are becoming synaptically
active, it is unlikely that the receptor is expressed upon pre-synaptic sites.
LRP1 ligands are able to regulate calcium influx in an NMDA receptor
dependent manner. tPA and α2-macroglobulin addition induce an immediate calcium
influx in hippocampal and cortical neurons, respectively. Both these effects are ablated
by the NMDA receptor inhibitor, MK801 (Bacskai et al., 2000, Martin et al., 2008).
Another LRP1 ligand, MT, regulates calcium influx and signaling pathways to mediate
growth cone turning of dorsal root ganglia. siRNA against LRP1 inhibits the growth
turning effects of MT (Landowski et al., 2012). These findings demonstrate the
potential for this ligand to regulate the calcium signaling function of LRP1. The effect
75
of MT on calcium signaling in hippocampal neurons, and whether this is NMDA
receptor dependent, is unknown. In addition, the effects of a peptide modeled after the
C-terminus of the MT beta chain, emtinB, on calcium signaling has not been studied
previously.
In addition to neuronal expression, LRP1 was identified on cell bodies and
processes of astrocytes, oligodendrocytes and microglia in the P2, P7 and adult rat brain
(Chapter 2.3.2). The receptor is expressed in glia of pure astrocyte, oligodendrocyte and
microglia cultures and regulates myelin vesicle phagocytosis of these cells (Gaultier et
al., 2009). Microglia also phagocytose cerebellar granule neurons following toxicity and
cell debris from heat shock treated oligodendrocytes by LRP1 dependent mechanisms
(Fricker et al., 2012, Fernandez-Castaneda et al., 2013). Expression of LRP1 in
microglia is also affected by inflammatory mediators, suggesting that the receptor has a
function in immune responses of these cells (Marzolo et al., 2000). Less work has been
conducted investigating the function of LRP1 in astrocytes and oligodendrocytes.
Investigation of LRP1 in glia of mixed cultures provides an environment more closely
related to what is observed in vivo. Therefore, determining whether LRP1 is expressed
in astrocytes, oligodendrocytes and microglia in the presence of hippocampal neurons
may further support previous in vivo and in vitro findings.
I hypothesise that LRP1 is expressed on hippocampal neuron cell bodies and
dendrites of hippocampal neurons in culture. As the neurons become synaptically
mature, LRP1 will co-localise with post-synaptic proteins, such as PSD-95 and NMDA
receptor subunits, but not pre-synaptic proteins, such as synaptophysin. LRP1 ligands,
MT and emtinB, will induce calcium influx in synaptically mature neurons in an LRP1
and NMDA receptor dependent manner. LRP1 will be expressed upon cell bodies and
processes of contaminating astrocytes, oligodendrocytes and microglia within
hippocampal neuron cultures.
76
METHODS 3.2
All experiments involving the use of animals were approved by the Animal
Experimentation Ethics Committee of the University of Tasmania (ethics number
A0011957), which is in accordance with the Australian Code of Practice for the Care
and Use of Animals for Scientific Purposes. Sprague Dawley rats were used in all
animal work.
Buffer recipes and product information for all reagents can be found in
appendices.
3.2.1 PRIMARY HIPPOCAMPAL NEURON CULTURE
Primary hippocampal neuron cultures were prepared from embryonic day 17/18
Sprague Dawley rats. Embryos were dissected from mothers’ euthanised by carbon
dioxide asphyxiation, removed from embryonic sacs, placed on ice and decapitated. The
brain was removed by cutting through the midline of the skull and squeezing the sides
of the head gently. Tissue was transferred to Hank’s buffered saline solution (HBSS;
Sigma, USA) where the cerebellum and part of the brain stem were discarded and the
hemispheres separated. Under a dissection microscope the thalamus and hypothalamus
were removed and the meninges pulled away to reveal the hippocampus which was
dissected from the brain and placed in chilled HBSS. Cells were trypsinised using 0.1%
trypsin (Sigma, USA) at 37°C for 5 minutes. Trypsin was removed and cells were
resuspended and dissociated by pipette in 1mL Neurobasal media with 10% foetal calf
serum. Neurobasal refers to Neurobasal media (Gibco, USA) with 0.1% B27 (Gibco,
USA), 0.5mM L-glutamine (Sigma, USA) and 1% gentamicin (Gibco, USA) unless
otherwise stated.
Cell count was performed using Trypan Blue (Sigma, USA) exclusion. Cells
used for western blot were plated at 1x10⁵ cells/well in 24 well plates (BD Falcon,
USA) coated with 1:10 poly-L-lysine (Sigma, USA). Cells used for
77
immunohistochemistry were plated at 5x10⁴ cells/well on 13mm glass coverslips in 24
well plates. Cells used for live calcium imaging were plated at 5x10⁴ cells/well on
18mm glass coverslips in 12 well plates (BD Falcon, USA). Glass coverslips were
treated with >69% nitric acid (Fluka, USA) for four hours, washed in tap water
overnight, ethanol cleaned and sterilised by exposure to ultraviolet light for 30 minutes.
All coverslips were coated overnight with neat poly-L-lysine. Cultures were maintained
at 37°C in humidified air with 5% carbon dioxide. A full media change to serum free
Neurobasal media was conducted 24 hours after plating and every three to four days
thereafter.
3.2.2 WESTERN BLOT
Hippocampal neuron cultures were grown to 3, 7, 14 and 21DIV. 3 separate
cultures were used for each time point and 5x10⁵ cells were collected for each culture.
Cultures were washed twice with HBSS free of B27 or serum. While on ice, cells were
scraped from wells by pipette using 150μL RIPA lysis buffer with 1:100 protease
inhibitor (Thermo Scientific, USA) and triturated 15-20 times. Samples were
centrifuged in 4°C at 13,000rpm for 10 minutes. The supernatant was removed, snap
frozen in liquid nitrogen and stored at -80°C.
Total protein concentration was determined using a BCA protein assay (Bio-
Rad, USA). Briefly, part A and part B solutions were mixed by a 50:1 ratio. 200μL of
working reagent was added to each well of a 96 well plate. Protein standards at 0.1, 0.2,
0.5, 0.7 and 1.0mg/mL were prepared to calculate a protein standard curve. 20μL of
protein standards and 20μL of cell sample were mixed with the BCA reagent and
incubated for 30 minutes at 37°C. Triplicates were prepared for each sample.
Absorbance at 595nm was measured using a SpectraMax M2 plate reader (Molecular
Devices) and SoftMax Pro computer program (v 4.8). A standard curve was calculated
and used to determine each sample’s concentration.
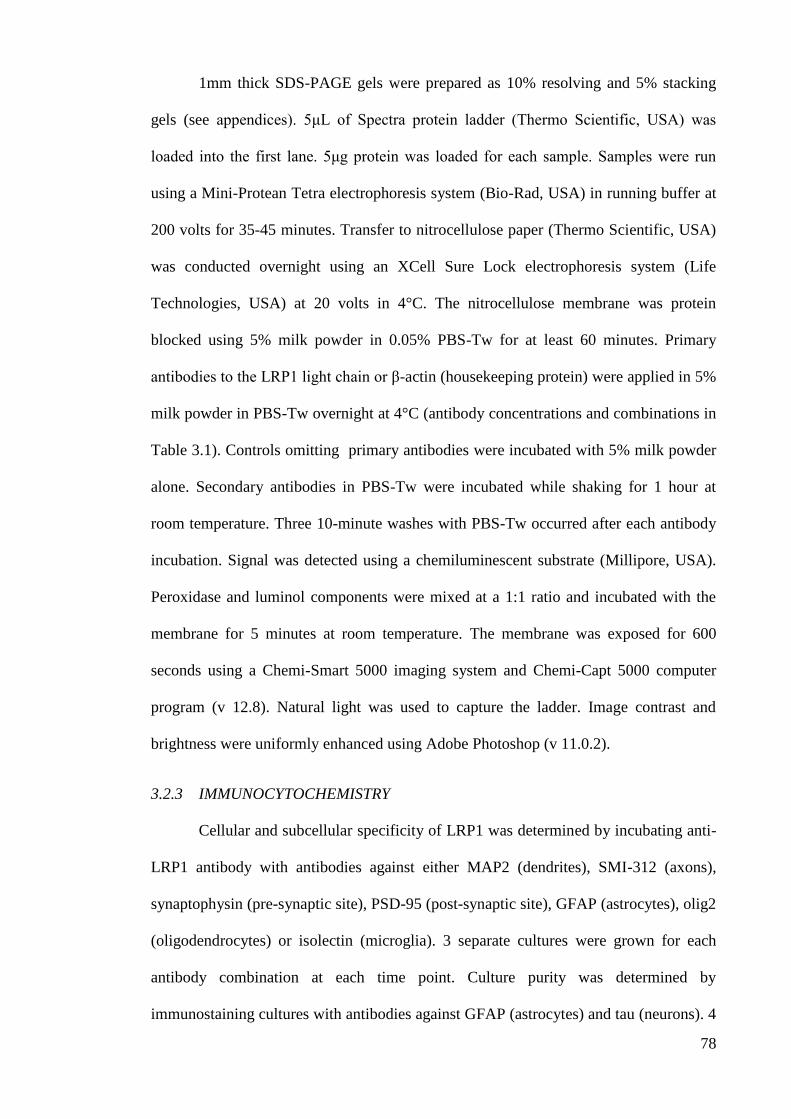
78
1mm thick SDS-PAGE gels were prepared as 10% resolving and 5% stacking
gels (see appendices). 5μL of Spectra protein ladder (Thermo Scientific, USA) was
loaded into the first lane. 5μg protein was loaded for each sample. Samples were run
using a Mini-Protean Tetra electrophoresis system (Bio-Rad, USA) in running buffer at
200 volts for 35-45 minutes. Transfer to nitrocellulose paper (Thermo Scientific, USA)
was conducted overnight using an XCell Sure Lock electrophoresis system (Life
Technologies, USA) at 20 volts in 4°C. The nitrocellulose membrane was protein
blocked using 5% milk powder in 0.05% PBS-Tw for at least 60 minutes. Primary
antibodies to the LRP1 light chain or β-actin (housekeeping protein) were applied in 5%
milk powder in PBS-Tw overnight at 4°C (antibody concentrations and combinations in
Table 3.1). Controls omitting primary antibodies were incubated with 5% milk powder
alone. Secondary antibodies in PBS-Tw were incubated while shaking for 1 hour at
room temperature. Three 10-minute washes with PBS-Tw occurred after each antibody
incubation. Signal was detected using a chemiluminescent substrate (Millipore, USA).
Peroxidase and luminol components were mixed at a 1:1 ratio and incubated with the
membrane for 5 minutes at room temperature. The membrane was exposed for 600
seconds using a Chemi-Smart 5000 imaging system and Chemi-Capt 5000 computer
program (v 12.8). Natural light was used to capture the ladder. Image contrast and
brightness were uniformly enhanced using Adobe Photoshop (v 11.0.2).
3.2.3 IMMUNOCYTOCHEMISTRY
Cellular and subcellular specificity of LRP1 was determined by incubating anti-
LRP1 antibody with antibodies against either MAP2 (dendrites), SMI-312 (axons),
synaptophysin (pre-synaptic site), PSD-95 (post-synaptic site), GFAP (astrocytes), olig2
(oligodendrocytes) or isolectin (microglia). 3 separate cultures were grown for each
antibody combination at each time point. Culture purity was determined by
immunostaining cultures with antibodies against GFAP (astrocytes) and tau (neurons). 4
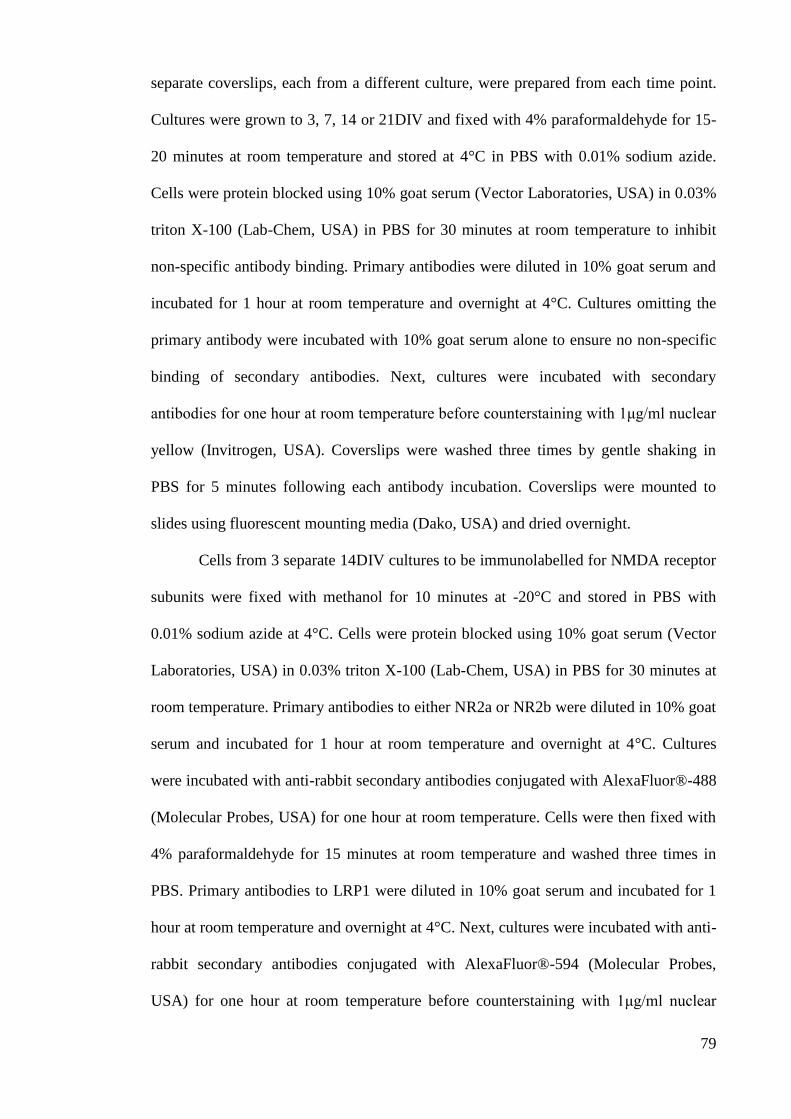
79
separate coverslips, each from a different culture, were prepared from each time point.
Cultures were grown to 3, 7, 14 or 21DIV and fixed with 4% paraformaldehyde for 15-
20 minutes at room temperature and stored at 4°C in PBS with 0.01% sodium azide.
Cells were protein blocked using 10% goat serum (Vector Laboratories, USA) in 0.03%
triton X-100 (Lab-Chem, USA) in PBS for 30 minutes at room temperature to inhibit
non-specific antibody binding. Primary antibodies were diluted in 10% goat serum and
incubated for 1 hour at room temperature and overnight at 4°C. Cultures omitting the
primary antibody were incubated with 10% goat serum alone to ensure no non-specific
binding of secondary antibodies. Next, cultures were incubated with secondary
antibodies for one hour at room temperature before counterstaining with 1μg/ml nuclear
yellow (Invitrogen, USA). Coverslips were washed three times by gentle shaking in
PBS for 5 minutes following each antibody incubation. Coverslips were mounted to
slides using fluorescent mounting media (Dako, USA) and dried overnight.
Cells from 3 separate 14DIV cultures to be immunolabelled for NMDA receptor
subunits were fixed with methanol for 10 minutes at -20°C and stored in PBS with
0.01% sodium azide at 4°C. Cells were protein blocked using 10% goat serum (Vector
Laboratories, USA) in 0.03% triton X-100 (Lab-Chem, USA) in PBS for 30 minutes at
room temperature. Primary antibodies to either NR2a or NR2b were diluted in 10% goat
serum and incubated for 1 hour at room temperature and overnight at 4°C. Cultures
were incubated with anti-rabbit secondary antibodies conjugated with AlexaFluor®-488
(Molecular Probes, USA) for one hour at room temperature. Cells were then fixed with
4% paraformaldehyde for 15 minutes at room temperature and washed three times in
PBS. Primary antibodies to LRP1 were diluted in 10% goat serum and incubated for 1
hour at room temperature and overnight at 4°C. Next, cultures were incubated with anti-
rabbit secondary antibodies conjugated with AlexaFluor®-594 (Molecular Probes,
USA) for one hour at room temperature before counterstaining with 1μg/ml nuclear
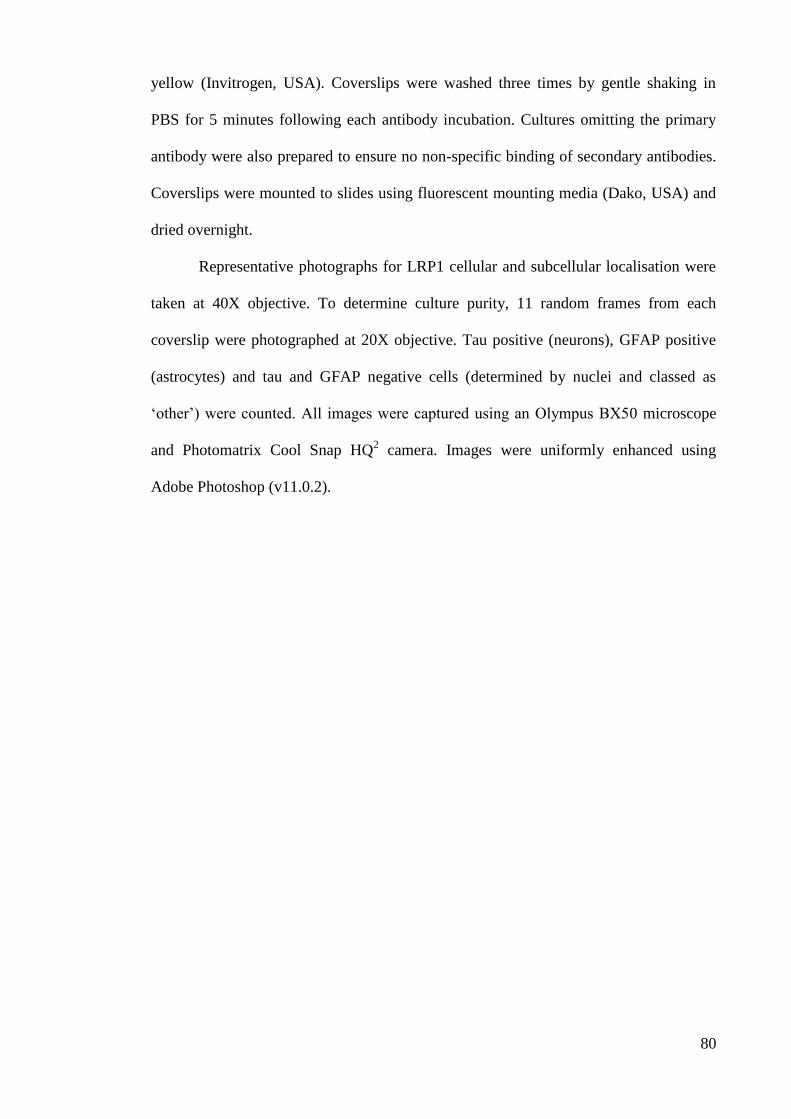
80
yellow (Invitrogen, USA). Coverslips were washed three times by gentle shaking in
PBS for 5 minutes following each antibody incubation. Cultures omitting the primary
antibody were also prepared to ensure no non-specific binding of secondary antibodies.
Coverslips were mounted to slides using fluorescent mounting media (Dako, USA) and
dried overnight.
Representative photographs for LRP1 cellular and subcellular localisation were
taken at 40X objective. To determine culture purity, 11 random frames from each
coverslip were photographed at 20X objective. Tau positive (neurons), GFAP positive
(astrocytes) and tau and GFAP negative cells (determined by nuclei and classed as
‘other’) were counted. All images were captured using an Olympus BX50 microscope
and Photomatrix Cool Snap HQ2 camera. Images were uniformly enhanced using
Adobe Photoshop (v11.0.2).
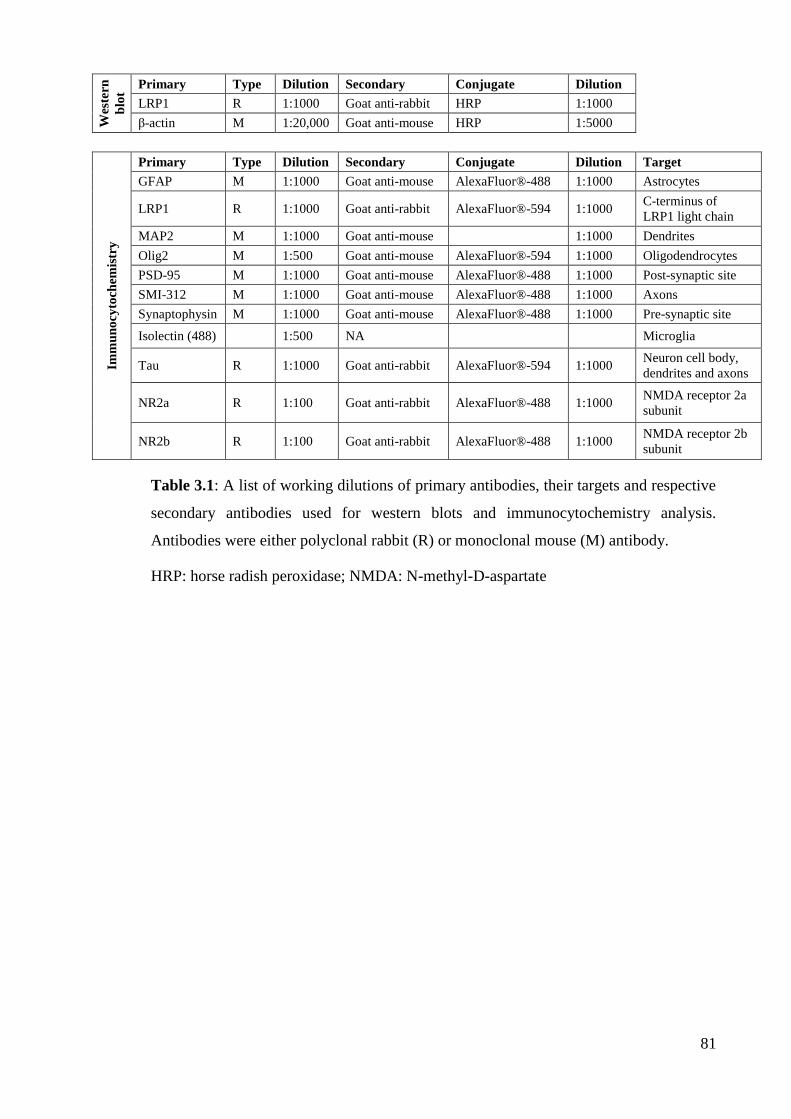
81
Wes
tern
blo
t
Primary Type Dilution Secondary Conjugate Dilution
LRP1 R 1:1000 Goat anti-rabbit HRP 1:1000
β-actin M 1:20,000 Goat anti-mouse HRP 1:5000
Imm
un
ocy
toch
emis
try
Primary Type Dilution Secondary Conjugate Dilution Target
GFAP M 1:1000 Goat anti-mouse AlexaFluor®-488 1:1000 Astrocytes
LRP1 R 1:1000 Goat anti-rabbit AlexaFluor®-594 1:1000 C-terminus of
LRP1 light chain
MAP2 M 1:1000 Goat anti-mouse
1:1000 Dendrites
Olig2 M 1:500 Goat anti-mouse AlexaFluor®-594 1:1000 Oligodendrocytes
PSD-95 M 1:1000 Goat anti-mouse AlexaFluor®-488 1:1000 Post-synaptic site
SMI-312 M 1:1000 Goat anti-mouse AlexaFluor®-488 1:1000 Axons
Synaptophysin M 1:1000 Goat anti-mouse AlexaFluor®-488 1:1000 Pre-synaptic site
Isolectin (488) 1:500 NA Microglia
Tau R 1:1000 Goat anti-rabbit AlexaFluor®-594 1:1000 Neuron cell body,
dendrites and axons
NR2a R 1:100 Goat anti-rabbit AlexaFluor®-488 1:1000 NMDA receptor 2a
subunit
NR2b R 1:100 Goat anti-rabbit AlexaFluor®-488 1:1000 NMDA receptor 2b
subunit
Table 3.1: A list of working dilutions of primary antibodies, their targets and respective
secondary antibodies used for western blots and immunocytochemistry analysis.
Antibodies were either polyclonal rabbit (R) or monoclonal mouse (M) antibody.
HRP: horse radish peroxidase; NMDA: N-methyl-D-aspartate
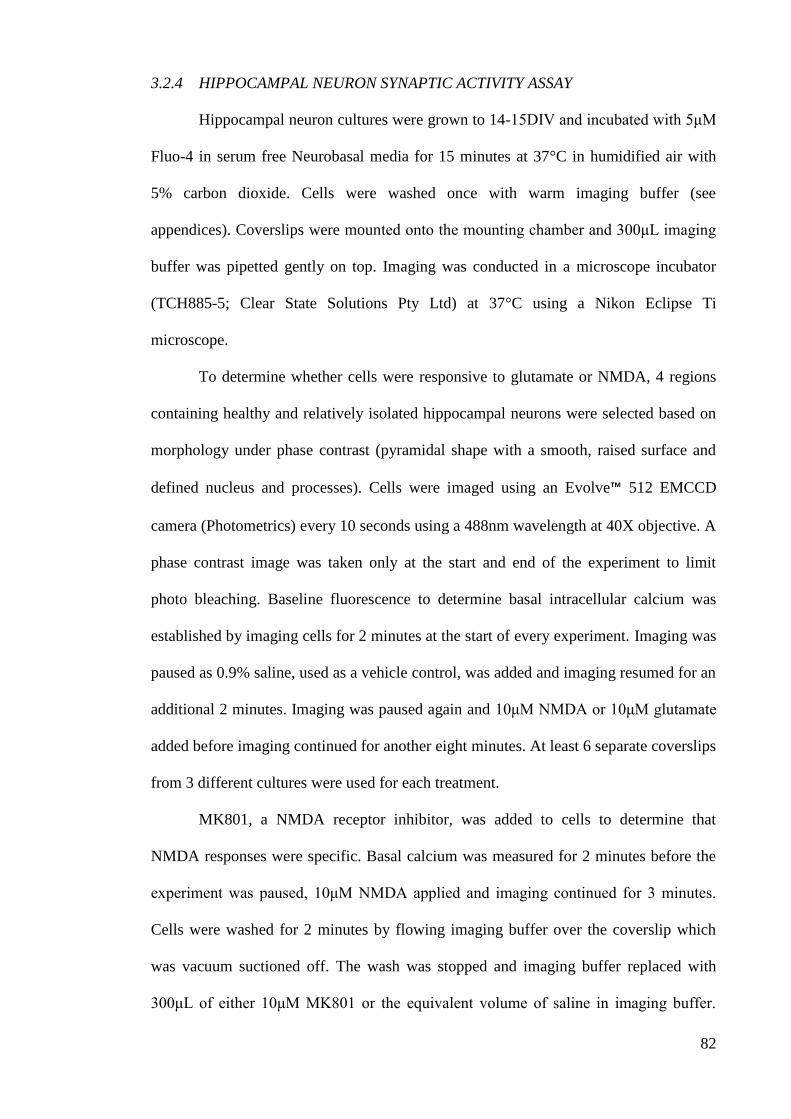
82
3.2.4 HIPPOCAMPAL NEURON SYNAPTIC ACTIVITY ASSAY
Hippocampal neuron cultures were grown to 14-15DIV and incubated with 5μM
Fluo-4 in serum free Neurobasal media for 15 minutes at 37°C in humidified air with
5% carbon dioxide. Cells were washed once with warm imaging buffer (see
appendices). Coverslips were mounted onto the mounting chamber and 300μL imaging
buffer was pipetted gently on top. Imaging was conducted in a microscope incubator
(TCH885-5; Clear State Solutions Pty Ltd) at 37°C using a Nikon Eclipse Ti
microscope.
To determine whether cells were responsive to glutamate or NMDA, 4 regions
containing healthy and relatively isolated hippocampal neurons were selected based on
morphology under phase contrast (pyramidal shape with a smooth, raised surface and
defined nucleus and processes). Cells were imaged using an Evolve™ 512 EMCCD
camera (Photometrics) every 10 seconds using a 488nm wavelength at 40X objective. A
phase contrast image was taken only at the start and end of the experiment to limit
photo bleaching. Baseline fluorescence to determine basal intracellular calcium was
established by imaging cells for 2 minutes at the start of every experiment. Imaging was
paused as 0.9% saline, used as a vehicle control, was added and imaging resumed for an
additional 2 minutes. Imaging was paused again and 10μM NMDA or 10μM glutamate
added before imaging continued for another eight minutes. At least 6 separate coverslips
from 3 different cultures were used for each treatment.
MK801, a NMDA receptor inhibitor, was added to cells to determine that
NMDA responses were specific. Basal calcium was measured for 2 minutes before the
experiment was paused, 10μM NMDA applied and imaging continued for 3 minutes.
Cells were washed for 2 minutes by flowing imaging buffer over the coverslip which
was vacuum suctioned off. The wash was stopped and imaging buffer replaced with
300μL of either 10μM MK801 or the equivalent volume of saline in imaging buffer.
83
Cells were left for 7.5 minutes to allow for MK801 inhibition before 10μM NMDA was
added again and imaging continued for an additional 6 minutes. 2-3 separate coverslips,
each from a different culture, were used for each experiment.
The effects of the LRP1 ligands, MT (Bestenbalt LLC, Estonia) and emtinB
(Schafer-N, Denmark), on NMDA receptor dependent calcium influx were investigated.
Cells were incubated with Fluo-4 as above and baseline fluorescence determined by
imaging cells for 2 minutes at the start of the experiment. Imaging was paused and
10μM NMDA added to determine whether neurons were synaptically active. After 2-3
minutes of imaging, cultures were washed for 2 minutes by flowing fresh imaging
buffer onto the coverslip which was vacuum suctioned off to remove any remaining
NMDA. The wash was stopped and cells allowed to settle for 2 minutes before imaging
was paused and either 10μg/mL MT (equivalent to 1.5μM) or 25μM emtinB (equivalent
to 75μg/mL) added and imaging resumed for 6.5 minutes. 6 coverslips from 3 cultures
were used to determine MT effects, while 2 coverslips from 1 culture were used to
determine emtinB effects.
Video of live imaging fluorescence was analysed using the NIS Elements AR
computer program (v 3.21.00). A region of interest was manually drawn around the
soma of each cell using the phase contrast image. Raw fluorescence was measured and
corrected for background. Data were transferred to Microsoft Excel (v14.0.7015.1000)
and baseline fluorescence calculated as the average fluorescence of the two minute
baseline period. Raw fluorescence was converted to actual fluorescence using the
following equation:

84
where F = the raw fluorescence at a the time point being measured and F0 =
baseline fluorescence (reviewed by (Takahashi et al., 1999)). Results for each cell were
presented in graph form. Graphs in Figure 3.12 represent the response of a typical cell.
A synaptic response was classed as an increase of fluorescence above a value of 1 that
occurred immediately after addition of the neurotransmitter and which quickly reduced
to near baseline level.
85
RESULTS 3.3
3.3.1 LRP1 IS EXPRESSED IN HIPPOCAMPAL NEURON CULTURES FROM 3 TO
21DIV
Western blot analysis demonstrated that the processing of LRP1 changes during
maturation in culture. The strongest band observed in 3DIV cultures corresponded to
the ~85kDa band representing the LRP1 light chain. A faint ~120kDa band was also
present at this time point (Figure 3.1 A, lanes 1-3). Both the ~85kDa and ~120kDa
bands became stronger from 3 to 7DIV (Figure 3.1 A, lanes 4-6). Expression of the
~85kDa band remained similar between 7 and 14DIV cultures, but the ~120kDa band
appeared fainter at 14DIV compared to 7DIV. 14DIV cultures also faintly expressed
~50kDa, ~130kDa and ~150kDa bands not present at 3 or 7DIV (Figure 3.1 A, lanes 7-
9). 21DIV cultures expressed the ~85kDa band similar to 7 and 14DIV cultures. The
~130kDa and ~150kDa were fainter at 21DIV than 14DIV, but the ~50kDa band was
stronger. A ~37kDa band was present at 21DIV that was not observed at any other time
point (Figure 3.1 A, lanes 10-12).
A similar amount of protein was loaded for each sample (β-actin). Negative
controls of hippocampal culture blots omitting primary antibodies showed no
immunoreactivity (Figure 3.1 B).
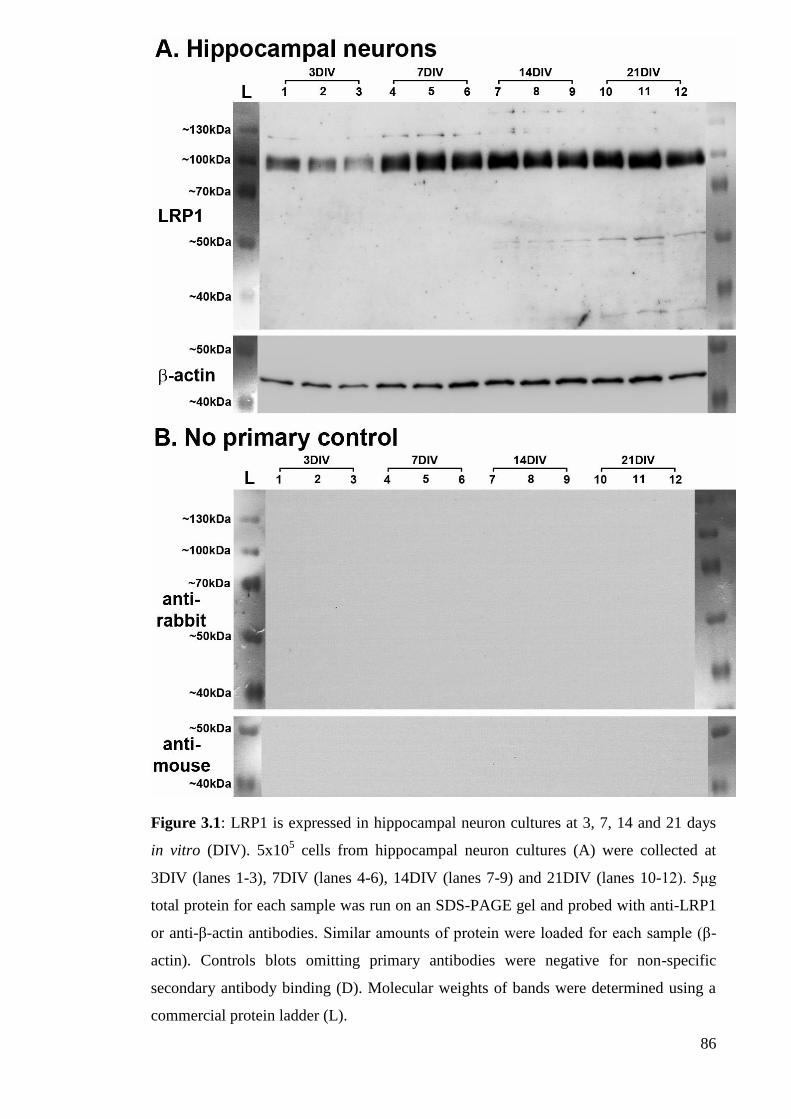
86
Figure 3.1: LRP1 is expressed in hippocampal neuron cultures at 3, 7, 14 and 21 days
in vitro (DIV). 5x10⁵ cells from hippocampal neuron cultures (A) were collected at
3DIV (lanes 1-3), 7DIV (lanes 4-6), 14DIV (lanes 7-9) and 21DIV (lanes 10-12). 5μg
total protein for each sample was run on an SDS-PAGE gel and probed with anti-LRP1
or anti-β-actin antibodies. Similar amounts of protein were loaded for each sample (β-
actin). Controls blots omitting primary antibodies were negative for non-specific
secondary antibody binding (D). Molecular weights of bands were determined using a
commercial protein ladder (L).
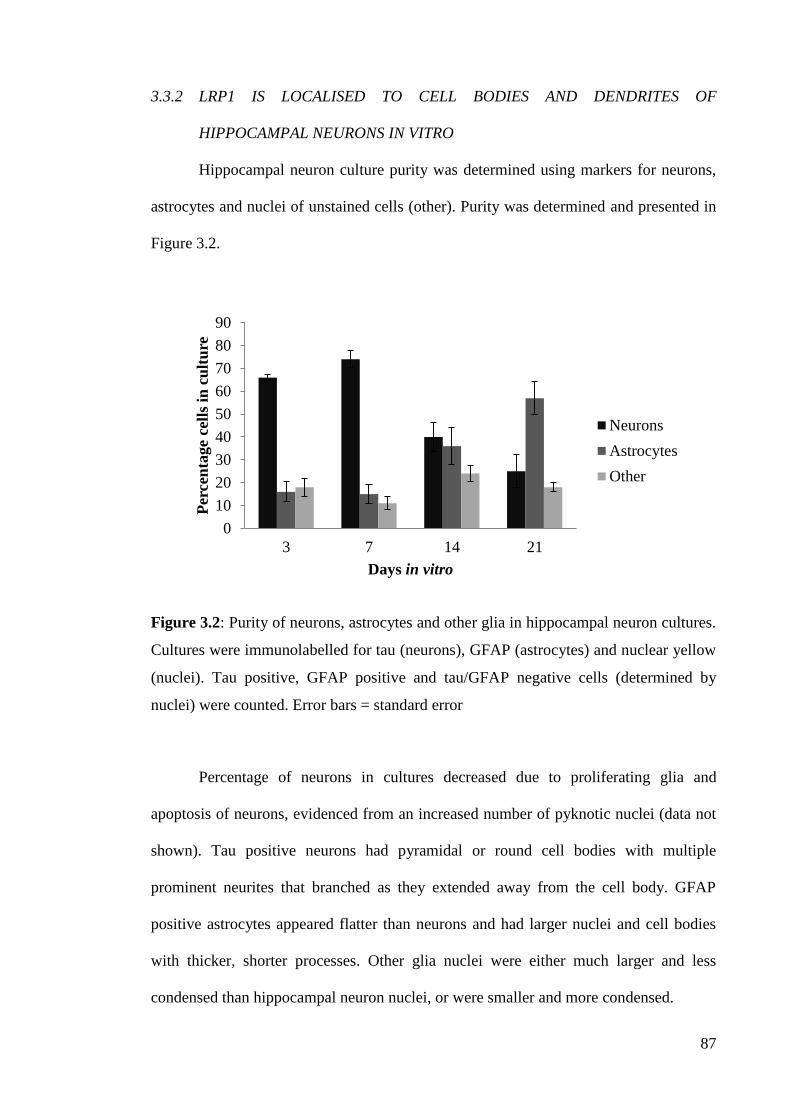
87
3.3.2 LRP1 IS LOCALISED TO CELL BODIES AND DENDRITES OF
HIPPOCAMPAL NEURONS IN VITRO
Hippocampal neuron culture purity was determined using markers for neurons,
astrocytes and nuclei of unstained cells (other). Purity was determined and presented in
Figure 3.2.
Figure 3.2: Purity of neurons, astrocytes and other glia in hippocampal neuron cultures.
Cultures were immunolabelled for tau (neurons), GFAP (astrocytes) and nuclear yellow
(nuclei). Tau positive, GFAP positive and tau/GFAP negative cells (determined by
nuclei) were counted. Error bars = standard error
Percentage of neurons in cultures decreased due to proliferating glia and
apoptosis of neurons, evidenced from an increased number of pyknotic nuclei (data not
shown). Tau positive neurons had pyramidal or round cell bodies with multiple
prominent neurites that branched as they extended away from the cell body. GFAP
positive astrocytes appeared flatter than neurons and had larger nuclei and cell bodies
with thicker, shorter processes. Other glia nuclei were either much larger and less
condensed than hippocampal neuron nuclei, or were smaller and more condensed.
0
10
20
30
40
50
60
70
80
90
3 7 14 21
Per
cen
tage
cell
s in
cu
ltu
re
Days in vitro
Neurons
Astrocytes
Other
88
LRP1 was expressed on astrocyte cell bodies and processes from 3 to 21DIV
(Figure 3.3 A-D). Oligodendrocytes were positive for LRP1 on cell bodies and
processes from 7 to 21DIV (Figure 3.4 A-C). Oligodendrocytes had small cell bodies
with condensed nuclei. The oligodendrocyte marker, olig2, was not detected in cultures
at 3DIV. Microglial expression of LRP1 was heterogeneous. Some cells were strongly
positive for the receptor throughout the cell body, but others only expressed the receptor
faintly. This occurred at 3, 7, 14 and 21DIV (Figure 3.5 A-D). Microglia were noted as
either flat and round or elongated with processes. Differences in LRP1 expression did
not appear to correspond to specific cell morphology.
LRP1 immunoreactivity was observed in all hippocampal neurons from 3 to
21DIV (Figures 3.6 – 3.9). Expression was particularly strong at the cell body of
hippocampal neurons. The receptor was present along and at growth cones at the ends
of extending axons of 3DIV neurons (Figure 3.6 A). This expression was reduced in
7DIV neurons and was absent from axons of 14DIV or 21DIV hippocampal neurons
(Figure 3.6 B-D). At these later time points LRP1 positive processes were observed
alongside axons but not upon the axons themselves. LRP1 reactive processes were
dendrites, which were strongly positive for the receptor from 3DIV to 21DIV (Figure
3.7 A-D). LRP1 did not co-localise with or PSD-95 (Figure 3.8 A-C) or synaptophysin
from 7 to 21DIV (Figure 3.9 A-C). Though partial co-localisation with PSD-95 and
synaptophysin may have appeared to occur in some instances, higher magnification
demonstrated that this was not the case. Rather it appeared that due to the high density
of staining, LRP1 immunoreactivity randomly crossed-over with PSD-95 or
synaptophysin. Controls omitting primary antibodies were incubated with goat anti-
rabbit conjugated to AlexaFluor®-594 and goat anti-mouse conjugated to AlexaFluor®-
488 secondary antibodies and were immunonegative (Figure 3.10 A-D).
89
Cultures at 14DIV were immunolabelled for LRP1 and the NMDA receptor
subunits, NR2a and NR2b. Hippocampal neurons begin to form mature synapses at
about 12DIV, with complete synaptic activity reached at 21DIV (Rao et al., 1998).
14DIV was chosen as healthy cells were relatively easy to grow to this age and
synaptically mature neurons should be present. LRP1 did not co-localise with NR2a
(Figure 3.11 A) but did partially co-localise with NR2b (Figure 3.11 B). No primary
controls for methanol and 4% paraformaldehyde fixed cultures were immunonegative
(Figure 3.11 C).
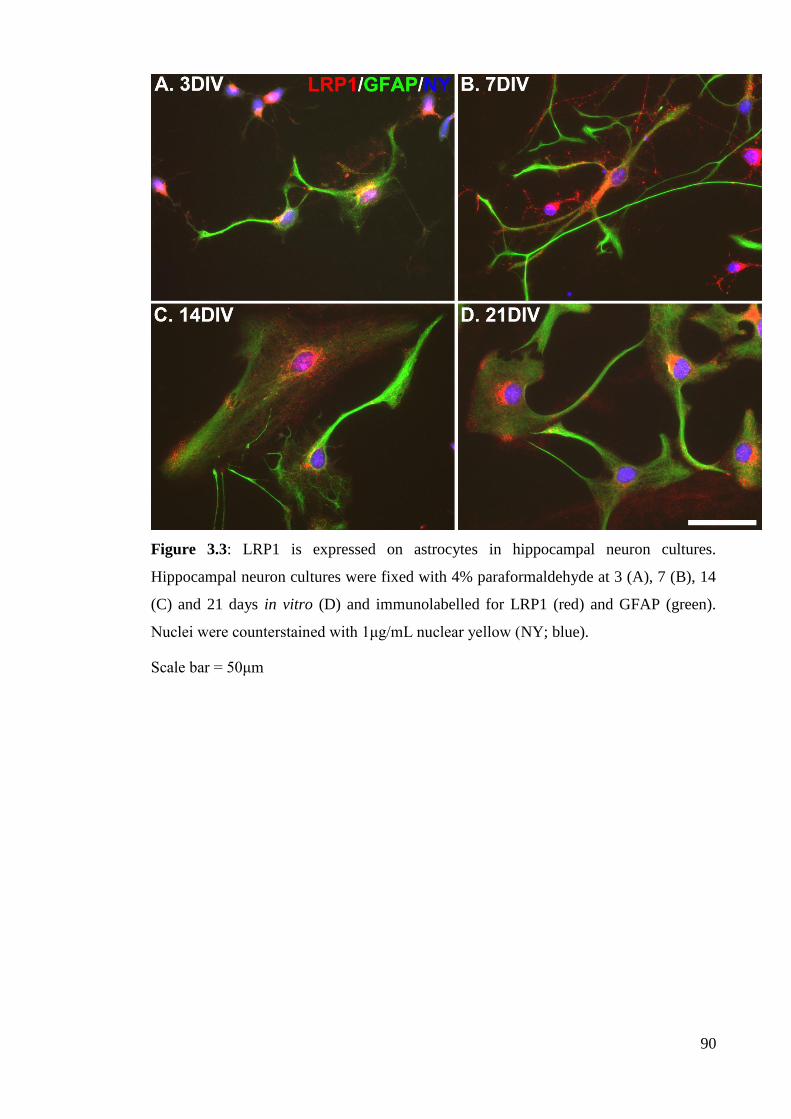
90
Figure 3.3: LRP1 is expressed on astrocytes in hippocampal neuron cultures.
Hippocampal neuron cultures were fixed with 4% paraformaldehyde at 3 (A), 7 (B), 14
(C) and 21 days in vitro (D) and immunolabelled for LRP1 (red) and GFAP (green).
Nuclei were counterstained with 1μg/mL nuclear yellow (NY; blue).
Scale bar = 50μm
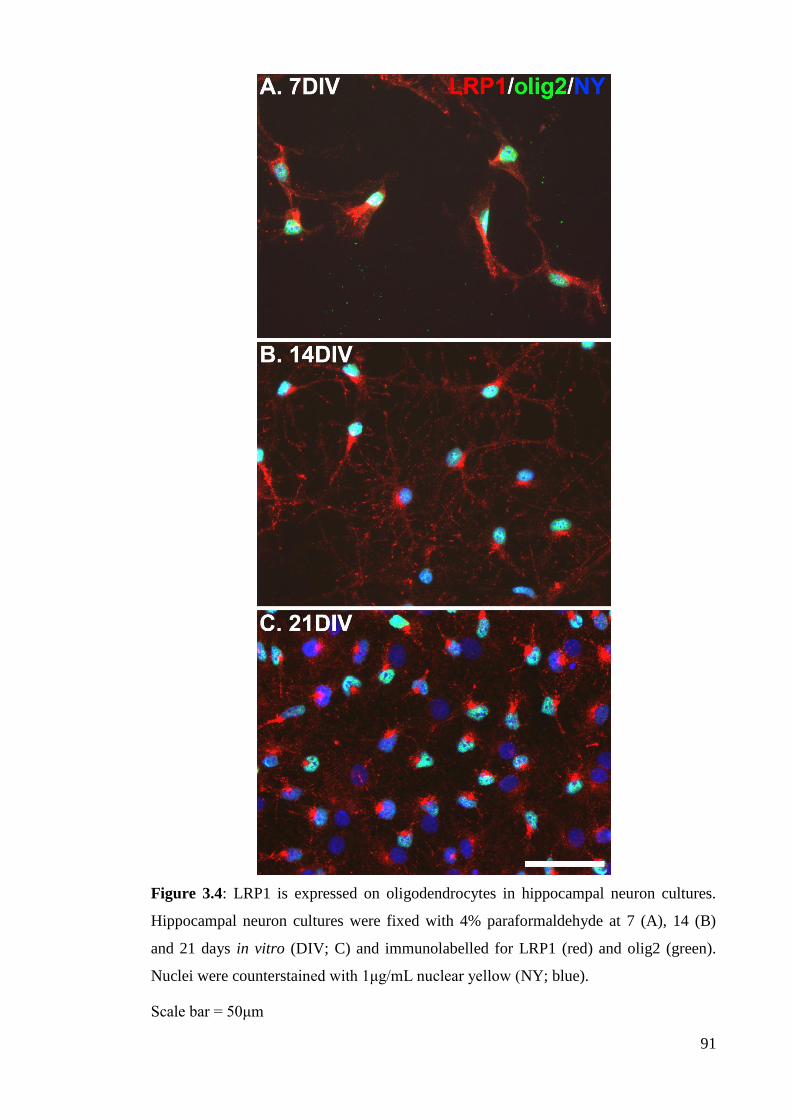
91
Figure 3.4: LRP1 is expressed on oligodendrocytes in hippocampal neuron cultures.
Hippocampal neuron cultures were fixed with 4% paraformaldehyde at 7 (A), 14 (B)
and 21 days in vitro (DIV; C) and immunolabelled for LRP1 (red) and olig2 (green).
Nuclei were counterstained with 1μg/mL nuclear yellow (NY; blue).
Scale bar = 50μm
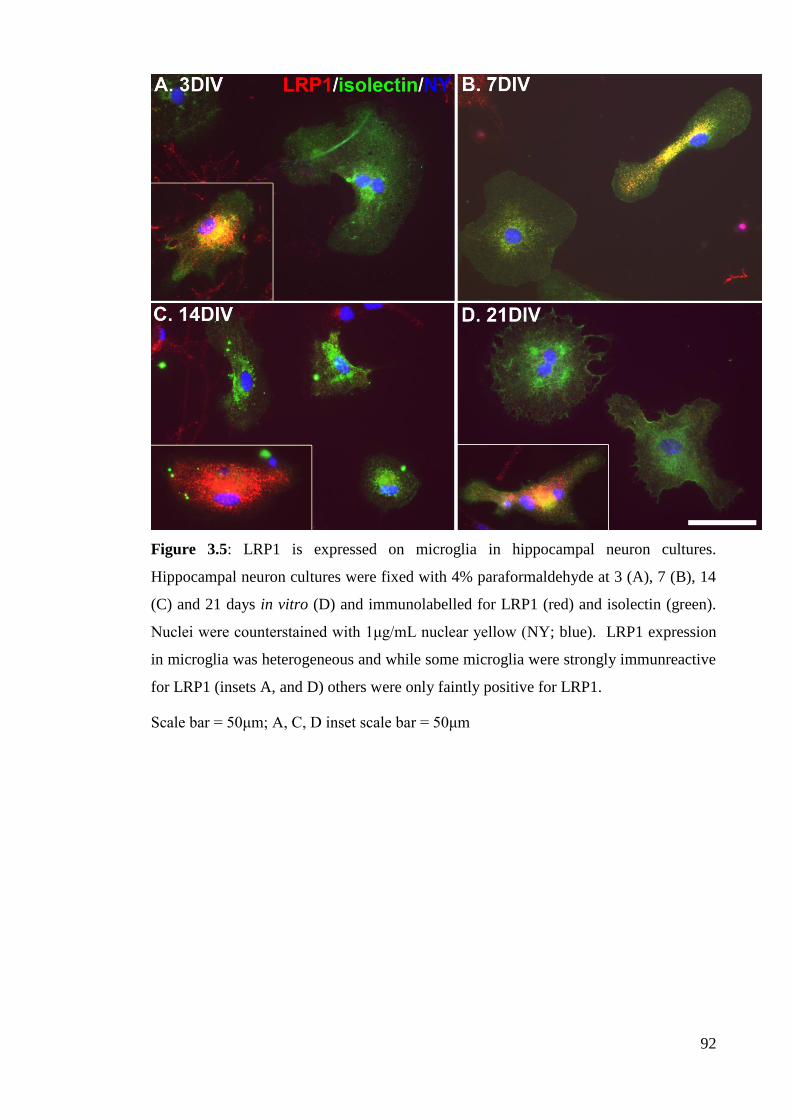
92
Figure 3.5: LRP1 is expressed on microglia in hippocampal neuron cultures.
Hippocampal neuron cultures were fixed with 4% paraformaldehyde at 3 (A), 7 (B), 14
(C) and 21 days in vitro (D) and immunolabelled for LRP1 (red) and isolectin (green).
Nuclei were counterstained with 1μg/mL nuclear yellow (NY; blue). LRP1 expression
in microglia was heterogeneous and while some microglia were strongly immunreactive
for LRP1 (insets A, and D) others were only faintly positive for LRP1.
Scale bar = 50μm; A, C, D inset scale bar = 50μm
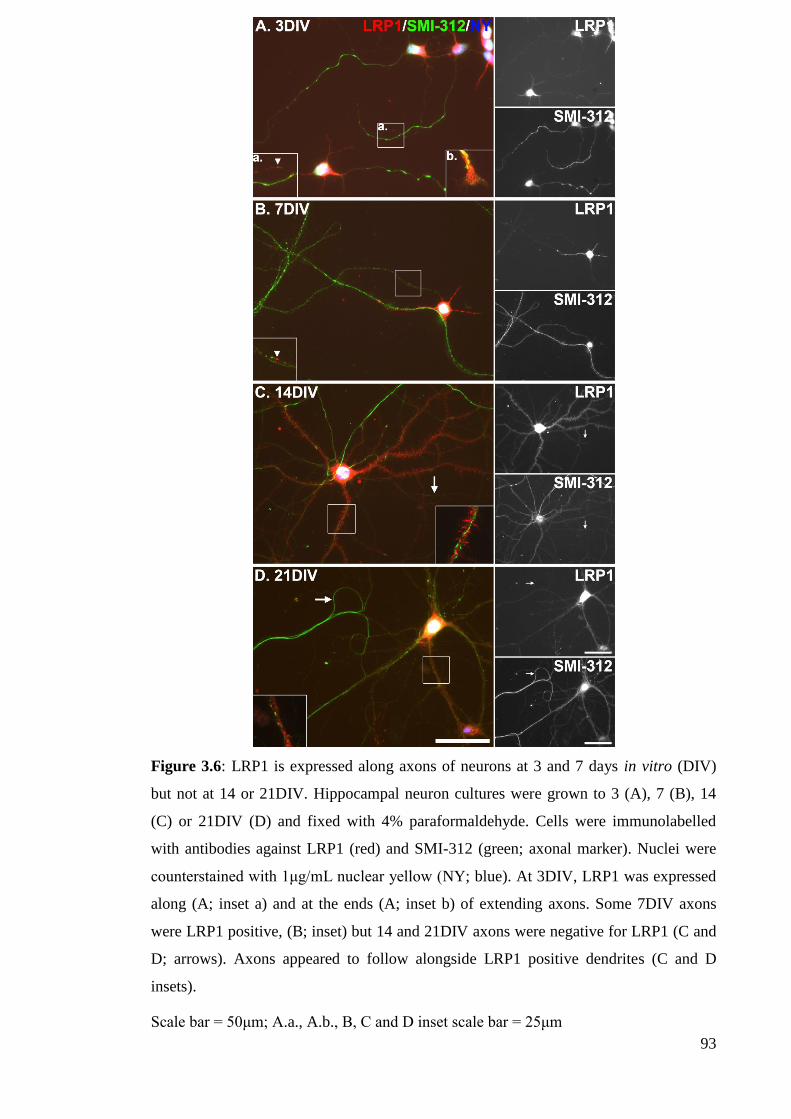
93
Figure 3.6: LRP1 is expressed along axons of neurons at 3 and 7 days in vitro (DIV)
but not at 14 or 21DIV. Hippocampal neuron cultures were grown to 3 (A), 7 (B), 14
(C) or 21DIV (D) and fixed with 4% paraformaldehyde. Cells were immunolabelled
with antibodies against LRP1 (red) and SMI-312 (green; axonal marker). Nuclei were
counterstained with 1μg/mL nuclear yellow (NY; blue). At 3DIV, LRP1 was expressed
along (A; inset a) and at the ends (A; inset b) of extending axons. Some 7DIV axons
were LRP1 positive, (B; inset) but 14 and 21DIV axons were negative for LRP1 (C and
D; arrows). Axons appeared to follow alongside LRP1 positive dendrites (C and D
insets).
Scale bar = 50μm; A.a., A.b., B, C and D inset scale bar = 25μm
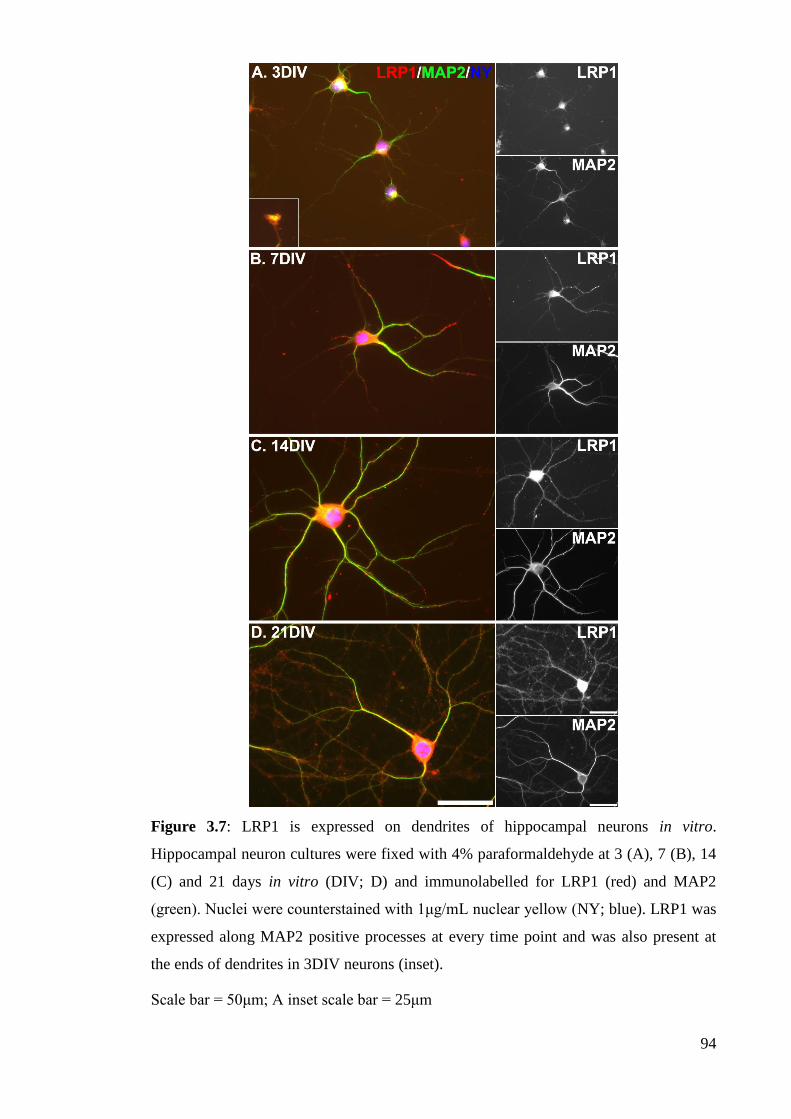
94
Figure 3.7: LRP1 is expressed on dendrites of hippocampal neurons in vitro.
Hippocampal neuron cultures were fixed with 4% paraformaldehyde at 3 (A), 7 (B), 14
(C) and 21 days in vitro (DIV; D) and immunolabelled for LRP1 (red) and MAP2
(green). Nuclei were counterstained with 1μg/mL nuclear yellow (NY; blue). LRP1 was
expressed along MAP2 positive processes at every time point and was also present at
the ends of dendrites in 3DIV neurons (inset).
Scale bar = 50μm; A inset scale bar = 25μm
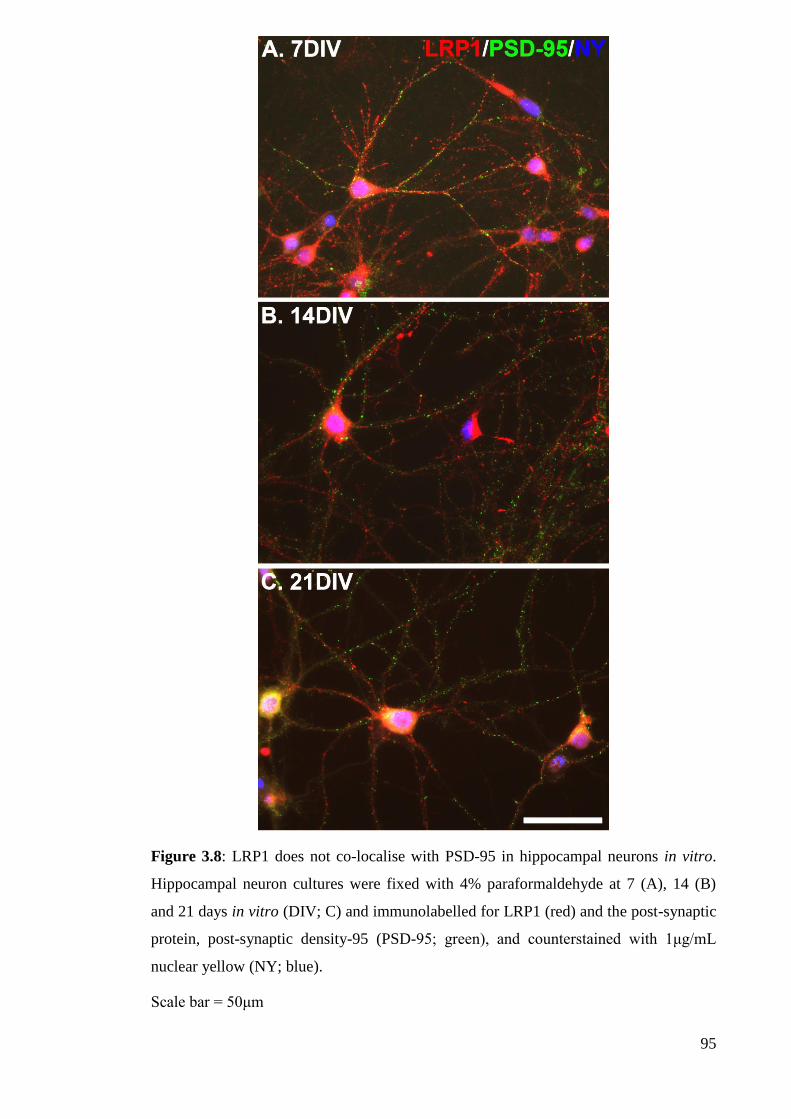
95
Figure 3.8: LRP1 does not co-localise with PSD-95 in hippocampal neurons in vitro.
Hippocampal neuron cultures were fixed with 4% paraformaldehyde at 7 (A), 14 (B)
and 21 days in vitro (DIV; C) and immunolabelled for LRP1 (red) and the post-synaptic
protein, post-synaptic density-95 (PSD-95; green), and counterstained with 1μg/mL
nuclear yellow (NY; blue).
Scale bar = 50μm
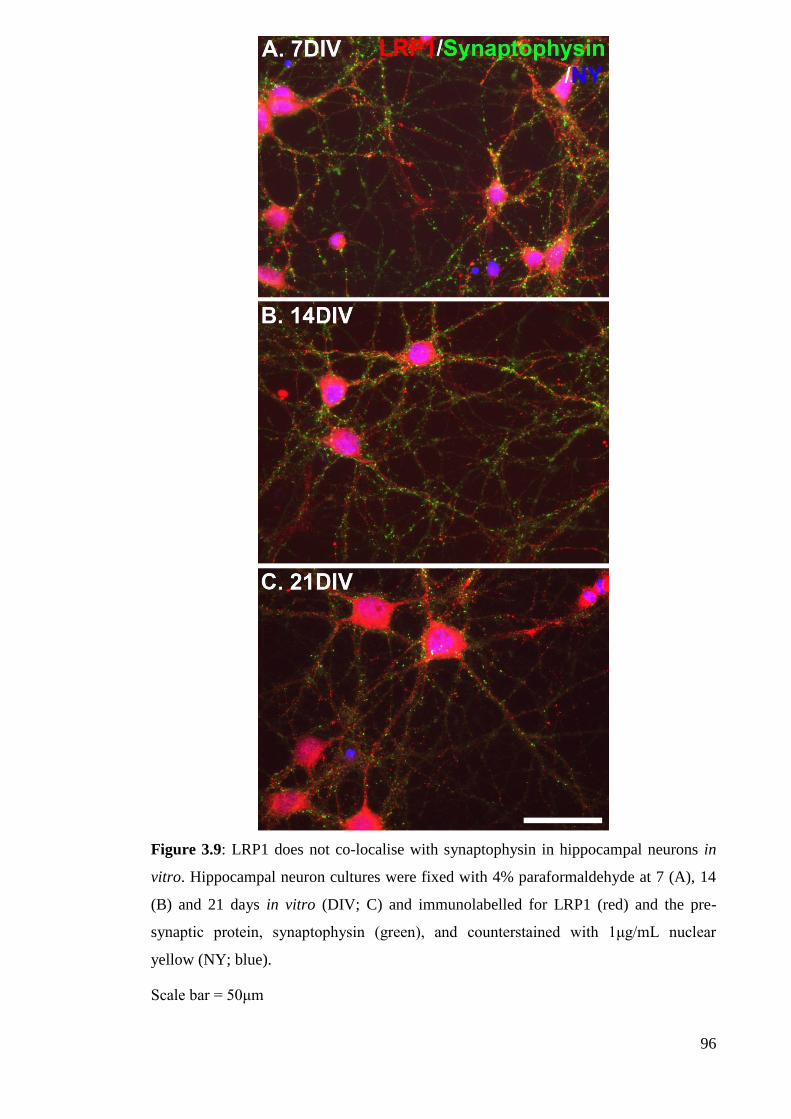
96
Figure 3.9: LRP1 does not co-localise with synaptophysin in hippocampal neurons in
vitro. Hippocampal neuron cultures were fixed with 4% paraformaldehyde at 7 (A), 14
(B) and 21 days in vitro (DIV; C) and immunolabelled for LRP1 (red) and the pre-
synaptic protein, synaptophysin (green), and counterstained with 1μg/mL nuclear
yellow (NY; blue).
Scale bar = 50μm
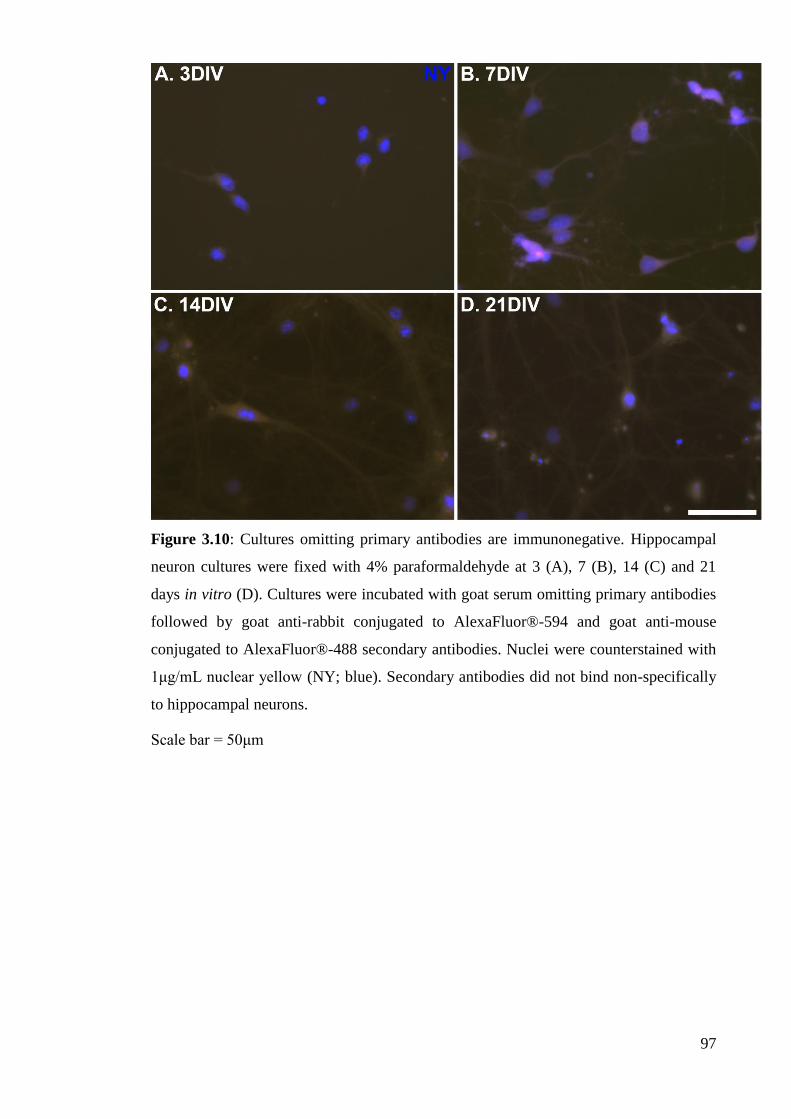
97
Figure 3.10: Cultures omitting primary antibodies are immunonegative. Hippocampal
neuron cultures were fixed with 4% paraformaldehyde at 3 (A), 7 (B), 14 (C) and 21
days in vitro (D). Cultures were incubated with goat serum omitting primary antibodies
followed by goat anti-rabbit conjugated to AlexaFluor®-594 and goat anti-mouse
conjugated to AlexaFluor®-488 secondary antibodies. Nuclei were counterstained with
1μg/mL nuclear yellow (NY; blue). Secondary antibodies did not bind non-specifically
to hippocampal neurons.
Scale bar = 50μm
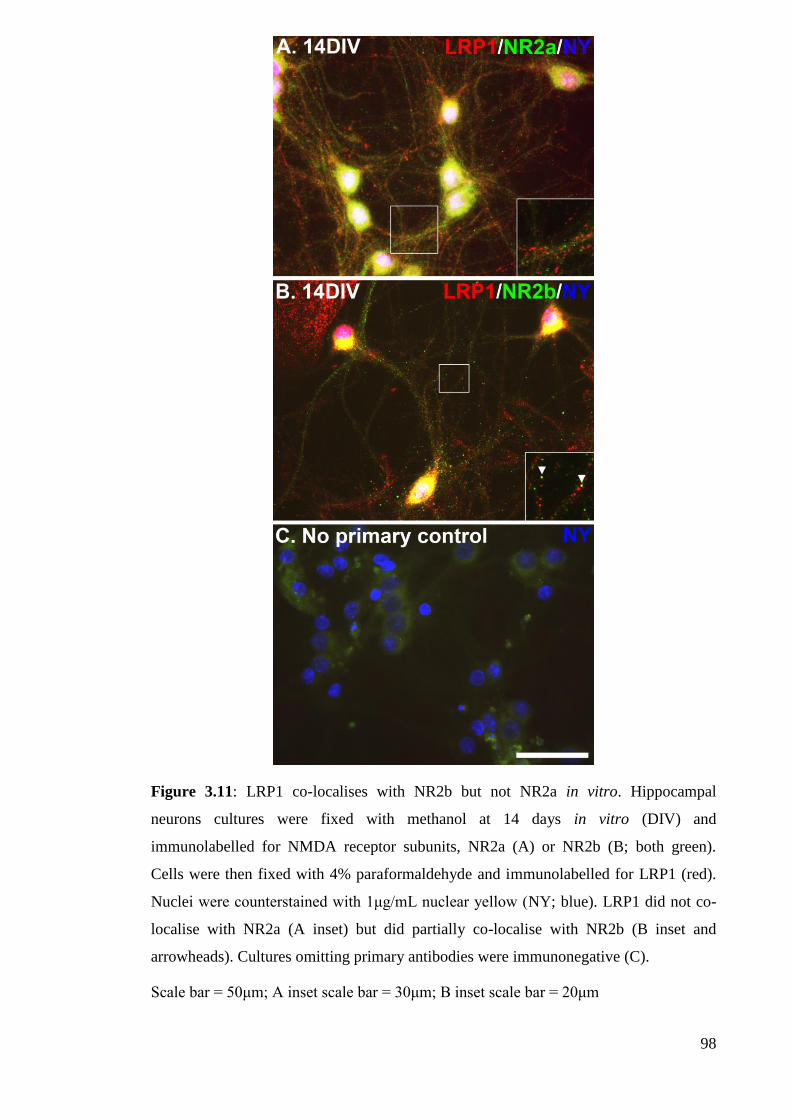
98
Figure 3.11: LRP1 co-localises with NR2b but not NR2a in vitro. Hippocampal
neurons cultures were fixed with methanol at 14 days in vitro (DIV) and
immunolabelled for NMDA receptor subunits, NR2a (A) or NR2b (B; both green).
Cells were then fixed with 4% paraformaldehyde and immunolabelled for LRP1 (red).
Nuclei were counterstained with 1μg/mL nuclear yellow (NY; blue). LRP1 did not co-
localise with NR2a (A inset) but did partially co-localise with NR2b (B inset and
arrowheads). Cultures omitting primary antibodies were immunonegative (C).
Scale bar = 50μm; A inset scale bar = 30μm; B inset scale bar = 20μm
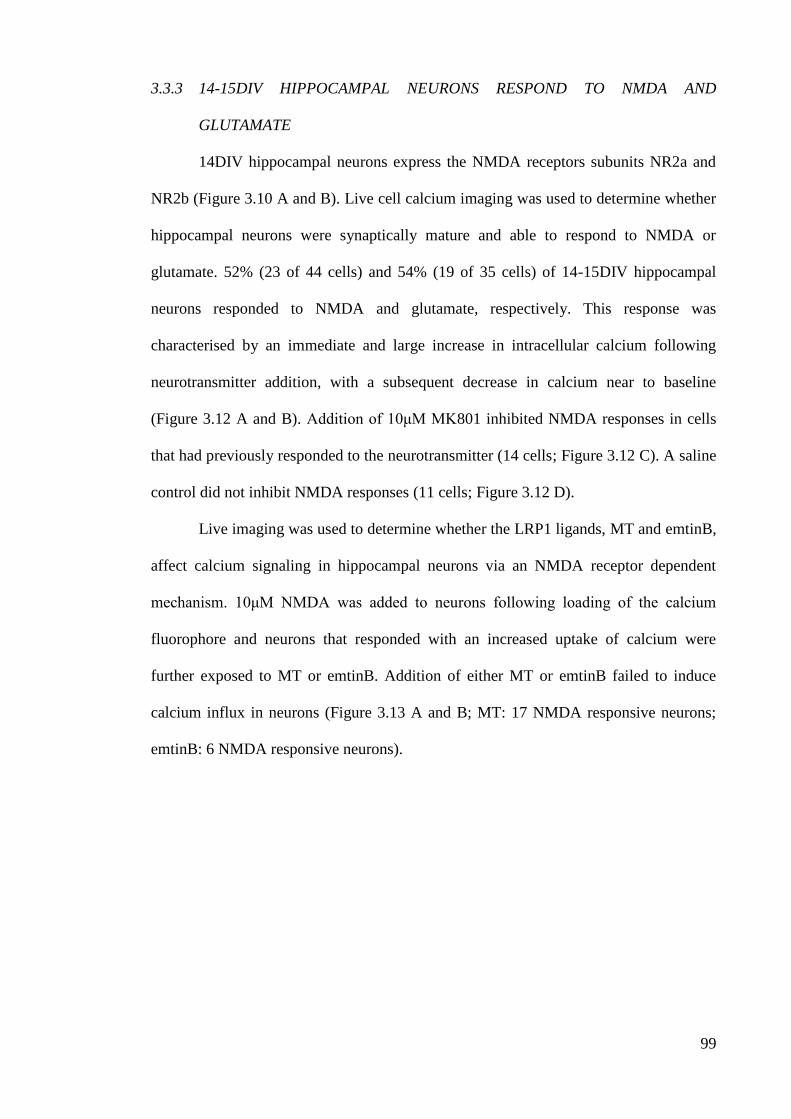
99
3.3.3 14-15DIV HIPPOCAMPAL NEURONS RESPOND TO NMDA AND
GLUTAMATE
14DIV hippocampal neurons express the NMDA receptors subunits NR2a and
NR2b (Figure 3.10 A and B). Live cell calcium imaging was used to determine whether
hippocampal neurons were synaptically mature and able to respond to NMDA or
glutamate. 52% (23 of 44 cells) and 54% (19 of 35 cells) of 14-15DIV hippocampal
neurons responded to NMDA and glutamate, respectively. This response was
characterised by an immediate and large increase in intracellular calcium following
neurotransmitter addition, with a subsequent decrease in calcium near to baseline
(Figure 3.12 A and B). Addition of 10μM MK801 inhibited NMDA responses in cells
that had previously responded to the neurotransmitter (14 cells; Figure 3.12 C). A saline
control did not inhibit NMDA responses (11 cells; Figure 3.12 D).
Live imaging was used to determine whether the LRP1 ligands, MT and emtinB,
affect calcium signaling in hippocampal neurons via an NMDA receptor dependent
mechanism. 10μM NMDA was added to neurons following loading of the calcium
fluorophore and neurons that responded with an increased uptake of calcium were
further exposed to MT or emtinB. Addition of either MT or emtinB failed to induce
calcium influx in neurons (Figure 3.13 A and B; MT: 17 NMDA responsive neurons;
emtinB: 6 NMDA responsive neurons).
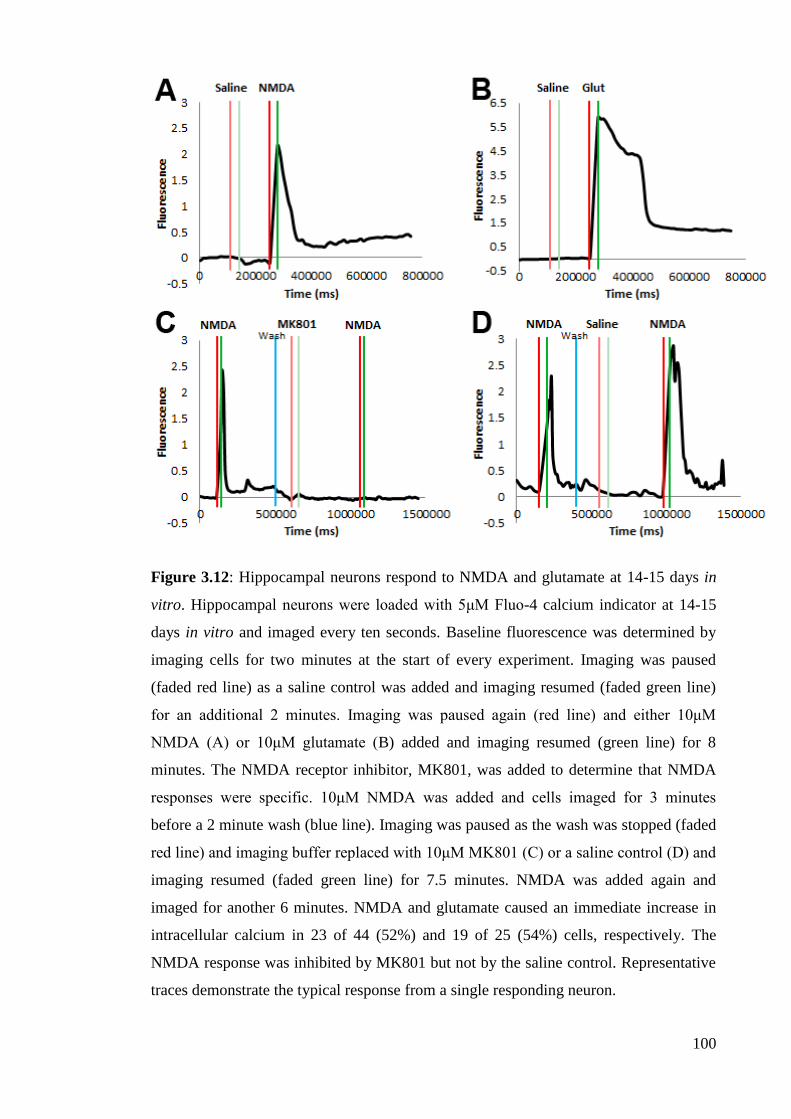
100
Figure 3.12: Hippocampal neurons respond to NMDA and glutamate at 14-15 days in
vitro. Hippocampal neurons were loaded with 5μM Fluo-4 calcium indicator at 14-15
days in vitro and imaged every ten seconds. Baseline fluorescence was determined by
imaging cells for two minutes at the start of every experiment. Imaging was paused
(faded red line) as a saline control was added and imaging resumed (faded green line)
for an additional 2 minutes. Imaging was paused again (red line) and either 10μM
NMDA (A) or 10μM glutamate (B) added and imaging resumed (green line) for 8
minutes. The NMDA receptor inhibitor, MK801, was added to determine that NMDA
responses were specific. 10μM NMDA was added and cells imaged for 3 minutes
before a 2 minute wash (blue line). Imaging was paused as the wash was stopped (faded
red line) and imaging buffer replaced with 10μM MK801 (C) or a saline control (D) and
imaging resumed (faded green line) for 7.5 minutes. NMDA was added again and
imaged for another 6 minutes. NMDA and glutamate caused an immediate increase in
intracellular calcium in 23 of 44 (52%) and 19 of 25 (54%) cells, respectively. The
NMDA response was inhibited by MK801 but not by the saline control. Representative
traces demonstrate the typical response from a single responding neuron.
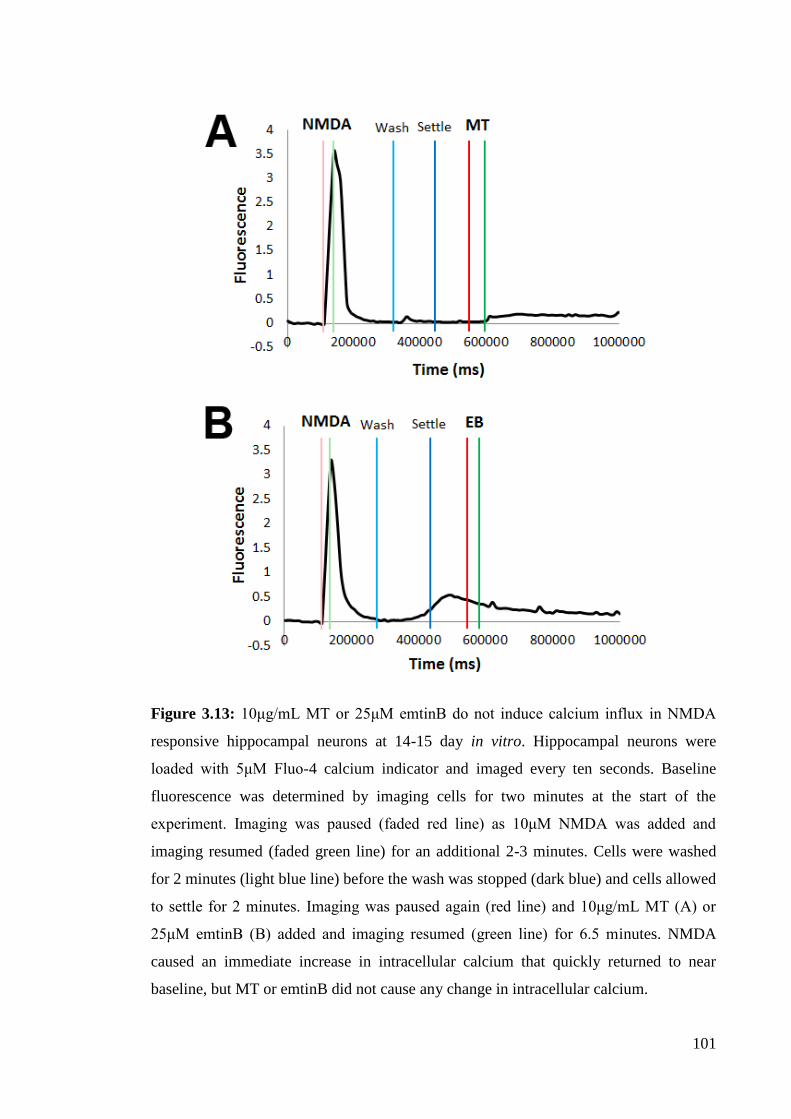
101
Figure 3.13: 10μg/mL MT or 25μM emtinB do not induce calcium influx in NMDA
responsive hippocampal neurons at 14-15 day in vitro. Hippocampal neurons were
loaded with 5μM Fluo-4 calcium indicator and imaged every ten seconds. Baseline
fluorescence was determined by imaging cells for two minutes at the start of the
experiment. Imaging was paused (faded red line) as 10μM NMDA was added and
imaging resumed (faded green line) for an additional 2-3 minutes. Cells were washed
for 2 minutes (light blue line) before the wash was stopped (dark blue) and cells allowed
to settle for 2 minutes. Imaging was paused again (red line) and 10μg/mL MT (A) or
25μM emtinB (B) added and imaging resumed (green line) for 6.5 minutes. NMDA
caused an immediate increase in intracellular calcium that quickly returned to near
baseline, but MT or emtinB did not cause any change in intracellular calcium.
102
DISCUSSION 3.4
Western blot and immunocytochemistry analysis have demonstrated expression of
LRP1 in hippocampal neurons cultures at 3, 7, 14 and 21DIV. The receptor was
expressed upon cell bodies and dendrites of all neurons at all time points. Expression of
LRP1 was present along and at the ends of axons of 3DIV neurons. Some axons at
7DIV were also LRP1 positive, but axons at 14DIV and 21DIV did not express the
receptor. LRP1 did not co-localise with pre- or post-synaptic proteins from 7DIV to
21DIV or with the NMDA receptor subunit NR2a at 14DIV. However, it did appear to
co-localise partially with the NR2b NMDA receptor subunit at 14DIV. About 50% of
hippocampal neurons at 14-15DIV responded to NMDA and glutamate by
demonstrating an immediate calcium influx following neurotransmitter addition and
were therefore deemed to be synaptically active. LRP1 ligands, MT and emtinB, did not
induce calcium influx in NMDA responsive neurons. LRP1 was also expressed on cell
bodies and processes of astrocytes, oligodendrocytes and microglia in hippocampal
neuron cultures.
3.4.1 THE CLEAVAGE PATTERN OF LRP1 CHANGES DURING MATURATION
OF HIPPOCAMPAL NEURON CULTURES
A number of LRP1 positive bands between ~37kDa and ~150kDa were detected
in hippocampal neuron cultures at 3, 7, 14 and 21DIV. As for in vivo western blots
(Chapter 2.3.1), the LRP1 antibody used targeted the C-terminal end of the intracellular
domain. Therefore, the different molecular weighted bands correspond to LRP1 light
chain forms that have undergone different post-translational modifications. Post-
translational modifications of LRP1 can include cleavage by β- and γ-secretase (May et
al., 2002, von Arnim et al., 2005), phosphorylation of NPxY motifs (Barnes et al., 2001,
Guttman et al., 2009) and glycosylation (Quinn et al., 1999, May et al., 2003).
103
Modification of LRP1 by these mechanisms regulates the receptors’ function by
affecting intracellular proteins ability to bind to it and the ability of the intracellular
domain to translocate to the nucleus (Trommsdorff et al., 1998, Gotthardt et al., 2000,
Kinoshita et al., 2003, Guttman et al., 2009).
Previous in vitro work with cerebellar granule neurons demonstrated
immunoreactivity on western blots at ~85kDa which corresponds to the LRP1 light
chain (Ambjørn et al., 2008). The ~85kDa band was the strongest band expressed in
hippocampal neuron cultures at every time point. Though the LRP1 light and heavy
chains are normally non-covalently bound to form a 600kDa product, these domains
most likely dissociate during western blot preparation, resulting in the detection of the
light chain. Bands at ~120kDa, ~130kDa and ~150kDa were observed in hippocampal
neuron cultures during maturation. As these bands have higher molecular weight than
the ~85kDa LRP1 light chain it is reasonable to assume that these forms of the
intracellular domain have undergone phosphorylation or glycosylation. Molecular
weight bands of LRP1 greater than ~85kDa have been observed in vivo previously
(Wolf et al., 1992). However, very few studies have used western blots to identify LRP1
expression in vitro. Of the studies that have used western blot analysis, the presence of
higher molecular weight bands was not mentioned (Ambjørn et al., 2008) or the
molecular weight of LRP1 positive bands observed were not mentioned at all (Hayashi
et al., 2007, Fuentealba et al., 2009).
LRP1 positive bands observed between ~37kDa and ~50kDa, being lower
molecular weight than the ~85kDa, are likely to be cleaved forms of the LRP1 light
chain. Cleavage of the extracellular domain of LRP1 by β-secretase releases a ~30kDa
fragment (von Arnim et al., 2005). This fragment can be further modified by
phosphorylation of the distal NPxY motif or glycosylation (Barnes et al., 2001, Guttman
et al., 2009). Glycosylation of the LRP1 light chain has been reported previously to
104
yield LRP1 positive fragments of ~55kDa from trophoblast cell lines (Quinn et al.,
1999). Therefore, glycosylation, and possibly phosphorylation, of the cleaved light
chain fragment could produce the bands observed between ~37kDa and ~50kDa.
Expression of the ~85kDa LRP1 band appeared weakest at 3DIV, but increased
and remained consistent from 7 to 21DIV. This is in contrast to in vivo data that
demonstrated greater expression of the ~85kDa fragment in P2 and P7 hippocampi
when compared to the adult rat hippocampus (Chapter 2.3.1). Hippocampal neurons
were cultured from embryonic day 17-18 rats. It may be that LRP1 expression is lower
at this stage of development than in P2 or P7 rats. However, northern blot analysis
demonstrates greater expression of LRP1 mRNA in embryonic day 18 and 21 rat brains
than in post-natal day 3 rat brain (Ishiguro et al., 1995). Whether this corresponds to
protein expression in hippocampal neurons is unknown. While mRNA expression of the
receptor throughout whole brain may be greater during embryonic development, protein
expression may be lower. In addition, the expression of LRP1 in the hippocampus
specifically may be lower in the embryo. Alternatively, the trauma of dissection and
dissociation during culture preparation may cause a reduction in LRP1 expression that
is recovered during the first week of culture.
A ~120kDa band was present in 3DIV and 7DIV cultures, but this band became
fainter in 14DIV and 21DIV cultures. The function of this fragment could be in initial
neurite outgrowth and establishment of neuronal networks throughout the culture. LRP1
can regulate neurite outgrowth in other neuron subtypes. Outgrowth of cerebellar
granule neurons is inhibited following 48 hours treatment with myelin associated
glycoprotein, an effect abolished by siRNA against LRP1 (Stiles et al., 2013). In
contrast, α2-macroglobulin promotes neurite outgrowth and increases LRP1 expression
in cortical neuron cultures, which is inhibited by RAP (Qiu et al., 2004, Shi et al.,
105
2009). Therefore, the ~120kDa LRP1 positive band in developing cultures may regulate
neurite outgrowth of hippocampal neurons.
At 14DIV there was the appearance of bands at ~37kDa, ~50kDa, ~130kDa and
~150kDa. The ~37kDa and ~50kDa bands became stronger at 21DIV though the
~130kDa and ~150kDa bands were weaker when compared to 14DIV. The appearance
of lower weight molecular bands in more mature hippocampal neuron cultures
corresponds to in vivo data. The presence of lower weight bands was observed in the
adult hippocampus but not in P2 or P7 hippocampus (Chapter 2.3.1). Hippocampal
neurons become increasingly synaptically mature from 14DIV to 21DIV and these
fragments may be involved in synaptic function of these neurons. Addition of tPA to
hippocampal neuron cultures induces NMDA receptor dependent calcium influx, which
is inhibited when LRP1 is dysfunctional (Martin et al., 2008). 48 hour treatment of
hippocampal neurons with α2-macroglobulin and lactoferrin inhibits NMDA mediated
calcium influx. This was abolished by RAP (Qiu et al., 2002). These findings
demonstrate the ability of LRP1 to regulate NMDA receptor activity. The low
molecular weight fragments present in 14DIV and 21DIV cultures that are not present at
3DIV or 7DIV may be involved in this function. However, from 14DIV the proportion
of neurons to glia drops significantly (14DIV: 40% neurons, 60% glia; 21DIV: 25%
neurons, 75% glia). This is due to proliferation of glia and apoptosis of neurons. It is
possible that these lower molecular weight forms are expressed in glia and become
stronger as the percentage of these cells increase. LRP1 regulates the ability of
astrocytes, oligodendrocytes and microglia to phagocytose myelin vesicles (Gaultier et
al., 2009). Microglia are also able to phagocytose apoptotic cerebellar granule neurons
following lipopolysaccharide and β-amyloid treatment (Fricker et al., 2012). Therefore,
low molecular weight fractions of LRP1 may be expressed in glia that are involved in
phagocytosis of apoptotic neurons as cultures age.
106
Changes in the post-translational modification of LRP1 during maturation in
culture partially reflect what is observed in the hippocampus in vivo. Though the precise
function of these LRP1 fractions is unknown, these data demonstrate a change in
function of the receptor as cultures develop. This indicates that investigation into the
role of LRP1 during neuronal maturation is possible in culture.
3.4.2 LRP1 IS EXPRESSED IN CELL BODIES AND PROCESSES OF
HIPPOCAMPAL NEURONS FROM 3 TO 21DIV
LRP1 was expressed upon cell bodies and dendrites of all hippocampal neurons
from 3DIV to 21DIV. The receptor was present along and at the ends of extending
axons at 3DIV but axonal expression was reduced in 7DIV neurons and absent in
14DIV and 21DIV cultures. This pattern of expression was consistent with previous
reports. Brown and colleagues (1997) demonstrated the presence of LRP1 on rat
hippocampal neuron cell bodies and processes from 1DIV. Axonal expression of LRP1
was present on axons of 3DIV, but only residual expression was found on 5DIV
cultures and was absent by 7-8DIV. From this time onwards LRP1 was restricted to
neuronal cell bodies, dendrites and dendritic spines. While Brown’s study found no
expression at 7DIV, the present data did demonstrate this, though to a lesser degree than
at 3DIV. These discrepancies could be due to technical differences such as the antibody
used. Otherwise, the expression pattern of LRP1 is consistent between the two studies
and demonstrates reproducibility of LRP1 expression in hippocampal neuron cultures.
LRP1 is expressed on hippocampal neuron cell bodies and apical segments of
dendrites in the adult rat brain (Chapter 2.3.2). Similarly, LRP1 is identified on
hippocampal neuron cell bodies and dendrites in vitro. However, dendritic expression is
also located at the distal ends of dendrites in vitro in both developing and mature
cultures. Hippocampal neurons in P2 rat brains displayed little dendritic LRP1
immunoreactivity, and P7 neurons had none. Cultures at 3DIV represent a stage of
107
development younger than P2 brains when neurites are extending through their
environment to form neuronal connections. This better represents embryonic
development and suggests that the receptor may be expressed along and at the ends of
neurites as they extend processes through the brain during this stage of development.
The expression of LRP1 at growth cones of extending hippocampal neuron dendrites at
3DIV suggests that the receptor may be involved in neurite extension.
LRP1 mediated neurite extension has been demonstrated in DRGs, cerebellar
granule cells and cortical neurons (Qiu et al., 2004, Stiles et al., 2013, Yamauchi et al.,
2013). Cortical neuron outgrowth is increased by 71% following 24 hours incubation
with α2-macroglobulin. Cerebellar granule neuron neurite outgrowth is almost 3 times
greater following 48 hour treatment with the ligand binding region of α2-macroglobulin.
Outgrowth in both these cell types was inhibited by RAP (Qiu et al., 2004, Shi et al.,
2009). In contrast, 48 hour treatment with myelin-associated glycoprotein inhibits
cerebellar granule neuron neurite length to 40% of untreated controls. These effects
were inhibited by RAP and siRNA against LRP1 (Stiles et al., 2013). These studies
demonstrate that LRP1 is able to both promote and inhibit neurite outgrowth. Both these
processes need to occur in order to establish functional neuronal connections and
suggest a role for LRP1 in regulation of developmental neurite outgrowth.
Expression of LRP1 in vitro was most prominent at the cell body, consistent
with in vivo observations. Its role at this subcellular location could be in neuronal
survival, in which it has been implicated previously. Hippocampal neurons are protected
from amyloid-β toxicity through treatment with apoE bound cholesterol, effects that are
inhibited by RAP and antibodies against LRP1 (Sen et al., 2012). ApoE3 and apoE4
bound lipoproteins promote retinal ganglionic cell survival following trophic
withdrawal and glutamate toxicity. Antibodies or siRNA against LRP1 suppressed this
protection (Hayashi et al., 2007, Hayashi et al., 2012). In addition, LRP1 knock-down in
108
mixed cortical and hippocampal neuron culture results in increased susceptibility to
trophic withdrawal mediated apoptosis and amyloid-β toxicity. However, knock-down
did not affect untreated neuron viability (Fuentealba et al., 2009). Therefore, LRP1 may
not be essential for survival of hippocampal neurons in healthy conditions, but becomes
vital in cases of stress. LRP1 may be expressed upon hippocampal neurons in culture to
inhibit their apoptosis in response to stressful or toxic stimuli.
In addition to expression at the cell body, LRP1 was immunoreactive along
dendrites at all time points in vitro. Dendrites receive and interpret incoming neuronal
signals, and LRP1 expression along these structures suggests that the receptor may be
involved in this process. The formation of mature hippocampal synapses in vitro begins
at about 12DIV and continues to 21DIV, though the construction of synapses begins as
early as 2DIV (Rao et al., 1998). The function of dendritic LRP1 could be in synaptic
function.
3.4.3 LRP1 DOES NOT CO-LOCALISE WITH PSD-95, SYNAPTOPHYSIN OR NR2A
BUT DOES PARTIALLY CO-LOCALISE WITH NR2B
LRP1 has been implicated in regulation of synaptic activity due to its ability to
associate with synaptic proteins and modulate calcium influx in neurons in response to
neurotransmitters. Previous studies have used immunoprecipitation and pull down
assays to demonstrate an association between LRP1 and PSD-95 (Gotthardt et al., 2000,
May et al., 2004), an interaction that may occur through binding of the LRP1 distal
NPxY motif to PSD-95. This in turn might lead to the association of LRP1 and the
NMDA receptor and may be how LRP1 regulates NMDA and glutamate mediated
calcium influx (Bacskai et al., 2000, Martin et al., 2008, Hayashi et al., 2012). In the
present study, LRP1 did not co-localise with PSD-95 or the pre-synaptic protein,
synaptophysin, in hippocampal neurons at 7, 14 or 21DIV, though this latter observation
was expected as LRP1 is not present on axons where pre-synaptic sites are located. The
109
association of LRP1 with PSD-95 is believed to lead to the interaction of LRP1 and the
NMDA receptor. May and colleagues (2004) found that LRP1 co-localised directly with
the NMDA receptor subunit, NR2a, in hippocampal neurons in vitro, though the age of
these cultures was not specified. LRP1 did not co-localise with NR2a in 14DIV
hippocampal neurons in the current culture model, which may be expected as it did not
associate with PSD-95. 14DIV was chosen as a time point to investigate LRP1 and
NMDA receptor interactions as hippocampal neurons begin to become synaptically
mature at about 12DIV, and full synaptic maturity occurs between 15-21DIV (Rao et
al., 1998). The age of May and colleagues’ (2004) hippocampal neurons in which co-
localisation occurred may have been at a later stage of synaptic maturity. Alternatively,
co-localisation of LRP1 with post-synaptic proteins may only occur when stimulated by
either a ligand or neurotransmitter such as NMDA or glutamate.
In hippocampal neurons, α2-macroglobulin has no immediate effect on calcium
influx upon addition, but 48 hours incubation with this ligand reduces NMDA mediated
calcium influx, effects inhibited by RAP (Qiu et al., 2002, Qiu et al., 2004). In contrast,
tPA directly stimulates NMDA receptor mediated calcium influx in hippocampal
neurons. This is inhibited by both RAP and mutation to the distal NPxY LRP1 motif
(Martin et al., 2008). These findings demonstrate that LRP1 regulation of NMDA
receptor mediated calcium influx is ligand specific and may provide some insight as to
why LRP1 and PSD-95 do not co-localise in unstimulated neurons. This interaction may
only occur when stimulated by a specific ligand. However, despite lack of co-
localisation with PSD-95 or NR2a, LRP1 did partially co-localise with the NR2b
subunit.
The NMDA receptor is a heterotetramic complex consisting of at least one NR1
subunit and one or more of the NR2 subunits, NR2a, NR2b, NR2c or NR2d (Moriyoshi
et al., 1991, Monyer et al., 1992, Ishii et al., 1993). NR2 subunits are defined by
110
different calcium kinetics and pharmacological properties and display development and
regional specificity (Ishii et al., 1993, Monyer et al., 1994, Vicini et al., 1998). During
development, NR2b is the predominant NR2 subunit expressed throughout the brain.
During post-natal maturation, expression of NR2a at synapses increases while NR2b
expression decreases at these sites (Liu et al., 2004). Excitatory post-synaptic currents
(EPSCs) produced by NR1/NR2a channels are shorter in duration than NR1/NR2b
channels. As the ratio of NR2a to NR2b channels increases during early post-natal
development, EPSC duration decreases (Flint et al., 1997, Stocca and Vicini, 1998,
Vicini et al., 1998, Lu et al., 2001). The longer duration EPSCs mediated by NR2b
channels are believed to be through association of the subunit with CaMKII. CaMKII is
activated by calcium influx following NMDA receptor activation and is essential for
initiation of long-term potentiation (Reymann et al., 1988, Malenka et al., 1989, Giese
et al., 1998). CaMKII has a lower affinity for binding to NR2a than NR2b (Leonard et
al., 1999). The shift in EPSC potential between NR2a and NR2b channels may be
associated with the decrease in synaptic plasticity between the immature and mature
brain (Sheng et al., 1994). The partial co-localisation of LRP1 with NR2b subunits
suggests that the receptor could have a role in developmental synaptic activity and
plasticity. However, in vivo data demonstrate expression of LRP1 at the apical segments
of dendrites in the adult brain but very little expression in dendrites of P2 and P7
hippocampal neurons (Chapter 2.3.2). In addition, co-localisation in vitro occurred at
14DIV when neuronal networks were reasonably mature. These findings argue against a
role for LRP1 in developmental synaptic function. However, it may have a role in NR2b
receptor function in the mature brain. Though NR2b is primarily expressed in
developing brains, it is present both synaptically and extrasynaptically in the mature
brain (Thomas et al., 2006).
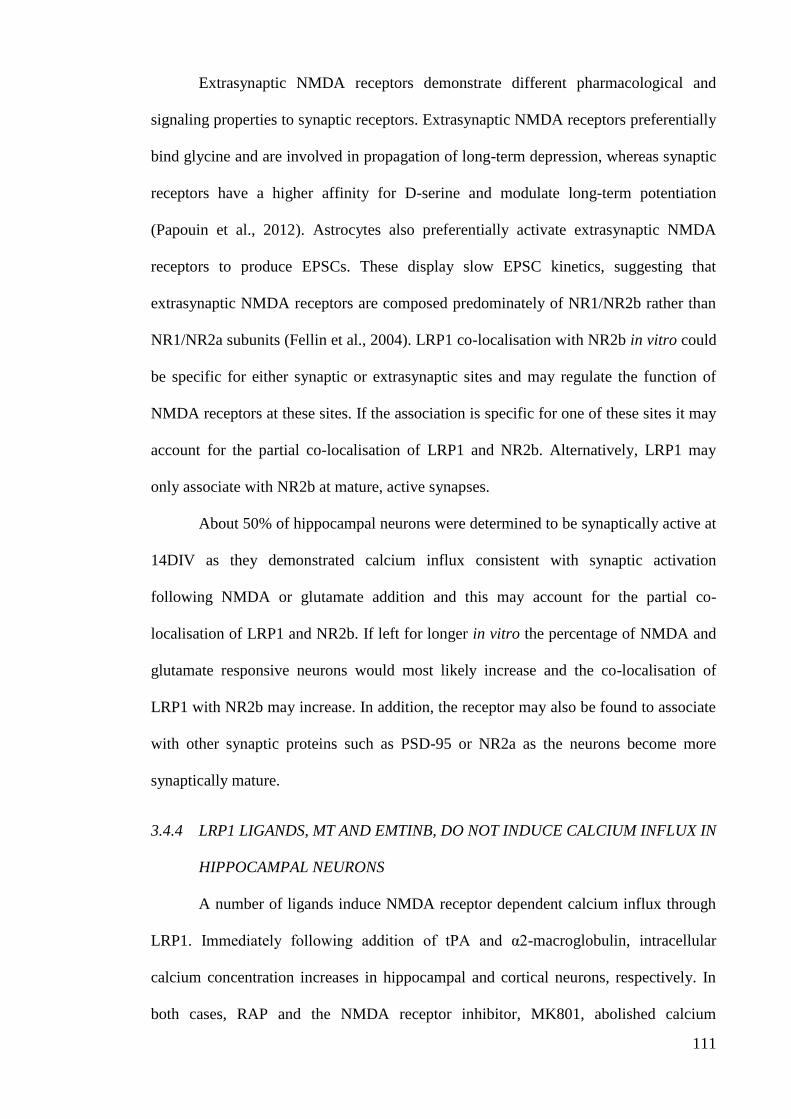
111
Extrasynaptic NMDA receptors demonstrate different pharmacological and
signaling properties to synaptic receptors. Extrasynaptic NMDA receptors preferentially
bind glycine and are involved in propagation of long-term depression, whereas synaptic
receptors have a higher affinity for D-serine and modulate long-term potentiation
(Papouin et al., 2012). Astrocytes also preferentially activate extrasynaptic NMDA
receptors to produce EPSCs. These display slow EPSC kinetics, suggesting that
extrasynaptic NMDA receptors are composed predominately of NR1/NR2b rather than
NR1/NR2a subunits (Fellin et al., 2004). LRP1 co-localisation with NR2b in vitro could
be specific for either synaptic or extrasynaptic sites and may regulate the function of
NMDA receptors at these sites. If the association is specific for one of these sites it may
account for the partial co-localisation of LRP1 and NR2b. Alternatively, LRP1 may
only associate with NR2b at mature, active synapses.
About 50% of hippocampal neurons were determined to be synaptically active at
14DIV as they demonstrated calcium influx consistent with synaptic activation
following NMDA or glutamate addition and this may account for the partial co-
localisation of LRP1 and NR2b. If left for longer in vitro the percentage of NMDA and
glutamate responsive neurons would most likely increase and the co-localisation of
LRP1 with NR2b may increase. In addition, the receptor may also be found to associate
with other synaptic proteins such as PSD-95 or NR2a as the neurons become more
synaptically mature.
3.4.4 LRP1 LIGANDS, MT AND EMTINB, DO NOT INDUCE CALCIUM INFLUX IN
HIPPOCAMPAL NEURONS
A number of ligands induce NMDA receptor dependent calcium influx through
LRP1. Immediately following addition of tPA and α2-macroglobulin, intracellular
calcium concentration increases in hippocampal and cortical neurons, respectively. In
both cases, RAP and the NMDA receptor inhibitor, MK801, abolished calcium
112
responses (Bacskai et al., 2000, Martin et al., 2008). Another LRP1 ligand, MT, is also
able to regulate calcium signaling via the receptor. Calcium concentration in dorsal root
ganglion growth cones is increased following addition of MT, effects inhibited by
siRNA against LRP1 (Landowski et al., 2012). However, both ligands failed to induce
any calcium response in NMDA responsive hippocampal neurons.
The effects of LRP1 ligands on calcium signaling appear to be both ligand and
cell specific. tPA induces an immediate LRP1 and NMDA receptor dependent calcium
response in hippocampal neurons but has no immediate effect on cortical neurons
(Martin et al., 2008, Samson et al., 2008). A similar effect is observed for α2-
macroglobulin which induces an immediate calcium influx following addition to
cortical neurons but not hippocampal neurons (Bacskai et al., 2000, Qiu et al., 2002).
Interestingly, chronic treatment with α2-macroglobulin for up to 48 hours reduced
NMDA mediated calcium influx in hippocampal neurons (Qiu et al., 2002). Lactoferrin
also inhibits hippocampal neuron NMDA receptor dependent calcium influx following
48 hour incubation, but has no direct effect on calcium concentration in cortical neurons
(Bacskai et al., 2000, Qiu et al., 2002). Therefore, while MT and emtinB may not
induce an immediate calcium response in hippocampal neurons, they could directly
affect calcium influx in other neurons such as cortical neurons.
3.4.5 LRP1 EXPRESSION IN ASTROCYTES, OLIGODENDROCYTES AND
MICROGLIA OF HIPPOCAMPAL NEURON CULTURES
LRP1 was expressed in the cell bodies and processes of astrocytes,
oligodendrocytes and microglia in hippocampal neuron cultures from 3 to 21DIV. This
is consistent with data demonstrating that LRP1 is expressed on glia in vivo throughout
development (Chapter 2.3.2). Astrocytes, oligodendrocytes and microglia have been
found to express LRP1 in vitro previously (Marzolo et al., 2000, Gaultier et al., 2009).
113
The few studies that have investigated the role of LRP1 in glia in vitro have provided
evidence that the receptor regulates phagocytosis and immune responses in these cells.
Astrocytes, oligodendrocytes and microglia are all able to phagocytose myelin
vesicles by a LRP1 dependent mechanism (Gaultier et al., 2009). A microglial cell line
phagocytoses heat shock treated necrotic oligodendrocytes, an effect that is reduced by
35% when microglia were pre-treated with RAP. In addition, LRP1 is able to bind
components of myelin normally located intracellularly (Fernandez-Castaneda et al.,
2013). This demonstrates a role of the receptor in recognising and removing necrotic
cell debris from the extracellular environment. The function of the receptor on microglia
in vitro could be in the removal of cell debris caused by culture preparation and
apoptotic neurons. This is supported by data that demonstrate the ability for microglia to
phagocytose cerebellar granule neurons in response to lipopolysaccharide or amyloid-β
induced apoptosis. These effects were inhibited by both RAP and antibodies against
LRP1 (Fricker et al., 2012).
The expression of LRP1 in microglia in hippocampal neuron cultures was
heterogeneous and did not appear to be specific to different cell morphologies. Some
cells expressed LRP1 strongly while others only expressed the receptor faintly.
Heterogeneous expression of LRP1 in microglia in vivo was not observed, but it may be
that immunohistochemistry was not sensitive enough to detect this. The expression of
LRP1 in microglia in vitro is in agreement with previous work that demonstrates
heterogeneous expression of LRP1 in pure microglia cultures. In this same study,
treatment with the anti-inflammatory agent dexamethasone increased LRP1 expression,
which subsequently became homogeneous. Treatment with pro-inflammatory agents
lipopolysaccharide and interferon-γ reduced LRP1 expression (Marzolo et al., 2000).
These findings demonstrate the ability of LRP1 to respond to inflammatory factors and
possibly contribute to an immune response. Microglia activation is response to
114
lipopolysaccharide can also be promoted by the LRP1 ligand tPA. Activation of tPA-
deficient microglia in cortical neuron cultures is inhibited, demonstrated by decreased
activated morphology and tumour necrosis factor-α secretion (Rogove et al., 1999).
These data demonstrate that microglial LRP1 is able to respond to inflammatory
mediators in vitro, and that in some instances this could be through stimulation by
ligands such as tPA. These in vitro findings support a role of LRP1 in microglial
mediated immune responses.
Few studies have investigated the function of LRP1 in astrocytes previously.
Expression of LRP1 is decreased in astrocytes when incubated with lipopolysaccharide
and interferon-γ in combination. However, there was no change in expression following
treatment with either of these inflammatory agents alone or with dexamethasone
(Marzolo et al., 2000). Therefore, LRP1 could be involved in astrocyte responses in
strong pro-inflammatory conditions. Astrocytes are also involved in neurotransmission
and release glutamate following calcium influx (Parpura et al., 1994). Though LRP1 is
able to regulate calcium influx in neurons (Bacskai et al., 2000, Qiu et al., 2002, Martin
et al., 2008, Hayashi et al., 2012), whether it does this in astrocytes to modulate
glutamate release of these cells is unknown.
The function of LRP1 in oligodendrocytes of hippocampal neuron cultures may
not be in phagocytosis. Oligodendrocytes that phagocytosed myelin vesicles in previous
work were identified as CNPase positive (Gaultier et al., 2009). CNPase is an enzyme
involved in myelin synthesis (Kim and Pleasure, 1978), and is expressed at a more
maturate stage of differentiation than the oligodendrocyte appear to be in the present
culture model. The establishment of hippocampal neuron and oligodendrocyte co-
culture to study myelination requires the addition of oligodendrocytes to 14DIV neurons
and the subsequent maturation of cells for up to 21 days (Gardner et al., 2012). It is
therefore unlikely that oligodendrocytes in the current culture model are actively
115
myelinating hippocampal neurons. By determining the maturation stage of
oligodendrocytes using markers other than olig2, such as CNPase, and labelling cultures
for myelin would confirm whether this is the case. Oligodendrocytes appear to
proliferate as cultures mature, suggesting that the majority of them are progenitor cells
as more mature oligodendrocytes do not proliferate (reviewed by (Baumann and Pham-
Dinh, 2001)). Whether LRP1 is involved in regulating proliferation of these cells is
unknown. Given that LRP promotes Schwann cell migration (Mantuano et al., 2010) it
is more likely that the receptor is involved in oligodendrocyte progenitor cell migration,
an important function of these cells if they are to connect to and myelinate neurons.
116
CONCLUSIONS 3.5
LRP1 is expressed in hippocampal neuron cultures at 3, 7, 14 and 21DIV. The
post-translational modifications of the receptor changes as the cultures mature. These
differences may reflect changes in regulation of the receptor during neuron and glia
maturation.
Immunoreactivity is present along and at the ends of axons and dendrites of
3DIV neurons, suggesting a function of the receptor in developmental neurite
outgrowth. LRP1 expression is reduced in axons of 7DIV and absent from 14DIV and
21DIV cultures. Localisation of LRP1 remains at the cell body and along dendrites at all
time points where it may have a role in neuronal survival or synaptic signaling.
However, LRP1 did not co-localise with PSD-95 or synaptophysin at any time point, or
with NR2a at 14DIV. Partial co-localisation with NR2b was observed at 14DIV,
suggesting it may be involved in synaptic activity of these NMDA receptors. 50% of
hippocampal neurons were synaptically active, demonstrated by responses to NMDA
and glutamate. Older cultures that are completely synaptically active may demonstrate
greater co-localisation of LRP1 with NR2b and possibly with other synaptic proteins. In
addition, stimulating neurons with neurotransmitters or LRP1 ligands may induce co-
localisation with other synaptic proteins. LRP1 was also expressed upon astrocytes,
oligodendrocytes and microglia in vitro, supporting in vivo data and implicating a
function for the receptor in these cells.
LRP1 ligands have been found to induce calcium influx in cortical and
hippocampal neurons previously in an NMDA receptor dependent manner. However,
two LRP1 ligands that affect calcium signaling in dorsal root ganglion growth cones,
MT and emtinB, did not induce calcium influx in hippocampal neurons.
The subcellular expression of LRP1 in hippocampal neurons adds further
support for a role of the receptor in neuronal biology. This may be in neurite outgrowth,

117
neuronal survival or functioning of NR2b containing NMDA receptors. Establishing
and characterising an in vitro neuron model of LRP1 expression allows further
investigation into the receptor’s function in processes such as neurite outgrowth, injury,
toxicity or synaptic function.
118
4 Chapter 4: Effects of the LRP1 ligands, MT and emtinB, on
hippocampal neurite extension following scratch injury
INTRODUCTION 4.1
LRP1 is expressed on rat hippocampal neurons both in vivo and in vitro as
reported in chapters 2 and 3 respectively. The receptor is expressed in the cell body and
dendrites of hippocampal neurons at 3, 7, 14 and 21DIV. LRP1 expression on axons is
present at 3DIV, reduced at 7DIV and absent from 14DIV and 21DIV cultures. The
presence of LRP1 at the ends of extending neurites in 3DIV cultures suggests that it is
involved in hippocampal neurite outgrowth during development (Chapter 3.3.2). Given
that LRP1 is expressed at ends of developing neurites, it could also be expressed in
regenerating neurites following injury. This is suggested by previous work which
demonstrates that LRP1 is necessary for apoE containing lipoprotein mediated axon
extension of axotomised retinal ganglion cells. Addition of apoE containing lipoproteins
promoted axon extension by 50%, but only when applied to axons. When applied to cell
bodies axon extension was the same as for controls (Hayashi et al., 2004, Matsuo et al.,
2011). This is evidence that LRP1 located on injured axons mediates neurite extension.
Another LRP1 ligand, MT, is also able to promote neurite regeneration
following injury. MT increases the average length of cortical neurites 12 hours after
scratch injury from 41.5 ± 1.7μm to 70.1 ± 3.4μm. Regeneration of in vivo cortical
needlestick injury after 4 days is also enhanced with application of MT (Chung et al.,
2003). MT also increases regenerative sprout length of dorsal root ganglion cells by
66% when applied to axons following scratch injury. Addition of MT to cell bodies
produced an even greater increase in sprout length by almost fourfold (Leung et al.,
2011). Whether MT promotes regeneration of hippocampal neurites following scratch
injury is unknown. 24 hour treatment with MT enhances hippocampal neurite extension
119
by 1.6 times that of controls (Køhler et al., 2003). Therefore, it is conceivable that it
may have an effect on hippocampal outgrowth following injury.
EmtinB, a synthetic peptide modeled after the C-terminus of the MT β-domain
(Figure 4.1), also promotes neurite outgrowth, but whether it promotes regeneration
following injury is unknown. 24 hour treatment with emtinB increases neurite length of
hippocampal and cerebellar granule neurons by 7 and 3 times that of controls,
respectively (Ambjørn et al., 2008, Sonn et al., 2010). Investigating whether this peptide
has an effect on neurite regeneration may be of therapeutic importance as emtinB is able
to cross the blood brain barrier (Sonn et al., 2010) and could be used to promote neuron
function following brain injury.
I hypothesise that (1) LRP1 is expressed at the ends of regenerating neurites
following scratch injury in hippocampal neuron cultures; and (2) the LRP1 ligands, MT
and emtinB, promote extension of neurites following scratch injury.
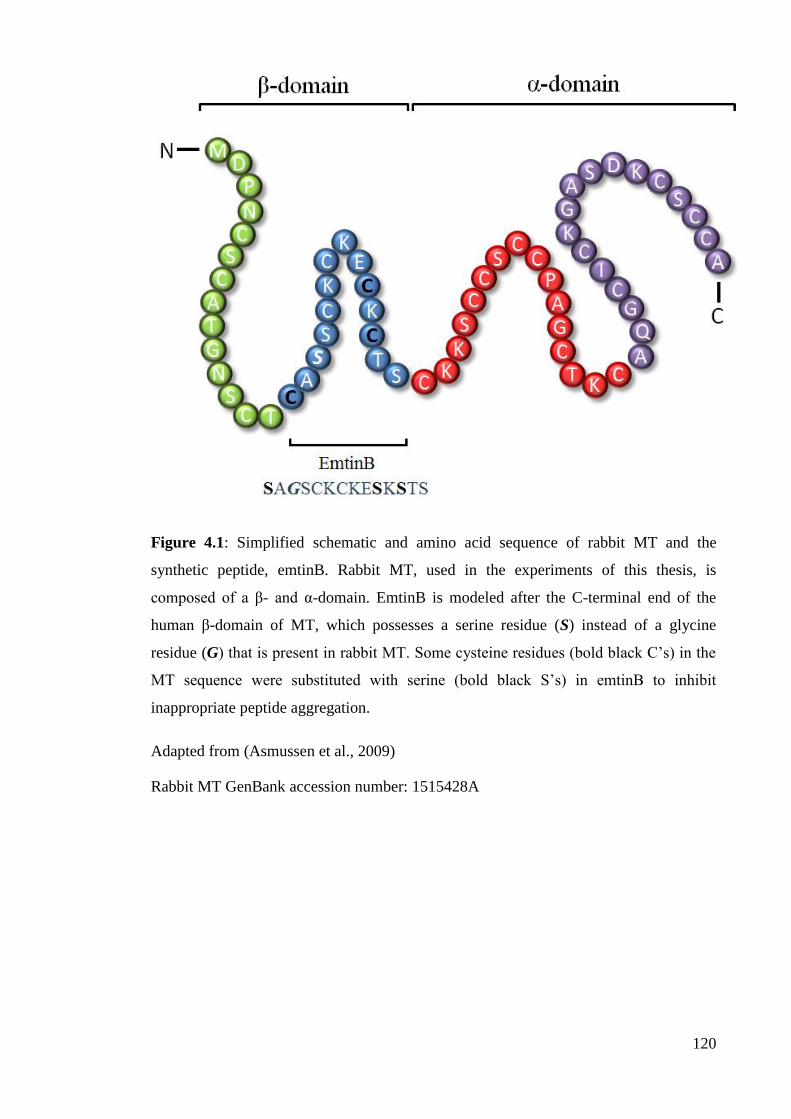
120
Figure 4.1: Simplified schematic and amino acid sequence of rabbit MT and the
synthetic peptide, emtinB. Rabbit MT, used in the experiments of this thesis, is
composed of a β- and α-domain. EmtinB is modeled after the C-terminal end of the
human β-domain of MT, which possesses a serine residue (S) instead of a glycine
residue (G) that is present in rabbit MT. Some cysteine residues (bold black C’s) in the
MT sequence were substituted with serine (bold black S’s) in emtinB to inhibit
inappropriate peptide aggregation.
Adapted from (Asmussen et al., 2009)
Rabbit MT GenBank accession number: 1515428A
121
METHODS 4.2
All experiments involving the use of animals were approved by the Animal
Experimentation Ethics Committee of the University of Tasmania (ethics number
A0011957), which is in accordance with the Australian Code of Practice for the Care
and Use of Animals for Scientific Purposes.
Buffer recipes and product information for all reagents can be found in
appendices.
4.2.1 PRIMARY HIPPOCAMPAL NEURON CULTURE
Primary hippocampal neuron cultures were prepared from embryonic day 17/18
Sprague Dawley rats as described previously (Chapter 3.2.1). Briefly, hippocampi were
dissected from embryos and trypsinised using 0.1% trypsin in HBSS at 37°C for 5
minutes. Following trypsin removal, cells were resuspended in 1mL Neurobasal with
10% foetal calf serum and dissociated by pipette. Cells were counted using Trypan Blue
exclusion and plated at 5x10⁴ cells/well on 13mm nitric acid etched glass coverslips
coated overnight with neat poly-L-lysine in 24 well plates. A full media change to
serum free Neurobasal media was conducted 24 hours after plating and every three to
four days thereafter. Cultures were maintained at 37°C in humidified air with 5%
carbon dioxide.
4.2.2 SCRATCH INJURY AND IMMUNOCYTOCHEMISTRY
Scratch injury was performed on hippocampal neuron cultures at 6DIV and
13DIV using a fine goniotomy knife (Kaisers). Two scratches were made to form an ‘X’
across each coverslip (Figure 4.2). Cells were fixed either immediately after injury or 24
hours later at 7DIV or 14DIV with 4% paraformaldehyde for 15-20 minutes at room
temperature. All coverslips were stored at 4°C in PBS with 0.01% sodium azide.
Cells were protein blocked using 10% goat serum in 0.03% triton X-100 in PBS
for 30 minutes at room temperature to inhibit non-specific antibody binding. To assess
122
whether LRP1 was expressed on regenerating neurites, rabbit polyclonal anti-LRP1
antibodies were incubated with mouse monoclonal antibodies against axons and
dendrites. These were either anti-tau, which labels hippocampal neuron cell bodies,
dendrites and axons (Dotti et al., 1987), anti-SMI-312, which specifically labels
phosphorylated axons (Masliah et al., 1993), or anti-MAP2 antibodies, which
specifically labels dendrites (Matus et al., 1981). To determine whether tau positive
neurites that extended into or along the scratch injury site were primarily axons or
dendrites, rabbit polyclonal anti-tau antibodies and mouse monoclonal anti-SMI-312 or
anti-MAP2 antibodies were incubated with cultures. All primary antibodies were diluted
together in 10% goat serum in PBS with 0.03% triton X-100 and incubated with
cultures for 1 hour at room temperature and overnight at 4°C. Next, cultures were
incubated with goat anti-rabbit AlexaFluor®-594 and goat anti-mouse AlexaFluor®-
488 secondary antibodies (both Molecular Probes, USA) for one hour at room
temperature before counterstaining with 1μg/ml nuclear yellow. Coverslips were
washed three times by gentle shaking in PBS for 5 minutes following each antibody
incubation. Coverslips were mounted to slides using fluorescent mounting media and
dried overnight. At least 1 coverslip from 3 separate cultures were prepared for each
antibody combination.
Photographs of scratch injuries were taken using an Olympus BX50 microscope
and Photomatrix Cool Snap HQ2 camera. Photographs of 7DIV and 14DIV cultures 24
hours after scratch injury were taken at 60X objective to assess LRP1 expression at
extending neurites. Representative images of cultures 0 or 24 hours after injury at 6DIV
or 7DIV, respectively, were captured at 20X objective. All images were uniformly
enhanced and analysed using Adobe Photoshop (v11.0.2).
Whether the LRP1 ligands MT and emtinB promote neurite extension following
injury was investigated. 10μg/mL MT has been shown to promote neurite outgrowth
123
previously (Køhler et al., 2003, Fitzgerald et al., 2007, Ambjørn et al., 2008, Chung et
al., 2008). Our lab has demonstrated that 25μM emtinB ameliorates β-amyloid toxicity
in 7DIV hippocampal neuron cultures (Eaton et al., 2012). Concentrations between 200-
500nM RAP have been used previously to inhibit LRP1 mediated neurite outgrowth and
regeneration (Hayashi et al., 2004, Qiu et al., 2004, Stiles et al., 2013). Therefore, 6DIV
cultures were treated with 10μg/mL MT (equivalent to 1.5μM), 25μM emtinB
(equivalent to 75μg/mL) or the equivalent volume of saline with or without 500nM
RAP (Progen Biotechnik, Germany) immediately prior to the injury. For each treatment
2-3 coverslips were prepared from 3 separate cultures.
Cultures were protein blocked and underwent immunocytochemistry as
described above. Briefly, rabbit polyclonal anti-LRP1 and mouse monoclonal anti-tau
antibodies were diluted together in 10% goat serum in PBS with 0.03% triton X-100 for
1 hour at room temperature and then overnight at 4°C. Cultures were then incubated
with goat anti-rabbit AlexaFluor®-594 and goat anti-mouse AlexaFluor®-488
secondary antibodies, counterstained with nuclear yellow, mounted and dried overnight.
Counts for tau positive neurites were analysed from 3 photographs taken at 10X
objective in each direction extending from where the two scratch injuries intersected
(Figure 4.2). All images were uniformly enhanced and analysed using Adobe Photoshop
(v11.0.2).
The majority of neurites were cleanly cut immediately after scratch injury
(Figure 4.6 A), and therefore neurites that extended along or entered the injury site 24
hours later were counted as regenerating neurites. It is likely that poly-L-lysine substrate
was removed from the coverslip during scratch injury, inhibiting neurite extension
across the injury site. As growth across the injury site was impeded, neurites instead
extended along the side of the injury. It was difficult to accurately track and measure
most individual neurites as they joined and clumped, so quantitation of neurite

124
extension was conducted by counting the numbers of neurites that extended along or
entered the injury site. Neurites were counted blind by one observer and converted to
neurites per cm of injury site. Data analysis was performed using Microsoft Excel
(v14.0.7015.1000). Data for cultures treated with MT and emtinB were pooled
separately and statistics performed using single factor ANOVA. Statistically significant
results were indicated by p<0.05. Data were expressed as averages ± standard error of
the mean.
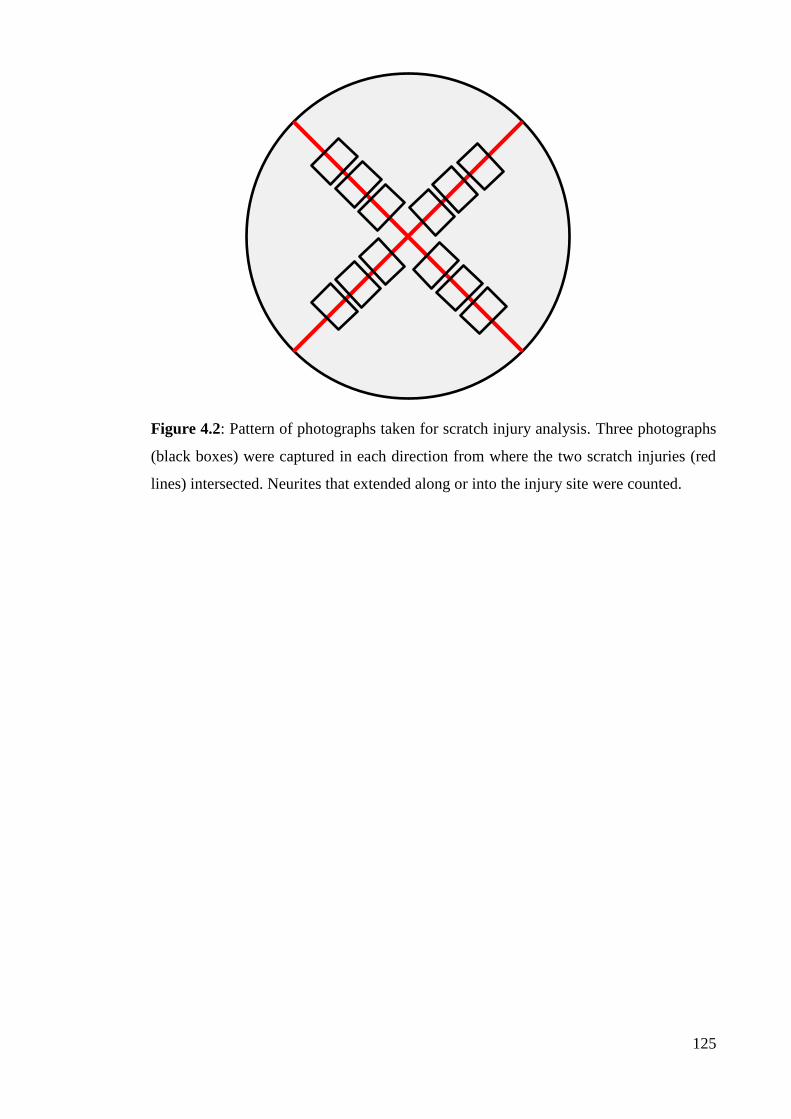
125
Figure 4.2: Pattern of photographs taken for scratch injury analysis. Three photographs
(black boxes) were captured in each direction from where the two scratch injuries (red
lines) intersected. Neurites that extended along or into the injury site were counted.
126
RESULTS 4.3
4.3.1 THE MAJORITY OF REGENERATING TAU POSITIVE NEURITES ARE
AXONS AND EXPRESS LRP1
The majority of tau positive neurites were cut cleanly immediately following
scratch injury at 6DIV, though some did appear to be ‘dragged’ slightly along the injury
site (Figure 4.3 A). 24 hours after injury some neurites touched, extended along or
entered the injury site (Figure 4.3 B). To determine whether these neurites were axons
or dendrites, cells were immunolabelled for tau and SMI-312 or MAP2 respectively.
The majority of tau positive neurites that extended along or into the injury site were
SMI-312 positive (Figure 4.4 A), but very few were immunoreactive for MAP2 (Figure
4.4 B). These results demonstrate that the majority of tau positive neurites that extended
along or into the scratch injury site 24 hours after injury were axons.
LRP1 was expressed along and at the ends of most, but not all, tau and SMI-312
positive neurites that extended along or into the scratch injury site at 7DIV (Figure 4.5
A and B). LRP1 immunoreactivity was similar in both tau and SMI-312 positive
neurites. Intensity of LRP1 staining was faint along most extending axons, similar to
immunoreactivity observed in axons of uninjured cultures. Expression at the growth
cone was strong and comparable to LRP1 immunoreactivity detected in dendrites of
uninjured cultures. A greater number of axons appeared to express LRP1 in injured
cultures compared to uninjured cultures. Some extending tau positive neurites
demonstrated LRP1 immunoreactivity at 14DIV (Figure 4.5 C), but the majority did
not. Neurites that were LRP1 positive demonstrated faint staining when compared to
cell body and dendritic staining of uninjured 14DIV neurons. LRP1 positive neurites
that extended across the injury site were not MAP2 positive at 7DIV (Figure 4.6). These
results demonstrate that LRP1 is expressed at growth cones of regenerating
hippocampal neuron axons following injury.
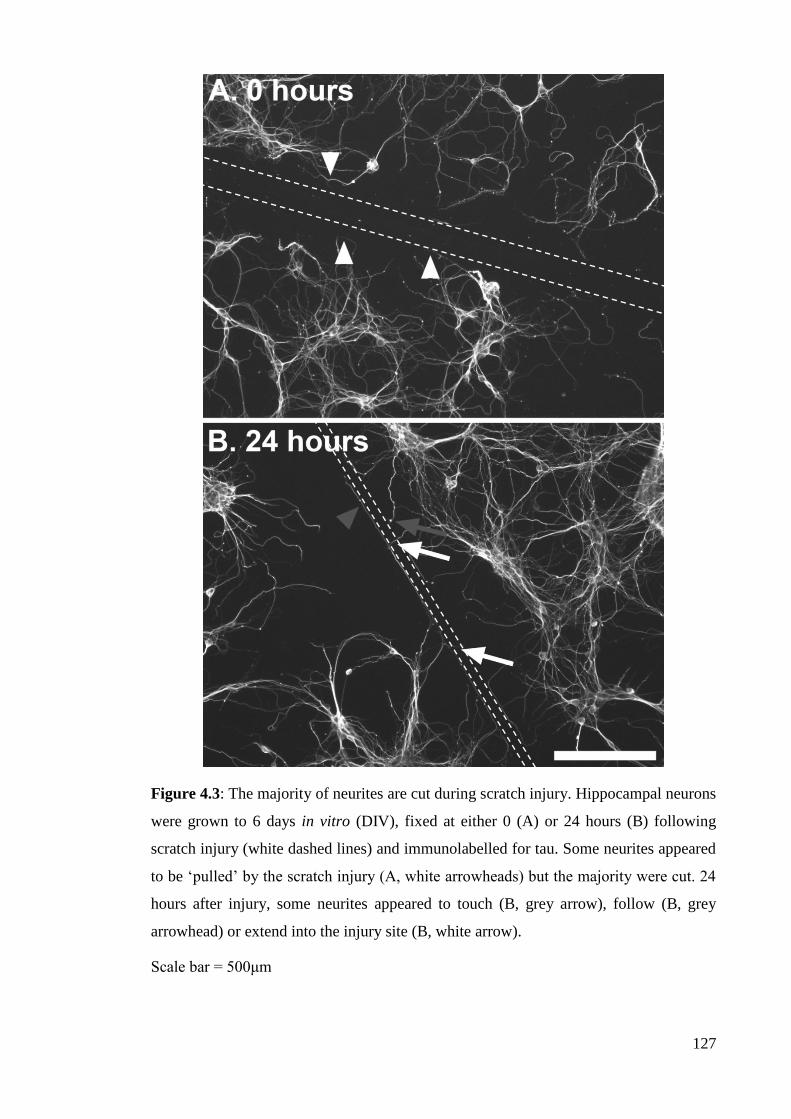
127
Figure 4.3: The majority of neurites are cut during scratch injury. Hippocampal neurons
were grown to 6 days in vitro (DIV), fixed at either 0 (A) or 24 hours (B) following
scratch injury (white dashed lines) and immunolabelled for tau. Some neurites appeared
to be ‘pulled’ by the scratch injury (A, white arrowheads) but the majority were cut. 24
hours after injury, some neurites appeared to touch (B, grey arrow), follow (B, grey
arrowhead) or extend into the injury site (B, white arrow).
Scale bar = 500μm
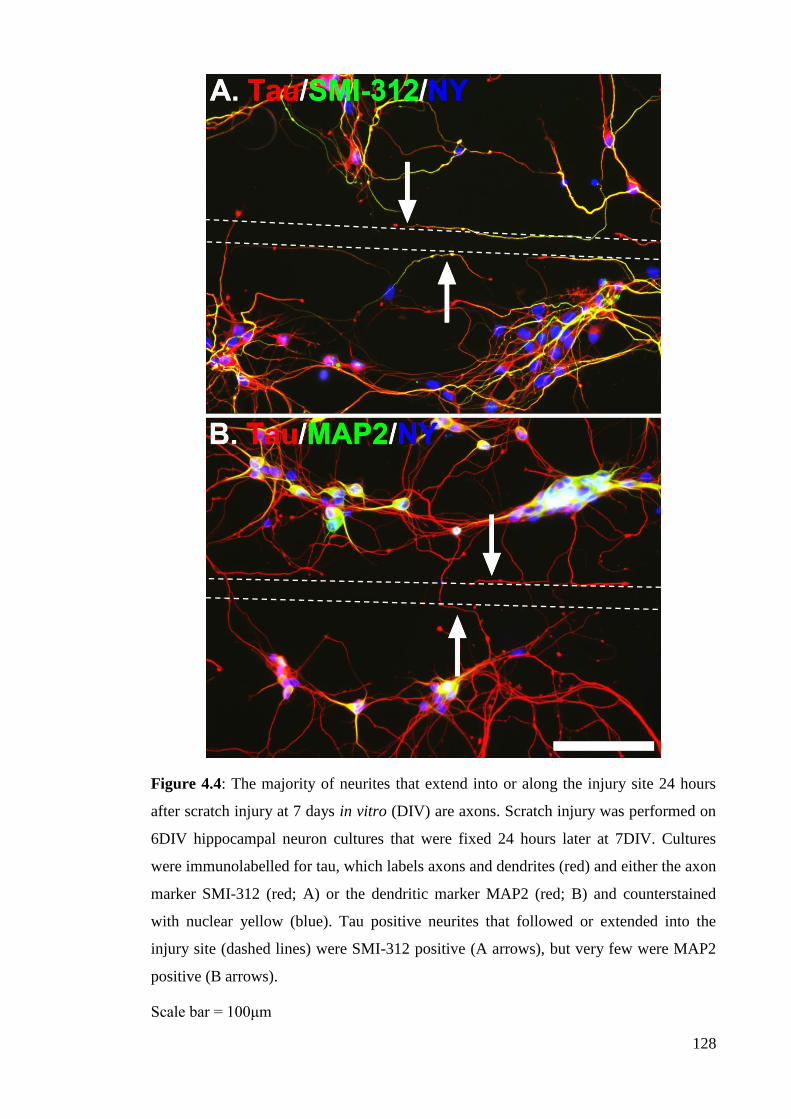
128
Figure 4.4: The majority of neurites that extend into or along the injury site 24 hours
after scratch injury at 7 days in vitro (DIV) are axons. Scratch injury was performed on
6DIV hippocampal neuron cultures that were fixed 24 hours later at 7DIV. Cultures
were immunolabelled for tau, which labels axons and dendrites (red) and either the axon
marker SMI-312 (red; A) or the dendritic marker MAP2 (red; B) and counterstained
with nuclear yellow (blue). Tau positive neurites that followed or extended into the
injury site (dashed lines) were SMI-312 positive (A arrows), but very few were MAP2
positive (B arrows).
Scale bar = 100μm
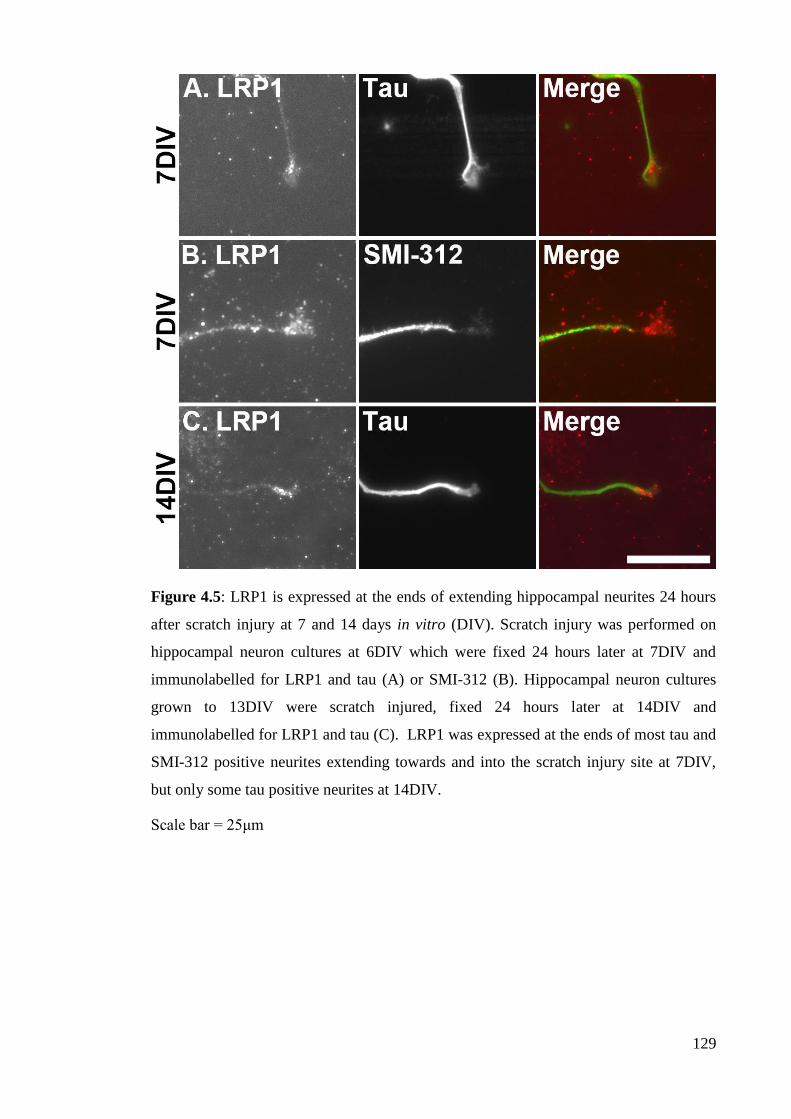
129
Figure 4.5: LRP1 is expressed at the ends of extending hippocampal neurites 24 hours
after scratch injury at 7 and 14 days in vitro (DIV). Scratch injury was performed on
hippocampal neuron cultures at 6DIV which were fixed 24 hours later at 7DIV and
immunolabelled for LRP1 and tau (A) or SMI-312 (B). Hippocampal neuron cultures
grown to 13DIV were scratch injured, fixed 24 hours later at 14DIV and
immunolabelled for LRP1 and tau (C). LRP1 was expressed at the ends of most tau and
SMI-312 positive neurites extending towards and into the scratch injury site at 7DIV,
but only some tau positive neurites at 14DIV.
Scale bar = 25μm
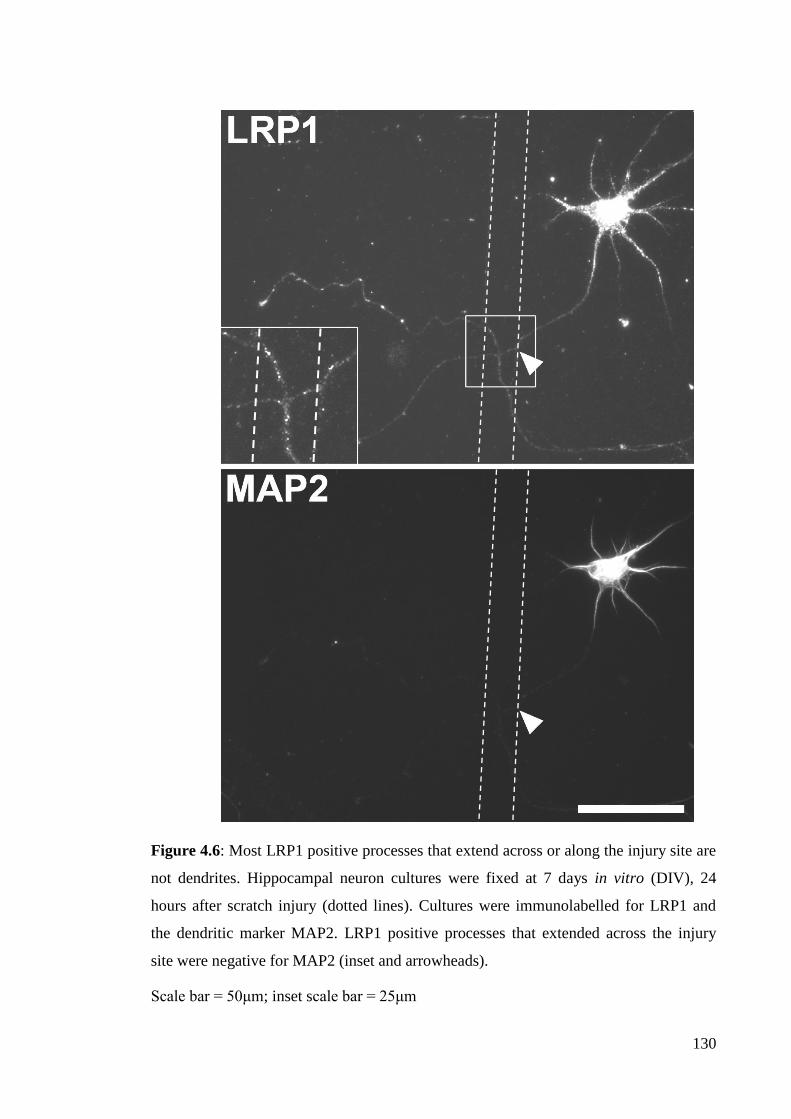
130
Figure 4.6: Most LRP1 positive processes that extend across or along the injury site are
not dendrites. Hippocampal neuron cultures were fixed at 7 days in vitro (DIV), 24
hours after scratch injury (dotted lines). Cultures were immunolabelled for LRP1 and
the dendritic marker MAP2. LRP1 positive processes that extended across the injury
site were negative for MAP2 (inset and arrowheads).
Scale bar = 50μm; inset scale bar = 25μm
131
4.3.2 EMTINB INCREASES THE NUMBER OF NEURITES THAT EXTEND ALONG
OR INTO THE SCRATCH INJURY SITE BUT MT DOES NOT
Neurites that touched, extended along or entered the injury site were observed in
all cultures treated with saline, MT and emtinB with or without RAP (Figure 4.7 A-F).
The numbers of neurites that extended along or entered the injury site were counted per
cm of injury site. No significant difference in the number of neurites that extended
along or into the injury site were observed when MT, RAP or MT + RAP were added to
cultures when compared to saline controls (Figure 4.8 A). EmtinB significantly
increased the number of neurites that extended along or entered the injury site (57.8 ±
4.6 neurites/cm injury site) compared to both saline (27.7 ± 3.3 neurites/cm injury site;
p<0.005) and emtinB + RAP treated cultures (36.5 ± 3.2 neurites/cm injury site;
p<0.005; Figure 4.8 B). No difference in the number of neurites that extended along or
into the injury site was observed between saline treated controls and cultures treated
with RAP or emtinB in combination with RAP. Therefore, emtinB appears to promote
hippocampal neurite extension in an LRP1 dependent manner 24 hours following
scratch injury but MT does not.
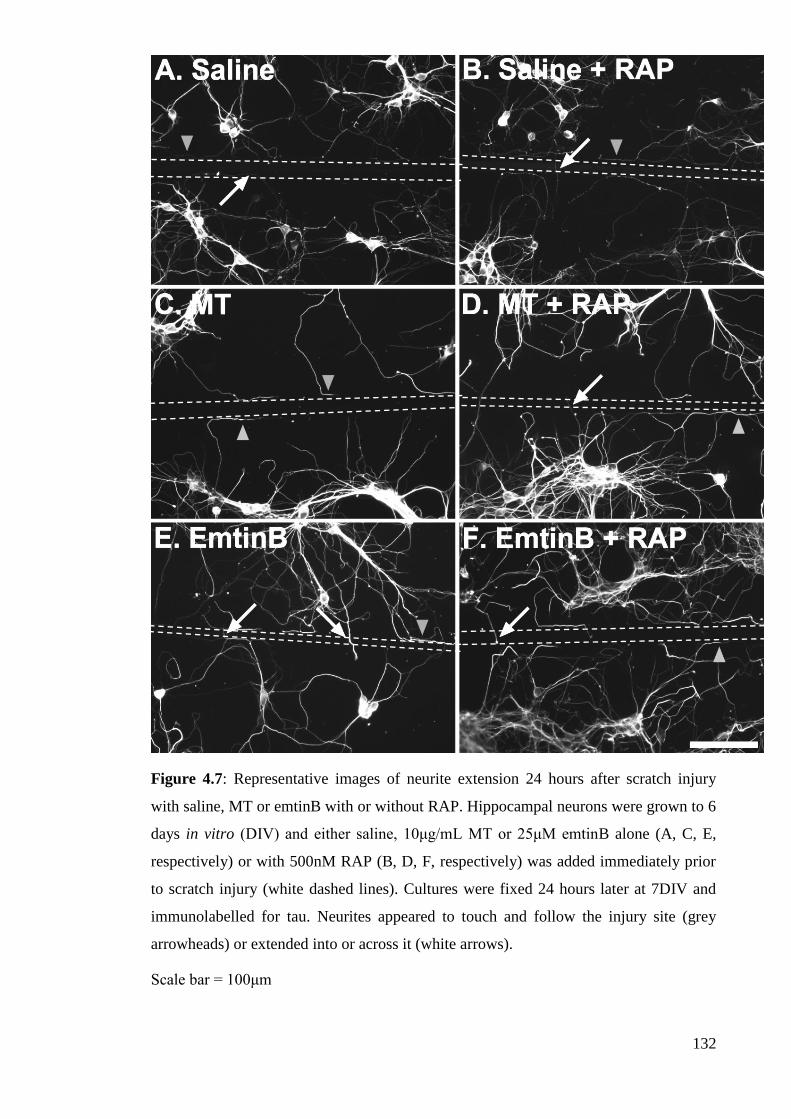
132
Figure 4.7: Representative images of neurite extension 24 hours after scratch injury
with saline, MT or emtinB with or without RAP. Hippocampal neurons were grown to 6
days in vitro (DIV) and either saline, 10μg/mL MT or 25μM emtinB alone (A, C, E,
respectively) or with 500nM RAP (B, D, F, respectively) was added immediately prior
to scratch injury (white dashed lines). Cultures were fixed 24 hours later at 7DIV and
immunolabelled for tau. Neurites appeared to touch and follow the injury site (grey
arrowheads) or extended into or across it (white arrows).
Scale bar = 100μm
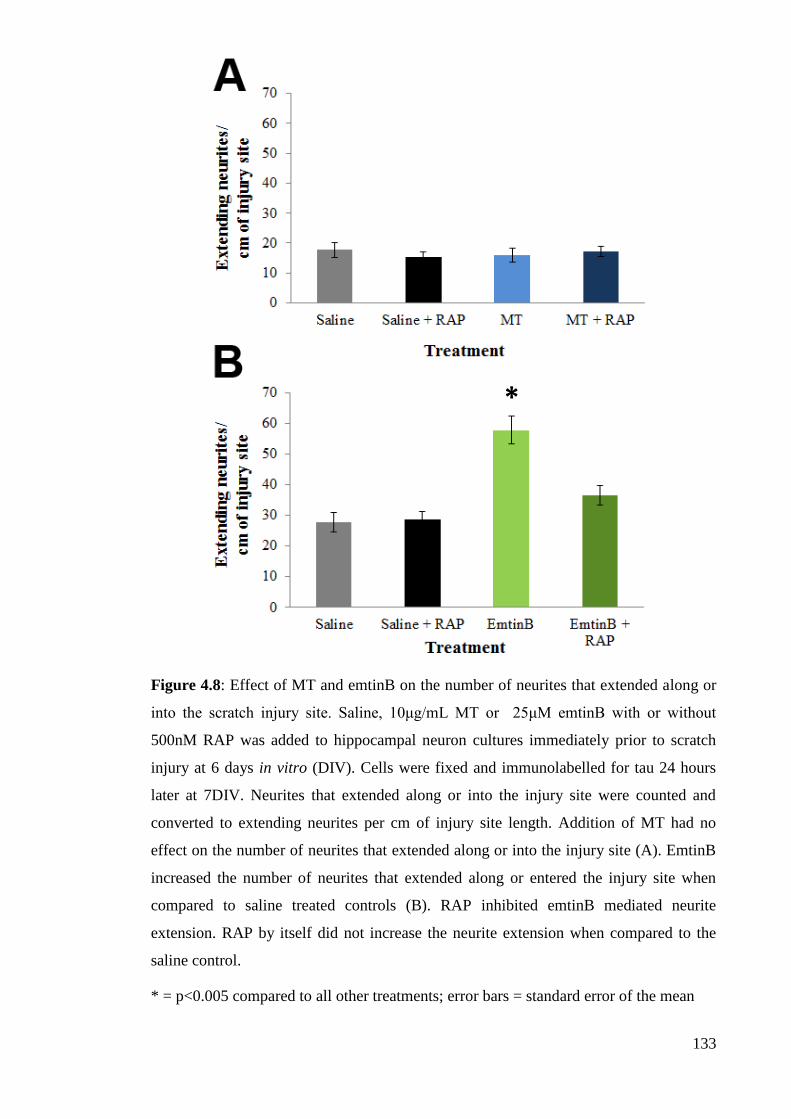
133
Figure 4.8: Effect of MT and emtinB on the number of neurites that extended along or
into the scratch injury site. Saline, 10μg/mL MT or 25μM emtinB with or without
500nM RAP was added to hippocampal neuron cultures immediately prior to scratch
injury at 6 days in vitro (DIV). Cells were fixed and immunolabelled for tau 24 hours
later at 7DIV. Neurites that extended along or into the injury site were counted and
converted to extending neurites per cm of injury site length. Addition of MT had no
effect on the number of neurites that extended along or into the injury site (A). EmtinB
increased the number of neurites that extended along or entered the injury site when
compared to saline treated controls (B). RAP inhibited emtinB mediated neurite
extension. RAP by itself did not increase the neurite extension when compared to the
saline control.
* = p<0.005 compared to all other treatments; error bars = standard error of the mean
*
134
DISCUSSION 4.4
LRP1 is expressed at the ends of extending neurites 24 hours following scratch
injury in both 7DIV and 14DIV hippocampal neuron cultures. The majority of these
neurites are axons which are cleanly cut following scratch injury at 6DIV and appear to
touch, extend into or enter the scratch injury site after 24 hours at 7DIV. MT did not
promote neurite extension, but emtinB increased the number of neurites that extended
along or into the injury site by two-fold when compared to the saline control. RAP
inhibited this effect, demonstrating that emtinB promotes neurite extension through an
LRP1 mechanism.
4.4.1 LRP1 IS EXPRESSED AT THE ENDS OF EXTENDING HIPPOCAMPAL
NEURITES AFTER SCRATCH INJURY
24 hours following scratch injury, LRP1 immunoreactivity is present at the ends
of most 7DIV and some 14DIV extending tau positive neurites. This demonstrates the
potential for LRP1 to direct neurite extension in relatively immature neurons (7DIV) as
well as in some mature, synaptically active neurons (14DIV). The majority of tau
positive neurites that expressed LRP1 and extended into or along the injury site were
determined to be axons. Very few axons in uninjured 7DIV cultures were LRP1 positive
(Chapter 3.3.2). However, most extending axons 24 hours after scratch injury at 7DIV
were immunoreactive for LRP1, particularly at growth cones. Therefore it appears that
expression of the receptor changes in response to injury and suggests that it may be
involved in axon extension.
The ability of LRP1 to promote axon extension has been demonstrated both in
vitro and in vivo previously. ApoE containing lipoprotein enhances retinal ganglion cell
axon extension by 50% following axotomy (Hayashi et al., 2004). An increase in axon
extension only occurred when the ligand was added to axons, not cell bodies, and was
inhibited by addition of RAP, siRNA and antibodies against LRP1 (Hayashi et al., 2004,
135
Matsuo et al., 2011). In vivo work demonstrates that the receptor binding domain of α2-
macroglobulin, another LRP1 ligand, also promotes axon regeneration following dorsal
column lesion in rats. Intrathecal injection of the ligand into the lesion increases the
total proportion of axons into the site by 71% and the length of axons by 3.6-fold when
compared to vehicle infused controls, presumably through LRP1 (Yoon et al., 2013).
These studies demonstrate that LRP1 is located at the ends of severed axons and that it
mediates regeneration of these processes. It is possible then that LRP1 located at the
ends of hippocampal axons also promotes neurite extension following scratch injury of
this neuronal subtype.
4.4.2 MT DOES NOT APPEAR TO PROMOTE HIPPOCAMPAL NEURITE
EXTENSION FOLLOWING INJURY
Hippocampal neurite length during development is enhanced by 1.6 times
following 24 hours treatment with 10μg/mL MT (Køhler et al., 2003). In injury models,
MT addition to both cortical neurons and dorsal root ganglion cells increased neurite
length by 60-70% when compared to vehicle treated controls following scratch injury
(Chung et al., 2003, Leung et al., 2011). Given these reports, it was unexpected that MT
did not promote the number of neurites that extended along or into the scratch injury
site of 7DIV hippocampal neurons. However, these current findings are not comparable
to previous literature that report regeneration as neurite length (Chung et al., 2003,
Leung et al., 2011) as opposed to the number of neurites/unit length of injury site.
Previous work has demonstrated that while MT promotes neurite length it does not
enhance the number of reactive cortical processes per 100μm of the scratch injury site
(Chung et al., 2003). Therefore, it appears that counting the number of neurites
extending into or along the injury site could be a less sensitive measurement of
regeneration and it cannot be definitively concluded that MT does not promote neurite
regeneration based on current data. Measurement of neurite length was not possible in
136
the current hippocampal neuron injury model as it was difficult to accurately track and
measure individual neurites that joined and clumped with other neurites. Using
compartmentalised chambers, such as microfluidic chambers, to sever all axons from a
specific point would enable precise measurement of neurite length and regeneration
(Taylor et al., 2005). This may reveal regenerative effects of MT masked using the
current analysis.
Additional explanations as to why MT did not appear to promote neurite
extension may include masking of its effects by endogenous MT production in response
to scratch injury. MT is expressed in astrocytes both in vivo and in vitro and its
expression is significantly upregulated from 1 to 24 hours following scratch injury in
mixed cortical neuron and astrocyte cultures (Young et al., 1991, Chung et al., 2004). It
has been demonstrated that astrocyte MT expression is induced specifically by neuron
injury. The total concentration of secreted MT detected in media of uninjured cultures
was less than 0.1μg/mL, but local concentrations of MT that occur between astrocytes
and neurons in vivo or in co-cultures were likely to be much higher (Chung et al., 2008).
The amount of MT secreted by astrocytes following scratch injury in neuron cultures is
likely to be even higher (Chung et al., 2004). At 7DIV, 15% of cells in hippocampal
neuron cultures were astrocytes (Chapter 3.3.2). These astrocytes may secrete MT in
response to the hippocampal neuron injury and mask effects of exogenous MT. Though
addition of 5μg/mL MT to cortical neuron cultures significantly promoted the length of
regenerating neurites following injury (Chung et al., 2003), astrocytes may behave
differently in hippocampal neuron cultures to secrete greater amounts of MT. However,
the lack of an MT mediated increase in hippocampal neurite extension following injury
may also be due to experimental procedure and analysis.
In the current study, hippocampal neurons were analysed for neurite extension
24 hours following injury. Though MT mediated cortical neuron and dorsal root
137
ganglion cell neurite outgrowth was evident 12 and 16 hours post-scratch injury
respectively (Chung et al., 2003, Leung et al., 2011), hippocampal neurite extension
may take longer to occur. Length of retinal ganglion cell neurite extension significantly
increased 4 days after injury following treatment with apoE3 containing lipoproteins
through an LRP1 dependent mechanism (Hayashi et al., 2004). Therefore, increasing
the time after injury before analysis may reveal effects of MT in this cell model. This
would also increase the number of hippocampal neurites that extend into the injury site,
which at 24 hours was relatively low. The number of reactive cortical processes per cm
of injury site observed 16 hours after injury were up to 300 times greater than that
observed for hippocampal neurites (Chung et al., 2003). With so few neurites contacting
the injury site, significant differences may be masked between treatments.
4.4.3 EMTINB INCREASES THE NUMBER OF HIPPOCAMPAL NEURITES THAT
EXTEND ALONG OR ENTER THE INJURY SITE
EmtinB doubled the number of hippocampal neurites that extended along or into
the scratch injury site when compared to the saline control. It cannot be definitely
concluded whether these neurites are severed neurites regenerating or newly formed
sprouting neurites. Previous work has demonstrated that 24 hour emtinB treatment
increases developmental hippocampal neurite outgrowth by 7 times that of controls
(Sonn et al., 2010). The peptide also enhances neurite outgrowth of cerebellar granule
neurons by up to 3 times that of controls following 24 hours incubation, effects
inhibited by RAP (Ambjørn et al., 2008). These findings support a role for emtinB in
promotion of neurite extension following injury. By measuring neurite length it can be
determined whether these neurites are newly formed or regenerating after being cut. As
discussed previously, measurement of neurite length was not possible in this culture
model but can be conducted using compartmentalised chambers and severing all axons
from a precise point (Taylor et al., 2005). Measuring neurite length over a number of
138
time points would also aid in determining that regeneration is occurring as opposed to
sprouting. However, this current work has provided evidence that emtinB may be
involved in neurite extension following injury and that this needs to be confirmed.
The emtinB induced increase in the number of hippocampal neurites that
extended into or along the injury site was abolished by treatment with RAP. These
results demonstrate that neurite extension mediated by emtinB is through LRP1.
However, MT and emtinB are also ligands for the LDL receptor family member LRP2,
which binds to and is inhibited by RAP (Orlando et al., 1992, Ambjørn et al., 2008).
Therefore, the emtinB effects observed in these current experiments may not be
specifically through LRP1 but also through LRP2. Specific inhibition of LRP2 with
antibodies or siRNA abolishes MT mediated increases in retinal ganglion cell axon
formation and cortical neurite length (Fitzgerald et al., 2007, Chung et al., 2008).
Therefore, emtinB mediated neurite extension may be through LRP2. However, LRP1
and LRP2 can mediate their effects by associating with each other and forming a
signaling domain (Landowski et al., 2012). The two receptors co-localise in growth
cones of developing dorsal root ganglion cells and modulate MT mediated growth cone
attraction by working synergistically with each other. siRNA against either LRP1 or
LRP2, as well as in combination, inhibits MT mediated growth turning (Landowski et
al., 2012). EmtinB mediated neurite extension may occur through a similar mechanism
in which LRP1 and LRP2 recruit each other to mediate signaling.
4.4.4 DIFFERENT EFFECTS OF LRP1 LIGANDS ON NEURITE EXTENSION
The different effect of MT and emtinB on hippocampal neurite extension
following injury further supports the importance of ligand composition in LRP1
mediated responses. This has been demonstrated with regard to neurite extension
previously. EmtinB modeled after the C-terminus of the MT beta chain increases neurite
outgrowth of cerebellar granule neurons but emtinB modeled after the N-terminus does
139
not (Ambjørn et al., 2008, Asmussen et al., 2009). Retinal ganglion cell axon extension
following axotomy is enhanced by apoE3 containing lipoproteins by 28%, but apoE4
containing lipoproteins and α2-macroglobulin have no effect (Matsuo et al., 2011). It
was assumed that the apoE3 containing lipoproteins acted through LRP1 as a mix of
apoE containing lipoproteins promoted similar neurite extension and these effects were
inhibited by siRNA and antibodies against LRP1 (Matsuo et al., 2011). These studies
support the current findings that even structurally similar ligands, such as MT and
emtinB, can have different effects on LRP1 function in neurite extension.

140
CONCLUSIONS 4.5
LRP1 is expressed at the ends of extending hippocampal axons 24 hours
following scratch injury. EmtinB increased the number of neurites that extended along
or into the injury site, but MT did not. RAP inhibited emtinB mediated neurite
extension, demonstrating that the effect of emtinB was through an LRP1 dependent
mechanism.
141
Chapter 5: Conclusions and future directions
The aim of this thesis was to establish a model to investigate the diversity and
specificity of LRP1 on neuron function. Subcellular localisation of the receptor in
neurons and glia in vivo and in vitro provides evidence that LRP1 is involved in these
cell’s activity. Potential roles may be in survival, signaling or outgrowth, which the
receptor has been demonstrated to modulate in previous literature (Hashimoto et al.,
2000, Hayashi et al., 2007, Shi et al., 2009, Matsuo et al., 2011, Hayashi et al., 2012,
Stiles et al., 2013, Yamauchi et al., 2013). By establishing an in vitro neuron model that
recapitulated aspects of in vivo LRP1 expression patterns, it was possible to further
investigate the role of LRP1 in calcium signaling and regeneration following injury
through the use of its ligands, MT and emtinB.
LRP1 is expressed in the brains of P2, P7 and adult rats. Different molecular
weight LRP1 fragments were detected in whole brain, cortical and hippocampal tissue
at each time point, suggesting that regulation of LRP1 may be region specific. P2 and
P7 whole brain, cortex and hippocampus exhibited different LRP1 profiles by western
blotting when compared to the same brain regions in adults. LRP1 fragments detected in
hippocampal neuron cultures also differed from 3 to 21DIV. These findings
demonstrate that regulation, and possibly function, of LRP1 changes during maturation.
To identify the composition of each LRP1 positive fragment, brain lysate can be run on
2-dimensional gels to further separate protein fractions and stained to identify LRP1
molecules that correspond to the same size detected with western blots. Following
digestion and by referring to the LRP1 structure, mass spectrometry can be used to
determine fragment composition (Shevchenko et al., 1996, Guttman et al., 2009).
Cultured cells can then be transfected with a LRP1 receptor possessing knock-in
mutations in each specific fragment to determine whether these fractions are required
for LRP1 functions such as ligand binding, endocytosis or intracellular protein
142
signaling. For example, transfection of the mutant receptor into the LRP1-null Chinese
hamster ovary cell line can be conducted to evaluate the endocytic capabilities of LRP1
(FitzGerald et al., 1995, Li et al., 2000). Co-immunoprecipitation of fragments with
specific intracellular proteins or ligands can be conducted using pull down assays to
determine whether these fractions associate with signaling proteins and may be involved
in their activation (Gotthardt et al., 2000). By identifying these fractions and
determining their function, it may be possible to better understand LRP1 functions and
how they are regulated.
LRP1 was expressed in the cell bodies of a subset of neurons in the cortex,
hippocampus, thalamus and hypothalamus of P2, P7 and adult brains. This correlated
with the immunoreactivity of LRP1 in cultured hippocampal neurons, which was
particularly evident at the cell body. Previous data have demonstrated the ability of
LRP1 to promote neuronal survival (Hayashi et al., 2007, Fuentealba et al., 2009,
Hayashi et al., 2012, Sen et al., 2012). As the cell body is the site involved primarily in
protein synthesis for processes such as survival (Haines, 2002), LRP1 expressed on
neuronal cell bodies may be involved in this process. In vivo, mice with an LRP1
knock-out in forebrain neurons have increased neurodegeneration in the cortex and
hippocampus compared to wild type mice (Liu et al., 2010). Similar knock-out models
could be used to investigate the role of LRP1 in neuronal survival in conditions such as
excitotoxicity and ischaemia. These conditions can be induced in vivo by intraperitoneal
kainic acid injection (Schwob et al., 1980, Yang et al., 1997) or cerebral artery
occlusion (Longa et al., 1989), respectively. If neuronal LRP1 knock-out mice are more
susceptible to neurodegeneration it would support a role for the receptor in promoting
neuron survival. Alternatively, LRP1 ligands such as MT could be injected following in
vivo excitotoxicity or ischaemia to determine whether stimulation of the receptor can
protect against neurodegeneration.
143
Cortical and hippocampal neurons in the adult brain also expressed LRP1 on
apical dendrites where it may be involved in synaptic signaling. LRP1
immunoreactivity was also present on dendrites of cultured hippocampal neurons at 3,
7, 14 and 21DIV. However, LRP1 did not co-localise with PSD-95 or the NMDA
receptor subunit NR2a. It may be that neurons require stimulation either by NMDA or
glutamate, or LRP1 ligands, such as tPA, that induce NMDA receptor dependent
calcium influx to induce LRP1 to physically associate with synaptic proteins. This can
be tested in vitro by adding agents to synaptically mature hippocampal neuron cultures
and fixing cells in 30 second intervals from 0 up to 2 minutes afterwards. Neurons can
then be co-immunolabelled for LRP1 and synaptic proteins to observe whether the
receptor associates with these proteins to induce calcium responses. In unstimulated
neurons, LRP1 did partially co-localise with the NMDA receptor subunit NR2b which
is expressed at synapses of the developing brain but also synaptically and
extrasynaptically in mature brain (Malenka et al., 1989, Giese et al., 1998, Stocca and
Vicini, 1998, Vicini et al., 1998, Liu et al., 2004). LRP1 expression was present at
apical dendrites of adult brains, but there was very little LRP1 expression in dendrites of
P2 and P7 brains. These findings suggest that the receptor may regulate NDMA
receptor dependent calcium influx through interaction with the NR2b subunit in the
mature rather than in the developing brain. LRP1 co-localisation with NR2b or other
synaptic proteins in vivo can be conducted to investigate whether the receptor may be
involved in synaptic signaling in the brain.
The LRP1 ligands, MT and emtinB, did not induce calcium influx in
hippocampal neurons expressing functional NMDA receptors. MT and emtinB may
mediate NMDA receptor calcium influx through long term pathways that require
chronic incubation, similar to those reported for the LRP1 ligand α2-macroglobulin
(Qiu et al., 2002). This can be investigated by incubating MT and emtinB with
144
hippocampal neurons for a longer time course, such as 48 hours, and then assessing
calcium influx in response to NMDA. The potential ability of MT and emtinB to
induce calcium influx may also be neuron specific similar to the scenario reported for
other LRP1 ligands, such as tPA and α2-macroglobulin (Bacskai et al., 2000, Qiu et al.,
2002, Martin et al., 2008, Samson et al., 2008). Analysing live cell calcium influx in
cortical neurons, or other neuron subtypes, following MT and emtinB addition would
determine whether this is the case.
Axonal expression of LRP1 was absent from P2, P7 and adult brain but was
present along and at the ends of 3DIV and some 7DIV hippocampal axons. These
disparities are unlikely to be due to 3DIV and 7DIV cultures better representing
embryonic rather than post-natal hippocampal neurons as the majority of hippocampal
cytogenesis and synaptogenesis occurs within the first two post-natal weeks (Crain et
al., 1973, Bayer and Altman, 1974, Fricke and Cowan, 1978, Pokorný and Yamamoto,
1981). The differences between in vivo and in vitro axonal expression of LRP1 may be
due to differences between the systems involved. This thesis demonstrates that LRP1
expression is increased at the ends of axons following injury in mature neurons, and
suggests that localisation of the receptor changes in response to traumatic stimuli.
Therefore, hippocampal neurons may express axonal LRP1 in response to the stress of
culture preparation. Stressing hippocampal neurons in other manners, such as through
glutamate excitotoxicity or trophic withdrawal, and identifying localisation of the
receptor may aid in understanding whether this is the case. This can be taken further in
vivo to investigate whether localisation of LRP1 changes in response to stressful stimuli
such as ischaemia or excitotoxicity, as described above.
MT did not promote the number of hippocampal neurites that extended along or
into the injury site following scratch injury. This is despite previous studies
demonstrating the ability of the protein to promote neurite outgrowth following injury
145
in cortical neurons and dorsal root ganglion cells (Chung et al., 2003, Leung et al.,
2011). This may be due differences in hippocampal neuron responses compared to other
neuron models or alternatively, it may reflect the methods used to quantitate
regeneration. Previous studies have measured regeneration as neurite length rather than
the number of neurites/unit length of injury site, which may be a more sensitive method
to quantitate regeneration (Chung et al., 2003, Leung et al., 2011). Culturing
hippocampal neurons in compartmentalised chambers, such as microfluidic chambers,
and severing axons from the axon compartment would enable measurement of neurite
length following injury (Taylor et al., 2005). Additionally, other studies have
demonstrated that the MT mediated increase of neuron outgrowth and survival is dose
dependent with an effective range usually between 1 to 10μg/mL (Køhler et al., 2003,
Fitzgerald et al., 2007, Ambjørn et al., 2008). However, differences in the optimal dose
are observed between cortical neurons, retinal ganglion cells, dopaminergic neurons and
hippocampal neurons (Køhler et al., 2003, Fitzgerald et al., 2007, Ambjørn et al., 2008).
Therefore, 10μg/mL MT may not be the optimal concentration to promote hippocampal
neurite outgrowth following injury. Conducting a dose response ranging from 0.1 to
10μg/mL MT following scratch injury may reveal the best concentration of MT to use
to stimulate neurite regeneration.
EmtinB doubled the number of neurites that extended along or entered the injury
site, but it was not possible to conclude that these were regenerating as opposed to
sprouting neurites in the current injury model. Definitively determining that both
emtinB and MT promote hippocampal neurite regeneration following injury can be
conducted by measuring neurite length of severed axons in compartmentalised
chambers, as mentioned previously, over a number of time points. The current finding
that emtinB promoted the number of neurites extending into or along the injury site was
abolished by RAP suggesting that its effects were through an LRP1 mechanism.
146
However, emtinB also binds to LRP2 and may induce its effects through a synergistic
mechanism between LRP1 and LRP2 (Landowski et al., 2012). To determine whether
this is the case, hippocampal neurons can be immunolabelled for LRP2 to evaluate
whether they express the receptor. If so, specifically inhibiting LRP1 or LRP2 with
siRNA would prove whether one or both of the receptors are required for emtinB
mediated neurite outgrowth.
LRP1 was expressed in oligodendrocytes, astrocytes and microglia in P2, P7 and
adult brain and in hippocampal neuron cultures at 3, 7, 14 and 21DIV. Expression of
LRP1 in astrocytes has been reported in vivo and in vitro previously (Rebeck et al.,
1993, Zheng et al., 1994, Ishiguro et al., 1995, Marzolo et al., 2000, Gaultier et al.,
2009). However, this is the first time that in vivo LRP1 expression has been reported in
oligodendrocytes and microglia despite being identified in vitro (Marzolo et al., 2000,
Gaultier et al., 2009). Using in vitro models, the specific function of LRP1 on glia can
be further investigated by inhibiting it using siRNA. Through the use of transgenic mice
that express Cre recombinase under the control of oligodendrocyte, astrocyte or
microglial specific promoters (Niwa‐Kawakita et al., 2000, Uhlmann et al., 2002,
Brockschnieder et al., 2004, Garcia et al., 2004, Willemen et al., 2010) LRP1 can be
specifically knocked out of these cell populations in vivo (Rohlmann et al., 1996, Liu et
al., 2010). Myelination and migration of oligodendrocytes, neurotransmitter release of
astrocytes or phagocytosis and antigen presentation of microglia can be evaluated in
both these in vivo and in vitro models to determine whether LRP1 has a role in these
glial functions.
LRP1 was also expressed on endothelial cells and astrocytic end-feet of the
BBB, consistent with previous work that show LRP1 expression on these structures and
that the receptor regulate transport of molecules of the brain (Moestrup et al., 1992,
Wolf et al., 1992, Shibata et al., 2000, Yepes et al., 2003, Deane et al., 2004). LRP1
147
may also modulate cerebral blood flow by regulating glutamate mediated calcium
signaling in astrocytic end-feet to induce vasodilation or vasoconstriction (Zonta et al.,
2002, Hayashi et al., 2012). Through regulating transport of molecules in and out of the
brain and cerebral blood flow, LRP1 can aid in controlling the brains’
microenvironment and indirectly promote the survival and function of neurons.
Inhibiting LRP1 function by injection of antibodies against the receptor can be
conducted in vivo to assess whether it increases vascular permeability and blood flow or
transport of molecules across the BBB (Yepes et al., 2003).
The work in this thesis has provided the groundwork to further explore the
function of LRP1 in neurons and glia, both in vivo and in vitro. It is apparent through
previous work and the current data that the role of LRP1 in neurons and glia is ligand
and cell specific, and changes during development. This thesis demonstrates that the
expression pattern of LRP1 in vitro resembles that observed in vivo. Therefore, culture
models are a useful and relevant tool to investigate the specific functions of the receptor
in neuron and glia subtypes. The confirmation of these effects in vivo may lead to a
better understand of mechanisms underlying neurodegenerative disease or injury and
possible therapeutic targets.
148
References
Abbott NJ, Rönnbäck L, Hansson E (2006) Astrocyte–endothelial interactions at the
blood–brain barrier. Nature Reviews Neuroscience 7:41-53.
Ambjørn M, Asmussen JW, Lindstam M, Gotfryd K, Jacobsen C, Kiselyov VV,
Moestrup SK, Penkowa M, Bock E, Berezin V (2008) Metallothionein and a
peptide modeled after metallothionein, EmtinB, induce neuronal differentiation
and survival through binding to receptors of the low density lipoprotein receptor
family. Journal of Neurochemistry 104:21-37.
Ashwell K (1990) Microglia and cell death in the developing mouse cerebellum.
Developmental Brain Research 55:219-230.
Ashwell KW, Paxinos G (2008) Atlas of the developing rat nervous system: Academic
Press.
Asmussen JW, Ambjørn M, Bock E, Berezin V (2009) Peptides modeled after the α-
domain of metallothionein induce neurite outgrowth and promote survival of
cerebellar granule neurons. European journal of cell biology 88:433-443.
Bachoo RM, Kim RS, Ligon KL, Maher EA, Brennan C, Billings N, Chan S, Li C,
Rowitch DH, Wong WH (2004) Molecular diversity of astrocytes with
implications for neurological disorders. Proceedings of the National Academy of
Sciences 101:8384-8389.
Bacskai B, Xia M, Strickland D, Rebeck G, Hyman B (2000) The endocytic receptor
protein LRP also mediates neuronal calcium signaling via N-methyl-D-aspartate
receptors. Proceedings of the National Academy of Sciences 97:11551-11556.
Bamji SX, Majdan M, Pozniak CD, Belliveau DJ, Aloyz R, Kohn J, Causing CG, Miller
FD (1998) The p75 neurotrophin receptor mediates neuronal apoptosis and is
essential for naturally occurring sympathetic neuron death. Journal of Cell
Biology 140:911-923.
Barde YA, Edgar D, Thoenen H (1982) Purification of a new neurotrophic factor from
mammalian brain. The EMBO Journal 1:549-553.
Barnes H, Larsen B, Tyers M, van der Geer P (2001) Tyrosine-phosphorylated low
density lipoprotein receptor-related protein 1 (Lrp1) associates with the adaptor
protein SHC in SRC-transformed cells. Journal of Biological Chemistry
276:19119-19125.
Basu S, Binder RJ, Ramalingam T, Srivastava PK (2001) CD91 is a common receptor
for heat shock proteins gp96, hsp90, hsp70, and calreticulin. Immunity 14:303-
313.
Basu S, Binder RJ, Suto R, Anderson KM, Srivastava PK (2000) Necrotic but not
apoptotic cell death releases heat shock proteins, which deliver a partial
maturation signal to dendritic cells and activate the NF-κB pathway.
International Immunology 12:1539-1546.
Baumann N, Pham-Dinh D (2001) Biology of oligodendrocyte and myelin in the
mammalian central nervous system. Physiological Reviews 81:871-927.
Bayer SA, Altman J (1974) Hippocampal development in the rat: Cytogenesis and
morphogenesis examined with autoradiography and low-level X-irradiation.
Journal of Comparative Neurology 158:55-79.
Betts GN, van der Geer P, Komives EA (2008) Structural and functional consequences
of tyrosine phosphorylation in the LRP1 cytoplasmic domain. Journal of
Biological Chemistry 283:15656-15664.
Bibel M, Hoppe E, Barde YA (1999) Biochemical and functional interactions between
the neurotrophin receptors trk and p75NTR. The EMBO Journal 18:616-622.
149
Binder RJ, Han DK, Srivastava PK (2000) CD91: a receptor for heat shock protein
gp96. Nature Immunology 1:151-155.
Bjartmar C, Hildebrand C, Loinder K (1994) Morphological heterogeneity of rat
oligodendrocytes: Oligodendrocytes: Electron microscopic studies on serial
sections. Glia 11:235-244.
Bjelke B, Seiger A (1989) Morphological distribution of MBP-like immunoreactivity in
the brain during development. International Journal of Developmental
Neuroscience 7:145-164.
Blacker D, Wilcox MA, Laird NM, Rodes L, Horvath SM, Go RC, Perry R, Watson B,
Bassett SS, McInnis MG (1998) Alpha-2 macroglobulin is genetically associated
with Alzheimer disease. Nature Genetics 19:357-360.
Blackstad T, Brink K, Hem J, June B (1970) Distribution of hippocampal mossy fibers
in the rat. An experimental study with silver impregnation methods. Journal of
Comparative Neurology 138:433-449.
Blaschke AJ, Staley K, Chun J (1996) Widespread programmed cell death in
proliferative and postmitotic regions of the fetal cerebral cortex. Development
122:1165-1174.
Bonifacino JS, Traub LM (2003) Signals for sorting of transmembrane proteins to
endosomes and lysosomes. Annual Review of Biochemistry 72:395-447.
Boucher P, Liu P, Gotthardt M, Hiesberger T, Anderson RGW, Herz J (2002) Platelet-
derived growth factor mediates tyrosine phosphorylation of the cytoplasmic
domain of the low density lipoprotein receptor-related protein in caveolae.
Journal of Biological Chemistry 277:15507-15513.
Brockhaus J, Möller T, Kettenmann H (1996) Phagocytozing ameboid microglial cells
studied in a mouse corpus callosum slice preparation. Glia 16:81-90.
Brockschnieder D, Lappe-Siefke C, Goebbels S, Boesl MR, Nave K-A, Riethmacher D
(2004) Cell depletion due to diphtheria toxin fragment A after Cre-mediated
recombination. Molecular and Cellular Biology 24:7636-7642.
Brown MD, Banker GA, Hussaini IM, Gonias SL, VandenBerg SR (1997) Low density
lipoprotein receptor-related protein is expressed early and becomes restricted to
a somatodendritic domain during neuronal differentiation in culture. Brain
Research 747:313-317.
Bu G (2009) Apolipoprotein E and its receptors in Alzheimer's disease: pathways,
pathogenesis and therapy. Nature Reviews Neuroscience 10:333-344.
Bu G, Geuze HJ, Strous GJ, Schwartz AL (1995) 39 kDa receptor-associated protein is
an ER resident protein and molecular chaperone for LDL receptor-related
protein. The EMBO Journal 14:2269-2280.
Bu G, Maksymovitch EA, Geuze H, Schwartz AL (1994a) Subcellular localization and
endocytic function of low density lipoprotein receptor-related protein in human
glioblastoma cells. Journal of Biological Chemistry 269:29874-29882.
Bu G, Maksymovitch EA, Nerbonne JM, Schwartz AL (1994b) Expression and function
of the low density lipoprotein receptor-related protein (LRP) in mammalian
central neurons. Journal of Biological Chemistry 269:18521-18528.
Bu G, Rennke S (1996) Receptor-associated protein is a folding chaperone for low
density lipoprotein receptor-related protein. Journal of Biological Chemistry
271:22218-22224.
Bu G, Williams S, Strickland DK, Schwartz AL (1992) Low density lipoprotein
receptor-related protein/alpha 2-macroglobulin receptor is an hepatic receptor
for tissue-type plasminogen activator. Proceedings of the National Academy of
Sciences 89:7427-7431.
150
Caceres A, Banker G, Binder L (1986) Immunocytochemical localization of tubulin and
microtubule-associated protein 2 during the development of hippocampal
neurons in culture. Journal of Neuroscience 6:714-722.
Campana WM, Li X, Dragojlovic N, Janes J, Gaultier A, Gonias SL (2006) The low-
density lipoprotein receptor-related protein is a pro-survival receptor in Schwann
cells: possible implications in peripheral nerve injury. Journal of Neuroscience
26:11197-11207.
Chen H, Strickland DK, Mosher DF (1996) Metabolism of thrombospondin 2. Journal
of Biological Chemistry 271:15993-15999.
Christopherson KS, Ullian EM, Stokes CC, Mullowney CE, Hell JW, Agah A, Lawler
J, Mosher DF, Bornstein P, Barres BA (2005) Thrombospondins are astrocyte-
secreted proteins that promote CNS synaptogenesis. Cell 120:421-433.
Chu CT, Pizzo SV (1993) Receptor-mediated antigen delivery into macrophages.
Complexing antigen to alpha 2-macroglobulin enhances presentation to T cells.
Journal of Immunology 150:48-58.
Chung RS, Adlard PA, Dittmann J, Vickers JC, Chuah MI, West AK (2004) Neuron-
glia communication: metallothionein expression is specifically up-regulated by
astrocytes in response to neuronal injury. Journal of Neurochemistry 88:454-
461.
Chung RS, Penkowa M, Dittmann J, King CE, Bartlett C, Asmussen JW, Hidalgo J,
Carrasco J, Leung YKJ, Walker AK (2008) Redefining the role of
metallothionein within the injured brain. Journal of Biological Chemistry
283:15349-15358.
Chung RS, Vickers JC, Chuah MI, West AK (2003) Metallothionein-IIA promotes
initial neurite elongation and postinjury reactive neurite growth and facilitates
healing after focal cortical brain injury. Journal of Neuroscience 23:3336-3342.
Cohen S, Levi-Montalcini R (1956) A nerve growth-stimulating factor isolated from
snake venom. Proceedings of the National Academy of Sciences 42:571-574.
Crain B, Cotman C, Taylor D, Lynch G (1973) A quantitative electron microscopic
study of synaptogenesis in the dentate gyrus of the rat. Brain Research 63:195-
204.
Datta SR, Dudek H, Tao X, Masters S, Fu H, Gotoh Y, Greenberg ME (1997) Akt
phosphorylation of BAD couples survival signals to the cell-intrinsic death
machinery. Cell 91:231-241.
Davey F, Davies AM (1998) TrkB signalling inhibits p75-mediated apoptosis induced
by nerve growth factor in embryonic proprioceptive neurons. Current Biology
8:915-918.
Davis CG, Van Driel I, Russell D, Brown MS, Goldstein JL (1987) The low density
lipoprotein receptor. Identification of amino acids in cytoplasmic domain
required for rapid endocytosis. Journal of Biological Chemistry 262:4075-4082.
Deane R, Wu Z, Sagare A, Davis J, Du Yan S, Hamm K, Xu F, Parisi M, LaRue B, Hu
HW (2004) LRP/Amyloid beta-peptide interaction mediates differential brain
efflux of Abeta isoforms. Neuron 43:333-344.
Donahue JE, Flaherty SL, Johanson CE, Duncan JA, Silverberg GD, Miller MC,
Tavares R, Yang W, Wu Q, Sabo E (2006) RAGE, LRP-1, and amyloid-beta
protein in Alzheimer’s disease. Acta Neuropathologica 112:405-415.
Dotti C, Banker G, Binder L (1987) The expression and distribution of the microtubule-
associated proteins tau and microtubule-associated protein 2 in hippocampal
neurons in the rat in situ and in cell culture. Neuroscience 23:121-130.
Dotti CG, Sullivan CA, Banker GA (1988) The establishment of polarity by
hippocampal neurons in culture. Journal of Neuroscience 8:1454-1468.
151
Eaton E, Bennett B, Berezin V, West A, Chung R (2012) Do metallothionein and its
derivatives protect against A toxicity by an LRP mediated mechanism?
Program number 852.01. 2012 Neuroscience Meeting Planner. New Orleans,
LA: Society for Neuroscience, 2012. Online.
Edmondson JC, Liem R, Kuster JE, Hatten ME (1988) Astrotactin: a novel neuronal
cell surface antigen that mediates neuron-astroglial interactions in cerebellar
microcultures. Journal of Cell Biology 106:505-517.
Elliott WH, Elliott DC (2004) Biochemistry and Molecular Biology: Oxford University
Press.
Eng LF, Chao F-C, Gerstl B, Pratt DR, Tavaststjerna M (1968) Maturation of human
white matter myelin. Fractionation of the myelin membrane proteins.
Biochemistry 7:4455-4465.
Eriksson PS, Perfilieva E, Björk-Eriksson T, Alborn A-M, Nordborg C, Peterson DA,
Gage FH (1998) Neurogenesis in the adult human hippocampus. Nature
Medicine 4:1313-1317.
Feldman S, Sangha N (1992) Immunohistochemical localization of alpha 2-
macroglobulin receptors in human skin. Acta Dermato-venereologica 72:331-
333.
Fellin T, Pascual O, Gobbo S, Pozzan T, Haydon PG, Carmignoto G (2004) Neuronal
synchrony mediated by astrocytic glutamate through activation of extrasynaptic
NMDA receptors. Neuron 43:729-743.
Fernandez-Castaneda A, Arandjelovic S, Stiles TL, Schlobach RK, Mowen KA, Gonias
SL, Gaultier A (2013) Identification of the low density lipoprotein (LDL)
receptor-related protein-1 interactome in central nervous system myelin suggests
a role in the clearance of necrotic cell debris. Journal of Biological Chemistry
288:4538-4548.
Ffrench-Constant C, Raff MC (1986) Proliferating bipotential glial progenitor cells in
adult rat optic nerve. Nature 319:499-502.
FitzGerald DJ, Fryling CM, Zdanovsky A, Saelinger CB, Kounnas M, Winkles JA,
Strickland D, Leppla S (1995) Pseudomonas exotoxin-mediated selection yields
cells with altered expression of low-density lipoprotein receptor-related protein.
Journal of Cell Biology 129:1533-1541.
Fitzgerald M, Nairn P, Bartlett CA, Chung RS, West AK, Beazley LD (2007)
Metallothionein-IIA promotes neurite growth via the megalin receptor.
Experimental Brain Research 183:171-180.
Fletcher T, Cameron P, De Camilli P, Banker G (1991) The distribution of synapsin I
and synaptophysin in hippocampal neurons developing in culture. Journal of
Neuroscience 11:1617-1626.
Flint AC, Maisch US, Weishaupt JH, Kriegstein AR, Monyer H (1997) NR2A subunit
expression shortens NMDA receptor synaptic currents in developing neocortex.
Journal of Neuroscience 17:2469-2476.
Frade JM, Bovolenta P, Martínez-Morales JR, Arribas A, Barbas JA, Rodríguez-Tébar
A (1997) Control of early cell death by BDNF in the chick retina. Development
124:3313-3320.
Frade JM, Rodríguez-Tébar A, Barde YA (1996) Induction of cell death by endogenous
nerve growth factor through its p75 receptor. Nature 383:166-168.
Fricke R, Cowan W (1978) An autoradiographic study of the commissural and
ipsilateral hippocampo-dentate projections in the adult rat. Journal of
Comparative Neurology 181:253-269.
Fricker M, Oliva-Martín MJ, Brown GC (2012) Primary phagocytosis of viable neurons
by microglia activated with LPS or Abeta is dependent on calreticulin/LRP
phagocytic signalling. Journal of Neuroinflammation 9:196.
152
Fuentealba RA, Liu Q, Kanekiyo T, Zhang J, Bu G (2009) Low density lipoprotein
receptor-related protein 1 promotes anti-apoptotic signaling in neurons by
activating Akt survival pathway. Journal of Biological Chemistry 284:34045-
34053.
Garcia ADR, Doan NB, Imura T, Bush TG, Sofroniew MV (2004) GFAP-expressing
progenitors are the principal source of constitutive neurogenesis in adult mouse
forebrain. Nature Neuroscience 7:1233-1241.
Gardai SJ, McPhillips KA, Frasch SC, Janssen WJ, Starefeldt A, Murphy-Ullrich JE,
Bratton DL, Oldenborg PA, Michalak M, Henson PM (2005) Cell-surface
calreticulin initiates clearance of viable or apoptotic cells through trans-
activation of LRP on the phagocyte. Cell 123:321-334.
Gardner A, Jukkola P, Gu C (2012) Myelination of rodent hippocampal neurons in
culture. Nature Protocols 7:1774-1782.
Gaultier A, Wu X, Le Moan N, Takimoto S, Mukandala G, Akassoglou K, Campana
WM, Gonias SL (2009) Low-density lipoprotein receptor-related protein 1 is an
essential receptor for myelin phagocytosis. Journal of Cell Science 122:1155-
1162.
Giese KP, Fedorov NB, Filipkowski RK, Silva AJ (1998) Autophosphorylation at
Thr286 of the α calcium-calmodulin kinase II in LTP and learning. Science
279:870-873.
Giulian D, Baker TJ (1985) Peptides released by ameboid microglia regulate astroglial
proliferation. Journal of Cell Biology 101:2411-2415.
Giulian D, Baker TJ, Shih L-C, Lachman LB (1986) Interleukin 1 of the central nervous
system is produced by ameboid microglia. Journal of Experimental Medicine
164:594-604.
Gliemann J, Davidsen O, Moestrup SK (1989) Characterization, size estimation and
solubilization of [alpha]-macroglobulin complex receptors in liver membranes.
Biochimica et Biophysica Acta 980:326-332.
Godyna S, Liau G, Popa I, Stefansson S, Argraves WS (1995) Identification of the low
density lipoprotein receptor-related protein (LRP) as an endocytic receptor for
thrombospondin-1. Journal of Cell Biology 129:1403-1410.
Gotthardt M, Trommsdorff M, Nevitt MF, Shelton J, Richardson JA, Stockinger W,
Nimpf J, Herz J (2000) Interactions of the low density lipoprotein receptor gene
family with cytosolic adaptor and scaffold proteins suggest diverse biological
functions in cellular communication and signal transduction. Journal of
Biological Chemistry 275:25616-25624.
Grimsley PG, Quinn KA, Chesterman CN, Owensby DA (1999) Evolutionary
conservation of circulating soluble low density lipoprotein receptor-related
protein-like (“LRP-like”) molecules. Thrombosis Research 94:153-164.
Guttman M, Betts GN, Barnes H, Ghassemian M, van der Geer P, Komives EA (2009)
Interactions of the NPXY microdomains of the low density lipoprotein receptor-
related protein 1. Proteomics 9:5016-5028.
Haines DE (2002) Fundamental neuroscience: Churchill Livingstone.
Hallbook F, Ibanez CF, Persson H (1991) Evolutionary studies of the nerve growth
factor family reveal a novel member abundantly expressed in Xenopus ovary.
Neuron 6:845-858.
Hamano K, Iwasaki N, Takeya T, Takita H (1996) A quantitative analysis of rat central
nervous system myelination using the immunohistochemical method for MBP.
Developmental Brain Research 93:18-22.
Hamanoue M, Middleton G, Wyatt S, Jaffray E, Hay RT, Davies AM (1999) p75-
mediated NF-κB activation enhances the survival response of developing
153
sensory neurons to nerve growth factor. Molecular and Cellular Neuroscience
14:28-40.
Handelmann GE, Boyles JK, Weisgraber KH, Mahley RW, Pitas RE (1992) Effects of
apolipoprotein E, beta-very low density lipoproteins, and cholesterol on the
extension of neurites by rabbit dorsal root ganglion neurons in vitro. Journal of
Lipid Research 33:1677-1688.
Hashimoto Y, Jiang H, Niikura T, Ito Y, Hagiwara A, Umezawa K, Abe Y, Murayama
Y, Nishimoto I (2000) Neuronal apoptosis by apolipoprotein E4 through low-
density lipoprotein receptor-related protein and heterotrimeric GTPases. Journal
of Neuroscience 20:8401-8409.
Hayashi H, Campenot RB, Vance DE, Vance JE (2004) Glial lipoproteins stimulate
axon growth of central nervous system neurons in compartmented cultures.
Journal of Biological Chemistry 279:14009-14015.
Hayashi H, Campenot RB, Vance DE, Vance JE (2007) Apolipoprotein E-containing
lipoproteins protect neurons from apoptosis via a signaling pathway involving
low-density lipoprotein receptor-related protein-1. Journal of Neuroscience
27:1933-1941.
Hayashi H, Eguchi Y, Fukuchi-Nakaishi Y, Takeya M, Nakagata N, Tanaka K, Vance
JE, Tanihara H (2012) A potential neuroprotective role of apolipoprotein E-
containing lipoproteins through low density lipoprotein receptor-related protein
1 in normal tension glaucoma. Journal of Biological Chemistry 287:25395-
25406.
Hempstead BL, Martin-Zanca D, Kaplan DR, Parada LF, Chao MV (1991) High-
affinity NGF binding requires coexpression of the trk proto-oncogene and the
low-affinity NGF receptor. Nature 350:678-683.
Henze DA, Cameron WE, Barrionuevo G (1996) Dendritic morphology and its effects
on the amplitude and rise-time of synaptic signals in hippocampal CA3
pyramidal cells. Journal of Comparative Neurology 369:331-344.
Herbert RP, Chuah MI, Chung RS, Leung YKJ, Adlard PA, West AK (2012) How do
LRPs and their ligands affect LTP in the hippocampus? 32nd Annual Meeting of
the Australian Neuroscience Society Abstract, Pos-Tue-020.
Herz J, Clouthier DE, Hammer RE (1992) LDL receptor-related protein internalizes and
degrades uPA-PAI-1 complexes and is essential for embryo implantation. Cell
71:411-421.
Herz J, Goldstein JL, Strickland D, Ho Y, Brown MS (1991) 39-kDa protein modulates
binding of ligands to low density lipoprotein receptor-related protein/alpha 2-
macroglobulin receptor. Journal of Biological Chemistry 266:21232-21238.
Herz J, Hamann U, Rogne S, Myklebost O, Gausepohl H, Stanley KK (1988) Surface
location and high affinity for calcium of a 500-kd liver membrane protein
closely related to the LDL-receptor suggest a physiological role as lipoprotein
receptor. The EMBO Journal 7:4119-4127.
Herz J, Kowal RC, Goldstein JL, Brown MS (1990) Proteolytic processing of the 600
kd low density lipoprotein receptor-related protein (LRP) occurs in a trans-Golgi
compartment. The EMBO Journal 9:1769-1776.
Hickey WF, Kimura H (1988) Perivascular microglial cells of the CNS are bone
marrow-derived and present antigen in vivo. Science 239:290-292.
Hollyday M, Hamburger V (1976) Reduction of the naturally occurring motor neuron
loss by enlargement of the periphery. Journal of Comparative Neurology
170:311-320.
Huang SS, Ling TYEN, Tseng WENF, Huang YENHWA, Tang FENMEI, Leal SM,
San Huang J (2003) Cellular growth inhibition by IGFBP-3 and TGF-ß1
requires LRP-1. The FASEB Journal 17:2068-2081.
154
Hussain S, Slikker Jr W, Ali SF (1996) Role of metallothionein and other antioxidants
in scavenging superoxide radicals and their possible role in neuroprotection.
Neurochemistry International 29:145-152.
Huttenlocher PR (1979) Synaptic density in human frontal cortex—developmental
changes and effects of aging. Brain Research 163:195-205.
Igdoura S, Argraves W, Morales C (1997) Low density lipoprotein receptor-related
protein-1 expression in the testis: regulated expression in Sertoli cells. Journal of
Andrology 18:400-410.
Ilschner S, Brandt R (1996) The transition of microglia to a ramified phenotype is
associated with the formation of stable acetylated and detyrosinated
microtubules. Glia 18:129-140.
Ip NY, Ibanez CF, Nye SH, McClain J, Jones PF, Gies DR, Belluscio L, Le Beau MM,
Espinosa R, Squinto SP (1992) Mammalian neurotrophin-4: structure,
chromosomal localization, tissue distribution, and receptor specificity.
Proceedings of the National Academy of Sciences 89:3060-3064.
Ishiguro M, Imai Y, Kohsaka S (1995) Expression and distribution of low density
lipoprotein receptor-related protein mRNA in the rat central nervous system.
Molecular Brain Research 33:37-46.
Ishii T, Moriyoshi K, Sugihara H, Sakurada K, Kadotani H, Yokoi M, Akazawa C,
Shigemoto R, Mizuno N, Masu M (1993) Molecular characterization of the
family of the N-methyl-D-aspartate receptor subunits. Journal of Biological
Chemistry 268:2836-2843.
Jiang LJ, Maret W, Vallee BL (1998) The glutathione redox couple modulates zinc
transfer from metallothionein to zinc-depleted sorbitol dehydrogenase.
Proceedings of the National Academy of Sciences 95:3483-3488.
Kadonaga JT (2004) Regulation of RNA polymerase II transcription by sequence-
specific DNA binding factors. Cell 116:247-257.
Kägi J, Himmelhoch S, Whanger P, Bethune J, Vallee BL (1974) Equine hepatic and
renal metallothioneins. Journal of Biological Chemistry 249:3537-3542.
Kang D, Saitoh T, Chen X, Xia Y, Masliah E, Hansen L, Thomas R, Thal L, Katzman R
(1997) Genetic association of the low-density lipoprotein receptor-related
protein gene (LRP), and apolipoprotein E receptor, with late-onset Alzheimer's
disease. Neurology 49:56-61.
Kaplan DR, Martin-Zanca D, Parada LF (1991) Tyrosine phosphorylation and tyrosine
kinase activity of the trk proto-oncogene product induced by NGF. Nature
350:158-160.
Kelly EJ, Quaife CJ, Froelick GJ, Palmiter RD (1996) Metallothionein I and II protect
against zinc deficiency and zinc toxicity in mice. The Journal of Nutrition
126:1782-1790.
Kesslak JP, Nalcioglu O, Cotman CW (1991) Quantification of magnetic resonance
scans for hippocampal and parahippocampal atrophy in Alzheimer's disease.
Neurology 41:51-54.
Kim SU, Pleasure DE (1978) Tissue culture analysis of neurogenesis: Myelination and
synapse formation are retarded by serum deprivation. Brain Research 145:15-25.
Kinoshita A, Shah T, Tangredi MM, Strickland DK, Hyman BT (2003) The
intracellular domain of the low density lipoprotein receptor-related protein
modulates transactivation mediated by amyloid precursor protein and Fe65.
Journal of Biological Chemistry 278:41182-41188.
Klassen RB, Crenshaw K, Kozyraki R, Verroust PJ, Tio L, Atrian S, Allen PL,
Hammond TG (2004) Megalin mediates renal uptake of heavy metal
metallothionein complexes. American Journal of Physiology 287:F393-F403.
155
Klein R, Jing S, Nanduri V, O'Rourke E, Barbacid M (1991) The trk proto-oncogene
encodes a receptor for nerve growth factor. Cell 65:189-197.
Køhler LB, Berezin V, Bock E, Penkowa M (2003) The role of metallothionein II in
neuronal differentiation and survival. Brain Research 992:128-136.
Kojima Y, Berger C, Vallee BL, Kägi J (1976) Amino-acid sequence of equine renal
metallothionein-1B. Proceedings of the National Academy of Sciences 73:3413-
3417.
Kornau H-C, Schenker LT, Kennedy MB, Seeburg PH (1995) Domain interaction
between NMDA receptor subunits and the postsynaptic density protein PSD-95.
Science 269:1737-1740.
Kounnas M, Morris RE, Thompson M, FitzGerald D, Strickland D, Saelinger C (1992)
The alpha 2-macroglobulin receptor/low density lipoprotein receptor-related
protein binds and internalizes Pseudomonas exotoxin A. Journal of Biological
Chemistry 267:12420-12423.
Kounnas MZ, Chappell DA, Wong H, Argraves WS, Strickland DK (1995) The cellular
internalization and degradation of hepatic lipase is mediated by low density
lipoprotein receptor-related protein and requires cell surface proteoglycans.
Journal of Biological Chemistry 270:9307-9312.
Kowal R, Herz J, Goldstein J, Esser V, Brown M (1989) LRP mediates uptake of
cholesteryl esters derived from apoE-enriched lipoproteins. Proceedings of the
National Academy of Sciences 86:5810-5814.
Kreutzberg GW (1996) Microglia: a sensor for pathological events in the CNS. Trends
in Neurosciences 19:312-318.
Laakso M, Soininen H, Partanen K, Helkala E-L, Hartikainen P, Vainio P, Hallikainen
M, Hänninen T, Riekkinen Sr P (1995) Volumes of hippocampus, amygdala and
frontal lobes in the MRI-based diagnosis of early Alzheimer's disease:
correlation with memory functions. Journal of Neural Transmission 9:73-86.
Lamballe F, Klein RÃ, Barbacid M (1991) trk C, a new member of the trk family of
tyrosine protein kinases, is a receptor for neurotrophin-3. Cell 66:967-979.
Landowski L, Gasperini R, Small DH, Taylor BV, West AK, Foa L (2011)
Metallothionein I/II and metallothionein III induce growth cone chemotaxis via
disparate mechanisms. 31st Annual Meeting of the Australian Neuroscience
Society Abstract, Pos-Wed-043.
Landowski L, Gasperini R, Taylor B, West A, Foa L (2012) Metallothionein I/II
induces growth cone chemotaxis via an LRP-1 and LRP-2 dependent
mechanism. Program number 233.16. 2012 Neuroscience Meeting Planner. New
Orleans, LA: Society for Neuroscience, 2012. Online.
Lawson L, Perry V, Dri P, Gordon S (1990) Heterogeneity in the distribution and
morphology of microglia in the normal adult mouse brain. Neuroscience 39:151-
170.
Lenting PJ, Neels JG, van den Berg BMM, Clijsters PPFM, Meijerman DWE,
Pannekoek H, van Mourik JA, Mertens K, van Zonneveld AJ (1999) The light
chain of factor VIII comprises a binding site for low density lipoprotein
receptor-related protein. Journal of Biological Chemistry 274:23734-23739.
Leonard AS, Lim IA, Hemsworth DE, Horne MC, Hell JW (1999) Calcium/calmodulin-
dependent protein kinase II is associated with the N-methyl-D-aspartate
receptor. Proceedings of the National Academy of Sciences 96:3239-3244.
Leung JYK, Bennett WR, Herbert RP, West AK, Lee PR, Wake H, Fields RD, Chuah
MI, Chung RS (2011) Metallothionein promotes regenerative axonal sprouting
of dorsal root ganglion neurons after physical axotomy. Cellular and Molecular
Life Sciences 69:809-817.
156
Leung Y, Pankhurst M, Dunlop S, Ray S, Dittmann J, Eaton E, Palumaa P, Sillard R,
Chuah M, West A (2010) Metallothionein induces a regenerative reactive
astrocyte phenotype via JAK/STAT and RhoA signalling pathways.
Experimental Neurology 221:98-106.
Li Y, Paz Marzolo M, van Kerkhof P, Strous GJ, Bu G (2000) The YXXL motif, but
not the two NPXY motifs, serves as the dominant endocytosis signal for low
density lipoprotein receptor-related protein. Journal of Biological Chemistry
275:17187-17194.
Liesi P, Silver J (1988) Is astrocyte laminin involved in axon guidance in the
mammalian CNS? Developmental Biology 130:774-785.
Ling E (1979) Transformation of monocytes into amoeboid microglia and into
microglia in the corpus callosum of postnatal rats, as shown by labelling
monocytes by carbon particles. Journal of Anatomy 128:847-858.
Liu Q, Trotter J, Zhang J, Peters MM, Cheng H, Bao J, Han X, Weeber EJ, Bu G (2010)
Neuronal LRP1 knockout in adult mice leads to impaired brain lipid metabolism
and progressive, age-dependent synapse loss and neurodegeneration. Journal of
Neuroscience 30:17068-17078.
Liu Q, Zerbinatti CV, Zhang J, Hoe H-S, Wang B, Cole SL, Herz J, Muglia L, Bu G
(2007) Amyloid precursor protein regulates brain apolipoprotein E and
cholesterol metabolism through lipoprotein receptor LRP1. Neuron 56:66-78.
Liu Q, Zhang J, Zerbinatti C, Zhan Y, Kolber BJ, Herz J, Muglia LJ, Bu G (2011)
Lipoprotein receptor LRP1 regulates leptin signaling and energy homeostasis in
the adult central nervous system. PLoS Biology 9:e1000575.
Liu X-B, Murray KD, Jones EG (2004) Switching of NMDA receptor 2A and 2B
subunits at thalamic and cortical synapses during early postnatal development.
Journal of Neuroscience 24:8885-8895.
Longa EZ, Weinstein PR, Carlson S, Cummins R (1989) Reversible middle cerebral
artery occlusion without craniectomy in rats. Stroke 20:84-91.
Lopes MBS, Bogaev CA, Gonias SL, VandenBerg SR (1994) Expression of α2-
macroglobulin receptor/low density lipoprotein receptor-related protein is
increased in reactive and neoplastic glial cells. FEBS Letters 338:301-305.
Loukinova E, Ranganathan S, Kuznetsov S, Gorlatova N, Migliorini MM, Loukinov D,
Ulery PG, Mikhailenko I, Lawrence DA, Strickland DK (2002) Platelet-derived
growth factor (PDGF)-induced tyrosine phosphorylation of the low density
lipoprotein receptor-related protein (LRP). Journal of Biological Chemistry
277:15499-15506.
Lu H-C, Gonzalez E, Crair MC (2001) Barrel cortex critical period plasticity is
independent of changes in NMDA receptor subunit composition. Neuron
32:619-634.
Luo Y, Shepherd I, Li J, Renzi MJ, Chang S, Raper JA (1995) A family of molecules
related to collapsin in the embryonic chick nervous system. Neuron 14:1131-
1140.
Mahadeo D, Kaplan L, Chao M, Hempstead B (1994) High affinity nerve growth factor
binding displays a faster rate of association than p140trk binding. Implications
for multi-subunit polypeptide receptors. Journal of Biological Chemistry
269:6884-6891.
Maisonpierre PC, Belluscio L, Squinto S, Ip NY, Furth ME, Lindsay RM, Yancopoulos
GD (1990) Neurotrophin-3: a neurotrophic factor related to NGF and BDNF.
Science 247:1446-1451.
Malenka RC, Kauer JA, Perkel DJ, Mauk MD, Kelly PT, Nicoll RA, Waxham MN
(1989) An essential role for postsynaptic calmodulin and protein kinase activity
in long-term potentiation. Nature 340:554-557.
157
Manthorpe M, Engvall E, Ruoslahti E, Longo FM, Davis GE, Varon S (1983) Laminin
promotes neuritic regeneration from cultured peripheral and central neurons.
Journal of Cell Biology 97:1882-1890.
Mantuano E, Inoue G, Li X, Takahashi K, Gaultier A, Gonias SL, Campana WM (2008)
The hemopexin domain of matrix metalloproteinase-9 activates cell signaling
and promotes migration of schwann cells by binding to low-density lipoprotein
receptor-related protein. Journal of Neuroscience 28:11571-11582.
Mantuano E, Jo M, Gonias SL, Campana WM (2010) Low density lipoprotein receptor-
related protein (LRP1) regulates Rac1 and RhoA reciprocally to control
Schwann cell adhesion and migration. Journal of Biological Chemistry
285:14259-14266.
Martin AM, Kuhlmann C, Trossbach S, Jaeger S, Waldron E, Roebroek A, Luhmann
HJ, Laatsch A, Weggen S, Lessmann V (2008) The functional role of the second
NPXY motif of the LRP1 -chain in tissue-type plasminogen activator-mediated
activation of N-methyl-d-aspartate receptors. Journal of Biological Chemistry
283:12004-12013.
Marzolo MP, von Bernhardi R, Bu G, Inestrosa NC (2000) Expression of α2-
macroglobulin receptor/low density lipoprotein receptor-related protein (LRP) in
rat microglial cells. Journal of Neuroscience Research 60:401-411.
Masliah E, Mallory M, Hansen L, Alford M, DeTeresa R, Terry R (1993) An antibody
against phosphorylated neurofilaments identifies a subset of damaged
association axons in Alzheimer's disease. American Journal of Pathology
142:871-882.
Matsuo M, Campenot RB, Vance DE, Ueda K, Vance JE (2011) Involvement of low
density lipoprotein receptor-related protein and ABCG1 in stimulation of axonal
extension by Apo E-containing lipoproteins. Biochimica et Biophysica Acta
1811:31-38.
Matus A, Bernhardt R, Hugh-Jones T (1981) High molecular weight microtubule-
associated proteins are preferentially associated with dendritic microtubules in
brain. Proceedings of the National Academy of Sciences 78:3010-3014.
May P, Bock HH, Nimpf J, Herz J (2003) Differential glycosylation regulates
processing of lipoprotein receptors by γ-secretase. Journal of Biological
Chemistry 278:37386-37392.
May P, Reddy YK, Herz J (2002) Proteolytic processing of low density lipoprotein
receptor-related protein mediates regulated release of its intracellular domain.
Journal of Biological Chemistry 277:18736-18743.
May P, Rohlmann A, Bock HH, Zurhove K, Marth JD, Schomburg ED, Noebels JL,
Beffert U, Sweatt JD, Weeber EJ (2004) Neuronal LRP1 functionally associates
with postsynaptic proteins and is required for normal motor function in mice.
Molecular and Cellular Biology 24:8872-8883.
Medh JD, Fry GL, Bowen SL, Pladet MW, Strickland DK, Chappell DA (1995) The 39-
kDa receptor-associated protein modulates lipoprotein catabolism by binding to
LDL receptors. Journal of Biological Chemistry 270:536-540.
Meilinger M, Gschwentner C, Burger I, Haumer M, Wahrmann M, Szollar L, Nimpf J,
Huettinger M (1999) Metabolism of activated complement component C3 is
mediated by the low density lipoprotein receptor-related protein/α2-
macroglobulin receptor. Journal of Biological Chemistry 274:38091-38096.
Mikhailenko I, Battey FD, Migliorini M, Ruiz JF, Argraves K, Moayeri M, Strickland
DK (2001) Recognition of α2-macroglobulin by the low density lipoprotein
receptor-related protein requires the cooperation of two ligand binding cluster
regions. Journal of Biological Chemistry 276:39484-39491.
158
Miller RH, David S, Patel R, Abney ER, Raff MC (1985) A quantitative
immunohistochemical study of macroglial cell development in the rat optic
nerve: In vivo evidence for two distinct astrocyte lineages. Developmental
Biology 111:35-41.
Miller RH, Raff MC (1984) Fibrous and protoplasmic astrocytes are biochemically and
developmentally distinct. Journal of Neuroscience 4:585-592.
Moestrup S, Gliemann J (1989) Purification of the rat hepatic alpha 2-macroglobulin
receptor as an approximately 440-kDa single chain protein. Journal of Biological
Chemistry 264:15574-15577.
Moestrup SK, Cui S, Vorum H, Bregengård C, Bjørn S, Norris K, Gliemann J,
Christensen EI (1995) Evidence that epithelial glycoprotein 330/megalin
mediates uptake of polybasic drugs. Journal of Clinical Investigation 96:1404-
1413.
Moestrup SK, Gliemann J, Pallesen G (1992) Distribution of the 2-macroglobulin
receptor/low density lipoprotein receptor-related protein in human tissues. Cell
and Tissue Research 269:375-382.
Monyer H, Burnashev N, Laurie DJ, Sakmann B, Seeburg PH (1994) Developmental
and regional expression in the rat brain and functional properties of four NMDA
receptors. Neuron 12:529-540.
Monyer H, Sprengel R, Schoepfer R, Herb A, Higuchi M, Lomeli H, Burnashev N,
Sakmann B, Seeburg PH (1992) Heteromeric NMDA receptors: molecular and
functional distinction of subtypes. Science 256:1217-1221.
Moriyoshi K, Masu M, Ishii T, Shigemoto R, Mizuno N, Nakanishi S (1991) Molecular
cloning and characterization of the rat NMDA receptor. Nature 354:31-37.
Morrot A, Strickland DK, Higuchi ML, Reis M, Pedrosa R, Scharfstein J (1997) Human
T cell responses against the major cysteine proteinase (cruzipain) of
Trypanosoma cruzi: role of the multifunctional alpha 2-macroglobulin receptor
in antigen presentation by monocytes. International Immunology 9:825-834.
Mueller BK (1999) Growth cone guidance: first steps towards a deeper understanding.
Annual Review of Neuroscience 22:351-388.
Mulligan SJ, MacVicar BA (2004) Calcium transients in astrocyte endfeet cause
cerebrovascular constrictions. Nature 431:195-199.
Murabe Y, Sano Y (1982) Morphological studies on neuroglia VI. Postnatal
development of microglial cells. Cell and Tissue Research 225:469-485.
Muramatsu H, Zou K, Sakaguchi N, Ikematsu S, Sakuma S, Muramatsu T (2000) LDL
receptor-related protein as a component of the midkine receptor. Biochemical
and Biophysical Research Communications 270:936-941.
Myklebost O, Arheden K, Rogne S, Kessel AG, Mandahl N, Herz J, Stanley K, Heim S,
Mitelman F (1989) The gene for the human putative apoE receptor is on
chromosome 12 in the segment q13-14. Genomics 5:65-69.
Nakamura H, O'Leary D (1989) Inaccuracies in initial growth and arborization of chick
retinotectal axons followed by course corrections and axon remodeling to
develop topographic order. Journal of Neuroscience 9:3776-3795.
Nathan BP, Jiang Y, Wong GK, Shen F, Brewer GJ, Struble RG (2002) Apolipoprotein
E4 inhibits, and apolipoprotein E3 promotes neurite outgrowth in cultured adult
mouse cortical neurons through the low-density lipoprotein receptor-related
protein. Brain Research 928:96-105.
Neels JG, van den Berg BMM, Lookene A, Olivecrona G, Pannekoek H, van Zonneveld
AJ (1999) The second and fourth cluster of class A cysteine-rich repeats of the
low density lipoprotein receptor-related protein share ligand-binding properties.
Journal of Biological Chemistry 274:31305-31311.
159
Nelson DL, Cox MM (2008) Lehninger principles of biochemistry: W.H Freeman and
Company.
Neugebauer KM, Tomaselli KJ, Lilien J, Reichardt LF (1988) N-cadherin, NCAM, and
integrins promote retinal neurite outgrowth on astrocytes in vitro. Journal of Cell
Biology 107:1177-1187.
Nicholls JG, Martin AR, Wallace BG, Fuchs PA (2001) From neuron to brain: Sinauer
Associates Sunderland, MA.
Niemeier A, Kassem M, Toedter K, Wendt D, Ruether W, Beisiegel U, Heeren J (2005)
Expression of LRP1 by human osteoblasts: a mechanism for the delivery of
lipoproteins and vitamin K1 to bone. Journal of Bone and Mineral Research
20:283-293.
Nimmerjahn A, Kirchhoff F, Helmchen F (2005) Resting microglial cells are highly
dynamic surveillants of brain parenchyma in vivo. Science 308:1314-1318.
Niwa‐Kawakita M, Abramowski V, Kalamarides M, Thomas G, Giovannini M (2000)
Targeted expression of Cre recombinase to myelinating cells of the central
nervous system in transgenic mice. Genesis 26:127-129.
Nowakowski RS, Rakic P (1979) The mode of migration of neurons to the
hippocampus: a Golgi and electron microscopic analysis in foetal rhesus
monkey. Journal of Neurocytology 8:697-718.
Nykjaer A, Kjøller L, Cohen RL, Lawrence DA, Garni-Wagner BA, Todd R, Van
Zonneveld A, Gliemann J, Andreasen PA (1994) Regions involved in binding of
urokinase-type-1 inhibitor complex and pro-urokinase to the endocytic alpha 2-
macroglobulin receptor/low density lipoprotein receptor-related protein.
Evidence that the urokinase receptor protects pro-urokinase against binding to
the endocytic receptor. Journal of Biological Chemistry 269:25668-25676.
Ogden CA, DeCathelineau A, Hoffmann PR, Bratton D, Ghebrehiwet B, Fadok VA,
Henson PM (2001) C1q and mannose binding lectin engagement of cell surface
calreticulin and CD91 initiates macropinocytosis and uptake of apoptotic cells.
Journal of Experimental Medicine 194:781-795.
Orita S, Henry K, Mantuano E, Yamauchi K, De Corato A, Ishikawa T, Feltri ML,
Wrabetz L, Gaultier A, Pollack M (2013) Schwann cell LRP1 regulates remak
bundle ultrastructure and axonal interactions to prevent neuropathic pain.
Journal of Neuroscience 33:5590-5602.
Orlando RA, Kerjaschki D, Kurihara H, Biemesderfer D, Farquhar MG (1992) gp330
associates with a 44-kDa protein in the rat kidney to form the Heymann nephritis
antigenic complex. Proceedings of the National Academy of Sciences 89:6698-
6702.
Orth K, Madison EL, Gething MJ, Sambrook JF, Herz J (1992) Complexes of tissue-
type plasminogen activator and its serpin inhibitor plasminogen-activator
inhibitor type 1 are internalized by means of the low density lipoprotein
receptor-related protein/alpha 2-macroglobulin receptor. Proceedings of the
National Academy of Sciences 89:7422-7426.
Papouin T, Ladépêche L, Ruel J, Sacchi S, Labasque M, Hanini M, Groc L, Pollegioni
L, Mothet JP, Oliet SHR (2012) Synaptic and extrasynaptic NMDA receptors
are gated by different endogenous coagonists. Cell 150:633-646.
Parpura V, Basarsky TA, Liu F, Jeftinija K, Jeftinija S, Haydon PG (1994) Glutamate-
mediated astrocyte–neuron signalling. Nature 369:744-747.
Paxinos G, Watson C (2007) The Rat Brain in Stereotaxic Coordinates 6th edn (New
York: Academic): Academic Press.
Perea G, Navarrete M, Araque A (2009) Tripartite synapses: astrocytes process and
control synaptic information. Trends in Neurosciences 32:421-431.
160
Pokorný J, Yamamoto T (1981) Postnatal ontogenesis of hippocampal CA1 area in rats.
I. Development of dendritic arborisation in pyramidal neurons. Brain Research
Bulletin 7:113-120.
Polavarapu R, Gongora MC, Yi H, Ranganthan S, Lawrence DA, Strickland D, Yepes
M (2007) Tissue-type plasminogen activator–mediated shedding of astrocytic
low-density lipoprotein receptor–related protein increases the permeability of the
neurovascular unit. Blood 109:3270-3278.
Qiu Z, Hyman BT, Rebeck GW (2004) Apolipoprotein E receptors mediate neurite
outgrowth through activation of p44/42 mitogen-activated protein kinase in
primary neurons. Journal of Biological Chemistry 279:34948-34956.
Qiu Z, Strickland DK, Hyman BT, Rebeck GW (2002) α2-Macroglobulin exposure
reduces calcium responses to N-methyl-D-aspartate via low density lipoprotein
receptor-related protein in cultured hippocampal neurons. Journal of Biological
Chemistry 277:14458-14466.
Quaife CJ, Findley SD, Erickson JC, Froelick GJ, Kelly EJ, Zambrowicz BP, Palmiter
RD (1994) Induction of a new metallothionein isoform (MT-IV) occurs during
differentiation of stratified squamous epithelia. Biochemistry 33:7250-7259.
Quinn KA, Grimsley PG, Dai YP, Tapner M, Chesterman CN, Owensby DA (1997)
Soluble low density lipoprotein receptor-related protein (LRP) circulates in
human plasma. Journal of Biological Chemistry 272:23946-23951.
Quinn KA, Pye VJ, Dai Y-P, Chesterman CN, Owensby DA (1999) Characterization of
the soluble form of the low density lipoprotein receptor-related protein (LRP).
Experimental Cell Research 251:433-441.
Rakic P (1972) Mode of cell migration to the superficial layers of fetal monkey
neocortex. Journal of Comparative Neurology 145:61-83.
Ramon Y, Cajal S (1909) Histologie du systeme nerveux de l’homme et des vertebres.
Maloine, Paris 774-838.
Rao A, Kim E, Sheng M, Craig AM (1998) Heterogeneity in the molecular composition
of excitatory postsynaptic sites during development of hippocampal neurons in
culture. Journal of Neuroscience 18:1217-1229.
Rebeck WG, Reiter JS, Strickland DK, Hyman BT (1993) Apolipoprotein E in sporadic
Alzheimer's disease: allelic variation and receptor interactions. Neuron 11:575-
580.
Reekmans SM, Pflanzner T, Gordts PLSM, Isbert S, Zimmermann P, Annaert W,
Weggen S, Roebroek AJM, Pietrzik CU (2010) Inactivation of the proximal
NPXY motif impairs early steps in LRP1 biosynthesis. Cellular and Molecular
Life Sciences 67:135-145.
Reymann KG, Kase H, Matthies H (1988) Inhibitors of calmodulin and protein kinase C
block different phases of hippocampal long-term potentiation. Brain Research
461:388-392.
Roebroek AJM, Reekmans S, Lauwers A, Feyaerts N, Smeijers L, Hartmann D (2006)
Mutant Lrp1 knock-in mice generated by recombinase-mediated cassette
exchange reveal differential importance of the NPXY motifs in the intracellular
domain of LRP1 for normal fetal development. Molecular and Cellular Biology
26:605-616.
Rogove AD, Siao C, Keyt B, Strickland S, Tsirka SE (1999) Activation of microglia
reveals a non-proteolytic cytokine function for tissue plasminogen activator in
the central nervous system. Journal of Cell Science 112:4007-4016.
Rohlmann A, Gotthardt M, Willnow TE, Hammer RE, Herz J (1996) Sustained somatic
gene inactivation by viral transfer of Cre recombinase. Nature Biotechnology
14:1562-1565.
161
Saenko EL, Yakhyaev AV, Mikhailenko I, Strickland DK, Sarafanov AG (1999) Role
of the low density lipoprotein-related protein receptor in mediation of factor VIII
catabolism. Journal of Biological Chemistry 274:37685-37692.
Saher G, Brügger B, Lappe-Siefke C, Möbius W, Tozawa R-i, Wehr MC, Wieland F,
Ishibashi S, Nave K-A (2005) High cholesterol level is essential for myelin
membrane growth. Nature Neuroscience 8:468-475.
Salicioni AM, Mizelle KS, Loukinova E, Mikhailenko I, Strickland DK, Gonias SL
(2002) The low density lipoprotein receptor-related protein mediates fibronectin
catabolism and inhibits fibronectin accumulation on cell surfaces. Journal of
Biological Chemistry 277:16160-16166.
Samson AL, Nevin ST, Croucher D, Niego B, Daniel PB, Weiss TW, Moreno E,
Monard D, Lawrence DA, Medcalf RL (2008) Tissue-type plasminogen
activator requires a co-receptor to enhance NMDA receptor function. Journal of
Neurochemistry 107:1091-1101.
Sattler R, Xiong Z, Lu W-Y, Hafner M, MacDonald JF, Tymianski M (1999) Specific
coupling of NMDA receptor activation to nitric oxide neurotoxicity by PSD-95
protein. Science 284:1845-1848.
Schwartz AL (1995) Receptor cell biology: receptor-mediated endocytosis. Pediatric
Research 38:835-843.
Schwob J, Fuller T, Price J, Olney J (1980) Widespread patterns of neuronal damage
following systemic or intracerebral injections of kainic acid: a histological study.
Neuroscience 5:991-1014.
Scoville WB, Milner B (1957) Loss of recent memory after bilateral hippocampal
lesions. Journal of Neurology, Neurosurgery & Psychiatry 20:11-21.
Seamans JK, Gorelova NA, Yang CR (1997) Contributions of voltage-gated Ca2+
channels in the proximal versus distal dendrites to synaptic integration in
prefrontal cortical neurons. Journal of Neuroscience 17:5936-5948.
Searle P, Davison B, Stuart G, Wilkie T, Norstedt G, Palmiter R (1984) Regulation,
linkage, and sequence of mouse metallothionein I and II genes. Molecular and
Cellular Biology 4:1221-1230.
Segarini PR, Nesbitt JE, Li D, Hays LG, Yates JR, Carmichael DF (2001) The low
density lipoprotein receptor-related protein/α2-macroglobulin receptor is a
receptor for connective tissue growth factor. Journal of Biological Chemistry
276:40659-40667.
Sen A, Alkon DL, Nelson TJ (2012) Apolipoprotein E3 (ApoE3) but Not ApoE4
Protects against Synaptic Loss through Increased Expression of Protein Kinase
Cϵ. Journal of Biological Chemistry 287:15947-15958.
Serafini T, Kennedy TE, Gaiko MJ, Mirzayan C, Jessell TM, Tessier-Lavigne M (1994)
The netrins define a family of axon outgrowth-promoting proteins homologous
to C. elegans UNC-6. Cell 78:409-424.
Sheng M, Cummings J, Roldan LA, Jan YN, Jan LY (1994) Changing subunit
composition of heteromeric NMDA receptors during development of rat cortex.
Nature 368:144-147.
Shevchenko A, Jensen ON, Podtelejnikov AV, Sagliocco F, Wilm M, Vorm O,
Mortensen P, Shevchenko A, Boucherie H, Mann M (1996) Linking genome
and proteome by mass spectrometry: large-scale identification of yeast proteins
from two dimensional gels. Proceedings of the National Academy of Sciences
93:14440-14445.
Shi Y, Mantuano E, Inoue G, Campana WM, Gonias SL (2009) Ligand binding to
LRP1 transactivates Trk receptors by a Src family kinase-dependent pathway.
Science Signaling 2:ra18.
162
Shibata M, Yamada S, Kumar SR, Calero M, Bading J, Frangione B, Holtzman DM,
Miller CA, Strickland DK, Ghiso J (2000) Clearance of Alzheimer’s amyloid-
peptide from brain by LDL receptor–related protein-1 at the blood-brain barrier.
Journal of Clinical Investigation 106:1489-1499.
Sloviter RS, Valiquette G, ABRAmS GM, Ronk EC, Sollas AL, Paul LA, Neubort S
(1989) Selective loss of hippocampal granule cells in the mature rat brain after
adrenalectomy. Science 243:535-538.
Smith GM, Miller RH, Silver J (1986) Changing role of forebrain astrocytes during
development, regenerative failure, and induced regeneration upon
transplantation. Journal of Comparative Neurology 251:23-43.
Sofroniew MV, Vinters HV (2010) Astrocytes: biology and pathology. Acta
Neuropathologica 119:7-35.
Sonn K, Pankratova S, Korshunova I, Zharkovsky A, Bock E, Berezin V, Kiryushko D
(2010) A metallothionein mimetic peptide protects neurons against kainic acid-
induced excitotoxicity. Journal of Neuroscience Research 88:1074-1082.
Springer TA (1998) An extracellular [beta]-propeller module predicted in lipoprotein
and scavenger receptors, tyrosine kinases, epidermal growth factor precursor,
and extracellular matrix components1. Journal of Molecular Biology 283:837-
862.
Squinto SP, Stitt TN, Aldrich TH, Davis S, Blanco SM, RadzieJewski C, Glass DJ,
Masiakowski P, Furth ME, Valenzuela DM (1991) trkB encodes a functional
receptor for brain-derived neurotrophic factor and neurotrophin-3 but not nerve
growth factor. Cell 65:885-893.
Stence N, Waite M, Dailey ME (2001) Dynamics of microglial activation: A confocal
time-lapse analysis in hippocampal slices. Glia 33:256-266.
Stiles TL, Dickendesher TL, Gaultier A, Fernandez-Castaneda A, Mantuano E, Giger
RJ, Gonias SL (2013) LDL receptor-related protein-1 is a sialic-acid-
independent receptor for myelin-associated glycoprotein that functions in neurite
outgrowth inhibition by MAG and CNS myelin. Journal of Cell Science
126:209-220.
Stocca G, Vicini S (1998) Increased contribution of NR2A subunit to synaptic NMDA
receptors in developing rat cortical neurons. Journal of Physiology 507:13-24.
Storm D, Herz J, Trinder P, Loos M (1997) C1 inhibitor-C1s complexes are internalized
and degraded by the low density lipoprotein receptor-related protein. Journal of
Biological Chemistry 272:31043-31050.
Strickland DK, Ashcom J, Williams S, Burgess W, Migliorini M, Argraves W (1990)
Sequence identity between the alpha 2-macroglobulin receptor and low density
lipoprotein receptor-related protein suggests that this molecule is a
multifunctional receptor. Journal of Biological Chemistry 265:17401-17404.
Strittmatter WJ, Saunders AM, Schmechel D, Pericak-Vance M, Enghild J, Salvesen
GS, Roses AD (1993) Apolipoprotein E: high-avidity binding to beta-amyloid
and increased frequency of type 4 allele in late-onset familial Alzheimer disease.
Proceedings of the National Academy of Sciences 90:1977-1981.
Sultana R, Banks WA, Butterfield DA (2010) Decreased levels of PSD95 and two
associated proteins and increased levels of BCl2 and caspase 3 in hippocampus
from subjects with amnestic mild cognitive impairment: Insights into their
potential roles for loss of synapses and memory, accumulation of A , and
neurodegeneration in a prodromal stage of Alzheimer's disease. Journal of
Neuroscience Research 88:469-477.
Takahashi A, Camacho P, Lechleiter JD, Herman B (1999) Measurement of
intracellular calcium. Physiological Reviews 79:1089-1125.
163
Taylor AM, Blurton-Jones M, Rhee SW, Cribbs DH, Cotman CW, Jeon NL (2005) A
microfluidic culture platform for CNS axonal injury, regeneration and transport.
Nature Methods 2:599-605.
Thomas CG, Miller AJ, Westbrook GL (2006) Synaptic and extrasynaptic NMDA
receptor NR2 subunits in cultured hippocampal neurons. Journal of
Neurophysiology 95:1727-1734.
Trommsdorff M, Borg JP, Margolis B, Herz J (1998) Interaction of cytosolic adaptor
proteins with neuronal apolipoprotein E receptors and the amyloid precursor
protein. Journal of Biological Chemistry 273:33556-33560.
Udom AO, Brady FO (1980) Reactivation in vitro of zinc-requiring apo-enzymes by rat
liver zinc-thionein. Biochemical Journal 187:329-335.
Uhlmann EJ, Wong M, Baldwin RL, Bajenaru ML, Onda H, Kwiatkowski DJ, Yamada
K, Gutmann DH (2002) Astrocyte-specific TSC1 conditional knockout mice
exhibit abnormal neuronal organization and seizures. Annals of neurology
52:285-296.
Ullian EM, Sapperstein SK, Christopherson KS, Barres BA (2001) Control of synapse
number by glia. Science 291:657-661.
Van Kerkhof P, Lee J, McCormick L, Tetrault E, Lu W, Schoenfish M, Oorschot V,
Strous GJ, Klumperman J, Bu G (2005) Sorting nexin 17 facilitates LRP
recycling in the early endosome. The EMBO Journal 24:2851-2861.
Vandivier RW, Ogden CA, Fadok VA, Hoffmann PR, Brown KK, Botto M, Walport
MJ, Fisher JH, Henson PM, Greene KE (2002) Role of surfactant proteins A, D,
and C1q in the clearance of apoptotic cells in vivo and in vitro: calreticulin and
CD91 as a common collectin receptor complex. Journal of Immunology
169:3978-3986.
Vaughn JE (1989) Review: fine structure of synaptogenesis in the vertebrate central
nervous system. Synapse 3:255-285.
Vicini S, Wang JF, Li JH, Zhu WJ, Wang YH, Luo JH, Wolfe BB, Grayson DR (1998)
Functional and pharmacological differences between recombinant N-methyl-D-
aspartate receptors. Journal of Neurophysiology 79:555-566.
von Arnim CAF, Kinoshita A, Peltan ID, Tangredi MM, Herl L, Lee BM, Spoelgen R,
Hshieh TT, Ranganathan S, Battey FD (2005) The low density lipoprotein
receptor-related protein (LRP) is a novel β-secretase (BACE1) substrate. Journal
of Biological Chemistry 280:17777-17785.
Warshawsky I, Broze GJ, Schwartz AL (1994) The low density lipoprotein receptor-
related protein mediates the cellular degradation of tissue factor pathway
inhibitor. Proceedings of the National Academy of Sciences 91:6664-6668.
Willemen HL, Eijkelkamp N, Wang H, Dantzer R, Dorn II GW, Kelley KW, Heijnen
CJ, Kavelaars A (2010) Microglial/macrophage GRK2 determines duration of
peripheral IL-1β-induced hyperalgesia: contribution of spinal cord CX3CR1,
p38 and IL-1 signaling. Pain 150:550-560.
Willnow TE, Armstrong SA, Hammer RE, Herz J (1995) Functional expression of low
density lipoprotein receptor-related protein is controlled by receptor-associated
protein in vivo. Proceedings of the National Academy of Sciences 92:4537-
4541.
Willnow TE, Goldstein J, Orth K, Brown M, Herz J (1992) Low density lipoprotein
receptor-related protein and gp330 bind similar ligands, including plasminogen
activator-inhibitor complexes and lactoferrin, an inhibitor of chylomicron
remnant clearance. Journal of Biological Chemistry 267:26172-26180.
Willnow TE, Sheng Z, Ishibashi S, Herz J (1994) Inhibition of hepatic chylomicron
remnant uptake by gene transfer of a receptor antagonist. Science 264:1471-
1474.
164
Wolf B, Lopes M, VandenBerg S, Gonias S (1992) Characterization and
immunohistochemical localization of alpha 2-macroglobulin receptor (low-
density lipoprotein receptor-related protein) in human brain. American Journal
of Pathology 141:37-42.
Wolswijk G, Noble M (1989) Identification of an adult-specific glial progenitor cell.
Development 105:387-400.
Wood ER, Mumby DG, Pinel JP, Phillips AG (1993) Impaired object recognition
memory in rats following ischemia-induced damage to the hippocampus.
Behavioral Neuroscience 107:51-62.
Wu C, Wen C, Shieh J, Ling E (1992) A quantitative and morphometric study of the
transformation of amoeboid microglia into ramified microglia in the developing
corpus callosum in rats. Journal of Anatomy 181:423.
Xing J, Kornhauser JM, Xia Z, Thiele EA, Greenberg ME (1998) Nerve growth factor
activates extracellular signal-regulated kinase and p38 mitogen-activated protein
kinase pathways to stimulate CREB serine 133 phosphorylation. Molecular and
Cellular Biology 18:1946-1955.
Xu G, Karch C, Li N, Lin N, Fromholt D, Gonzales V, Borchelt DR (2008) Receptor-
associated protein (RAP) plays a central role in modulating Aβ deposition in
APP/PS1 transgenic mice. PLoS One 3:e3159.
Yamada KM, Spooner BS, Wessells NK (1970) Axon growth: roles of microfilaments
and microtubules. Proceedings of the National Academy of Sciences 66:1206-
1212.
Yamauchi K, Yamauchi T, Mantuano E, Murakami K, Henry K, Takahashi K,
Campana WM (2013) Low density lipoprotein receptor related protein-1
(LRP1)-dependent cell signaling promotes neurotrophic activity in embryonic
sensory neurons. PLoS One 8:e75497.
Yang DD, Kuan C-Y, Whitmarsh AJ, Rinócn M, Zheng TS, Davis RJ, Rakic P, Flavell
RA (1997) Absence of excitotoxicity-induced apoptosis in the hippocampus of
mice lacking the Jnk3 gene. Nature 389:865-870.
Ye G, Metreveli NS, Ren J, Epstein PN (2003) Metallothionein prevents diabetes-
induced deficits in cardiomyocytes by inhibiting reactive oxygen species
production. Diabetes 52:777-783.
Yepes M, Sandkvist M, Moore EG, Bugge TH, Strickland DK, Lawrence DA (2003)
Tissue-type plasminogen activator induces opening of the blood-brain barrier via
the LDL receptor-related protein. Journal of Clinical Investigation 112:1533-
1540.
Yoon C, Van Niekerk EA, Henry K, Ishikawa T, Orita S, Tuszynski MH, Campana
WM (2013) Low-density lipoprotein receptor-related protein 1 (LRP1)-
dependent cell signaling promotes axonal regeneration. Journal of Biological
Chemistry 288:26557-26568.
Yoon SO, Casaccia-Bonnefil P, Carter B, Chao MV (1998) Competitive signaling
between TrkA and p75 nerve growth factor receptors determines cell survival.
Journal of Neuroscience 18:3273-3281.
Yoshida K, Gage FH (1991) Fibroblast growth factors stimulate nerve growth factor
synthesis and secretion by astrocytes. Brain Research 538:118-126.
Young JK, Garvey JS, Huang P (1991) Glial immunoreactivity for metallothionein in
the rat brain. Glia 4:602-610.
Yuan J, Yankner BA (2000) Apoptosis in the nervous system. Nature 407:802-809.
Yuste R, Gutnick MJ, Saar D, Delaney KR, Tank DW (1994) Ca2+ accumulations in
dendrites of neocortical pyramidal neurons: An apical band and evidence for two
functional compartments. Neuron 13:23-43.
165
Zerbinatti CV, Wozniak DF, Cirrito J, Cam JA, Osaka H, Bales KR, Zhuo M, Paul SM,
Holtzman DM, Bu G (2004) Increased soluble amyloid- peptide and memory
deficits in amyloid model mice overexpressing the low-density lipoprotein
receptor-related protein. Proceedings of the National Academy of Sciences
101:1075-1080.
Zheng C, Heintz N, Hatten ME (1996) CNS gene encoding astrotactin, which supports
neuronal migration along glial fibers. Science 272:417-419.
Zheng G, Bachinsky D, Stamenkovic I, Strickland D, Brown D, Andres G, McCluskey
R (1994) Organ distribution in rats of two members of the low-density
lipoprotein receptor gene family, gp330 and LRP/alpha 2MR, and the receptor-
associated protein (RAP). Journal of Histochemistry and Cytochemistry 42:531-
542.
Zhou Q, Wang S, Anderson DJ (2000) Identification of a novel family of
oligodendrocyte lineage-specific basic helix–loop–helix transcription factors.
Neuron 25:331-343.
Zhuo M, Holtzman DM, Li Y, Osaka H, DeMaro J, Jacquin M, Bu G (2000) Role of
tissue plasminogen activator receptor LRP in hippocampal long-term
potentiation. The Journal of Neuroscience 20:542-549.
Zlokovic BV, Deane R, Sagare AP, Bell RD, Winkler EA (2010) Low density
lipoprotein receptor-related protein 1: a serial clearance homeostatic mechanism
controlling Alzheimer’s amyloid β peptide elimination from the brain. Journal of
Neurochemistry 115:1077-1089.
Zola-Morgan S, Squire LR, Amaral D (1986) Human amnesia and the medial temporal
region: enduring memory impairment following a bilateral lesion limited to field
CA1 of the hippocampus. Journal of Neuroscience 6:2950-2967.
Zonta M, Angulo MC, Gobbo S, Rosengarten B, Hossmann K-A, Pozzan T,
Carmignoto G (2002) Neuron-to-astrocyte signaling is central to the dynamic
control of brain microcirculation. Nature Neuroscience 6:43-50.
166
Appendix 1: Solution and buffer recipes
GENERAL SOLUTIONS AND BUFFERS
0.9% SALINE
0.45g sodium chloride was dissolved in 50mL milliQ water and filter sterilized.
4% PARAFORMALDEHYDE
40g prilled paraformaldehyde was dissolved in 500mL 60°C milliQ water with 10M
sodium hydroxide added until solution became clear. Solution was then added to 500mL
2X PBS and stored at 4°C.
PHOSPHATE BUFFERED SALINE
10mL 200mM sodium dihydrogen orthophosphate, 40mL 200mM sodium phosphate
dibasic dihydrate and 100mL 0.9% saline were mixed together in 850mL milliQ water.
TISSUE PROCESSING
CITRATE BUFFER
1.92g citric acid was added to 900mL milliQ water, pH-ed to 6.0 and made up to 1L.
Buffer was stored at 4°C and could be reused five times for antigen retrieval.
SUCROSE
1g, 2g or 3g sucrose was dissolved in 10mL milliQ water to make sucrose solutions of
10%, 20% and 30% respectively.
167
NEURON CULTURE
HANK’S BUFFERED SALINE SOLUTION
One vial of Hank’s buffered saline solution and 0.35g sodium bicarbonate was
dissolved in 1L distilled water and filtered through a 0.22μm bottle top filter in a sterile
environment. Stored at 4ºC.
SERUM FREE MEDIA (NEUROBASAL)
500mL neurobasal was supplemented with 0.1% B27, 0.5mM L-glutamine, 0.1%
gentamicin.
WESTERN BLOTTING
0.05% PBS-TWEEN
500μL Tween-20 was added to 1L PBS.
4X REDUCING BUFFER
5mL 1M Tris hydrochloride (pH 6.8), 2mL 20% sodium dodecyl sulfate, 2mL glycerol,
2mL β-mercaptoethanol and 0.02% bromophenol blue were mixed together and stored
at -20°C.
5% MILK POWDER
5g skim milk powder was dissolved in 100mL PBS-Tween.
5% STACKING GEL
3.55mL milliQ, 833μL 30% acrylamide-bis, 625μL 1M Tris hydrochloride (pH 6.8) and
50μL 10% sodium dodecyl sulfate were mixed together. 150μL 10% ammonium
persulfate and 6μL N,N,N,N-tetramethylethylenediamine were added immediately prior
to pouring gel into cast.
168
10% RESOLVING GEL
4.4mL milliQ water, 5mL 30% acrylamide-bis, 5.6mL 1M Tris hydrochloride (pH 8.7)
and 150μL 10% sodium dodecyl sulfate were mixed together. 150μL 10% ammonium
persulfate and 22.5μL N,N,N,N-tetramethylethylenediamine were added immediately
prior to pouring gel into cast.
10X RUNNING BUFFER
5g SDS, 15g Trizma base and 72g glycine were mixed together in 500mL milliQ water.
1X running buffer was prepared by mixing 80mL 10X running buffer in 720mL milliQ
water.
30% ACRYLAMIDE-BIS
150g acrylamide and 4g bis were mixed together in 300mL milliQ water. Total volume
was brought to 500mL and allowed to warm to room temperature before being stored at
4°C.
RADIO IMMUNOPRECIPITATION ASSAY (RIPA) BUFFER
0.394g Tris hydrochloride, 0.4383g sodium chloride, 0.0186g EDTA, 500μL Triton X-
100, 0.5g sodium deoxycholate and 0.05g sodium dodecyl sulfate was added to 50mL
milliQ and mixed on an orbital shaker overnight. Buffer was pH-ed to 7.4.
TRANSFER BUFFER
11.5g glycine and 2.4g Trizma base were dissolved in 160mL methanol and 640mL
milliQ water at 4°C.
169
LIVE CELL CALCIUM IMAGING
IMAGING BUFFER STOCKS
The following amounts were dissolved in 50mL milliQ to make 1M stocks:
Calcium chloride: 7.35g dihydrous calcium chloride
Magnesium chloride: 10.17g hexahydrous magnesium chloride
Glucose: 9.00g D-(+)-glucose
IMAGING BUFFER
100mL buffer was made up with sterile milliQ water containing 2mM calcium chloride
(200μL of 1M), 1mM magnesium chloride (100μL of 1M stock), 10mM glucose (1mL
of 1M stock), 10mM HEPES (1mL of 1M stock) and 10mM HBSS (10mL of 10X
stock), adjusted to a pH of 7.2-7.4 and filter sterilised.
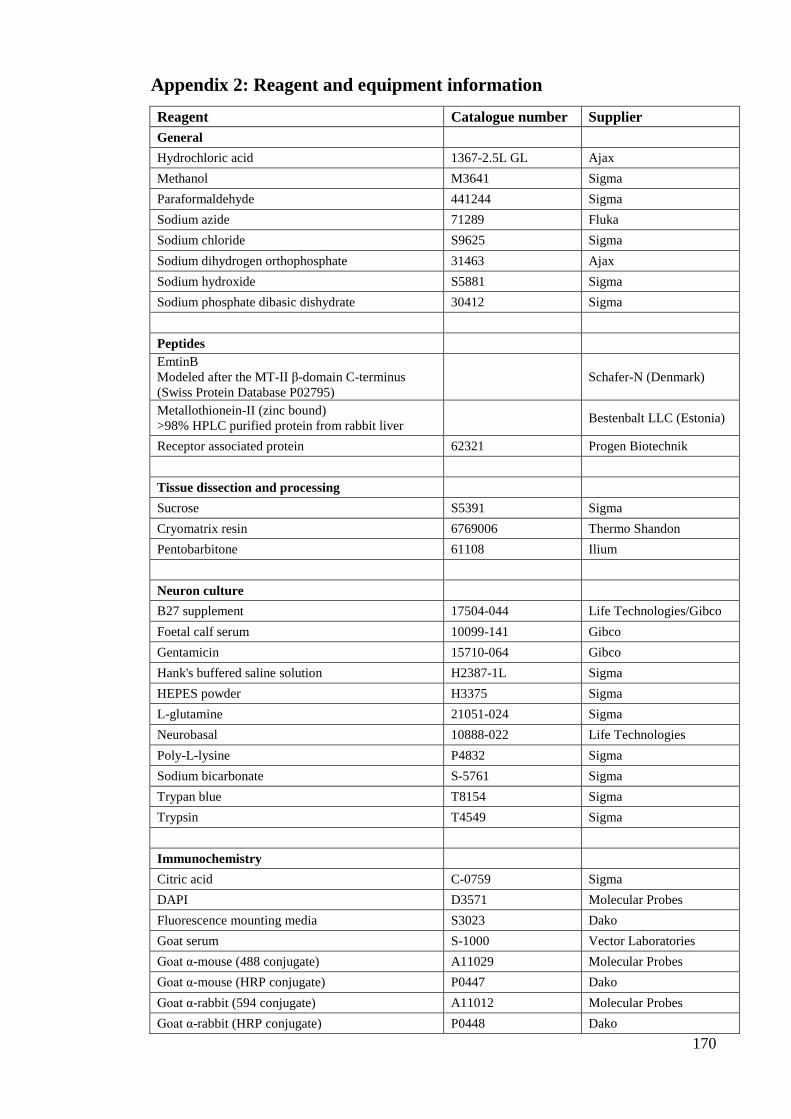
170
Appendix 2: Reagent and equipment information
Reagent Catalogue number Supplier
General
Hydrochloric acid 1367-2.5L GL Ajax
Methanol M3641 Sigma
Paraformaldehyde 441244 Sigma
Sodium azide 71289 Fluka
Sodium chloride S9625 Sigma
Sodium dihydrogen orthophosphate 31463 Ajax
Sodium hydroxide S5881 Sigma
Sodium phosphate dibasic dishydrate 30412 Sigma
Peptides
EmtinB
Modeled after the MT-II β-domain C-terminus
(Swiss Protein Database P02795)
Schafer-N (Denmark)
Metallothionein-II (zinc bound)
>98% HPLC purified protein from rabbit liver Bestenbalt LLC (Estonia)
Receptor associated protein 62321 Progen Biotechnik
Tissue dissection and processing
Sucrose S5391 Sigma
Cryomatrix resin 6769006 Thermo Shandon
Pentobarbitone 61108 Ilium
Neuron culture
B27 supplement 17504-044 Life Technologies/Gibco
Foetal calf serum 10099-141 Gibco
Gentamicin 15710-064 Gibco
Hank's buffered saline solution H2387-1L Sigma
HEPES powder H3375 Sigma
L-glutamine 21051-024 Sigma
Neurobasal 10888-022 Life Technologies
Poly-L-lysine P4832 Sigma
Sodium bicarbonate S-5761 Sigma
Trypan blue T8154 Sigma
Trypsin T4549 Sigma
Immunochemistry
Citric acid C-0759 Sigma
DAPI D3571 Molecular Probes
Fluorescence mounting media S3023 Dako
Goat serum S-1000 Vector Laboratories
Goat α-mouse (488 conjugate) A11029 Molecular Probes
Goat α-mouse (HRP conjugate) P0447 Dako
Goat α-rabbit (594 conjugate) A11012 Molecular Probes
Goat α-rabbit (HRP conjugate) P0448 Dako
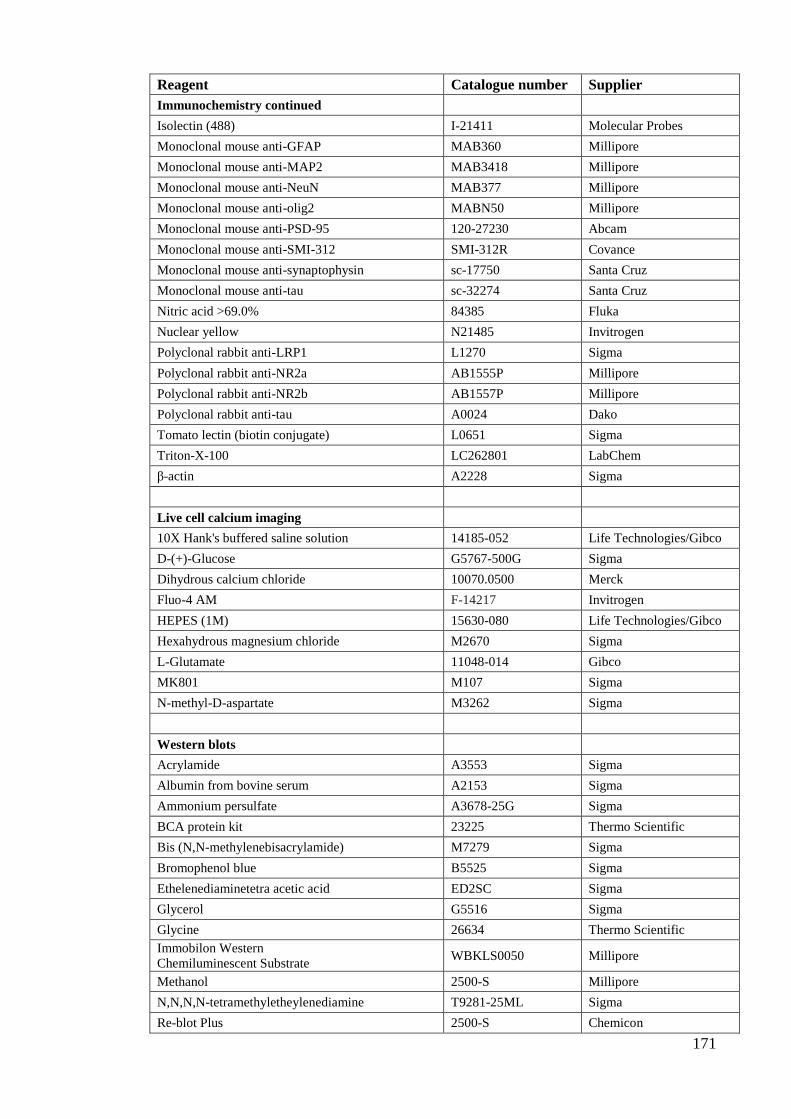
171
Reagent Catalogue number Supplier
Immunochemistry continued
Isolectin (488) I-21411 Molecular Probes
Monoclonal mouse anti-GFAP MAB360 Millipore
Monoclonal mouse anti-MAP2 MAB3418 Millipore
Monoclonal mouse anti-NeuN MAB377 Millipore
Monoclonal mouse anti-olig2 MABN50 Millipore
Monoclonal mouse anti-PSD-95 120-27230 Abcam
Monoclonal mouse anti-SMI-312 SMI-312R Covance
Monoclonal mouse anti-synaptophysin sc-17750 Santa Cruz
Monoclonal mouse anti-tau sc-32274 Santa Cruz
Nitric acid >69.0% 84385 Fluka
Nuclear yellow N21485 Invitrogen
Polyclonal rabbit anti-LRP1 L1270 Sigma
Polyclonal rabbit anti-NR2a AB1555P Millipore
Polyclonal rabbit anti-NR2b AB1557P Millipore
Polyclonal rabbit anti-tau A0024 Dako
Tomato lectin (biotin conjugate) L0651 Sigma
Triton-X-100 LC262801 LabChem
β-actin A2228 Sigma
Live cell calcium imaging
10X Hank's buffered saline solution 14185-052 Life Technologies/Gibco
D-(+)-Glucose G5767-500G Sigma
Dihydrous calcium chloride 10070.0500 Merck
Fluo-4 AM F-14217 Invitrogen
HEPES (1M) 15630-080 Life Technologies/Gibco
Hexahydrous magnesium chloride M2670 Sigma
L-Glutamate 11048-014 Gibco
MK801 M107 Sigma
N-methyl-D-aspartate M3262 Sigma
Western blots
Acrylamide A3553 Sigma
Albumin from bovine serum A2153 Sigma
Ammonium persulfate A3678-25G Sigma
BCA protein kit 23225 Thermo Scientific
Bis (N,N-methylenebisacrylamide) M7279 Sigma
Bromophenol blue B5525 Sigma
Ethelenediaminetetra acetic acid ED2SC Sigma
Glycerol G5516 Sigma
Glycine 26634 Thermo Scientific
Immobilon Western
Chemiluminescent Substrate WBKLS0050 Millipore
Methanol 2500-S Millipore
N,N,N,N-tetramethyletheylenediamine T9281-25ML Sigma
Re-blot Plus 2500-S Chemicon
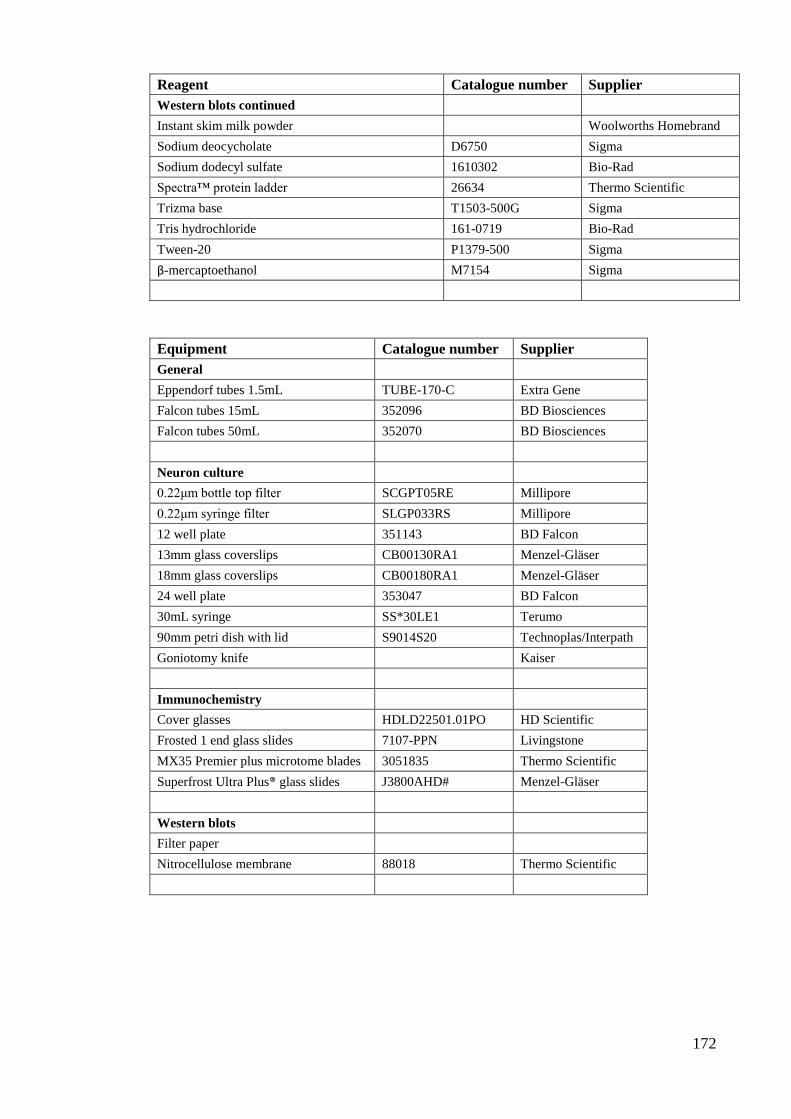
172
Reagent Catalogue number Supplier
Western blots continued
Instant skim milk powder Woolworths Homebrand
Sodium deocycholate D6750 Sigma
Sodium dodecyl sulfate 1610302 Bio-Rad
Spectra™ protein ladder 26634 Thermo Scientific
Trizma base T1503-500G Sigma
Tris hydrochloride 161-0719 Bio-Rad
Tween-20 P1379-500 Sigma
β-mercaptoethanol M7154 Sigma
Equipment Catalogue number Supplier
General
Eppendorf tubes 1.5mL TUBE-170-C Extra Gene
Falcon tubes 15mL 352096 BD Biosciences
Falcon tubes 50mL 352070 BD Biosciences
Neuron culture
0.22μm bottle top filter SCGPT05RE Millipore
0.22μm syringe filter SLGP033RS Millipore
12 well plate 351143 BD Falcon
13mm glass coverslips CB00130RA1 Menzel-Gläser
18mm glass coverslips CB00180RA1 Menzel-Gläser
24 well plate 353047 BD Falcon
30mL syringe SS*30LE1 Terumo
90mm petri dish with lid S9014S20 Technoplas/Interpath
Goniotomy knife Kaiser
Immunochemistry
Cover glasses HDLD22501.01PO HD Scientific
Frosted 1 end glass slides 7107-PPN Livingstone
MX35 Premier plus microtome blades 3051835 Thermo Scientific
Superfrost Ultra Plus® glass slides J3800AHD# Menzel-Gläser
Western blots
Filter paper
Nitrocellulose membrane 88018 Thermo Scientific