Embed Size (px)
Citation preview
U.S. Department of JusticeOffice of Justice ProgramsBureau of Justice Statistics
Bu
lletin
Celebrating 35 years
July 2015, NCJ 248767
HIGHLIGHTS � The percentage of local police departments that
authorized their officers to use conducted energy weapons such as Tasers increased from 60% in 2007 to 81% in 2013.
� The percentage of local police departments that required officers to wear protective armor at all times increased from 65% in 2007 to 71% in 2013.
� From 2007 to 2013, the percentage of local police departments using in-car video cameras increased from 61% to 68%.
� About a third (32%) of local police departments used body-worn cameras in 2013.
� About 1 in 6 local police departments used automated vehicle license plate readers in 2013, including a majority of those serving a population of 25,000 or more.
� More than 90% of local police departments serving 25,000 or more residents provided patrol officers with in-field computerized access to vehicle records, driving records, and outstanding warrants.
� Among local police departments serving 10,000 or more residents, more than 90% had their own website and more than 80% used social media.
� About 60% of local police departments provided crime statistics to citizens electronically, including more than 90% of those serving 25,000 or more residents.
Local Police Departments, 2013: Equipment and TechnologyBrian A. Reaves, Ph.D., BJS Statistician
The overall percentage of the more than 12,000 local police departments in the United States authorizing the use of conducted energy
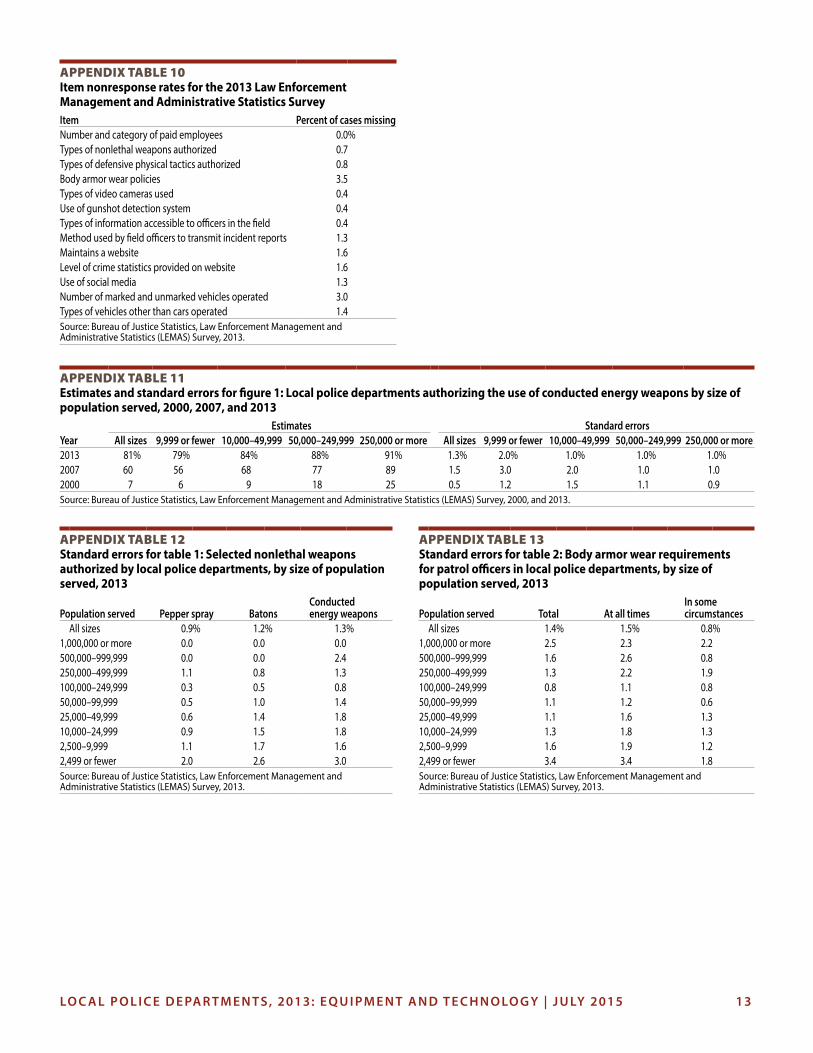
weapons (CEWs) increased from 7% in 2000 to 81% in 2013 (figure 1). CEWs include Tasers and stun guns. Large increases were observed in all population categories. About 9 in 10 departments also authorized their officers to use pepper spray and batons in 2013.
Findings are based on the 2013 Law Enforcement Management and Administrative Statistics (LEMAS) Survey sponsored by the Bureau of Justice Statistics (BJS). The LEMAS Survey, conducted periodically since 1987, collects data from a nationally representative sample of state and local law enforcement agencies. Prior to the 2013 survey, the most recent LEMAS Survey was conducted in 2007.
This report uses data from the 2013 LEMAS Survey to describe the equipment (such as nonlethal weapons and body armor) and technology (such as video cameras, license plate readers, and websites) used by local police departments. Comparisons are made with prior years where appropriate, and when data are available.
Figure 1Local police departments authorizing the use of conducted energy weapons, by size of population served, 2000, 2007, and 2013
Note: Conducted energy weapons include Tasers and stun guns. See appendix table 1 for the total number of departments. See appendix table 11 for estimates and standard errors.Source: Bureau of Justice Statistics, Law Enforcement Management and Administrative Statistics (LEMAS) Survey, 2000, 2007, and 2013.
Percent of departments
20072013
0 20 40 60 80 100
2000
9,999 or fewer
10,000–49,999
50,000–249,999
250,000 or more
All sizes
Population served
LO C A L P O L I C E D E PA R T M E N T S , 2013: E Q U I P M E N T A N D T E C H N O LO G Y | J U LY 2015 2
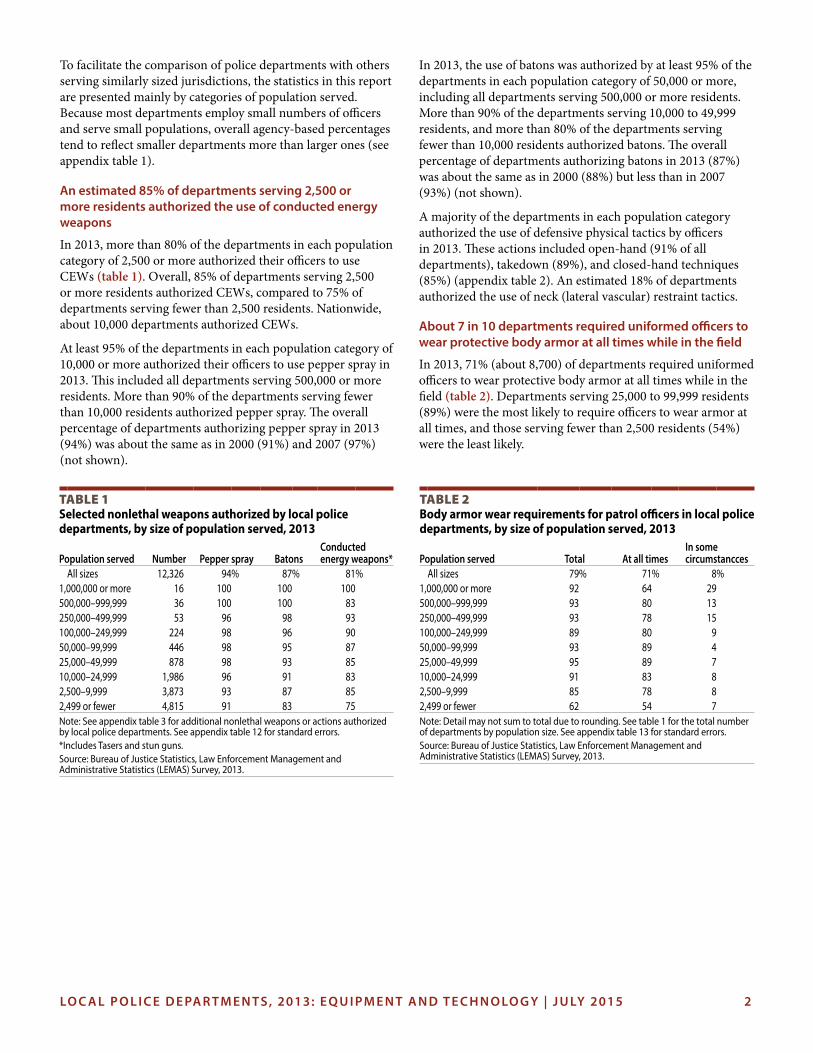
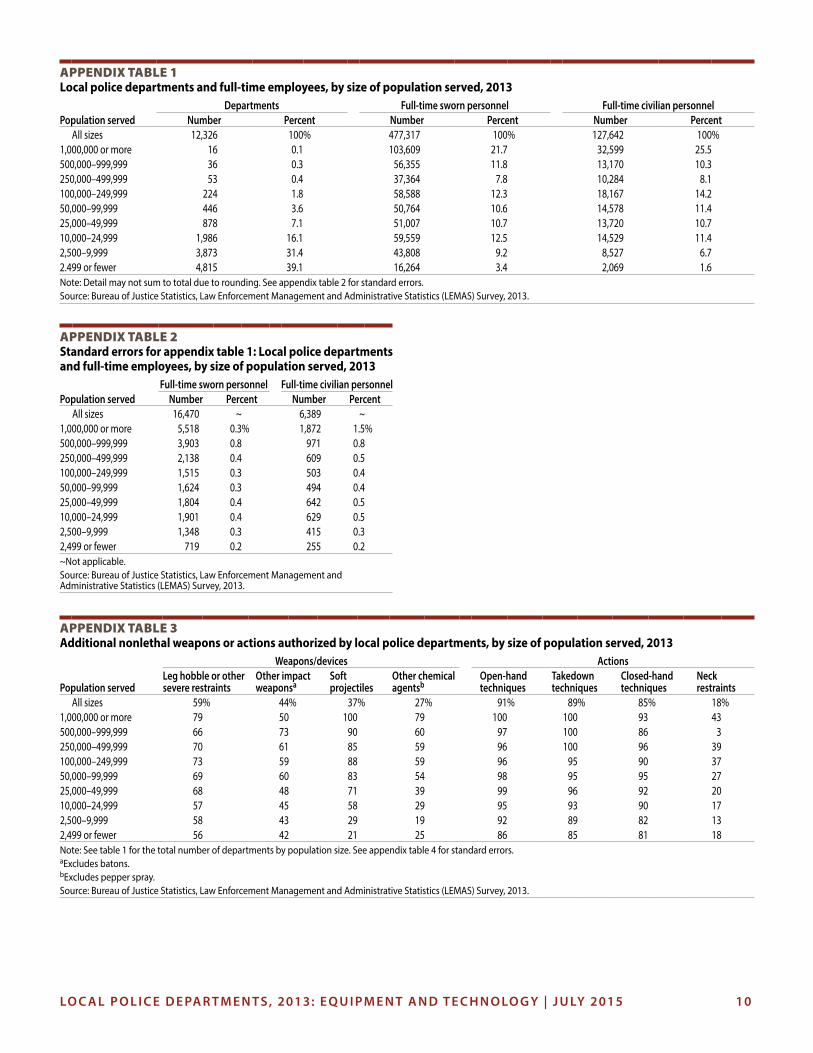
To facilitate the comparison of police departments with others serving similarly sized jurisdictions, the statistics in this report are presented mainly by categories of population served. Because most departments employ small numbers of officers and serve small populations, overall agency-based percentages tend to reflect smaller departments more than larger ones (see appendix table 1).
An estimated 85% of departments serving 2,500 or more residents authorized the use of conducted energy weapons
In 2013, more than 80% of the departments in each population category of 2,500 or more authorized their officers to use CEWs (table 1). Overall, 85% of departments serving 2,500 or more residents authorized CEWs, compared to 75% of departments serving fewer than 2,500 residents. Nationwide, about 10,000 departments authorized CEWs.
At least 95% of the departments in each population category of 10,000 or more authorized their officers to use pepper spray in 2013. This included all departments serving 500,000 or more residents. More than 90% of the departments serving fewer than 10,000 residents authorized pepper spray. The overall percentage of departments authorizing pepper spray in 2013 (94%) was about the same as in 2000 (91%) and 2007 (97%) (not shown).
In 2013, the use of batons was authorized by at least 95% of the departments in each population category of 50,000 or more, including all departments serving 500,000 or more residents. More than 90% of the departments serving 10,000 to 49,999 residents, and more than 80% of the departments serving fewer than 10,000 residents authorized batons. The overall percentage of departments authorizing batons in 2013 (87%) was about the same as in 2000 (88%) but less than in 2007 (93%) (not shown).
A majority of the departments in each population category authorized the use of defensive physical tactics by officers in 2013. These actions included open-hand (91% of all departments), takedown (89%), and closed-hand techniques (85%) (appendix table 2). An estimated 18% of departments authorized the use of neck (lateral vascular) restraint tactics.
About 7 in 10 departments required uniformed officers to wear protective body armor at all times while in the field
In 2013, 71% (about 8,700) of departments required uniformed officers to wear protective body armor at all times while in the field (table 2). Departments serving 25,000 to 99,999 residents (89%) were the most likely to require officers to wear armor at all times, and those serving fewer than 2,500 residents (54%) were the least likely.
Table 1Selected nonlethal weapons authorized by local police departments, by size of population served, 2013
Population served Number Pepper spray BatonsConducted energy weapons*
All sizes 12,326 94% 87% 81%1,000,000 or more 16 100 100 100500,000–999,999 36 100 100 83250,000–499,999 53 96 98 93100,000–249,999 224 98 96 9050,000–99,999 446 98 95 8725,000–49,999 878 98 93 8510,000–24,999 1,986 96 91 832,500–9,999 3,873 93 87 852,499 or fewer 4,815 91 83 75Note: See appendix table 3 for additional nonlethal weapons or actions authorized by local police departments. See appendix table 12 for standard errors.*Includes Tasers and stun guns.Source: Bureau of Justice Statistics, Law Enforcement Management and Administrative Statistics (LEMAS) Survey, 2013.
Table 2 Body armor wear requirements for patrol officers in local police departments, by size of population served, 2013
Population served Total At all timesIn some circumstancces
All sizes 79% 71% 8%1,000,000 or more 92 64 29500,000–999,999 93 80 13250,000–499,999 93 78 15100,000–249,999 89 80 950,000–99,999 93 89 425,000–49,999 95 89 710,000–24,999 91 83 82,500–9,999 85 78 82,499 or fewer 62 54 7Note: Detail may not sum to total due to rounding. See table 1 for the total number of departments by population size. See appendix table 13 for standard errors.Source: Bureau of Justice Statistics, Law Enforcement Management and Administrative Statistics (LEMAS) Survey, 2013.
LO C A L P O L I C E D E PA R T M E N T S , 2013: E Q U I P M E N T A N D T E C H N O LO G Y | J U LY 2015 3
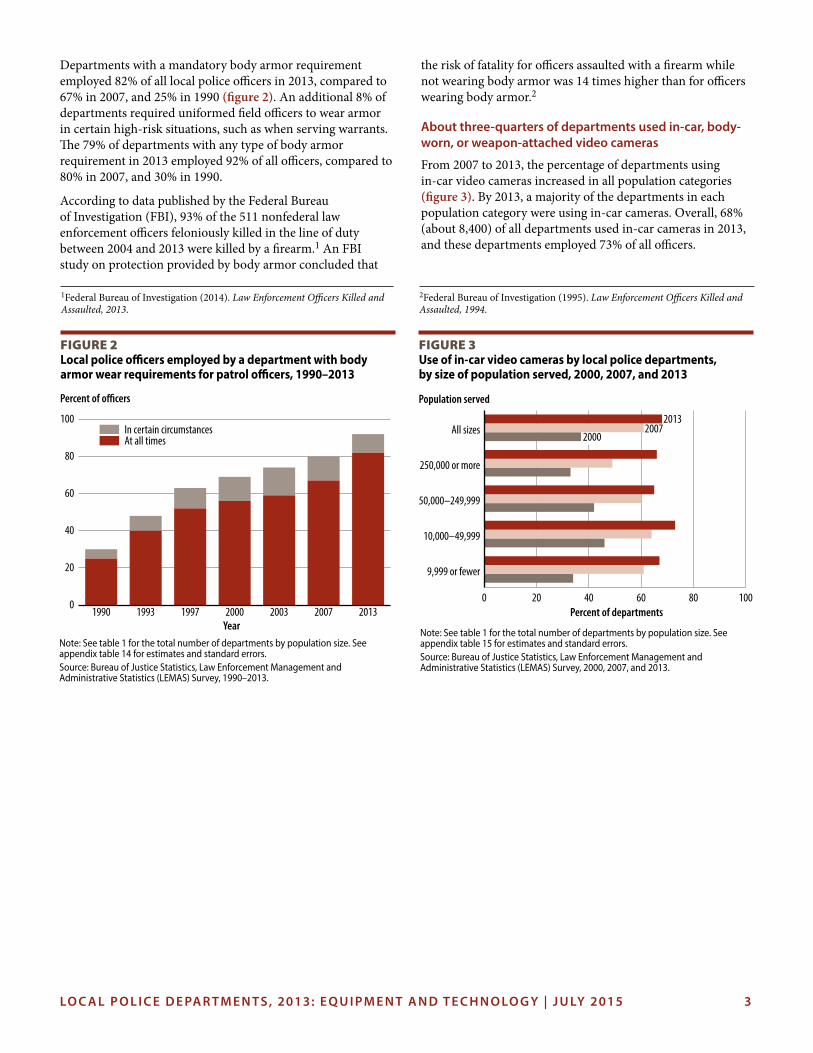
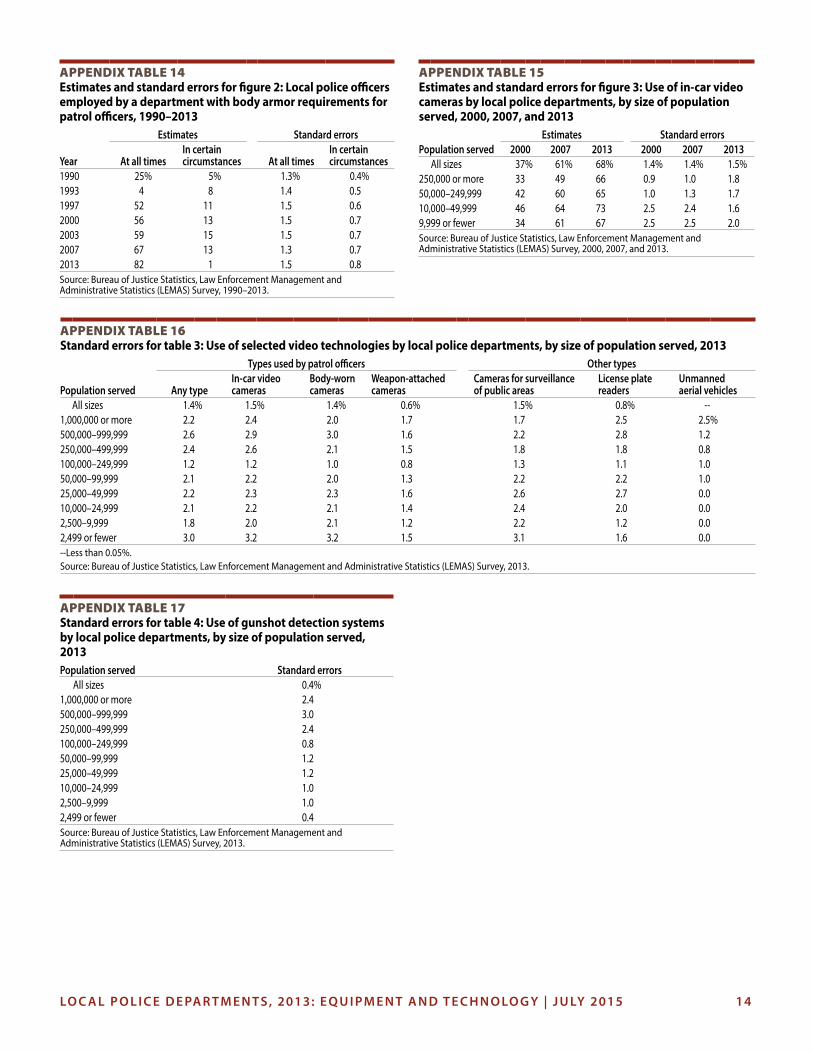
Departments with a mandatory body armor requirement employed 82% of all local police officers in 2013, compared to 67% in 2007, and 25% in 1990 (figure 2). An additional 8% of departments required uniformed field officers to wear armor in certain high-risk situations, such as when serving warrants. The 79% of departments with any type of body armor requirement in 2013 employed 92% of all officers, compared to 80% in 2007, and 30% in 1990.
According to data published by the Federal Bureau of Investigation (FBI), 93% of the 511 nonfederal law enforcement officers feloniously killed in the line of duty between 2004 and 2013 were killed by a firearm.1 An FBI study on protection provided by body armor concluded that
the risk of fatality for officers assaulted with a firearm while not wearing body armor was 14 times higher than for officers wearing body armor.2
About three-quarters of departments used in-car, body-worn, or weapon-attached video cameras
From 2007 to 2013, the percentage of departments using in-car video cameras increased in all population categories (figure 3). By 2013, a majority of the departments in each population category were using in-car cameras. Overall, 68% (about 8,400) of all departments used in-car cameras in 2013, and these departments employed 73% of all officers.
1Federal Bureau of Investigation (2014). Law Enforcement Officers Killed and Assaulted, 2013.
Figure 2Local police officers employed by a department with body armor wear requirements for patrol officers, 1990–2013
Note: See table 1 for the total number of departments by population size. See appendix table 14 for estimates and standard errors. Source: Bureau of Justice Statistics, Law Enforcement Management and Administrative Statistics (LEMAS) Survey, 1990–2013.
0
20
40
60
80
100In certain circumstancesAt all times
2013200720032000199719931990
Percent of o�cers
Year
Figure 3Use of in-car video cameras by local police departments, by size of population served, 2000, 2007, and 2013
Note: See table 1 for the total number of departments by population size. See appendix table 15 for estimates and standard errors.Source: Bureau of Justice Statistics, Law Enforcement Management and Administrative Statistics (LEMAS) Survey, 2000, 2007, and 2013.
Percent of departments
20072013
0 20 40 60 80 100
9,999 or fewer
10,000–49,999
50,000–249,999
250,000 or more
All sizes2000
Population served
2Federal Bureau of Investigation (1995). Law Enforcement Officers Killed and Assaulted, 1994.
LO C A L P O L I C E D E PA R T M E N T S , 2013: E Q U I P M E N T A N D T E C H N O LO G Y | J U LY 2015 4
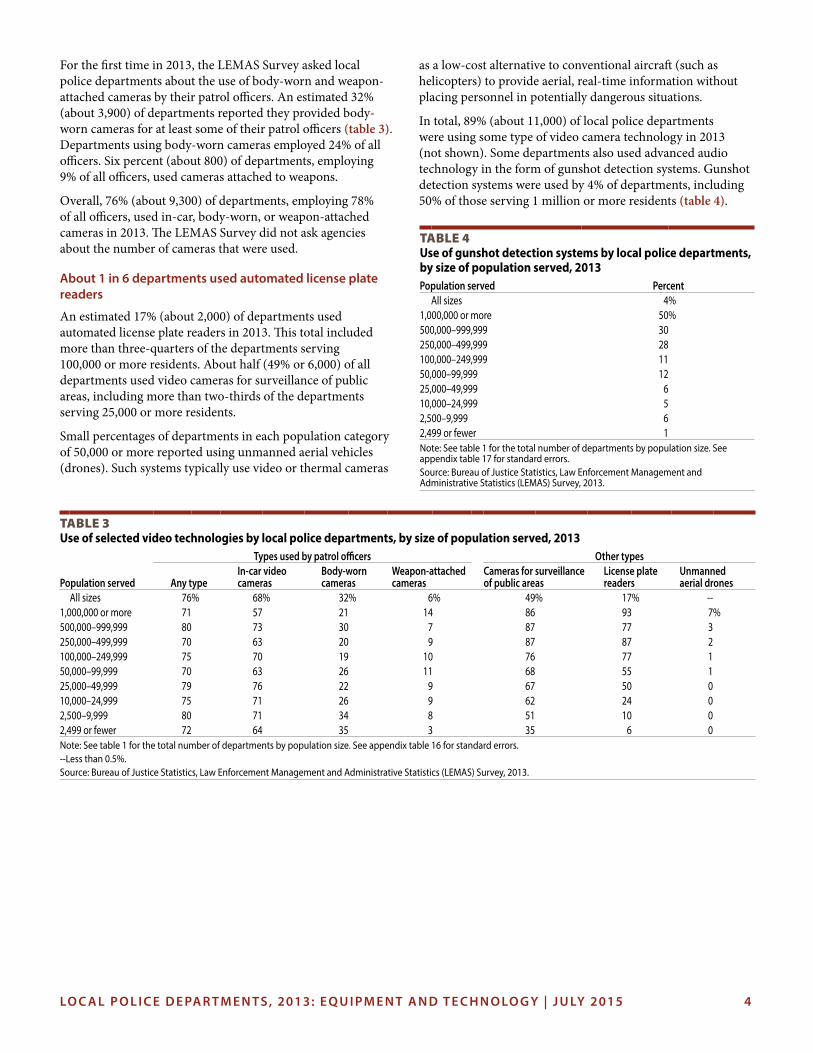
For the first time in 2013, the LEMAS Survey asked local police departments about the use of body-worn and weapon-attached cameras by their patrol officers. An estimated 32% (about 3,900) of departments reported they provided body-worn cameras for at least some of their patrol officers (table 3). Departments using body-worn cameras employed 24% of all officers. Six percent (about 800) of departments, employing 9% of all officers, used cameras attached to weapons.
Overall, 76% (about 9,300) of departments, employing 78% of all officers, used in-car, body-worn, or weapon-attached cameras in 2013. The LEMAS Survey did not ask agencies about the number of cameras that were used.
About 1 in 6 departments used automated license plate readers
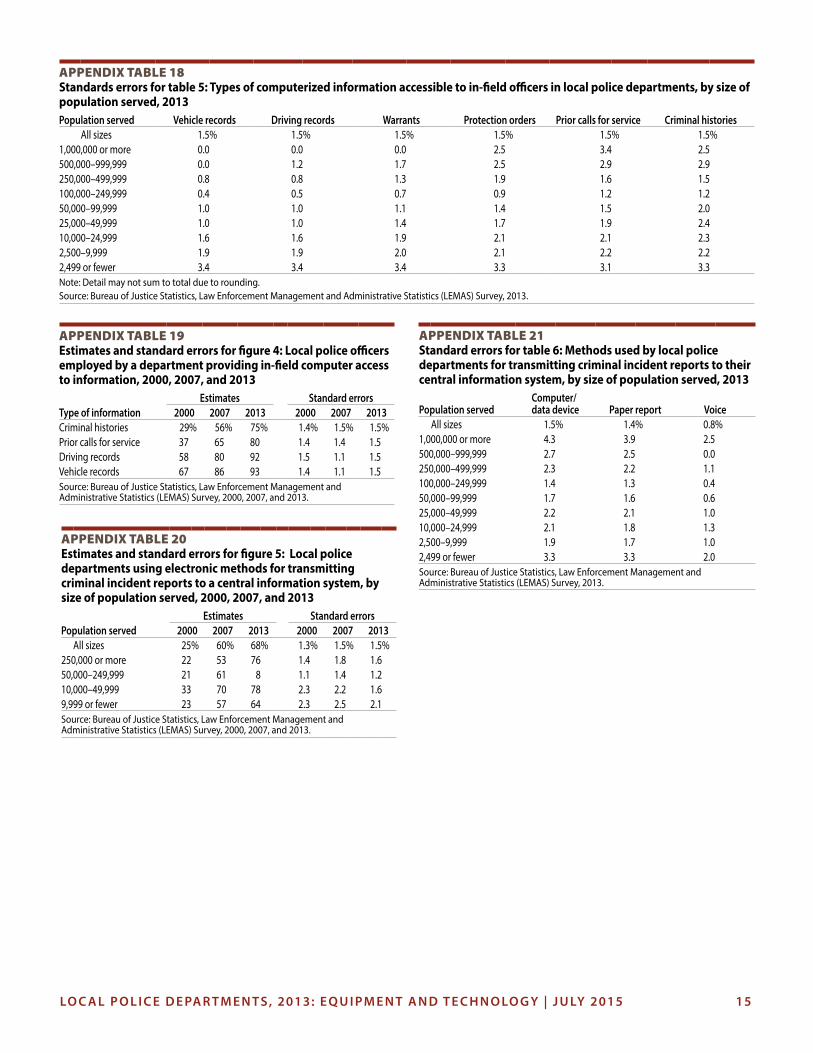
An estimated 17% (about 2,000) of departments used automated license plate readers in 2013. This total included more than three-quarters of the departments serving 100,000 or more residents. About half (49% or 6,000) of all departments used video cameras for surveillance of public areas, including more than two-thirds of the departments serving 25,000 or more residents.
Small percentages of departments in each population category of 50,000 or more reported using unmanned aerial vehicles (drones). Such systems typically use video or thermal cameras
as a low-cost alternative to conventional aircraft (such as helicopters) to provide aerial, real-time information without placing personnel in potentially dangerous situations.
In total, 89% (about 11,000) of local police departments were using some type of video camera technology in 2013 (not shown). Some departments also used advanced audio technology in the form of gunshot detection systems. Gunshot detection systems were used by 4% of departments, including 50% of those serving 1 million or more residents (table 4).
Table 3Use of selected video technologies by local police departments, by size of population served, 2013
Types used by patrol officers Other types
Population served Any typeIn-car video cameras
Body-worn cameras
Weapon-attached cameras
Cameras for surveillance of public areas
License plate readers
Unmanned aerial drones
All sizes 76% 68% 32% 6% 49% 17% --1,000,000 or more 71 57 21 14 86 93 7%500,000–999,999 80 73 30 7 87 77 3250,000–499,999 70 63 20 9 87 87 2100,000–249,999 75 70 19 10 76 77 150,000–99,999 70 63 26 11 68 55 125,000–49,999 79 76 22 9 67 50 010,000–24,999 75 71 26 9 62 24 02,500–9,999 80 71 34 8 51 10 02,499 or fewer 72 64 35 3 35 6 0Note: See table 1 for the total number of departments by population size. See appendix table 16 for standard errors.--Less than 0.5%.Source: Bureau of Justice Statistics, Law Enforcement Management and Administrative Statistics (LEMAS) Survey, 2013.
Table 4 Use of gunshot detection systems by local police departments, by size of population served, 2013Population served Percent
All sizes 4%1,000,000 or more 50%500,000–999,999 30250,000–499,999 28100,000–249,999 1150,000–99,999 1225,000–49,999 610,000–24,999 52,500–9,999 62,499 or fewer 1Note: See table 1 for the total number of departments by population size. See appendix table 17 for standard errors.Source: Bureau of Justice Statistics, Law Enforcement Management and Administrative Statistics (LEMAS) Survey, 2013.
LO C A L P O L I C E D E PA R T M E N T S , 2013: E Q U I P M E N T A N D T E C H N O LO G Y | J U LY 2015 5
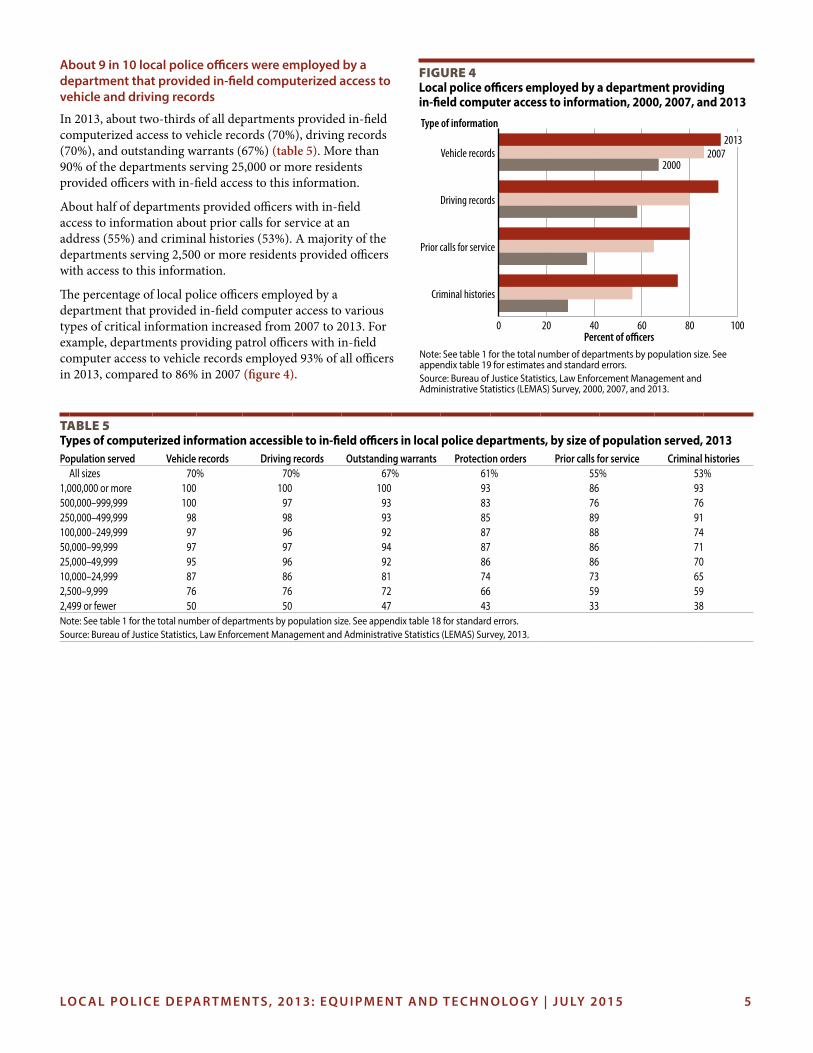
About 9 in 10 local police officers were employed by a department that provided in-field computerized access to vehicle and driving records
In 2013, about two-thirds of all departments provided in-field computerized access to vehicle records (70%), driving records (70%), and outstanding warrants (67%) (table 5). More than 90% of the departments serving 25,000 or more residents provided officers with in-field access to this information.
About half of departments provided officers with in-field access to information about prior calls for service at an address (55%) and criminal histories (53%). A majority of the departments serving 2,500 or more residents provided officers with access to this information.
The percentage of local police officers employed by a department that provided in-field computer access to various types of critical information increased from 2007 to 2013. For example, departments providing patrol officers with in-field computer access to vehicle records employed 93% of all officers in 2013, compared to 86% in 2007 (figure 4).
Figure 4Local police officers employed by a department providing in-field computer access to information, 2000, 2007, and 2013
Note: See table 1 for the total number of departments by population size. See appendix table 19 for estimates and standard errors.Source: Bureau of Justice Statistics, Law Enforcement Management and Administrative Statistics (LEMAS) Survey, 2000, 2007, and 2013.
Percent of o�cers
20072000
0 20 40 60 80 100
Criminal histories
Prior calls for service
Driving records
Vehicle records2013
Type of information
Table 5 Types of computerized information accessible to in-field officers in local police departments, by size of population served, 2013Population served Vehicle records Driving records Outstanding warrants Protection orders Prior calls for service Criminal histories
All sizes 70% 70% 67% 61% 55% 53%1,000,000 or more 100 100 100 93 86 93500,000–999,999 100 97 93 83 76 76250,000–499,999 98 98 93 85 89 91100,000–249,999 97 96 92 87 88 7450,000–99,999 97 97 94 87 86 7125,000–49,999 95 96 92 86 86 7010,000–24,999 87 86 81 74 73 652,500–9,999 76 76 72 66 59 592,499 or fewer 50 50 47 43 33 38Note: See table 1 for the total number of departments by population size. See appendix table 18 for standard errors. Source: Bureau of Justice Statistics, Law Enforcement Management and Administrative Statistics (LEMAS) Survey, 2013.
LO C A L P O L I C E D E PA R T M E N T S , 2013: E Q U I P M E N T A N D T E C H N O LO G Y | J U LY 2015 6
About two-thirds of departments had patrol officers transmit incident reports electronically from the field to a central information system
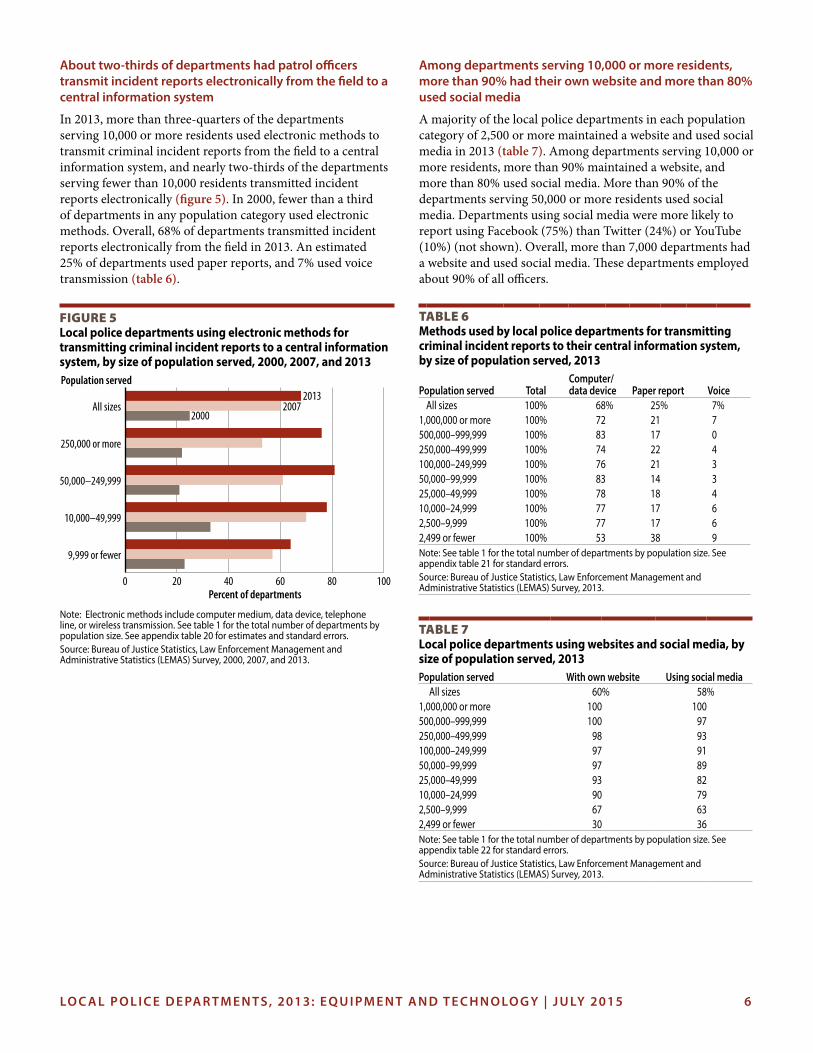
In 2013, more than three-quarters of the departments serving 10,000 or more residents used electronic methods to transmit criminal incident reports from the field to a central information system, and nearly two-thirds of the departments serving fewer than 10,000 residents transmitted incident reports electronically (figure 5). In 2000, fewer than a third of departments in any population category used electronic methods. Overall, 68% of departments transmitted incident reports electronically from the field in 2013. An estimated 25% of departments used paper reports, and 7% used voice transmission (table 6).
Among departments serving 10,000 or more residents, more than 90% had their own website and more than 80% used social media
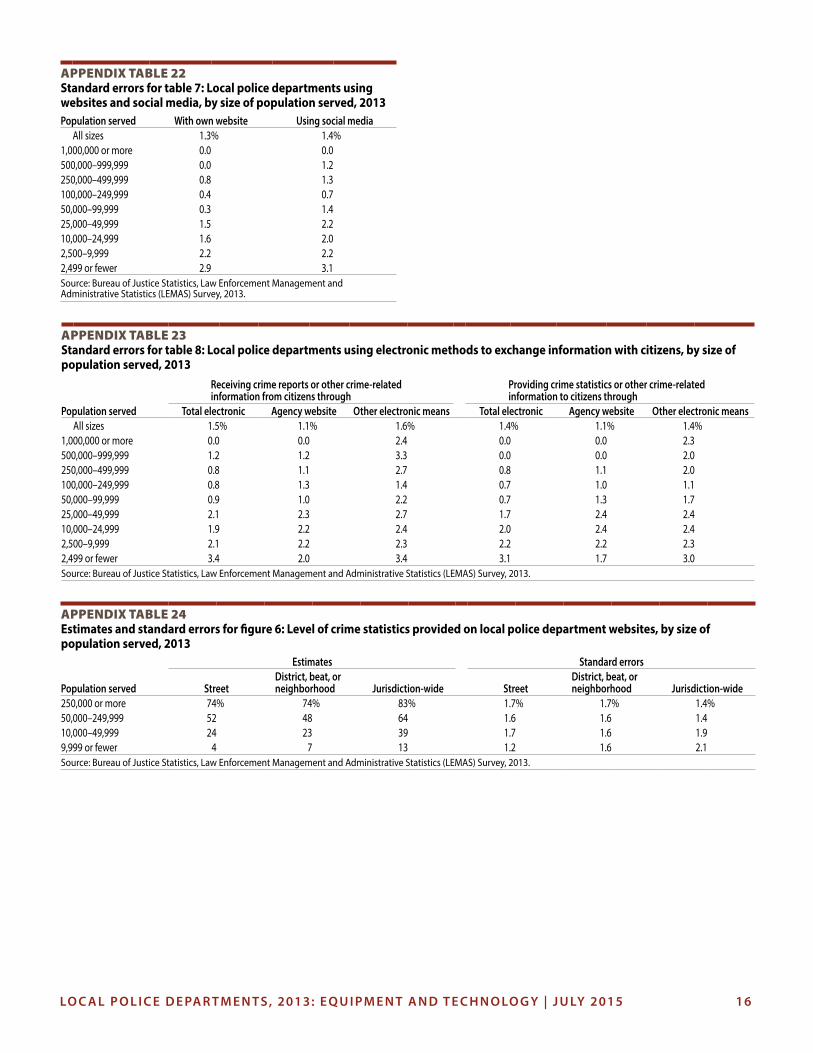
A majority of the local police departments in each population category of 2,500 or more maintained a website and used social media in 2013 (table 7). Among departments serving 10,000 or more residents, more than 90% maintained a website, and more than 80% used social media. More than 90% of the departments serving 50,000 or more residents used social media. Departments using social media were more likely to report using Facebook (75%) than Twitter (24%) or YouTube (10%) (not shown). Overall, more than 7,000 departments had a website and used social media. These departments employed about 90% of all officers.
Figure 5Local police departments using electronic methods for transmitting criminal incident reports to a central information system, by size of population served, 2000, 2007, and 2013
Note: Electronic methods include computer medium, data device, telephone line, or wireless transmission. See table 1 for the total number of departments by population size. See appendix table 20 for estimates and standard errors.Source: Bureau of Justice Statistics, Law Enforcement Management and Administrative Statistics (LEMAS) Survey, 2000, 2007, and 2013.
Percent of departments
2000
20132007
0 20 40 60 80 100
9,999 or fewer
10,000–49,999
50,000–249,999
250,000 or more
All sizes
Population served
Table 6 Methods used by local police departments for transmitting criminal incident reports to their central information system, by size of population served, 2013
Population served TotalComputer/data device Paper report Voice
All sizes 100% 68% 25% 7%1,000,000 or more 100% 72 21 7500,000–999,999 100% 83 17 0250,000–499,999 100% 74 22 4100,000–249,999 100% 76 21 350,000–99,999 100% 83 14 325,000–49,999 100% 78 18 410,000–24,999 100% 77 17 62,500–9,999 100% 77 17 62,499 or fewer 100% 53 38 9Note: See table 1 for the total number of departments by population size. See appendix table 21 for standard errors.Source: Bureau of Justice Statistics, Law Enforcement Management and Administrative Statistics (LEMAS) Survey, 2013.
Table 7 Local police departments using websites and social media, by size of population served, 2013Population served With own website Using social media
All sizes 60% 58%1,000,000 or more 100 100500,000–999,999 100 97250,000–499,999 98 93100,000–249,999 97 9150,000–99,999 97 8925,000–49,999 93 8210,000–24,999 90 792,500–9,999 67 632,499 or fewer 30 36Note: See table 1 for the total number of departments by population size. See appendix table 22 for standard errors.Source: Bureau of Justice Statistics, Law Enforcement Management and Administrative Statistics (LEMAS) Survey, 2013.
LO C A L P O L I C E D E PA R T M E N T S , 2013: E Q U I P M E N T A N D T E C H N O LO G Y | J U LY 2015 7
Sixty-six percent of all departments provided citizens with the ability to submit crime reports, complaints, questions, feedback, and other information electronically using the department’s website and other methods, such as emailing or texting (table 8). More than 90% of the departments serving 50,000 or more provided these services, compared to 47% of the departments serving fewer than 2,500 residents.
Overall, 60% of departments were able to electronically provide crime statistics and other crime-related information to citizens. An estimated 37% of departments provided such information through their website, and 49% provided it through other electronic means, such as emailing, texting, or pre-recorded phone messages. More than 90% of the departments serving 25,000 or more residents provided crime-related information electronically to citizens, compared to 37% of the departments serving fewer than 2,500 residents.
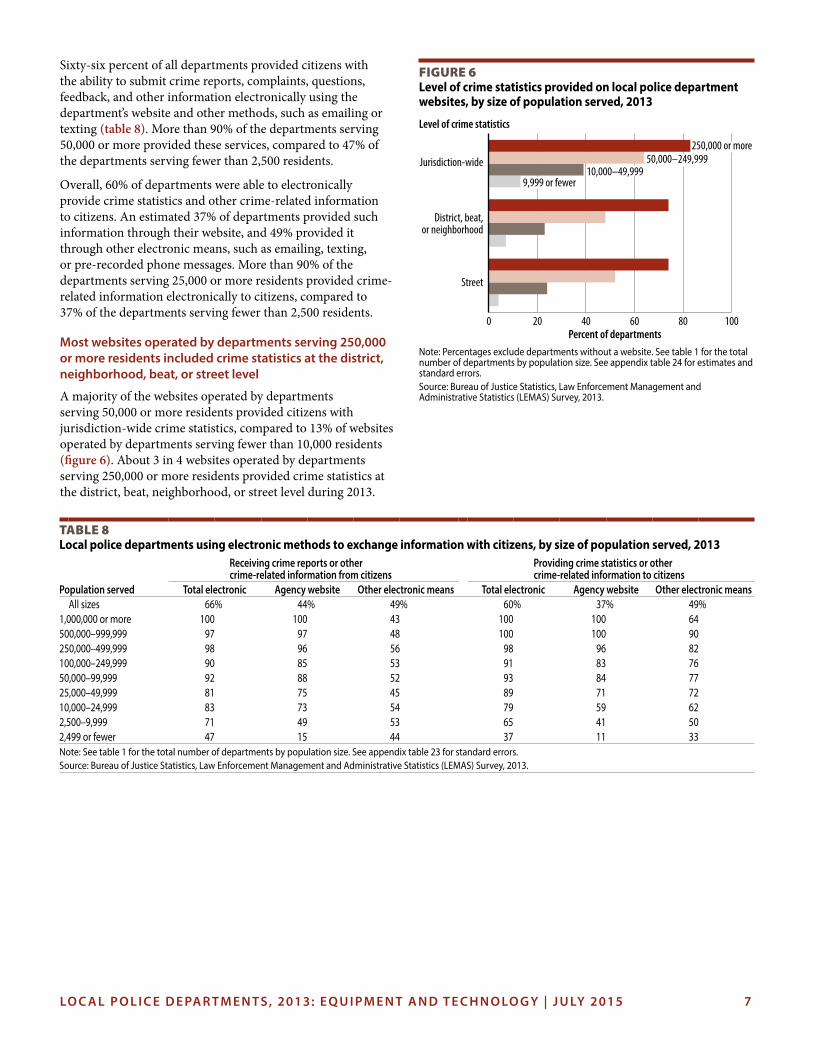
Most websites operated by departments serving 250,000 or more residents included crime statistics at the district, neighborhood, beat, or street level
A majority of the websites operated by departments serving 50,000 or more residents provided citizens with jurisdiction-wide crime statistics, compared to 13% of websites operated by departments serving fewer than 10,000 residents (figure 6). About 3 in 4 websites operated by departments serving 250,000 or more residents provided crime statistics at the district, beat, neighborhood, or street level during 2013.
Table 8 Local police departments using electronic methods to exchange information with citizens, by size of population served, 2013
Receiving crime reports or other crime-related information from citizens
Providing crime statistics or other crime-related information to citizens
Population served Total electronic Agency website Other electronic means Total electronic Agency website Other electronic meansAll sizes 66% 44% 49% 60% 37% 49%
1,000,000 or more 100 100 43 100 100 64500,000–999,999 97 97 48 100 100 90250,000–499,999 98 96 56 98 96 82100,000–249,999 90 85 53 91 83 7650,000–99,999 92 88 52 93 84 7725,000–49,999 81 75 45 89 71 7210,000–24,999 83 73 54 79 59 622,500–9,999 71 49 53 65 41 502,499 or fewer 47 15 44 37 11 33Note: See table 1 for the total number of departments by population size. See appendix table 23 for standard errors.Source: Bureau of Justice Statistics, Law Enforcement Management and Administrative Statistics (LEMAS) Survey, 2013.
Figure 6Level of crime statistics provided on local police department websites, by size of population served, 2013
Note: Percentages exclude departments without a website. See table 1 for the total number of departments by population size. See appendix table 24 for estimates and standard errors. Source: Bureau of Justice Statistics, Law Enforcement Management and Administrative Statistics (LEMAS) Survey, 2013.
Percent of departments0 20 40 60 80 100
Street
District, beat, or neighborhood
Jurisdiction-wide 250,000 or more
50,000–249,99910,000–49,999
9,999 or fewer
Level of crime statistics
LO C A L P O L I C E D E PA R T M E N T S , 2013: E Q U I P M E N T A N D T E C H N O LO G Y | J U LY 2015 8
Methodology
Survey overview
The LEMAS Survey periodically collects data from more than 3,000 general purpose law enforcement agencies, including state police and highway patrol agencies, local police departments, and sheriffs’ offices. The survey includes all agencies that employ 100 or more sworn officers and a nationally representative sample of smaller agencies.
Previous LEMAS data collections occurred in 1987, 1990, 1993, 1997, 2000, 2003, and 2007. These past surveys obtained data on functions performed, operating expenditures, job functions of sworn and nonsworn employees, officer salaries and special pay, demographic characteristics of officers, education and training requirements, community policing activities, types of weapons authorized, body armor policies, computers and information systems, types of vehicles operated, the use of special units, and task force participation. A more limited data collection that focused on community policing was conducted in 1999. Survey questions are updated with each iteration to reflect emerging issues in the field of law enforcement. Publications based on prior LEMAS Surveys can be accessed on the BJS website.
Sampling frame
The sampling frame used for the 2013 LEMAS Survey was the 2008 BJS Census of State and Local Law Enforcement Agencies (CSLLEA) (the most recent available). At the time of the 2008 CSLLEA, nearly all of the more than 12,000 police departments were operated at the sub-county level by individual municipal (85%) or township (13%) governments. The remainder were operated by tribal governments, multiple local governments (regional or joint departments), or county governments.
The agency universe represented by the CSLLEA is more inclusive than that of the FBI’s Uniform Crime Reporting (UCR) program. Some agencies are excluded from the UCR counts because they do not have an Originating Agency Identifier (ORI) assigned by the FBI. (Some agencies without an ORI are still included in the UCR employee counts (but not in the agency counts) because they report their data to another agency, which reports it to the FBI.)
The CSLLEA data include all officers with full arrest powers regardless of function, while the UCR data exclude officers not paid out of police funds. This exclusion generally pertains to officers working exclusively for jails or courts. The CSLLEA definition excludes many of these officers, but not all of them.
The UCR program defines law enforcement officers as individuals who ordinarily carry a firearm and a badge, have full arrest powers, and are paid from governmental funds set aside specifically for sworn law enforcement representatives. The CSLLEA definition relies exclusively on whether the officer possesses full arrest powers. Regardless of the arrest powers
of their officers, agencies included in the CSLLEA that do not have a primary jurisdictional area for which they provide law enforcement services are considered out of scope for the LEMAS Survey because of its policing focus.
In 2008, the CSLLEA counted 765,246 full-time sworn officers, which was about 57,000 (or 8%) more than the 708,569 reported by the UCR. A similar difference was observed for the 2004 and 2000 CSLLEA collections. Although the CSLLEA counts are larger than those of the UCR, the employment growth trends recorded by the CSLLEA over time have been consistent with those recorded by the UCR.
Sample design and selection
Local police departments and sheriffs’ offices are chosen for the LEMAS Survey using a stratified sample design based on the number of sworn personnel. The original 2013 LEMAS sample included 3,336 state and local law enforcement agencies. It was designed to be representative of all general purpose state and local law enforcement agencies in the United States, with separate samples drawn of local police departments and sheriffs’ offices. All 50 primary state law enforcement agencies (state police and highway patrol) were included. Agencies serving special jurisdictions (such as schools, airports, or parks), or with special enforcement responsibilities (such as conservation laws or alcohol laws), were considered out of scope for the survey.
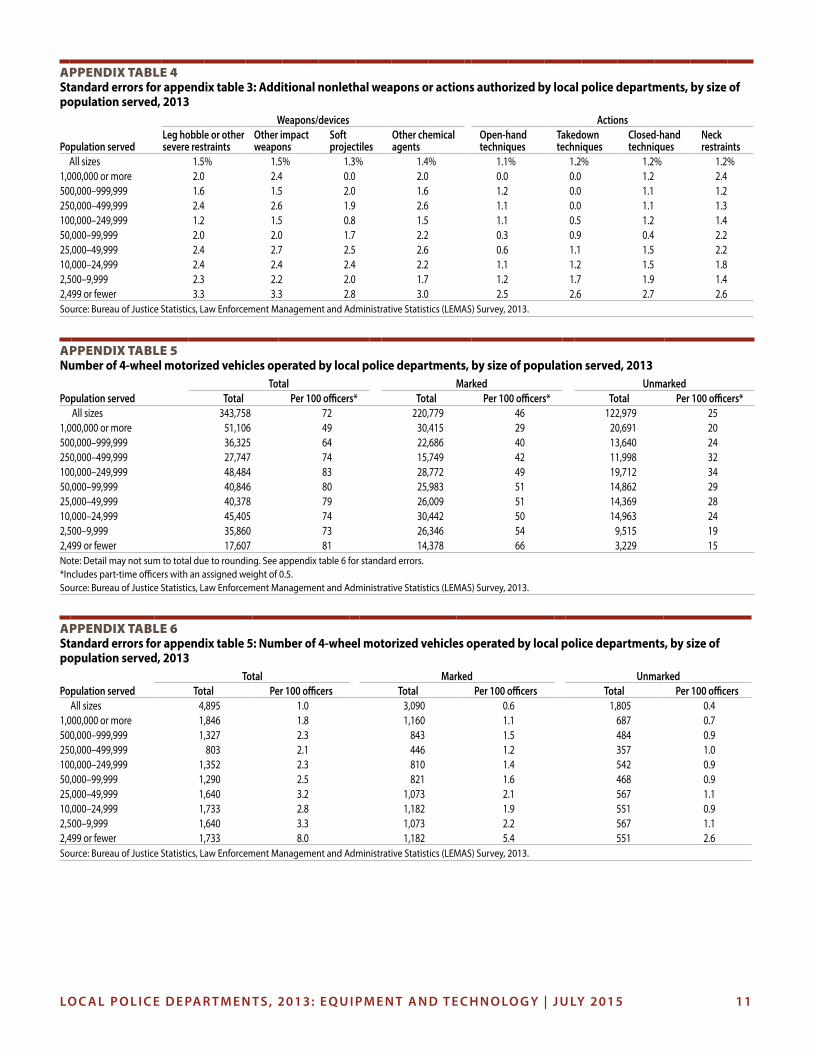
The 2013 LEMAS sample design called for 2,353 local police departments, divided into 7 strata based on the number of sworn officers employed, to receive the survey. During the initial contact phase, it was determined that 26 of these departments had closed since the 2008 CSLLEA and were dropped from the sample. Of the remaining 2,327 departments, the sample design called for all 659 departments employing 100 or more full-time sworn personnel to be self-representing (SR) and receive the survey. It was later determined that 29 of these SR departments did not receive the survey because of inaccurate contact information. As a result, the base weight for SR departments is 1.046 instead of the expected 1.000. The 6 remaining strata and their corresponding base weights are 50 to 99 officers, 2.572; 25 to 49 officers, 4.225; 10 to 24 officers, 6.260; 5 to 9 officers, 7.288; 2 to 4 officers, 14.611; and 1 officer, 31.302.
Agency response rate
Of the 2,327 eligible local police departments that received the survey, 2,059 completed it, for a response rate of 88%. By size, the response rate ranged from 91% for departments with 50 or more officers to 84% for those with fewer than 10 officers. An adjustment factor unique to each stratum was used to account for nonresponse. These nonresponse adjustments and the resulting final analytical weights for each stratum are included in appendix table 9.
LO C A L P O L I C E D E PA R T M E N T S , 2013: E Q U I P M E N T A N D T E C H N O LO G Y | J U LY 2015 9
Item nonresponse and imputations
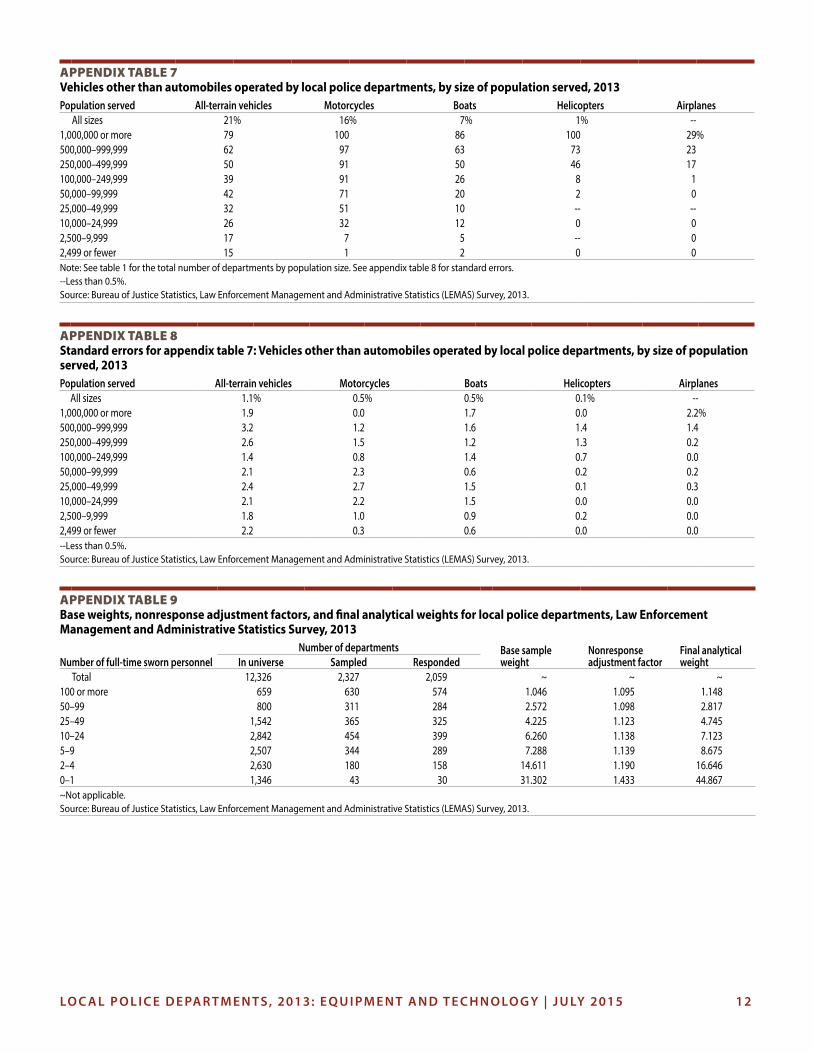
All departments, regardless of size, were asked to complete the 80-item CJ-44 survey questionnaire. A majority of the responses were received electronically through a survey website. For the 2,059 departments completing the survey, item nonresponse rates due to omission or invalid data were low for the data elements used in this report (appendix table 10).
When a department did not supply a response to a numerical item, a ratio imputation method was used. The ratio imputation used the value of the ratio of the numerical variable to the number of full-time sworn personnel for departments that provided the numerical data. This ratio was computed for each population category and applied to the number of full-time sworn personnel in departments with the missing data to produce the imputed value. Imputations were not used for categorical variables.
Accuracy of the estimates
The accuracy of the estimates presented in this report depends on two types of error: sampling and nonsampling. Sampling error is the variation that may occur by chance because a sample was used rather than a complete enumeration of the population. Nonsampling error can be attributed to many sources, such as the inability to obtain information about all cases in the sample; inability to obtain complete and correct information from the administrative records; and processing errors. In any survey, the full extent of the nonsampling error is never known.
The sampling error, as measured by an estimated standard error, varies by the size of the estimate and the sample size. Because the LEMAS data were collected from a sample, the results are subject to sampling error. Variance and standard error estimates for the 2013 LEMAS were generated using the SUDAAN statistical software package. The Taylor linearization method for a “stratified without replacement” design was used for these calculations. See appendix tables for the standard error estimates.
These standard error estimates may be used to construct confidence intervals around percentages in this report. For example, the 95%-confidence interval around the percentage of local police departments using body-worn cameras is 32% ± 1.96 × 1.4% (or approximately 29% to 35%).
These standard errors may also be used to test the significance of the difference between two sample statistics by pooling the standard errors of the two sample estimates. For example, the standard error of the difference between departments serving 10,000 to 24,999 residents and those serving 2,500 to 9,999 residents for using license plate readers would be 2.3% (or the square root of the sum of the squared standard errors for each group). The 95%-confidence interval around the difference would be 1.96 × 2.3% (or 4.6%). Because the observed difference of 14% (24% minus 10%) is greater than 4.6%, the difference would be considered statistically significant.
LO C A L P O L I C E D E PA R T M E N T S , 2013: E Q U I P M E N T A N D T E C H N O LO G Y | J U LY 2015 10
appendix Table 1Local police departments and full-time employees, by size of population served, 2013
Departments Full-time sworn personnel Full-time civilian personnelPopulation served Number Percent Number Percent Number Percent
All sizes 12,326 100% 477,317 100% 127,642 100%1,000,000 or more 16 0.1 103,609 21.7 32,599 25.5500,000–999,999 36 0.3 56,355 11.8 13,170 10.3250,000–499,999 53 0.4 37,364 7.8 10,284 8.1100,000–249,999 224 1.8 58,588 12.3 18,167 14.250,000–99,999 446 3.6 50,764 10.6 14,578 11.425,000–49,999 878 7.1 51,007 10.7 13,720 10.710,000–24,999 1,986 16.1 59,559 12.5 14,529 11.42,500–9,999 3,873 31.4 43,808 9.2 8,527 6.72.499 or fewer 4,815 39.1 16,264 3.4 2,069 1.6Note: Detail may not sum to total due to rounding. See appendix table 2 for standard errors.Source: Bureau of Justice Statistics, Law Enforcement Management and Administrative Statistics (LEMAS) Survey, 2013.
appendix Table 2Standard errors for appendix table 1: Local police departments and full-time employees, by size of population served, 2013
Full-time sworn personnel Full-time civilian personnelPopulation served Number Percent Number Percent
All sizes 16,470 ~ 6,389 ~1,000,000 or more 5,518 0.3% 1,872 1.5%500,000–999,999 3,903 0.8 971 0.8250,000–499,999 2,138 0.4 609 0.5100,000–249,999 1,515 0.3 503 0.450,000–99,999 1,624 0.3 494 0.425,000–49,999 1,804 0.4 642 0.510,000–24,999 1,901 0.4 629 0.52,500–9,999 1,348 0.3 415 0.32,499 or fewer 719 0.2 255 0.2~Not applicable.Source: Bureau of Justice Statistics, Law Enforcement Management and Administrative Statistics (LEMAS) Survey, 2013.
appendix Table 3 Additional nonlethal weapons or actions authorized by local police departments, by size of population served, 2013
Weapons/devices Actions
Population servedLeg hobble or other severe restraints
Other impact weaponsa
Soft projectiles
Other chemical agentsb
Open-hand techniques
Takedown techniques
Closed-hand techniques
Neck restraints
All sizes 59% 44% 37% 27% 91% 89% 85% 18%1,000,000 or more 79 50 100 79 100 100 93 43500,000–999,999 66 73 90 60 97 100 86 3250,000–499,999 70 61 85 59 96 100 96 39100,000–249,999 73 59 88 59 96 95 90 3750,000–99,999 69 60 83 54 98 95 95 2725,000–49,999 68 48 71 39 99 96 92 2010,000–24,999 57 45 58 29 95 93 90 172,500–9,999 58 43 29 19 92 89 82 132,499 or fewer 56 42 21 25 86 85 81 18Note: See table 1 for the total number of departments by population size. See appendix table 4 for standard errors.aExcludes batons.bExcludes pepper spray.Source: Bureau of Justice Statistics, Law Enforcement Management and Administrative Statistics (LEMAS) Survey, 2013.
LO C A L P O L I C E D E PA R T M E N T S , 2013: E Q U I P M E N T A N D T E C H N O LO G Y | J U LY 2015 11
appendix Table 4Standard errors for appendix table 3: Additional nonlethal weapons or actions authorized by local police departments, by size of population served, 2013
Weapons/devices Actions
Population servedLeg hobble or other severe restraints
Other impact weapons
Soft projectiles
Other chemical agents
Open-hand techniques
Takedown techniques
Closed-hand techniques
Neck restraints
All sizes 1.5% 1.5% 1.3% 1.4% 1.1% 1.2% 1.2% 1.2%1,000,000 or more 2.0 2.4 0.0 2.0 0.0 0.0 1.2 2.4500,000–999,999 1.6 1.5 2.0 1.6 1.2 0.0 1.1 1.2250,000–499,999 2.4 2.6 1.9 2.6 1.1 0.0 1.1 1.3100,000–249,999 1.2 1.5 0.8 1.5 1.1 0.5 1.2 1.450,000–99,999 2.0 2.0 1.7 2.2 0.3 0.9 0.4 2.225,000–49,999 2.4 2.7 2.5 2.6 0.6 1.1 1.5 2.210,000–24,999 2.4 2.4 2.4 2.2 1.1 1.2 1.5 1.82,500–9,999 2.3 2.2 2.0 1.7 1.2 1.7 1.9 1.42,499 or fewer 3.3 3.3 2.8 3.0 2.5 2.6 2.7 2.6Source: Bureau of Justice Statistics, Law Enforcement Management and Administrative Statistics (LEMAS) Survey, 2013.
appendix Table 5Number of 4-wheel motorized vehicles operated by local police departments, by size of population served, 2013
Total Marked UnmarkedPopulation served Total Per 100 officers* Total Per 100 officers* Total Per 100 officers*
All sizes 343,758 72 220,779 46 122,979 251,000,000 or more 51,106 49 30,415 29 20,691 20500,000–999,999 36,325 64 22,686 40 13,640 24250,000–499,999 27,747 74 15,749 42 11,998 32100,000–249,999 48,484 83 28,772 49 19,712 3450,000–99,999 40,846 80 25,983 51 14,862 2925,000–49,999 40,378 79 26,009 51 14,369 2810,000–24,999 45,405 74 30,442 50 14,963 242,500–9,999 35,860 73 26,346 54 9,515 192,499 or fewer 17,607 81 14,378 66 3,229 15Note: Detail may not sum to total due to rounding. See appendix table 6 for standard errors.*Includes part-time officers with an assigned weight of 0.5.Source: Bureau of Justice Statistics, Law Enforcement Management and Administrative Statistics (LEMAS) Survey, 2013.
appendix Table 6Standard errors for appendix table 5: Number of 4-wheel motorized vehicles operated by local police departments, by size of population served, 2013
Total Marked UnmarkedPopulation served Total Per 100 officers Total Per 100 officers Total Per 100 officers
All sizes 4,895 1.0 3,090 0.6 1,805 0.41,000,000 or more 1,846 1.8 1,160 1.1 687 0.7500,000–999,999 1,327 2.3 843 1.5 484 0.9250,000–499,999 803 2.1 446 1.2 357 1.0100,000–249,999 1,352 2.3 810 1.4 542 0.950,000–99,999 1,290 2.5 821 1.6 468 0.925,000–49,999 1,640 3.2 1,073 2.1 567 1.110,000–24,999 1,733 2.8 1,182 1.9 551 0.92,500–9,999 1,640 3.3 1,073 2.2 567 1.12,499 or fewer 1,733 8.0 1,182 5.4 551 2.6Source: Bureau of Justice Statistics, Law Enforcement Management and Administrative Statistics (LEMAS) Survey, 2013.
LO C A L P O L I C E D E PA R T M E N T S , 2013: E Q U I P M E N T A N D T E C H N O LO G Y | J U LY 2015 12
appendix Table 7Vehicles other than automobiles operated by local police departments, by size of population served, 2013Population served All-terrain vehicles Motorcycles Boats Helicopters Airplanes
All sizes 21% 16% 7% 1% --1,000,000 or more 79 100 86 100 29%500,000–999,999 62 97 63 73 23250,000–499,999 50 91 50 46 17100,000–249,999 39 91 26 8 150,000–99,999 42 71 20 2 025,000–49,999 32 51 10 -- --10,000–24,999 26 32 12 0 02,500–9,999 17 7 5 -- 02,499 or fewer 15 1 2 0 0Note: See table 1 for the total number of departments by population size. See appendix table 8 for standard errors.--Less than 0.5%.Source: Bureau of Justice Statistics, Law Enforcement Management and Administrative Statistics (LEMAS) Survey, 2013.
appendix Table 8Standard errors for appendix table 7: Vehicles other than automobiles operated by local police departments, by size of population served, 2013Population served All-terrain vehicles Motorcycles Boats Helicopters Airplanes
All sizes 1.1% 0.5% 0.5% 0.1% --1,000,000 or more 1.9 0.0 1.7 0.0 2.2%500,000–999,999 3.2 1.2 1.6 1.4 1.4250,000–499,999 2.6 1.5 1.2 1.3 0.2100,000–249,999 1.4 0.8 1.4 0.7 0.050,000–99,999 2.1 2.3 0.6 0.2 0.225,000–49,999 2.4 2.7 1.5 0.1 0.310,000–24,999 2.1 2.2 1.5 0.0 0.02,500–9,999 1.8 1.0 0.9 0.2 0.02,499 or fewer 2.2 0.3 0.6 0.0 0.0--Less than 0.5%.Source: Bureau of Justice Statistics, Law Enforcement Management and Administrative Statistics (LEMAS) Survey, 2013.
appendix Table 9Base weights, nonresponse adjustment factors, and final analytical weights for local police departments, Law Enforcement Management and Administrative Statistics Survey, 2013
Number of full-time sworn personnelNumber of departments Base sample
weightNonresponse adjustment factor
Final analytical weightIn universe Sampled Responded
Total 12,326 2,327 2,059 ~ ~ ~100 or more 659 630 574 1.046 1.095 1.14850–99 800 311 284 2.572 1.098 2.81725–49 1,542 365 325 4.225 1.123 4.74510–24 2,842 454 399 6.260 1.138 7.1235–9 2,507 344 289 7.288 1.139 8.6752–4 2,630 180 158 14.611 1.190 16.6460–1 1,346 43 30 31.302 1.433 44.867~Not applicable.Source: Bureau of Justice Statistics, Law Enforcement Management and Administrative Statistics (LEMAS) Survey, 2013.
LO C A L P O L I C E D E PA R T M E N T S , 2013: E Q U I P M E N T A N D T E C H N O LO G Y | J U LY 2015 13
appendix Table 10Item nonresponse rates for the 2013 Law Enforcement Management and Administrative Statistics SurveyItem Percent of cases missing Number and category of paid employees 0.0%Types of nonlethal weapons authorized 0.7Types of defensive physical tactics authorized 0.8Body armor wear policies 3.5Types of video cameras used 0.4Use of gunshot detection system 0.4Types of information accessible to officers in the field 0.4Method used by field officers to transmit incident reports 1.3Maintains a website 1.6Level of crime statistics provided on website 1.6Use of social media 1.3Number of marked and unmarked vehicles operated 3.0Types of vehicles other than cars operated 1.4Source: Bureau of Justice Statistics, Law Enforcement Management and Administrative Statistics (LEMAS) Survey, 2013.
appendix Table 11Estimates and standard errors for figure 1: Local police departments authorizing the use of conducted energy weapons by size of population served, 2000, 2007, and 2013
Estimates Standard errorsYear All sizes 9,999 or fewer 10,000–49,999 50,000–249,999 250,000 or more All sizes 9,999 or fewer 10,000–49,999 50,000–249,999 250,000 or more2013 81% 79% 84% 88% 91% 1.3% 2.0% 1.0% 1.0% 1.0%2007 60 56 68 77 89 1.5 3.0 2.0 1.0 1.02000 7 6 9 18 25 0.5 1.2 1.5 1.1 0.9Source: Bureau of Justice Statistics, Law Enforcement Management and Administrative Statistics (LEMAS) Survey, 2000, and 2013.
appendix Table 12 Standard errors for table 1: Selected nonlethal weapons authorized by local police departments, by size of population served, 2013
Population served Pepper spray BatonsConducted energy weapons
All sizes 0.9% 1.2% 1.3%1,000,000 or more 0.0 0.0 0.0500,000–999,999 0.0 0.0 2.4250,000–499,999 1.1 0.8 1.3100,000–249,999 0.3 0.5 0.850,000–99,999 0.5 1.0 1.425,000–49,999 0.6 1.4 1.810,000–24,999 0.9 1.5 1.82,500–9,999 1.1 1.7 1.62,499 or fewer 2.0 2.6 3.0Source: Bureau of Justice Statistics, Law Enforcement Management and Administrative Statistics (LEMAS) Survey, 2013.
appendix Table 13Standard errors for table 2: Body armor wear requirements for patrol officers in local police departments, by size of population served, 2013
Population served Total At all timesIn some circumstances
All sizes 1.4% 1.5% 0.8%1,000,000 or more 2.5 2.3 2.2500,000–999,999 1.6 2.6 0.8250,000–499,999 1.3 2.2 1.9100,000–249,999 0.8 1.1 0.850,000–99,999 1.1 1.2 0.625,000–49,999 1.1 1.6 1.310,000–24,999 1.3 1.8 1.32,500–9,999 1.6 1.9 1.22,499 or fewer 3.4 3.4 1.8Source: Bureau of Justice Statistics, Law Enforcement Management and Administrative Statistics (LEMAS) Survey, 2013.
LO C A L P O L I C E D E PA R T M E N T S , 2013: E Q U I P M E N T A N D T E C H N O LO G Y | J U LY 2015 14
appendix Table 14 Estimates and standard errors for figure 2: Local police officers employed by a department with body armor requirements for patrol officers, 1990–2013
Estimates Standard errors
Year At all timesIn certain circumstances At all times
In certain circumstances
1990 25% 5% 1.3% 0.4%1993 4 8 1.4 0.51997 52 11 1.5 0.62000 56 13 1.5 0.72003 59 15 1.5 0.72007 67 13 1.3 0.72013 82 1 1.5 0.8Source: Bureau of Justice Statistics, Law Enforcement Management and Administrative Statistics (LEMAS) Survey, 1990–2013.
appendix Table 15 Estimates and standard errors for figure 3: Use of in-car video cameras by local police departments, by size of population served, 2000, 2007, and 2013
Estimates Standard errorsPopulation served 2000 2007 2013 2000 2007 2013
All sizes 37% 61% 68% 1.4% 1.4% 1.5%250,000 or more 33 49 66 0.9 1.0 1.850,000–249,999 42 60 65 1.0 1.3 1.710,000–49,999 46 64 73 2.5 2.4 1.69,999 or fewer 34 61 67 2.5 2.5 2.0Source: Bureau of Justice Statistics, Law Enforcement Management and Administrative Statistics (LEMAS) Survey, 2000, 2007, and 2013.
appendix Table 16Standard errors for table 3: Use of selected video technologies by local police departments, by size of population served, 2013
Types used by patrol officers Other types
Population served Any typeIn-car video cameras
Body-worn cameras
Weapon-attached cameras
Cameras for surveillance of public areas
License plate readers
Unmanned aerial vehicles
All sizes 1.4% 1.5% 1.4% 0.6% 1.5% 0.8% --1,000,000 or more 2.2 2.4 2.0 1.7 1.7 2.5 2.5%500,000–999,999 2.6 2.9 3.0 1.6 2.2 2.8 1.2250,000–499,999 2.4 2.6 2.1 1.5 1.8 1.8 0.8100,000–249,999 1.2 1.2 1.0 0.8 1.3 1.1 1.050,000–99,999 2.1 2.2 2.0 1.3 2.2 2.2 1.025,000–49,999 2.2 2.3 2.3 1.6 2.6 2.7 0.010,000–24,999 2.1 2.2 2.1 1.4 2.4 2.0 0.02,500–9,999 1.8 2.0 2.1 1.2 2.2 1.2 0.02,499 or fewer 3.0 3.2 3.2 1.5 3.1 1.6 0.0--Less than 0.05%.Source: Bureau of Justice Statistics, Law Enforcement Management and Administrative Statistics (LEMAS) Survey, 2013.
appendix Table 17 Standard errors for table 4: Use of gunshot detection systems by local police departments, by size of population served, 2013Population served Standard errors
All sizes 0.4%1,000,000 or more 2.4500,000–999,999 3.0250,000–499,999 2.4100,000–249,999 0.850,000–99,999 1.225,000–49,999 1.210,000–24,999 1.02,500–9,999 1.02,499 or fewer 0.4Source: Bureau of Justice Statistics, Law Enforcement Management and Administrative Statistics (LEMAS) Survey, 2013.
LO C A L P O L I C E D E PA R T M E N T S , 2013: E Q U I P M E N T A N D T E C H N O LO G Y | J U LY 2015 15
appendix Table 18 Standards errors for table 5: Types of computerized information accessible to in-field officers in local police departments, by size of population served, 2013Population served Vehicle records Driving records Warrants Protection orders Prior calls for service Criminal histories
All sizes 1.5% 1.5% 1.5% 1.5% 1.5% 1.5%1,000,000 or more 0.0 0.0 0.0 2.5 3.4 2.5500,000–999,999 0.0 1.2 1.7 2.5 2.9 2.9250,000–499,999 0.8 0.8 1.3 1.9 1.6 1.5100,000–249,999 0.4 0.5 0.7 0.9 1.2 1.250,000–99,999 1.0 1.0 1.1 1.4 1.5 2.025,000–49,999 1.0 1.0 1.4 1.7 1.9 2.410,000–24,999 1.6 1.6 1.9 2.1 2.1 2.32,500–9,999 1.9 1.9 2.0 2.1 2.2 2.22,499 or fewer 3.4 3.4 3.4 3.3 3.1 3.3Note: Detail may not sum to total due to rounding.Source: Bureau of Justice Statistics, Law Enforcement Management and Administrative Statistics (LEMAS) Survey, 2013.
appendix Table 19 Estimates and standard errors for figure 4: Local police officers employed by a department providing in-field computer access to information, 2000, 2007, and 2013
Type of informationEstimates Standard errors
2000 2007 2013 2000 2007 2013Criminal histories 29% 56% 75% 1.4% 1.5% 1.5%Prior calls for service 37 65 80 1.4 1.4 1.5Driving records 58 80 92 1.5 1.1 1.5Vehicle records 67 86 93 1.4 1.1 1.5Source: Bureau of Justice Statistics, Law Enforcement Management and Administrative Statistics (LEMAS) Survey, 2000, 2007, and 2013.
appendix Table 20 Estimates and standard errors for figure 5: Local police departments using electronic methods for transmitting criminal incident reports to a central information system, by size of population served, 2000, 2007, and 2013
Estimates Standard errorsPopulation served 2000 2007 2013 2000 2007 2013
All sizes 25% 60% 68% 1.3% 1.5% 1.5%250,000 or more 22 53 76 1.4 1.8 1.650,000–249,999 21 61 8 1.1 1.4 1.210,000–49,999 33 70 78 2.3 2.2 1.69,999 or fewer 23 57 64 2.3 2.5 2.1Source: Bureau of Justice Statistics, Law Enforcement Management and Administrative Statistics (LEMAS) Survey, 2000, 2007, and 2013.
appendix Table 21 Standard errors for table 6: Methods used by local police departments for transmitting criminal incident reports to their central information system, by size of population served, 2013
Population servedComputer/ data device Paper report Voice
All sizes 1.5% 1.4% 0.8%1,000,000 or more 4.3 3.9 2.5500,000–999,999 2.7 2.5 0.0250,000–499,999 2.3 2.2 1.1100,000–249,999 1.4 1.3 0.450,000–99,999 1.7 1.6 0.625,000–49,999 2.2 2.1 1.010,000–24,999 2.1 1.8 1.32,500–9,999 1.9 1.7 1.02,499 or fewer 3.3 3.3 2.0Source: Bureau of Justice Statistics, Law Enforcement Management and Administrative Statistics (LEMAS) Survey, 2013.
LO C A L P O L I C E D E PA R T M E N T S , 2013: E Q U I P M E N T A N D T E C H N O LO G Y | J U LY 2015 16
appendix Table 22 Standard errors for table 7: Local police departments using websites and social media, by size of population served, 2013Population served With own website Using social media
All sizes 1.3% 1.4%1,000,000 or more 0.0 0.0500,000–999,999 0.0 1.2250,000–499,999 0.8 1.3100,000–249,999 0.4 0.750,000–99,999 0.3 1.425,000–49,999 1.5 2.210,000–24,999 1.6 2.02,500–9,999 2.2 2.22,499 or fewer 2.9 3.1Source: Bureau of Justice Statistics, Law Enforcement Management and Administrative Statistics (LEMAS) Survey, 2013.
appendix Table 23 Standard errors for table 8: Local police departments using electronic methods to exchange information with citizens, by size of population served, 2013
Receiving crime reports or other crime-related information from citizens through
Providing crime statistics or other crime-related information to citizens through
Population served Total electronic Agency website Other electronic means Total electronic Agency website Other electronic meansAll sizes 1.5% 1.1% 1.6% 1.4% 1.1% 1.4%
1,000,000 or more 0.0 0.0 2.4 0.0 0.0 2.3500,000–999,999 1.2 1.2 3.3 0.0 0.0 2.0250,000–499,999 0.8 1.1 2.7 0.8 1.1 2.0100,000–249,999 0.8 1.3 1.4 0.7 1.0 1.150,000–99,999 0.9 1.0 2.2 0.7 1.3 1.725,000–49,999 2.1 2.3 2.7 1.7 2.4 2.410,000–24,999 1.9 2.2 2.4 2.0 2.4 2.42,500–9,999 2.1 2.2 2.3 2.2 2.2 2.32,499 or fewer 3.4 2.0 3.4 3.1 1.7 3.0Source: Bureau of Justice Statistics, Law Enforcement Management and Administrative Statistics (LEMAS) Survey, 2013.
appendix Table 24 Estimates and standard errors for figure 6: Level of crime statistics provided on local police department websites, by size of population served, 2013
Estimates Standard errors
Population served Street District, beat, or neighborhood Jurisdiction-wide Street
District, beat, or neighborhood Jurisdiction-wide
250,000 or more 74% 74% 83% 1.7% 1.7% 1.4%50,000–249,999 52 48 64 1.6 1.6 1.410,000–49,999 24 23 39 1.7 1.6 1.99,999 or fewer 4 7 13 1.2 1.6 2.1Source: Bureau of Justice Statistics, Law Enforcement Management and Administrative Statistics (LEMAS) Survey, 2013.
Office of Justice ProgramsInnovation • Partnerships • Safer Neighborhoods
www.ojp.usdoj.gov
Celebrating 35 years
NCJ248785
The Bureau of Justice Statistics of the U.S. Department of Justice is the principal federal agency responsible for measuring crime, criminal victimization, criminal offenders, victims of crime, correlates of crime, and the operation of criminal and civil justice systems at the federal, state, tribal, and local levels. BJS collects, analyzes, and disseminates reliable and valid statistics on crime and justice systems in the United States, supports improvements to state and local criminal justice information systems, and participates with national and international organizations to develop and recommend national standards for justice statistics. William J. Sabol is director.
This report was written by Brian A. Reaves. Marshay Lentini verified the report. Data were collected and processed by the Urban Institute.
Lynne McConnell and Jill Thomas edited the report. Tina Dorsey produced the report.
July 2015, NCJ 248767