Embed Size (px)
Citation preview

Local Government Investment Pool
Annual ReportJUNE 30, 2018 AUDITED
2
®
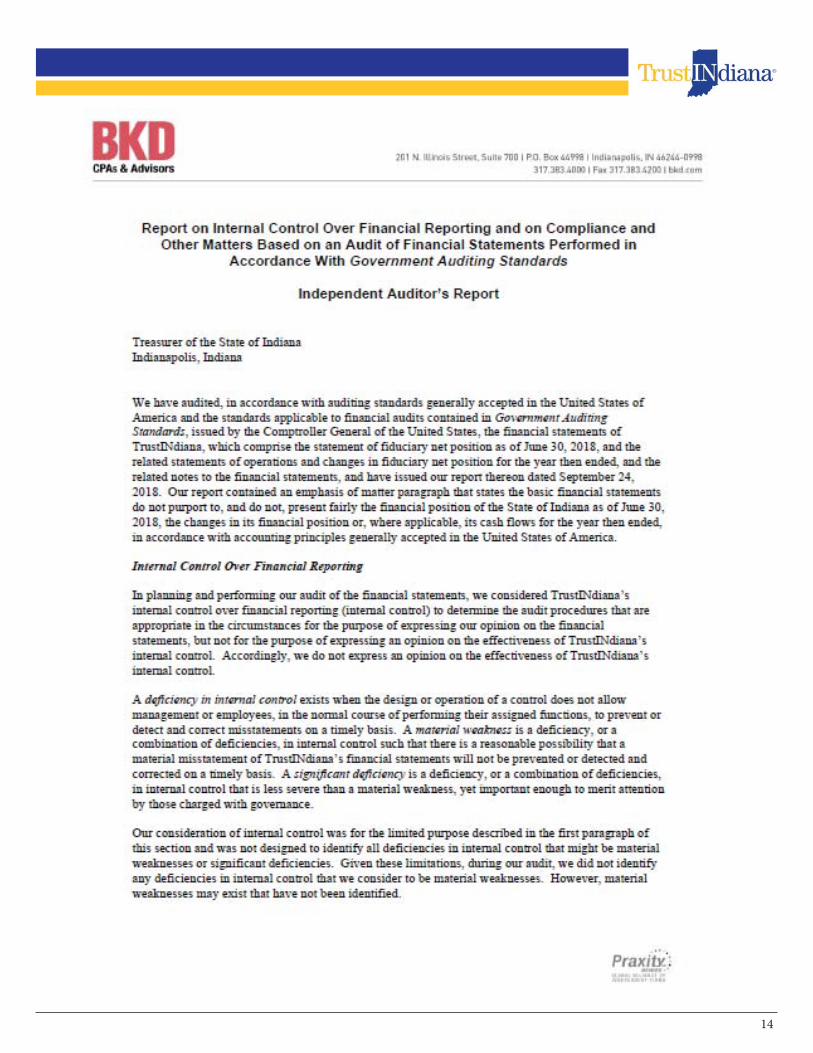
Report of Independent Auditors

3
®

4
®
Statement of Fiduciary Net Position June 30, 2018
External TrustINdiana Participants Assets
Cash, cash equivalents and investments $1,431,970,190 $1,063,892,122 Interest income receivable 157,179 116,777 Total Assets $1,432,127,369 $1,064,008,899 Liabilities Management fee payable $118,104 $87,746 Other payables 63,600 47,252 Total Liabilities 181,704 134,998 Net Position - Unrestricted 1,431,945,665 1,063,873,901 Total Liabilities and Net Position $1,432,127,369 $1,064,008,899
The accompanying notes are an integral part of the financial statements.

5
®
Statement of OperationsFor the year ended June 30, 2018
The accompanying notes are an integral part of the financial statements.
External TrustINdiana Participants Revenues: Interest income $18,406,712 $13,073,035 Net realized gain on investments 15,921 11,308 Net unrealized gain on investments 118,315 84,031 Total Revenues 18,540,948 13,168,374
Expenses: Management fee 1,226,274 870,939 Other expenses 291,472 207,013 Total Expenses 1,517,746 1,077,952 Net investment income 17,023,202 12,090,422 Increase in net position from operations $17,023,202 $12,090,422

6
®
Statement of Changes in Fiduciary Net Position
For the year ended June 30, 2018 External TrustINdiana Participants Increase/(Decrease) in net position Operations: Net investment income $16,888,966 $11,995,083 Net realized gain on investments 15,921 11,308 Net unrealized appreciation on investments 118,315 84,031 Increase in net position from operations 17,023,202 12,090,422 Distributions to participants (16,904,887) (12,006,391) Contributions 1,437,317,151 1,437,317,151 Reinvestment of distributions 16,889,693 11,923,610 Withdrawals (1,144,436,617) (1,139,729,553) Increase in net position from participants’ transactions 309,770,227 309,511,208 Total increase in net position 309,888,542 309,595,239 Net position Beginning of year 1,122,057,123 754,278,662 End of year $1,431,945,665 $1,063,873,901
The accompanying notes are an integral part of the financial statements.

7
®
Notes to Financial StatementsFor the year ended June 30, 2018
Note 1: Description of TrustINdiana
TrustlNdiana (the “Pool”) is a local government investment pool created pursuant to IC §5-13-9-11(b) within the office and custody of the Treasurer of the State of Indiana. The purpose of the Pool is to allow local units of government (e.g., counties, municipalities, school corporations, townships and other units of local government) as well as the State of Indiana to invest in a common pool of investment assets. For purposes of these financial statements, external participants are defined as all investors other than the State of Indiana. The difference between the amounts presented in total and external participants represents the investment by the State of Indiana.
The accompanying financial statements present only the activities of TrustINdiana, an investment trust fund of the State of Indiana, and are not intended to present fairly the financial position of the State of Indiana, the changes in its financial position or, where applicable, its cash flows in conformity with accounting principals generally accepted in the United States of America.
Note 2: Significant Accounting Policies Use of Estimates
The preparation of financial statements in accordance with accounting principles generally accepted in the United States of America requires management to make estimates and assumptions that affect the reported amounts of assets and liabilities and disclosure of contingent assets and liabilities at the date of the financial statements and the reported amounts of revenues, expenses and changes in net position during the period. Actual results could differ from those estimates.
Measurement Focus and Basis of Accounting and Presentation
The Pool prepares its financial statements in conformity with accounting principles generally accepted in the United States of America as applied to governmental units. The Governmental Accounting Standards Board (GASB) is the accepted standard-setting body for establishing governmental accounting and financial reporting principles. The Pool is reported as a special-purpose government and the accompanying financial statements are prepared using the economic resources measurement focus and the accrual basis of accounting.
Cash and Cash Equivalents
Cash is held in various financial institutions in depository accounts. The Pool considers all liquid investments with original maturities of three months or less to be cash equivalents. At June 30, 2018, cash equivalents consisted of money market mutual funds and commercial paper, which are reported at fair value. The Pool’s money market mutual funds do not have significant limitations or restrictions on withdrawals.
Investments and Investment Income
Securities are valued at the most recent market bid price as obtained from one or more market makers for such securities. The underlying investments of the Pool are marked-to-market on a daily basis.
Security transactions are recorded on a trade-date basis. Realized gains and losses on sales of investments are calculated on an identified cost basis. Interest income, including any amortization of premium or accretion of discount, is recorded on the accrual basis.Operating Revenues and Expenses
As a special-purpose government, the Pool distinguishes operating revenues and expenses from nonoperating items. Operating revenues and expenses generally arise from providing services in connection with the principal ongoing operations. The Pool’s principal operating revenue is investment income and its principal expenses are administrative expenses. All revenues and expenses not meeting this definition are reported as nonoperating or capital transactions.
Earnings
Net investment income is declared and allocated to participants daily. Such amounts are automatically reinvested the same business day. Net realized capital gains, if any, are allocated in a reasonable timeframe after the gain is realized.

8
®
Notes to Financial Statements continued
For the year ended June 30, 2018
Securities Lending
The Pool has entered into a securities lending agreement, as authorized by state statute and the policies of the Pool, with Bank of New York Mellon (“BNY Mellon”), its custodian. BNY Mellon may loan the Pool’s securities to brokers, dealers and financial institutions determined by them to be creditworthy and approved by the Indiana Treasurer of State. The Pool continues to receive the interest on the loaned securities during the term of the loan. The loans can be terminated on demand by either the Pool or the borrower. The loans of securities are collateralized in the form of cash in an amount at least equal to 102% of the current fair value of the loaned securities. The cash collateral is reinvested by BNY Mellon and the net income earned on the reinvestment, less the borrower’s rebate and a fee to BNY Mellon, is recorded as additional income to the Pool. There was no securities lending activity during fiscal year ended 2018.
Note 3: Deposits and Investments
As of June 30, 2018, the Pool had the following cash deposits and investments:
2018 Cash $ 765,665,017 Money market mutual funds 47,702,965 Commercial paper 618,602,208 $1,431,970,190
Deposits and investments included in the statement of net position at June 30, 2018 are as follows:
2018 Carrying value Deposits $ 765,665,017 Investments 666,305,173 $1,431,970,190
Deposits
Custodial credit risk is the risk that in the event of a bank failure, the Pool’s deposits may not be returned to it. The Pool’s deposit policy for custodial credit risk requires compliance with the provisions of state law. Additionally, the Pool is required to be comprised of no less than 50% of deposits in banks from an approved list maintained by the State of Indiana.
Any cash deposits in excess of the $250,000 Federal Deposit Insurance Corporation (FDIC) limits are fully insured by the Indiana Public Deposit Insurance Fund (Fund) along with any additional pledged collateral from the institutions securing deposits of public funds. The Fund is created under Indiana Code 5-13-12-1(a) and is maintained by the assessments payable by depositories and the receipt of all interest and other earnings of the Fund.
Investments
Indiana statutes generally authorize the Pool to invest in United States obligations and issues of federal agencies, municipal securities of Indiana issuers that have not defaulted during the previous 20 years, commercial paper, secured repurchase agreements fully collateralized by U.S. Government or U.S. Government agency securities, certificates of deposit, and open end money market mutual funds pursuant to Indiana Code §5-13.

9
®
Portfolio of Investments
Principal Fair Amount Value Money Market Mutual Funds - 3% $47,702,965 Goldman Sachs Financial Square Government Fund, FST Shares, 0.00% $47,702,965 Total Money Market Funds (cost of $47,702,965) 47,702,965
Commercial Paper - 44% 10,000,000 Chariot Funding LLC, 1.90%, maturity date 07/02/18 19,996,713 10,000,000 Crown Point Capital Co., 1.98%, maturity date 07/13/18 14,988,275 10,000,000 Kfw, 2.17%, maturity date 07/13/18 14,989,034 15,000,000 Manhattan Asset Funding Co., 2.03%, maturity date 07/16/18 14,985,692 20,000,000 NRW. Bank, 2.10%, maturity date 07/16/18 24,977,805 15,000,000 Mitsubishi UFJ Trust & Banking Corp., 2.35%, maturity date 07/30/18 19,964,522 10,000,000 Mitsubishi UFJ Trust & Banking Corp., 2.35%, maturity date 08/06/18 19,956,088 10,000,000 Credit Suisse New York, 2.43%, maturity date 08/13/18 19,947,500 19,000,000 CDP Financial Inc., 2.25%, maturity date 09/04/18 18,432,172 12,500,000 Halkin Finance LLC, 2.39%, maturity date 09/04/18 29,874,768 20,000,000 Starbird Funding Corp., 2.39%, maturity date 09/04/18 24,897,173 12,000,000 Crown Point Capital Co., 2.35%, maturity date 09/07/18 29,870,499 10,000,000 Concord Minuteman Cap Co., 2.40%, maturity date 09/10/18 24,886,953 20,000,000 United Overseas Bank Ltd. Singapore, 2.36%, maturity date 09/12/18 19,916,666 20,000,000 Liberty Street Funding LLC, 2.37%, maturity date 09/17/18 24,874,445 15,000,000 Svenska Handelsbanken AB, 2.26%, maturity date 09/17/18 25,221,274 19,650,000 JP Morgan Securities, 2.35%, maturity date 09/21/18 29,846,700 10,000,000 CDP Financial Inc., 2.26%, maturity date 09/24/18 21,891,540 15,000,000 Toyota Motor Credit Corp., 2.45%, maturity date 09/27/18 25,000,000 15,000,000 Atlantic Asset Securitization LLC, 2.55%, maturity date 10/01/18 19,879,366 19,200,000 United Overseas Bank Ltd. Singapore, 2.40%, maturity date 10/10/18 19,880,406 12,000,000 Old Line Funding LLC, 2.48%, maturity date 10/11/18 15,000,000 25,000,000 Swedbank, 2.37%, maturity date 10/19/18 19,868,088 20,000,000 Alpine Securitization LLC, 2.40%, maturity date 11/01/18 24,999,988 15,000,000 Societe Generale SA, 2.41%, maturity date 11/02/18 24,839,875 15,665,000 Anglesea Funding LLC, 2.44%, maturity date 11/19/18 10,000,000 13,000,000 United Overseas Bank Ltd. Singapore, 2.48%, maturity date 11/20/18 19,824,800 30,000,000 Anglesea Funding LLC, 2.46%, maturity date 11/26/18 20,000,000 10,000,000 Ontario Teachers’ Finance Trust, 2.48%, maturity date 12/14/1819,791,866 Total Commercial Paper (cost of $618,452,397) 618,602,208
Notes to Financial Statements continued
For the year ended June 30, 2018
10
®
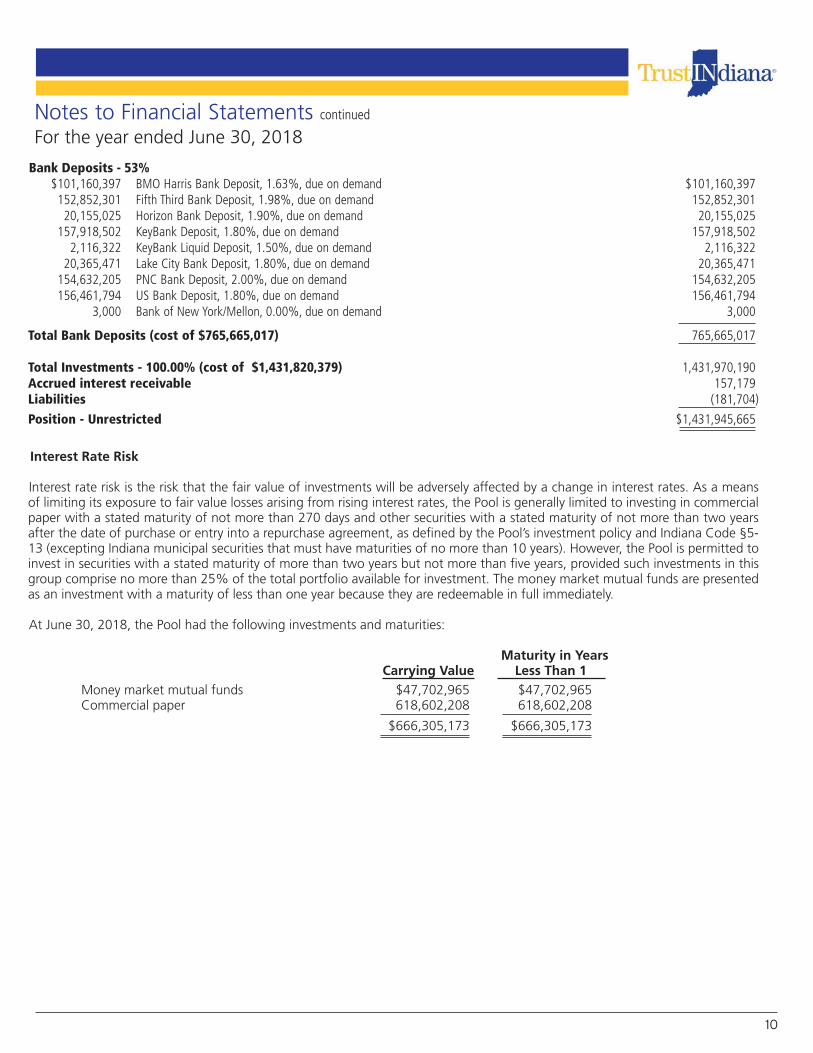
Bank Deposits - 53% $101,160,397 BMO Harris Bank Deposit, 1.63%, due on demand $101,160,397 152,852,301 Fifth Third Bank Deposit, 1.98%, due on demand 152,852,301 20,155,025 Horizon Bank Deposit, 1.90%, due on demand 20,155,025 157,918,502 KeyBank Deposit, 1.80%, due on demand 157,918,502 2,116,322 KeyBank Liquid Deposit, 1.50%, due on demand 2,116,322 20,365,471 Lake City Bank Deposit, 1.80%, due on demand 20,365,471 154,632,205 PNC Bank Deposit, 2.00%, due on demand 154,632,205 156,461,794 US Bank Deposit, 1.80%, due on demand 156,461,794 3,000 Bank of New York/Mellon, 0.00%, due on demand 3,000 Total Bank Deposits (cost of $765,665,017) 765,665,017 Total Investments - 100.00% (cost of $1,431,820,379) 1,431,970,190 Accrued interest receivable 157,179 Liabilities (181,704) Position - Unrestricted $1,431,945,665
Interest Rate Risk
Interest rate risk is the risk that the fair value of investments will be adversely affected by a change in interest rates. As a means of limiting its exposure to fair value losses arising from rising interest rates, the Pool is generally limited to investing in commercial paper with a stated maturity of not more than 270 days and other securities with a stated maturity of not more than two years after the date of purchase or entry into a repurchase agreement, as defined by the Pool’s investment policy and Indiana Code §5-13 (excepting Indiana municipal securities that must have maturities of no more than 10 years). However, the Pool is permitted to invest in securities with a stated maturity of more than two years but not more than five years, provided such investments in this group comprise no more than 25% of the total portfolio available for investment. The money market mutual funds are presented as an investment with a maturity of less than one year because they are redeemable in full immediately.
At June 30, 2018, the Pool had the following investments and maturities:
Maturity in Years Carrying Value Less Than 1 Money market mutual funds $47,702,965 $47,702,965 Commercial paper 618,602,208 618,602,208 $666,305,173 $666,305,173
Notes to Financial Statements continued
For the year ended June 30, 2018

11
®
Credit Risk
Credit risk is the risk that the issuer or other counterparty to an investment will not fulfill its obligations. The Pool’s investment policy for credit risk requires compliance with the provisions of Indiana statutes. Indiana Code Section 5-13-9-2.5 requires that the Pool’s investments in money market mutual funds be rated AAAm by Standard and Poor’s or Aaa by Moody’s Investor’s Service. Indiana Code also requires the Pool limit its investments in commercial paper to those rated in the highest category by one of the nationally recognized rating services.
At June 30, 2018, the Pool’s investments were rated by Moody’s Investors Service and Standard & Poor’s as follows:
Moody’s Investors Service Short-Term Long-Term Ratings Rating Carrying Value Aaa Aa P-1
Money market mutual funds $47,702,965 $47,702,965 $ - $ - Commercial paper 618,602,208 - - 618,602,208 $666,305,173 $47,702,965 $ - $618,602,208
Standard & Poor’s Short-Term Long-Term Ratings Rating Carrying Value AAAm AA A-1
Money market mutual funds $47,702,965 $47,702,965 $ - $ - Commercial paper 618,602,208 - - 618,602,208 $666,305,173 $47,702,965 $ - $618,602,208 Custodial Credit Risk
Custodial credit risk is the risk that, in the event of the failure of the counterparty, the Pool will not be able to recover the value of its investments or collateral securities that are in the possession of the counterparty. At June 30, 2018, the Pool’s investments were not exposed to custodial credit risk. The Pool’s investments in U.S. Government Agency and Treasury securities and commercial paper are held by the pledging financial institution’s trust department or agent in the Pool’s name. The Pool’s investments in money market mutual funds is not subject to custodial credit risk as their existence is not evidenced by securities that exist in physical or book entry form. Concentration of Credit Risk
Concentration of credit risk is the risk of loss attributed to the magnitude of a government’s investment in a single issuer. The Pool limits its investments in any one issuer of commercial paper to a maximum of 5% of assets per commercial paper issuer and 10% of assets per ultimate commercial paper issuer. At June 30, 2018, there were no commercial paper investments in any one issuer, not exempt from disclosure that represents 5% or more of the total investments. As shown in note 3, the Pools Money Market Fund is invested in one fund. This fund represents less than 5% of total investments.
Foreign Currency Risk
Foreign currency risk relates to adverse effects on the fair value of an investment from changes in exchange rates. The Pool’s investment policy prohibits investments in foreign investments.
Notes to Financial Statements continued
For the year ended June 30, 2018
12
®
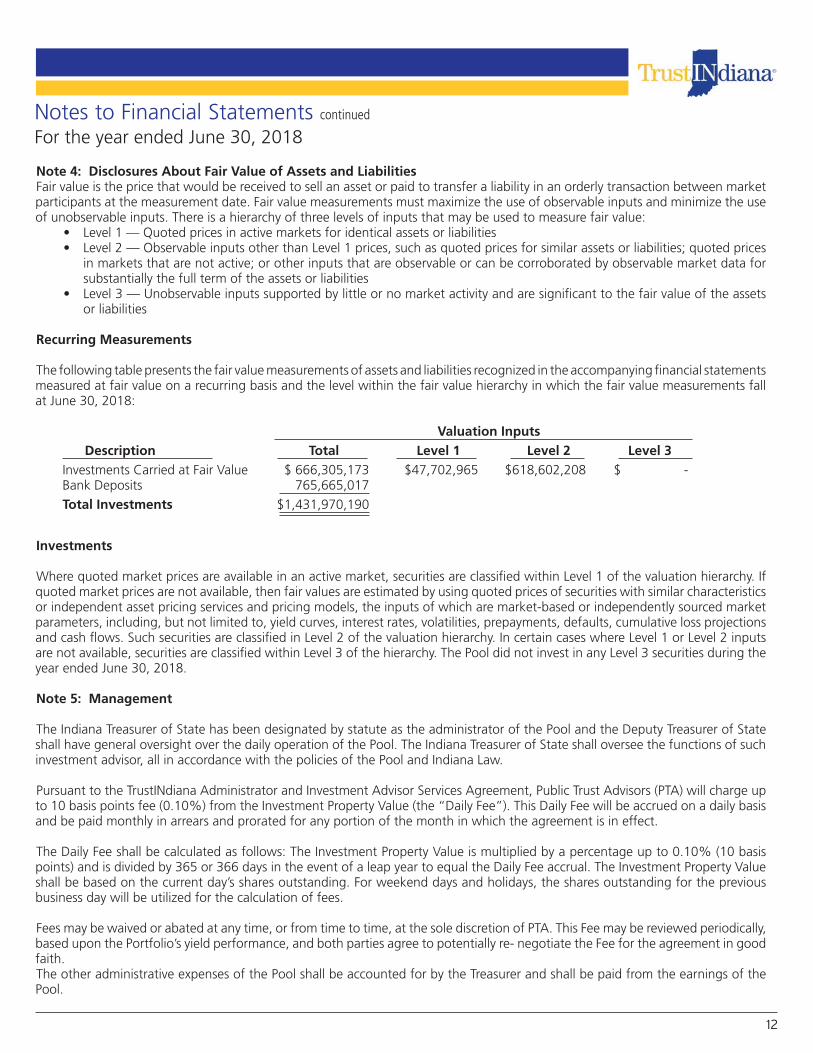
Note 4: Disclosures About Fair Value of Assets and LiabilitiesFair value is the price that would be received to sell an asset or paid to transfer a liability in an orderly transaction between market participants at the measurement date. Fair value measurements must maximize the use of observable inputs and minimize the use of unobservable inputs. There is a hierarchy of three levels of inputs that may be used to measure fair value:
• Level 1 — Quoted prices in active markets for identical assets or liabilities• Level 2 — Observable inputs other than Level 1 prices, such as quoted prices for similar assets or liabilities; quoted prices
in markets that are not active; or other inputs that are observable or can be corroborated by observable market data for substantially the full term of the assets or liabilities
• Level 3 — Unobservable inputs supported by little or no market activity and are significant to the fair value of the assets or liabilities
Recurring Measurements
The following table presents the fair value measurements of assets and liabilities recognized in the accompanying financial statements measured at fair value on a recurring basis and the level within the fair value hierarchy in which the fair value measurements fall at June 30, 2018:
Valuation Inputs Description Total Level 1 Level 2 Level 3 Investments Carried at Fair Value $ 666,305,173 $47,702,965 $618,602,208 $ - Bank Deposits 765,665,017 Total Investments $1,431,970,190
Investments
Where quoted market prices are available in an active market, securities are classified within Level 1 of the valuation hierarchy. If quoted market prices are not available, then fair values are estimated by using quoted prices of securities with similar characteristics or independent asset pricing services and pricing models, the inputs of which are market-based or independently sourced market parameters, including, but not limited to, yield curves, interest rates, volatilities, prepayments, defaults, cumulative loss projections and cash flows. Such securities are classified in Level 2 of the valuation hierarchy. In certain cases where Level 1 or Level 2 inputs are not available, securities are classified within Level 3 of the hierarchy. The Pool did not invest in any Level 3 securities during the year ended June 30, 2018.
Note 5: Management
The Indiana Treasurer of State has been designated by statute as the administrator of the Pool and the Deputy Treasurer of State shall have general oversight over the daily operation of the Pool. The Indiana Treasurer of State shall oversee the functions of such investment advisor, all in accordance with the policies of the Pool and Indiana Law.
Pursuant to the TrustINdiana Administrator and Investment Advisor Services Agreement, Public Trust Advisors (PTA) will charge up to 10 basis points fee (0.10%) from the Investment Property Value (the “Daily Fee”). This Daily Fee will be accrued on a daily basis and be paid monthly in arrears and prorated for any portion of the month in which the agreement is in effect.
The Daily Fee shall be calculated as follows: The Investment Property Value is multiplied by a percentage up to 0.10% (10 basis points) and is divided by 365 or 366 days in the event of a leap year to equal the Daily Fee accrual. The Investment Property Value shall be based on the current day’s shares outstanding. For weekend days and holidays, the shares outstanding for the previous business day will be utilized for the calculation of fees.
Fees may be waived or abated at any time, or from time to time, at the sole discretion of PTA. This Fee may be reviewed periodically, based upon the Portfolio’s yield performance, and both parties agree to potentially re- negotiate the Fee for the agreement in good faith.The other administrative expenses of the Pool shall be accounted for by the Treasurer and shall be paid from the earnings of the Pool.
Notes to Financial Statements continued
For the year ended June 30, 2018
13
®
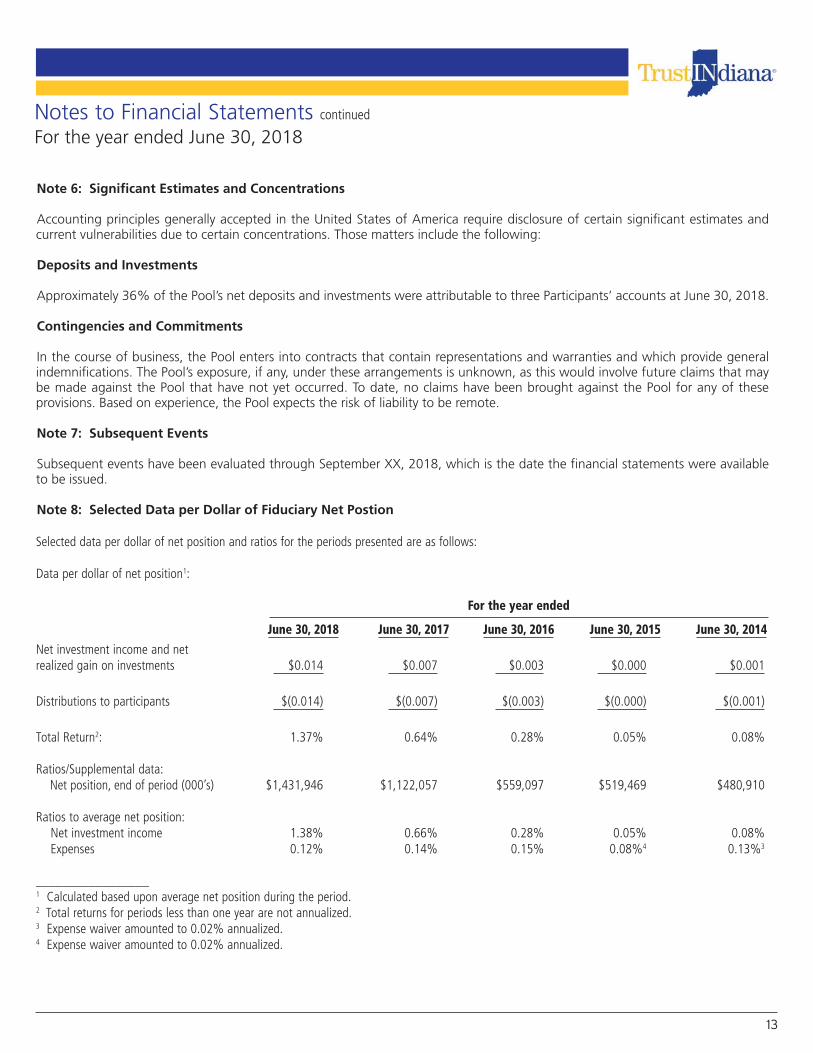
Note 6: Significant Estimates and Concentrations
Accounting principles generally accepted in the United States of America require disclosure of certain significant estimates and current vulnerabilities due to certain concentrations. Those matters include the following:
Deposits and Investments
Approximately 36% of the Pool’s net deposits and investments were attributable to three Participants’ accounts at June 30, 2018.
Contingencies and Commitments
In the course of business, the Pool enters into contracts that contain representations and warranties and which provide general indemnifications. The Pool’s exposure, if any, under these arrangements is unknown, as this would involve future claims that may be made against the Pool that have not yet occurred. To date, no claims have been brought against the Pool for any of these provisions. Based on experience, the Pool expects the risk of liability to be remote.
Note 7: Subsequent Events
Subsequent events have been evaluated through September XX, 2018, which is the date the financial statements were available to be issued.
Note 8: Selected Data per Dollar of Fiduciary Net Postion
Selected data per dollar of net position and ratios for the periods presented are as follows:
Data per dollar of net position1:
For the year ended
June 30, 2018 June 30, 2017 June 30, 2016 June 30, 2015 June 30, 2014 Net investment income and net realized gain on investments $0.014 $0.007 $0.003 $0.000 $0.001
Distributions to participants $(0.014) $(0.007) $(0.003) $(0.000) $(0.001)
Total Return2: 1.37% 0.64% 0.28% 0.05% 0.08%
Ratios/Supplemental data: Net position, end of period (000’s) $1,431,946 $1,122,057 $559,097 $519,469 $480,910
Ratios to average net position: Net investment income 1.38% 0.66% 0.28% 0.05% 0.08%
Expenses 0.12% 0.14% 0.15% 0.08%4 0.13%3
_________________1 Calculated based upon average net position during the period. 2 Total returns for periods less than one year are not annualized. 3 Expense waiver amounted to 0.02% annualized.4 Expense waiver amounted to 0.02% annualized.
Notes to Financial Statements continued
For the year ended June 30, 2018
®

®

16
®
Office of the IndianaTreasurer of State
Kelly MitchellIndiana Treasurer of State
Michael FrickDeputy Treasurer
Cindy BargerDirectorTrustINdiana
Management
AdministratorIndiana Treasurer of State and Public Trust Advisors, LLC
Investment AdvisorPublic Trust Advisors, LLC
CustodianBank of New York/Mellon
Professional ServicesIndependent AuditorsBKD, LLP
TrustINdianaOffice of the Treasurer of Indiana
200 W Washington St., 242 State House
Indianapolis, IN 46204
www.trustindiana.in.gov